

Abstract
To study reorganization of the actin system in cells that invert their polarity, we stimulated Dictyostelium cells by mechanical forces from alternating directions. The cells oriented in a fluid flow by establishing a protruding front directed against the flow and a retracting tail. Labels for polymerized actin and filamentous myosin-II marked front and tail. At 2.1 Pa, actin first disassembled at the previous front before it began to polymerize at the newly induced front. In contrast, myosin-II slowly disappeared from the previous tail and continuously redistributed to the new tail. Front specification was myosin-II independent and accumulation of polymerized actin was even more focused in mutants lacking myosin-II heavy chains. We conclude that under mechanical stimulation, the inversion of cell polarity is initiated by a global internal signal that turns down actin polymerization in the entire cell. It is thought to be elicited at the most strongly stimulated site of the cell, the incipient front region, and to be counterbalanced by a slowly generated, short-range signal that locally activates actin polymerization at the front. Similar pattern of front and tail interconversion were observed in cells reorienting in strong gradients of the chemoattractant cyclic AMP.
Introduction
The orientation of cells in fields of external stimuli plays a key role in metazoan morphogenesis (1–3). Both chemical and mechanical stimuli have to be transduced to the cytoskeleton in order for a cell to respond by directional movement. Reorganization of the actin-myosin system in response to shear stress or chemoattractant is the subject of this study. The question is how a tail is reprogrammed into a front, and vice-versa, when a cell reverts its polarity in response to signals from its environment.
Dictyostelium discoideum proved to be a powerful model system to study cell motility and chemotaxis (4–8). More recently, also mechanical shear forces have been shown to direct the motility of Dictyostelium cells (9,10). The strong orientation of cells in a liquid flow provides a clear geometrical framework for the analysis of front to tail conversion. Moreover, the well-defined direction and magnitude of the mechanical inputs facilitate statistical analysis of the responses in a population of cells. Inverting the flow direction is more accurate than inverting a gradient of chemoattractant by moving a pipette to the rear of a cell and was used here to study the repolarization of cells in response to external signals.
One question addressed in this study is the role of myosin-II (myo-II) in mechanotransduction. Myo-II is the only myosin in Dictyostelium that forms bipolar filaments, and knockout of the single heavy-chain gene eliminates myo-II function (11–13). This myosin interacts with actin to generate contractile forces (14–16). It is required for cells to move against mechanical constraints (16,17) and to resist osmotic stress (18). Quantitative evaluation of the response to shear forces indicated that the actin dynamics is independent of myo-II and that myo-II is not necessary to respond to mechanical flow forces.
For the exact timing of stimulus-response relationships we designed a new hydrodynamic chamber that enabled us to change the direction of flow within a second and to record reorganization of the cytoskeleton at high magnification. We employed this device to study the spatial and temporal relationship of actin polymerization, myo-II recruitment, and tail retraction during the response of Dictyostelium cells to shear forces. Under the conditions used, cells consistently oriented against flow forces and rapidly inverted their polarity after reversal of the flow. To quantify reorganization of the cytoskeleton in response to hydrodynamic forces, we differentially labeled front and tail of the cells by fluorescent proteins. Actin filaments form a highly dynamic network throughout the cell cortex (19). At protruding fronts, Arp2/3-enriched dendritic structures are inserted into this network (20). We used these dense accumulations of polymerized actin to monitor the formation and the position of a front. Filamentous myo-II accumulates at the rear edge of chemotaxing cells (21), directing retraction of the tail (22,23). This myosin served as a marker for the tail of a cell.
Materials and methods
Cell culture and strains
Dictyostelium discoideum strain JH10 and the myo-II heavy-chain null mutant HS1 derived from JH10 (24) were kindly provided by Hans Warrick, Stanford University. Transformants of these strains were cultivated in petri dishes at 22 ± 1°C in nutrient medium (HL5, 14.30 g bacteriological peptone (Oxoid, Hampshire, UK), 7.15 g yeast extract (Oxoid), 0.616 g Na2HPO4,2H2O, 0.486 g KH2PO4, 18 g maltose in 1 liter of bidistilled water, adjusted to pH 6.7). Thymidine auxotroph JH10 cells were grown in the presence of 100 μg/ml of thymidine. JH10 or HS1 cells expressing LimEΔcoil-green fluorescent protein (GFP) (20,25) or GFP-myo-II (pBigGFPmyo; (21)) were cultivated in medium supplemented with 20 or 10 μg/ml of G418 (Sigma, St. Louis, MO), respectively. HS1 cells expressing both GFP-myo-II and mRFPmars (26) fused to the N-terminus of LimEΔ were cultivated in nutrient medium supplemented with 10 μg/mL each of G418 and blasticidin. Cells were harvested before confluency, pelleted by centrifugation (5 min at 700 × g), and washed twice in 17 mM Soerensen phosphate buffer, pH 6.0 (PB).
Stimulation in flow chamber
To visualize the fluorescence distribution in live cells at high magnification, a new lateral-flow chamber was designed on the basis of a previously described one (9). Glass plates were replaced by 25 × 60 mm coverslips, thickness 0.13–0.16 mm). The coverslips were pretreated for 10 min with 15 M NaOH and thoroughly rinsed with ultrapure (E-pure, Barnstead, Dubuque, IA) water before use. Washed cells were immediately transferred to the flow chamber through a tubing connector and allowed to settle for 2 min. Since coverslips are flexible, the height of the chamber was measured in the presence of flow. For the flow rates of 5–11 ml/min, the height varied between 229 and 167 μm. The width of the chamber was 19 mm. The flow was driven by gravity and recordings were performed for about 1 h. Two three-way valves allowed rapid changes in flow direction. Shear stress σ expressed in Pascal was calculated from geometrical and hydrodynamic parameters as
where D is the flow rate, η the dynamic viscosity of the fluid, l the width, and e the height of the flow chamber.
Chemotaxis assay
To make the cells responsive to cAMP, they were starved in PB under shaking for 2 h, and subsequently pulsed every 6 min with 10−7 M cAMP (final concentration) for 4–6 h to achieve full aggregation-competence. For chemotactic stimulation, cells were transferred onto a coverslip pretreated as for flow-chamber experiments, and stimulated from a distance of ∼20 μm through a micropipette (Eppendorf Femtotips, 5242 952.008; Westbury, NY) filled with 10−4 M cAMP. The micropipette was moved using a micromanipulator (Eppendorf S171).
Confocal fluorescence microscopy
A Zeiss LSM 410 microscope (Jena, Germany) equipped with a 100×/1.3 NA Plan Neofluar phase contrast objective was used to collect simultaneously phase-contrast and confocal fluorescence images. To record LimEΔ-GFP or GFP-myo-II fluorescence, the 488-nm laser line of an argon-ion laser was used for excitation, with a long-pass 520-nm filter for emission. For the simultaneous recording of GFP and mRFP, the 488-nm line was used together with the 543-nm line of a He-Ne laser; emission was split by a dichroic and filtered with a 510–525 nm filter for GFP and a 590–610 nm filter for mRFP. Images were recorded every 3 s, and light intensities kept as low as possible to prevent damage of the cells. All experiments were performed at 22 ± 1°C.
Image analysis and quantification of fluorescence distribution in the cell cortex
Images were automatically analyzed with software based on active contour methods (27). The cell contour is represented as a chain of 100 connected nodes. This outer chain is shrunk for a certain distance, resulting in an inner chain that roughly coincides with the border between cortex and cell body. Cortical fluorescence intensities were sampled by connecting corresponding nodes on the outer and inner chain (Fig. 1). The maximal intensity along each connecting line is taken as the local intensity in the cell cortex. To account for different protein expression levels and photobleaching, cortical fluorescence intensities were normalized in each cell by computing the ratios between the local intensity in the cortex and the average intensity in the cell body bounded by the inner chain. In the case of GFP-myo-II, large vesicles void of the label and cytoplasmic clusters were omitted in calculating the mean cell body intensity.
Figure 1.

Contour analysis used to determine the distribution of a protein in the cortex relative to the interior of a cell. Here the distribution of fluorescence intensities of LimEΔ-GFP in a confocal section is used as an example. The cell contour is drawn in dashed and solid lines for the left and right half of the cell, respectively. Numbers indicate node positions along the cell outline. The inner solid white line encircles the cell interior.
To measure the relocalization of fluorescent proteins, the extreme right node was assigned number 0 and each cell was virtually divided into two halves: one-half from node 25 to 74 and the other from node 75 to 99 plus node 0–24 (Fig. 1). When a flow was applied, the mean fluorescence ratios were calculated separately for the half exposed to flow (upstream) and for the opposite half (downstream).
Polar plots were used to represent the spatial information as well as the temporal dynamics of fluorescence intensities in the cell cortex. For each time point of a series, normalized fluorescence intensities measured along the cell contour were mapped onto a circle. All consecutive distributions were arranged like tree rings, such that time ran along the radius from the inside to the outside of a disk. For statistical analyses, polar plots of individual cells were averaged.
To quantify tail retraction, an axis was first drawn connecting two points located at the extreme edge of the cell at the beginning and end of the retraction movement. Then, at each frame, the position of the rear edge was projected on this axis.
Results
Dynamics of the cell front in response to fluid flow
To monitor the reorganization of the actin cytoskeleton in response to shear forces, we used Dictyostelium cells that express a label for filamentous actin structures, LimEΔ-GFP (25,28). This GFP-tagged, C-terminally truncated construct of the Dictyostelium LimE protein has been introduced to visualize actin networks in the cortex of Dictyostelium cells against a minimal cytoplasmic background (19,20). For the comparison of wild-type and myo-II-null cells, we have employed the strains JH10 (“wild-type”) and HS1 (“myo-II-null”), a mutant derived from JH10 by the elimination of myo-II heavy chains (24,29).
The distribution of fluorescent proteins in the cortex of Dictyostelium cells was recorded by confocal microscopy and quantitatively analyzed using an active contour detection program (27). Fluorescence intensities measured at 100 equidistant positions along the cell cortex were divided by the average intensity in the interior of each cell. To relate these normalized fluorescence intensities to the flow direction, we divided the image of a cell into a left and right half, and integrated the values in each half separately (Fig. 1). A more detailed analysis of spatiotemporal protein patterns in the cell cortex using polar plots will be presented at the end of the Results section.
The response of a wild-type cell to a shear stress of 2.1 Pa is illustrated in Fig. 2 A (see also Supplementary movie 1). Before stimulation, competing pseudopodia protruded from multiple sites at the cell surface, and the cell moved into random directions (left panel). After the onset of flow, LimEΔ-GFP localized to a protruding front directed against the flow (middle panel). When the flow was stopped, actin polymerized again at sites pointing into varying directions, and the cell lost its orientation (right panel). In quantitative terms the flow-induced changes in this particular cell are shown in Fig. 2 B. Before the application of flow, recruitment of LimEΔ-GFP to the two halves of the cell alternated, in accord with cell movement into random directions. During the flow, actin became consistently more enriched at the left side pointing toward the flow than at the opposite side. It took >2 min after cessation of the flow until fluorescence intensities began to alternate as in the unstimulated cell.
Figure 2.
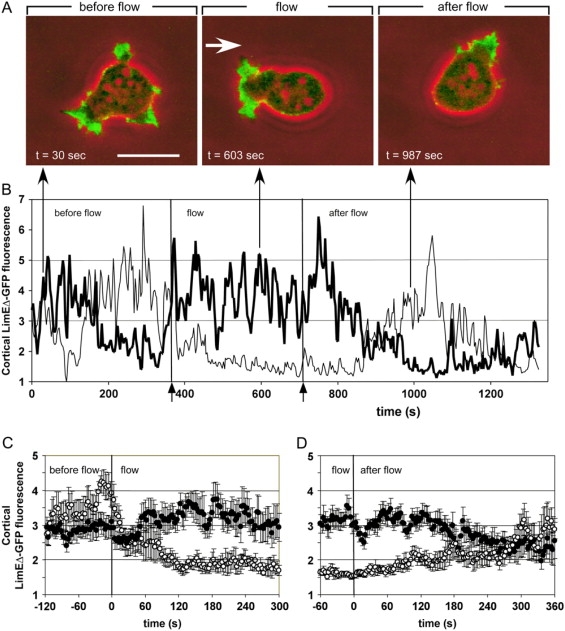
Reversible cell polarization under shear stress. (A) In a cell of the JH10 (“wild-type”) strain of D. discoideum, filamentous actin is visualized by the expression of LimEΔ-GFP (green fluorescence superimposed on phase-contrast images in red). In response to a hydrodynamic flow stress of σ = 2.1 Pa the cell becomes polarized, pointing an actin-enriched front against the direction of the flow (indicated by an arrow). The same cell is shown in Supplementary movie 1. Bar, 10 μm. (B) Cortical fluorescence intensities are quantified and plotted separately for the left (bold line) and right (faint line) halves of the cell shown in panel A. (For image analysis see Materials and Methods). In the absence of flow, fluorescence intensities fluctuate in both halves, owing to fronts protruded by the cell in arbitrary directions. Systematically higher values in the left than in the right half indicate polarization of the cell against the flow. After cessation of the flow, the cell slowly reverts from directional to random movement. Arrows on the bottom confine the period of flow application from 375 to 705 s. Arrows on top specify the time points at which the three frames of panel A have been taken. (C and D) Averages of cortical fluorescence intensities in cells exposed to the onset (C) or cessation (D) of flow. Solid circles correspond to upstream halves and open circles to downstream halves of the cells. For panel C, 11 polarization experiments on eight cells are averaged, for panel D, 13 depolarization experiments on nine cells. Error bars indicate mean ± SE.
Averages of experiments in which the flow was turned on (n = 11 cells) or off (n = 13 cells) confirmed the flow-induced changes in LimEΔ-GFP distribution: The average fluorescence intensity increased within 90 s in the cell cortex exposed to flow and decreased on the opposite side (Fig. 2 C). After cessation of the flow, polarization of the cells toward the previous flow persisted for 3 min before fluorescence intensities in the two halves of the cells equilibrated (Fig. 2 D). Plots similar to those shown in Fig. 2, C and D, will be used further on to quantitatively analyze the responses of cells to changes in flow direction.
Reversal of polarity in response to changing flow directions
To monitor the dynamics of actin reorganization after an abrupt change in flow direction, a standard flow of 2.1 Pa was reversed within 1 s. As judged by the LimEΔ-GFP label, cells responded by disassembling actin at the previous front and assembling actin at the side newly exposed to flow (Fig. 3 A and Supplementary movie 2). The labeled actin rapidly disappeared from the previous front within the first 60 s after flow reversal. New actin-rich protrusions began to be formed at 30 s, until at 90 s a new front was fully established at the side facing the new flow direction. Because actin assembly lagged behind disassembly there was a minimum of the cortex-associated actin label between 30 and 50 s after flow reversal (Fig. 3 B).
Figure 3.
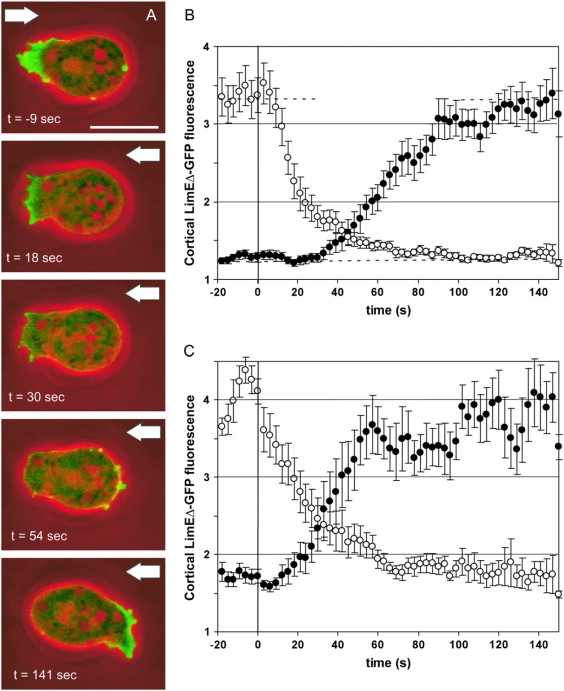
Actin relocalization after flow reversal. The responses of cells exposed to a rapid reversal in flow direction are monitored. High hydrodynamic shear stress of σ = 2.1 Pa (A and B) or moderate shear stress of σ = 0.9 Pa (C) has been applied. As in Fig. 2, filamentous actin is visualized in wild-type cells expressing LimEΔ-GFP. (A) Sequence of images showing the change in LimEΔ-GFP localization during the response of a cell. (Green) LimEΔ-GFP fluorescence; (red) phase contrast. Arrows point to the actual flow direction. The same cell is shown in Supplementary movie 2. Bar, 10 μm. (B and C) Quantification of the responses to high and moderate shear stress. Solid circles indicate mean intensities of cortical fluorescence in halves of the cells that are upstream after flow reversal, and open circles in those that are downstream. Zero time is the time of flow reversal. Dashed horizontal lines in panel B indicate the fluorescence at steady state in each half of the cells. For panel B, 18 responses of 14 cells are averaged; for panel C, 10 responses of five cells. Error bars indicate mean ± SE.
To determine the dependence of cell repolarization on the magnitude of shear stress, flow-reversal experiments were performed at 0.9 Pa. Under this lower shear stress, localization of LimEΔ-GFP to the cell cortex was higher in both halves of the cells. After reversal of the flow, the time course of actin disassembly was unchanged (Fig. 3 C). However, assembly at the new upstream front occurred 10–15 s earlier and was slightly faster. Consequently, decay of the old front and establishment of a new one were less sharply separated in time. At an even lower shear stress of 0.5 Pa, cells tended to reorient by U-turns without losing their original polarity, until the site of highest fluorescence faced the flow (Supplementary movie 3).
In the following experiments, we applied again the standard shear stress of 2.1 Pa.
Flow response of cells lacking myo-II
The conventional, double-headed myo-II confers on Dictyostelium cells the potency of counteracting mechanical deformation (17). Therefore, we asked whether the actin cross-linking or motor activities of this filament-forming myosin are essential for the mechanosensing and repolarization of cells in response to flow reversal. When subjected to flow, myo-II-null cells assumed a pear-like shape, in accord with reduced rigidity of their cortex and lack of efficient retraction (Fig. 4 A and Supplementary movie 4).
Figure 4.
The absence of myo-II does not impair actin relocalization after flow reversal. Experiments as shown in Fig. 3, A and B, are repeated with myo-II-null cells of strain HS1 that express LimEΔ-GFP. Time is expressed in seconds relative to the reversal of a hydrodynamic shear stress of σ = 2.1 Pa. (A) Sequence of images showing the distribution of LimEΔ-GFP in a myo-II-null cell before and after flow reversal (see also Supplementary movie 4). (Green) LimEΔ-GFP fluorescence; (red) phase contrast. Arrows indicate the flow direction. Bar, 10 μm. (B) Quantification of the responses relative to the time of flow reversal. Solid circles correspond to cortical fluorescence intensities in the upstream halves and open circles in the downstream halves of the cells. Dashed lines indicate cortical intensities at steady state in the two halves of the cells. For comparison, the distribution of LimEΔ-GFP in the cortex of parental JH10 cells is shown for the upstream or downstream halves of the cells as a faint or bold line, according to data presented in Fig. 3 B. Twenty-two responses recorded from 14 cells are averaged.
Despite the apparent alteration in the mechanical strength of the actin cortex in myo-II-null cells, reorientation of these cells in response to a reversal of shear forces appeared to be unimpaired (Fig. 4 B). When the mutant cells were subjected to a change in flow direction, LimEΔ-GFP rapidly disassembled from the previous front and less rapidly reassembled at the new front. Since the time course of these responses coincided with that of wild-type cells, we conclude that myo-II is not required in mechanical signal transduction.
Redistribution of myo-II relates tail to front specification
The response of cells to shear stress using a marker of the cell front was complemented by studying the establishment of a tail, the region where myo-II accumulates and contributes to tail retraction (21). In these experiments, GFP-tagged myo-II heavy chains (herein referred to as GFP-myo-II) were used, which can rescue myo-II function in heavy-chain null cells (21). Cells expressed the GFP-tagged heavy chains either in addition to the endogenous heavy chains or in a heavy-chain-null background. The redistribution of GFP-myo-II in response to shear forces in these two cell types were indistinguishable and the data obtained from both strains were pooled.
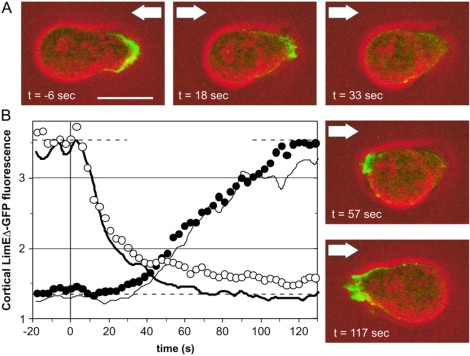
Fig. 5 A presents stages of myo-II redistribution upon reversal of the flow direction (see also Supplementary movie 5). The GFP-myo-II accumulated at the rear of the cells (−9 s) and after flow reversal the fluorescence at the previous tail slowly decreased whereas the fluorescence at the new tail increased. One difference compared to the actin redistribution in response to flow reversal was that myo-II redistribution to the new tail started almost immediately. Another difference was the gliding relocalization of myo-II from the former to the new tail of the cell (36–54 s). In quantitative terms, this characteristic way of relocalization was reflected in the symmetry of the two curves shown in Fig. 5 B, one representing the loss of GFP-myo-II in the previous, the other the gain in the new tail region of reorientating cells. One minute after the flow reversal, the two curves met at about half-maximal fluorescence intensity. The conclusion is that the total amount of myo-II associated with the cell cortex stayed constant during this net shift from one side to the other.
Figure 5.
Relocalization of GFP-myo-II after flow reversal. GFP-myo-II expressing cells are monitored during reversal of a hydrodynamic shear stress of σ = 2.1 Pa. Time is expressed in seconds relative to flow reversal. (A) Sequence of images showing GFP-myo-II relocalization in a HS1 cell (see also Supplementary movie 5). (Green) GFP-myo-II fluorescence; (red) phase contrast. Arrows point into the flow direction. (B) Quantification of GFP-myo-II relocalization in the cell cortex. Solid circles correspond to the upstream halves of the cells and open circles to the downstream halves. Data are pooled from JH10 wild-type and HS1 myo-II-null cells, both expressing GFP-myo-II. Twenty responses recorded from 14 cells are averaged. Error bars indicate mean ± SE.
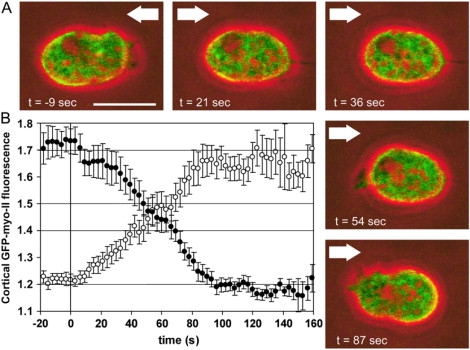
The differences in reprogramming of the front and tail became obvious when actin and myo-II markers were expressed simultaneously in the same cells subjected to flow reversals. Fig. 6 A and Supplementary movie 6 show a cell double-labeled with mRFP-LimEΔ and GFP-myo-II. The fast actin disassembly and slower reassembly in Fig. 6 B contrasted to the symmetry in the corresponding curves of the myo-II dynamics (Fig. 6 C).
Figure 6.

Actin and myo-II relocalization after flow reversal. To monitor the relocalization of myo-II and actin simultaneously in the same cell, the endogenous myo-II heavy chains were replaced by GFP-tagged heavy chains, and mRFP-LimEΔ was expressed as an actin label. The cells were exposed to a rapid change in the direction of a hydrodynamic shear stress of σ = 2.1 Pa. Time is expressed in seconds before and after flow reversal. (A) Sequence of images showing the distribution of GFP-myo-II and mRFP-LimEΔ (see also the same cell in Supplementary movie 6). (Green) GFP-myo-II; (red) mRFP-LimEΔ; (blue) phase contrast. Arrows point into the flow direction. The white dotted line indicates the position where the previous front is turned into a tail. Bar, 10 μm. (B and C) Quantification of mRFP-LimEΔ localization (B) and GFP-myo-II redistribution (C) relative to the time of flow reversal. Solid symbols correspond to the upstream halves of the cells and open symbols to the downstream halves. The continuous line in panel C shows the mean position of the downstream edge as a function of time. Thirteen responses recorded from 10 cells are averaged. Error bars indicate mean ± SE.
In Fig. 6 C, translocation of the tail end during repolarization of the cells is shown as a bold line. The negative slope at the beginning results from retained protrusive activity and/or passive drift in direction of the flow. After ∼50 s, the slope became positive, indicating the onset of retraction against the new flow direction. At this time point, the balance of myo-II in the two halves of the cells was reached, which means that retraction became detectable when the amount of myo-II in the cortex of the new tail region exceeded the amount in the opposite half of the cells. Tail retraction commenced ∼15 s after the first protrusions were formed, and thus turned out to be the last event in the reorientation of a cell.
Reversal of polarity in response to inverting chemical gradients
The front-tail polarity of cells responding to shear stress resembles the actin-myo-II pattern observed in chemotaxing cells. This similarity prompted us to compare the sequence of events in polarity reversal during chemotaxis with that under shear stress. A pipette filled with 100 μM cAMP was rapidly moved from the front to the tail of an aggregation-competent cell double-labeled with mRFP-LimEΔ and GFP-myo-II (Fig. 7; Supplementary movie 7). Under these conditions, cells often reorient by reverting their polarity rather than by performing U-turns (30). As observed under shear stress, the mRFP-LimEΔ fluorescence rapidly decreased (Fig. 7 A, 3-s frame), and only subsequently increased at the new leading edge where protrusions became visible (24 s). GFP-myo-II fluorescence decreased at the new front during the first 40 s and accumulated at the tail between 15 and 60 s. At 36 s, the GFP-myo-II was present throughout the cortex, and efficient retraction started at ∼45 s.
Figure 7.
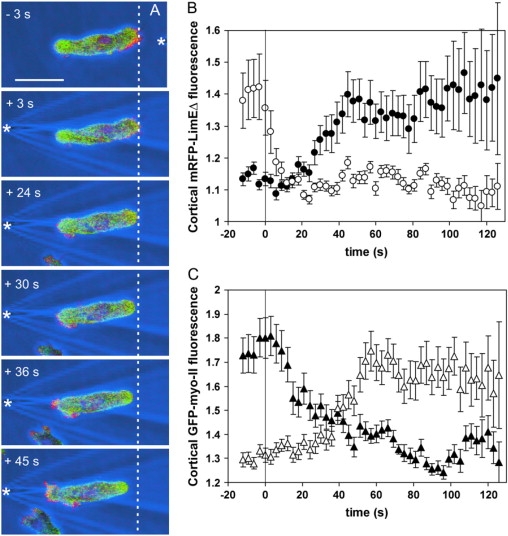
Actin and myo-II relocalization after reversal of a gradient of chemoattractant. To relate reversal of cell polarity in response to chemoattractant to the reversal caused by shear stress, double-labeled cells as in Fig. 6 were stimulated with a micropipette filled with cAMP. The pipette was rapidly moved from the front to the back of a cell. Time in seconds is indicated relative to repositioning of the pipette. (A) Sequence of images showing the distributions of mRFP-LimEΔ and GFP-myo-II in a responding cell. (Green) GFP-myo-II; (red) mRFP-LimEΔ; (blue) phase contrast. White asterisks indicate tip positions of the micropipette filled with cAMP. The white dotted line indicates the rightmost position of the later cell rear. The same cell is shown in Supplementary movie 7. Bar, 10 μm. (B and C) Quantification of mRFP-LimEΔ localization (B) and GFP-myo-II redistribution (C). Solid symbols correspond to the upstream halves of the cells and open symbols to the downstream halves. Nineteen responses recorded from 14 cells are averaged. Error bars indicate mean ± SE.
The dynamics of relocalization in response to chemoattractant was quantified as it was for the responses to shear stress (Fig. 7, B and C). In cells repolarizing in an inverted gradient of cAMP, the disassembly of actin at the previous front preceded its assembly at the new front. The curves for myo-II disassembly and reassembly mirrored each other. Relocalization of both the mRFP-LimEΔ and GFP-myo-II labels was faster than observed under shear stress. In particular, the actin label rapidly decreased within 12 s. Despite these differences in timing, the sequence of events leading to polarity reversal in gradients of chemoattractant was similar to that observed under shear stress.
Detailed spatiotemporal analysis of reversals in cell polarity
In the previous experiments we simplified the analysis by dividing the image of each cell into two halves, one directed toward the flow or source of chemoattractant, the other in the opposite direction. To account for the observed differences in the redistribution of actin and myo-II upon flow reversal, a graded representation of fluorescence intensities around the perimeter of a cell turned out to be necessary. Therefore, we have mapped the spatiotemporal dynamics of LimEΔ and myo-II distributions upon polarity reversal using polar plots of mRFP and GFP fluorescence intensities (Fig. 8). Node numbers 0–99 indicate fluorescence distributions along the cell contour, which is mapped onto a circle. Each radius corresponds to a time point from 15 s before the signal reversal (innermost radius) to 2.0–2.5 min after the signal reversal (outer radius).
Figure 8.
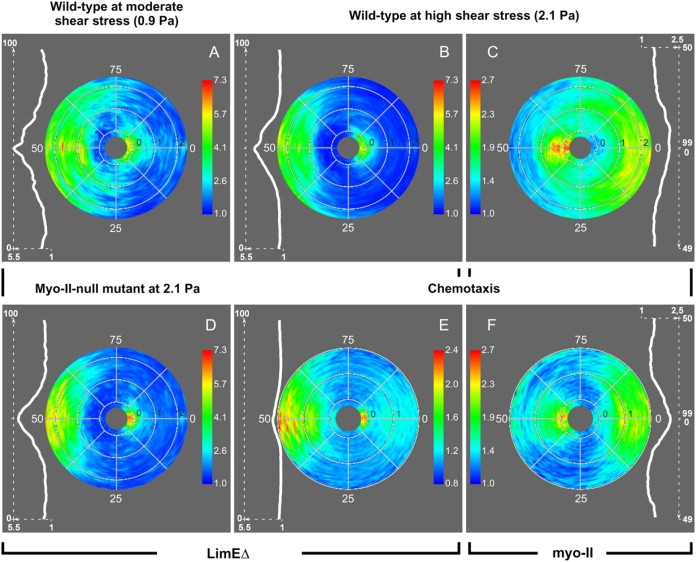
Spatiotemporal patterns of actin and myo-II relocalization in cells reverting their polarity in response to mechanical or chemical stimuli. These patterns are represented in polar plots that show the distribution of cortical fluorescence intensities in optical sections through the cells. In each plot the radius corresponds to time, from 15 s before signal reversal to 2.0–2.5 min after the reversal. The black numbers indicate time in minutes plotted in outward direction. The data sets are based on the same recordings as compiled in Figs. 3–7, whereby fluorescent LimEΔ serves as a marker of the front and myo-II of the tail of a cell. The color index indicates normalized cortical fluorescence intensities. (For their calculation, see Materials and Methods.) Nodes 0 correspond to the previous direction of a stimulus and nodes 50 to the new direction, i.e., the one after flow reversal or repositioning of the source of chemoattractant. The white curves on the left or right of each plot show distributions of fluorescence intensities in responding cells, as averaged over the interval of 1–2 min after signal reversal. For the LimEΔ label, the distributions along the cell contour are centered to node number 50 in accord with accumulation of this label at the new front. For myo-II the distributions are centered to node number 0 in accord with its recruitment to the new tail. Standard deviations of these distributions are 12.7 nodes for A, 10.0 for B, 16.2 for C, 8.8 for D, 7.2 for E, and 9.4 nodes for F. (Note the difference in scaling of cortical fluorescence intensities from 1 to 5.5 for LimEΔ and from 1 to 2.5 for myo-II.) Data in panels A and B on the front marker in wild-type JH10 cells exposed to moderate and high shear stress correspond to Fig. 3, C and B. Data in panel C on the tail marker correspond to Fig. 5. Data in panel D on the front response in HS1 myo-II-null cells correspond to Fig. 4. Data in panels E and F on double-labeled cells correspond to Fig. 7.
The LimEΔ-GFP label indicated that filamentous actin structures redistributed under low and high shear stress in a comparable manner: The label disappeared first from the previous front and then reappeared at the new front (Fig. 8, A and B). Under high shear stress, the recovery of labeled actin was delayed: there was a period of ∼20 s after disappearance when almost no label was accumulated along the entire perimeter of the cells. In comparing myo-II-null with wild-type cells at 2.1 Pa, there was no difference in the temporal dynamics of the actin label (Fig. 8 D).
The redistribution of myo-II in response to flow reversal is of interest because it clearly demonstrates that this tail marker never disappears from the cell cortex. During a transitory phase, myo-II was almost uniformly distributed around the cortex (Fig. 8 C). At the same time, i.e., between 30 and 50 s after flow reversal, cortical actin passed a minimum. Together these data suggest that the previous polarity of the cells is extinguished before an inverse polarity is established. In cells that changed polarity in response to chemoattractant, actin disappeared within seconds from the old front and started to accumulate at the new front after 20 s (Fig. 8 E), similar to actin under low shear stress (Fig. 8 A). Myo-II disappeared slowly from the previous tail and soon accumulated at the new tail, such that at ∼30 s the previous and new tail regions were equally labeled (Fig. 8 F). In conclusion, cells repolarizing under shear stress or in response to chemoattractant showed similar patterns of myo-II and actin redistribution.
To provide quantitative parameters for the spatial distribution of LimEΔ and myo-II we averaged cortical fluorescence intensities over a period of 1 min, beginning at 1 min after inverting the signal. The averaged LimEΔ distribution peaked at the very cell front, which is exposed to the strongest forces exerted by hydrodynamic flow (Fig. 8 B, inset). The profile within the front half of the cell could be approximated by a Gaussian distribution. Under the higher shear stress of 2.1 Pa the label was more strongly focused to the front (±SD is 10.03, given in node numbers) than under the lower stress of 0.9 Pa (±SD is 12.73). In comparing myo-II-null with wild-type cells, the actin label was found in the mutant cells to be even more precisely focused (±SD is 8.75). Similarly focused was the accumulation of cortical mRFP-LimEΔ during chemotaxis (±SD is 7.16). The enrichment of myo-II at the tail of the cells was confirmed by calculating the standard deviation for mechano- and chemotaxis (±SD is 16.23 and 9.39, respectively). The sharper focusing of myo-II in chemotaxis is probably due to the cylindrical shape of the developed, aggregation-competent cells that were responsive to cAMP.
Even though the front and tail of a cell are unequivocally distinguished, the detailed analysis indicates that neither mRFP-LimEΔ is exclusively accumulated at the front nor is myo-II only recruited to the tail. Under lower shear stress (Fig. 8 A) and in a chemical gradient (Fig. 8 E) there are phases at which the LimEΔ label is also detectably accumulated at the tail, i.e., around node 0. Similarly, in chemotaxing cells the myo-II becomes transiently recruited to the front region, which is primarily occupied by polymerized actin (Fig. 8 F, around node 50).
Discussion
Three phases of repolarization: fast actin depolymerization, establishment of a new front, and retraction of the tail
Dictyostelium cells strongly orient against fluid flow and invert their polarity in response to changing flow directions. We used these prompt responses to analyze in quantitative terms the spatiotemporal pattern of reorganization in the actin-myosin system. The conversion of a protruding front into a retracting tail, and vice versa, was monitored by double-labeling cells with green and red fluorescent markers. A label for filamentous actin structures marked the establishment of a front, and myo-II localization followed by retraction specified the tail of a cell.
Exposed to a sudden change in the direction of a shear stress of 2.1 Pa, cells reverted their polarity in three phases. 1), Actin rapidly disassembled at the previous front at 0–60 s after flow reversal. 2), At the new front, actin polymerization started at 30 s and leveled out at ∼90 s. The delay between dis- and reassembly resulted in a transitory minimum of actin association with the cell cortex between 30 and 50 s. 3), The new tail retracted at ∼60 s, a time when the amount of myo-II already associated with the new tail exceeded the amount still associated with the old tail. These experiments show that in response to a shear stress of 2.1 Pa, de novo polarization follows breakdown of the old polarity.
In general terms, one way for a polarized cell to rapidly respond to changing directions of a signal is to break down any established pattern first, before a new one is set up. The destruction of an established front-rear polarity within seconds facilitates reorientation of the cells to incoming signals from different directions. We wish to emphasize that the rapid breakdown of the cells’ polarity is elicited by the input of a new stimulus, opposed to the previous one. If the fluid flow is just stopped rather than inverted, the polarity remains stable for minutes (Fig. 2 D).
Myo-II in mechanoresponses
Three levels of regulation control myo-II localization and activation in Dictyostelium cells (31). 1), Bipolar filaments form and assemble in the cell cortex upon dephosphorylation of myo-II heavy chains by the phosphatase PP2A. Action of the phosphatase is antagonized by myo-II heavy chain kinases. 2), Myo-II localization at the tail is regulated by several proteins, in particular PAKa, a Rac1 and Akt/PKB regulated kinase, whose localization depends on the existence of a PIP3 gradient (8,32). 3), In addition, cGMP signaling pathways activate myo-II light-chain kinase, which phosphorylates the regulatory light chains and thus triggers myo-II ATPase activity (33).
For the flow-induced establishment of a cell front, myo-II could be omitted. This means, there is no need for the actin-filament cross-linking or motor activity of the bipolar myo-II filaments in the reception or transduction of the mechanical signals. Moreover, myo-II was not required for the suppression of actin polymerization in the tail region. The accumulation of polymerized actin was even more sharply restricted to the very front of a cell when myo-II was missing (Fig. 8 D). The specification of a front is therefore independent of the occupancy of a tail by myo-II.
Similarities between mechanical and chemical stimulation
To verify that the steps involved in the reversal of cell polarity are common to mechanical and chemical stimulation, we compared the responses to alternating shear flow with responses to rapidly inverted gradients of chemoattractant. A shear flow induces maximum membrane tension at the upstream side of the cell, precisely at the zone of cell-to-substrate contact (34,35), and minimum tension at the opposite cell edge. Consistently, a chemotaxing cell receives the strongest signal at the edge pointing toward the source of attractant. The inversion of cell polarity caused by either mechanical or chemical signals is initiated by the depolymerization of actin at the previous leading edge, which is going to turn into a tail. Since in both cases the depolymerization takes place opposite to the most strongly stimulated side, an inhibitory signal is proposed to rapidly spread from this edge throughout the entire cell.
The inhibitory signal is supposed to depend on the magnitude of the external signal: At 2.1 Pa the inhibition prevails long enough in the entire cell to suppress new front formation until the previous front has completely disappeared. At 0.9 Pa inhibition is not strong enough to suppress the polymerization of actin at the new front until the old front is completely deprived of polymerized actin. Because of reduced membrane tension at the front at lower shear stress (0.9 Pa), there is less resistance to growing actin filaments that push the membrane forward and protruding activity is facilitated (36). This effect may contribute to faster LimEΔ-GFP fluorescence increases (Figs. 3 C and 8 A) with a shorter delay and higher maximum values. Altogether less time is required to invert cell polarity at 0.9 Pa compared to 2.1 Pa. At 0.5 Pa the inhibition is too weak to suppress the old leading edge, and the cells respond by making U-turns rather than by reverting polarity.
We like to emphasize that our results are based on experiments in which cells were stimulated from behind and thus forced to completely reverse their polarity. If the chemoattractant is laterally applied, the cells can turn by bifurcation of their front or protrusion of a new one into the changed direction of the gradient without a need for reverting their polarity (37,38).
Similar variation in chemotactic behavior as in Dictyostelium has previously been reported for human neutrophils (39). In particular, the reversal of polarity occurs in the same sequence: first the previous front looses its dense actin network and the lamellipodium retracts. Only afterwards a new front is induced at the opposite end, pointing to the new source of attractant.
Highly polarized cells exposed to a gradient of chemoattractant have been shown to be insensitive to stimulation at the rear, probably by clustering of G-protein βγ-complexes at the cell front (40). This behavior is consistent with the U-turning at low shear stresses, when the old front remains stable.
Long-range inhibition and short-range activation of a cell front, as deduced from our data, are also implemented in local excitation/global inhibition (LEGI) models of gradient sensing (41,42). Some of these models describe the translation and amplification of an external cAMP gradient into a PIP3 gradient along the cell membrane of unpolarized latrunculin A treated Dictyostelium cells that are devoid of a functional actin system. These models propose a fast-acting positive feedback loop for establishment of a cell front, which is counterbalanced by slower global inhibition. The polarity reversal observed by us at high shear stresses, however, involves fast, long-range inactivation of the former front. Comparable kinetics for activator depletion were obtained in a generic mathematical model that is based on equal production rates of activator and inhibitor, assuming fast diffusion of the inhibitor (43,44).
As a nucleator of dendritic actin networks, the Arp2/3 complex is an established effector of actin polymerization at a newly induced front (19). In cells that are exposed to a sudden global upshift of cAMP, transient cortical accumulation of actin is downregulated within 10 s (45). Under these conditions, two negative regulators of actin polymerization are simultaneously recruited to the cell cortex: Coronin, an inhibitor of Arp2/3-mediated polymerization, and Aip1 (actin interacting protein 1), which cooperates with cofilin in the depolymerization of actin. Therefore, the efficient downregulation of polymerized actin appears to involve two controls acting in parallel: the downregulation of polymerization and upregulation of depolymerization.
Does a cell adapt to a polarizing stimulus?
There appears to be one principal difference concerning adaptation between mechanical stimulation by a fluid flow and chemical stimulation in a gradient of attractant. Once a cell is oriented in a continuous flow, it is exposed to a constant stimulus. Therefore, if the cell adapts to the stimulus it would become nonresponsive. In contrast, a chemotaxing cell moving up a gradient will recognize increasing concentrations of attractant even when adapted to the actual concentration in its vicinity. To prevent the movement in a gradient, Parent and Devreotes (7) have treated the cells with latrunculin A, an inhibitor of actin polymerization. When these rounded cells were exposed to a stationary gradient of cAMP, they responded ceaselessly by forming a crescent of PIP3 in the membrane area pointing toward the source of attractant. Similar to our experiments with mechanically stimulated cells, this experiment leads to the conclusion that, when exposed to a stationary spatial gradient of signal inputs, the cells of Dictyostelium reach a steady state of permanent polarization, with the front pointing to the higher input.
Supplementary material
To view all of the supplemental files associated with this article, visit www.biophysj.org.
Appendix A.
Legend
Figure
Movie 1
Movie 2
Movie 3
Movie 4
Movie 5
Movie 6
Movie 7
Acknowledgments
We thank H. Warrick for JH10 and HS1 cells, and M. Ecke and B. Sartor for expert assistance. J.D. thanks M. Satre for valuable discussions and support.
This work was supported by the Centre National de la Recherche Scientifique. J.D. was a recipient of a MENRT fellowship (French Research Ministry) and was supported by a one-year grant from the French Association for Research on Cancer and two short-term fellowships from the European Molecular Biology Organization.
Footnotes
Editor: Gerard Marriott.
References
- 1.Hardin J., Walston T. Models of morphogenesis: the mechanisms and mechanics of cell rearrangement. Curr. Opin. Genet. Dev. 2004;14:399–406. doi: 10.1016/j.gde.2004.06.008. [DOI] [PubMed] [Google Scholar]
- 2.Dormann D., Weijer C.J. Chemotactic cell movement during Dictyostelium development and gastrulation. Curr. Opin. Genet. Dev. 2006;16:367–373. doi: 10.1016/j.gde.2006.06.003. [DOI] [PubMed] [Google Scholar]
- 3.Blaser H., Reichman-Fried M., Castanon I., Dumstrei K., Marlow F., Kawakami K., Solnica-Krezel L., Heisenberg C., Raz E. Migration of zebrafish primordial germ cells: a role for myosin contraction and cytoplasmic flow. Dev. Cell. 2006;11:613–627. doi: 10.1016/j.devcel.2006.09.023. [DOI] [PubMed] [Google Scholar]
- 4.Gerisch G. Chemotaxis in Dictyostelium. Annu. Rev. Physiol. 1982;44:535–552. doi: 10.1146/annurev.ph.44.030182.002535. [DOI] [PubMed] [Google Scholar]
- 5.Weber I., Wallraff E., Albrecht R., Gerisch G. Motility and substratum adhesion of Dictyostelium wild-type and cytoskeletal mutant cells: a study by RICM/bright-field double-view image analysis. J. Cell Sci. 1995;108:1519–1530. doi: 10.1242/jcs.108.4.1519. [DOI] [PubMed] [Google Scholar]
- 6.Eichinger L., Lee S.S., Schleicher M. Dictyostelium as model system for studies of the actin cytoskeleton by molecular genetics. Microsc. Res. Tech. 1999;47:124–134. doi: 10.1002/(SICI)1097-0029(19991015)47:2<124::AID-JEMT5>3.0.CO;2-8. [DOI] [PubMed] [Google Scholar]
- 7.Parent C.A., Devreotes P.N. A cell's sense of direction. Science. 1999;284:765–770. doi: 10.1126/science.284.5415.765. [DOI] [PubMed] [Google Scholar]
- 8.Chung C.Y., Funamoto S., Firtel R.A. Signaling pathways controlling cell polarity and chemotaxis. Trends Biochem. Sci. 2001;26:557–566. doi: 10.1016/s0968-0004(01)01934-x. [DOI] [PubMed] [Google Scholar]
- 9.Décavé E., Rieu D., Dalous J., Fache S., Brechet Y., Fourcade B., Satre M., Bruckert F. Shear flow-induced motility of Dictyostelium discoideum cells on solid substrate. J. Cell Sci. 2003;116:4331–4343. doi: 10.1242/jcs.00726. [DOI] [PubMed] [Google Scholar]
- 10.Fache S., Dalous J., Engelund M., Hansen C., Chamaraux F., Fourcade B., Satre M., Devreotes P., Bruckert F. Calcium mobilization stimulates Dictyostelium discoideum shear-flow-induced cell motility. J. Cell Sci. 2005;118:3445–3457. doi: 10.1242/jcs.02461. [DOI] [PubMed] [Google Scholar]
- 11.Manstein D.J., Titus M.A., De Lozanne A., Spudich J.A. Gene replacement in Dictyostelium: generation of myosin null mutants. EMBO J. 1989;8:923–932. doi: 10.1002/j.1460-2075.1989.tb03453.x. [DOI] [PMC free article] [PubMed] [Google Scholar]
- 12.de la Roche M.A., Côté G.P. Regulation of Dictyostelium myosin I and II. Biochim. Biophys. Acta. 2001;1525:245–261. doi: 10.1016/s0304-4165(01)00110-6. [DOI] [PubMed] [Google Scholar]
- 13.Hostetter D., Rice S., Dean S., Altman D., McMahon P.M., Sutton S., Tripathy A., Spudich J.A. Dictyostelium myosin bipolar thick filament formation: importance of charge and specific domains of the myosin rod. PLoS Biol. 2004;2:1880–1892. doi: 10.1371/journal.pbio.0020356. [DOI] [PMC free article] [PubMed] [Google Scholar]
- 14.Yumura S., Mori H., Fukui Y. Localization of actin and myosin for the study of ameboid movement in Dictyostelium using improved immunofluorescence. J. Cell Biol. 1984;99:894–899. doi: 10.1083/jcb.99.3.894. [DOI] [PMC free article] [PubMed] [Google Scholar]
- 15.Jay P.Y., Pham P.A., Wong S.A., Elson E.L. A mechanical function of myosin II in cell motility. J. Cell Sci. 1995;108:387–393. doi: 10.1242/jcs.108.1.387. [DOI] [PubMed] [Google Scholar]
- 16.Uchida K.S., Kitanishi-Yumura T., Yumura S. Myosin II contributes to the posterior contraction and the anterior extension during the retraction phase in migrating Dictyostelium cells. J. Cell Sci. 2003;116:51–60. doi: 10.1242/jcs.00195. [DOI] [PubMed] [Google Scholar]
- 17.Laevsky G., Knecht D.A. Cross-linking of actin filaments by myosin II is a major contributor to cortical integrity and cell motility in restrictive environments. J. Cell Sci. 2003;116:3761–3770. doi: 10.1242/jcs.00684. [DOI] [PubMed] [Google Scholar]
- 18.Kuwayama H., Ecke M., Gerisch G., Van Haastert P.J. Protection against osmotic stress by cGMP-mediated myosin phosphorylation. Science. 1996;271:207–209. doi: 10.1126/science.271.5246.207. [DOI] [PubMed] [Google Scholar]
- 19.Diez S., Gerisch G., Anderson K., Müller-Taubenberger A., Bretschneider T. Subsecond reorganization of the actin network in cell motility and chemotaxis. Proc. Natl. Acad. Sci. USA. 2005;102:7601–7606. doi: 10.1073/pnas.0408546102. [DOI] [PMC free article] [PubMed] [Google Scholar]
- 20.Bretschneider T., Diez S., Anderson K., Heuser J., Clarke M., Müller-Taubenberger A., Köhler J., Gerisch G. Dynamic actin patterns and Arp2/3 assembly at the substrate-attached surface of motile cells. Curr. Biol. 2004;14:1–10. doi: 10.1016/j.cub.2003.12.005. [DOI] [PubMed] [Google Scholar]
- 21.Moores S.L., Sabry J.H., Spudich J.A. Myosin dynamics in live Dictyostelium cells. Proc. Natl. Acad. Sci. USA. 1996;93:443–446. doi: 10.1073/pnas.93.1.443. [DOI] [PMC free article] [PubMed] [Google Scholar]
- 22.Wessels D., Soll D.R., Knecht D., Loomis W.F., De Lozanne A., Spudich J. Cell motility and chemotaxis in Dictyostelium amebae lacking myosin heavy chain. Dev. Biol. 1988;128:164–177. doi: 10.1016/0012-1606(88)90279-5. [DOI] [PubMed] [Google Scholar]
- 23.Clow P.A., McNally J.G. In vivo observations of myosin II dynamics support a role in rear retraction. Mol. Biol. Cell. 1999;10:1309–1323. doi: 10.1091/mbc.10.5.1309. [DOI] [PMC free article] [PubMed] [Google Scholar]
- 24.Ruppel K.M., Uyeda T.Q., Spudich J.A. Role of highly conserved lysine 130 of myosin motor domain. In vivo and in vitro characterization of site specifically mutated myosin. J. Biol. Chem. 1994;269:18773–18780. [PubMed] [Google Scholar]
- 25.Schneider N., Weber I., Faix J., Prassler J., Müller-Taubenberger A., Köhler J., Burghardt E., Gerisch G., Marriott G. A Lim protein involved in the progression of cytokinesis and regulation of the mitotic spindle. Cell Motil. Cytoskeleton. 2003;56:130–139. doi: 10.1002/cm.10139. [DOI] [PubMed] [Google Scholar]
- 26.Fischer M., Haase I., Simmeth E., Gerisch G., Müller-Taubenberger A. A brilliant monomeric red fluorescent protein to visualize cytoskeleton dynamics in Dictyostelium. FEBS Lett. 2004;577:227–232. doi: 10.1016/j.febslet.2004.09.084. [DOI] [PubMed] [Google Scholar]
- 27.Dormann D., Libotte T., Weijer C.J., Bretschneider T. Simultaneous quantification of cell motility and protein-membrane-association using active contours. Cell Motil. Cytoskeleton. 2002;52:221–230. doi: 10.1002/cm.10048. [DOI] [PubMed] [Google Scholar]
- 28.Prassler J., Murr A., Stocker S., Faix J., Murphy J., Marriott G. DdLIM is a cytoskeleton-associated protein involved in the protrusion of lamellipodia in Dictyostelium. Mol. Biol. Cell. 1998;9:545–559. doi: 10.1091/mbc.9.3.545. [DOI] [PMC free article] [PubMed] [Google Scholar]
- 29.De Lozanne A., Spudich J.A. Disruption of the Dictyostelium myosin heavy chain gene by homologous recombination. Science. 1987;236:1086–1091. doi: 10.1126/science.3576222. [DOI] [PubMed] [Google Scholar]
- 30.Gerisch G., Albrecht R., Heizer C., Hodgkinson S., Maniak M. Chemoattractant-controlled accumulation of coronin at the leading edge of Dictyostelium cells monitored using a green fluorescent protein-coronin fusion protein. Curr. Biol. 1995;5:1280–1285. doi: 10.1016/s0960-9822(95)00254-5. [DOI] [PubMed] [Google Scholar]
- 31.Bosgraaf L., van Haastert P.J. The regulation of myosin II in Dictyostelium. Eur. J. Cell Biol. 2006;85:969–979. doi: 10.1016/j.ejcb.2006.04.004. [DOI] [PubMed] [Google Scholar]
- 32.Chung C.Y., Firtel R.A. PAKa, a putative PAK family member, is required for cytokinesis and the regulation of the cytoskeleton in Dictyostelium discoideum cells during chemotaxis. J. Cell Biol. 1999;147:559–576. doi: 10.1083/jcb.147.3.559. [DOI] [PMC free article] [PubMed] [Google Scholar]
- 33.Bosgraaf L., Russcher H., Smith J.L., Wessels D., Soll D.R., Van Haastert P.J. A novel cGMP signalling pathway mediating myosin phosphorylation and chemotaxis in Dictyostelium. EMBO J. 2002;21:4560–4570. doi: 10.1093/emboj/cdf438. [DOI] [PMC free article] [PubMed] [Google Scholar]
- 34.Simson R., Wallraff E., Faix J., Niewöhner J., Gerisch G., Sackmann E. Membrane bending modulus and adhesion energy of wild-type and mutant cells of Dictyostelium lacking talin or cortexillins. Biophys. J. 1998;74:514–522. doi: 10.1016/S0006-3495(98)77808-7. [DOI] [PMC free article] [PubMed] [Google Scholar]
- 35.Chamaraux F., Fache S., Bruckert F., Fourcade B. Kinetics of cell spreading. Phys. Rev. Lett. 2005;94:158102. doi: 10.1103/PhysRevLett.94.158102. [DOI] [PubMed] [Google Scholar]
- 36.Raucher D., Sheetz M.P. Cell spreading and lamellipodial extension rate is regulated by membrane tension. J. Cell Biol. 2000;148:127–136. doi: 10.1083/jcb.148.1.127. [DOI] [PMC free article] [PubMed] [Google Scholar]
- 37.Segall J.E., Gerisch G. Genetic approaches to cytoskeleton function and the control of cell motility. Curr. Opin. Cell Biol. 1989;1:44–50. doi: 10.1016/s0955-0674(89)80035-3. [DOI] [PubMed] [Google Scholar]
- 38.Andrew N., Insall R. Chemotaxis in shallow gradients is mediated independently of PtdIns 3-kinase by biased choices between random protrusions. Nat. Cell Biol. 2007;9:193–200. doi: 10.1038/ncb1536. [DOI] [PubMed] [Google Scholar]
- 39.Gerisch G., Keller H.U. Chemotactic reorientation of granulocytes stimulated with micropippettes containing fMet-Leu-Phe. J. Cell Sci. 1981;52:1–10. doi: 10.1242/jcs.52.1.1. [DOI] [PubMed] [Google Scholar]
- 40.Jin T., Zhang N., Long Y., Parent C.A., Devreotes P.N. Localization of the G protein βγ complex in living cells during chemotaxis. Science. 2000;287:1034–1036. doi: 10.1126/science.287.5455.1034. [DOI] [PubMed] [Google Scholar]
- 41.Janetopoulos C., Ma L., Devreotes P.N., Iglesias P.A. Chemoattractant-induced phosphatidylinositol 3,4,5-trisphosphate accumulation is spatially amplified and adapts, independent of the actin cytoskeleton. Proc. Natl. Acad. Sci. USA. 2004;101:8951–8956. doi: 10.1073/pnas.0402152101. [DOI] [PMC free article] [PubMed] [Google Scholar]
- 42.Ma L., Janetopoulos C., Yang L., Devreotes P.N., Iglesias P.A. Two complementary, local excitation, global inhibition mechanisms acting in parallel can explain the chemoattractant-induced regulation of PI(3,4,5)P3 response in Dictyostelium cells. Biophys. J. 2004;87:3764–3774. doi: 10.1529/biophysj.104.045484. [DOI] [PMC free article] [PubMed] [Google Scholar]
- 43.Rappel W.J., Thomas P.J., Levine H., Loomis W.F. Establishing direction during chemotaxis in eukaryotic cells. Biophys. J. 2002;83:1361–1367. doi: 10.1016/S0006-3495(02)73906-4. [DOI] [PMC free article] [PubMed] [Google Scholar]
- 44.Levine H., Kessler D.A., Rappel W.J. Directional sensing in eukaryotic chemotaxis: a balanced inactivation model. Proc. Natl. Acad. Sci. USA. 2006;103:9761–9766. doi: 10.1073/pnas.0601302103. [DOI] [PMC free article] [PubMed] [Google Scholar]
- 45.Etzrodt M., Ishikawa H.C., Dalous J., Müller-Taubenberger A., Bretschneider T., Gerisch G. Time-resolved responses to chemoattractant, characteristic of the front and tail of Dictyostelium cells. FEBS Lett. 2006;580:6707–6713. doi: 10.1016/j.febslet.2006.11.031. [DOI] [PubMed] [Google Scholar]
Associated Data
This section collects any data citations, data availability statements, or supplementary materials included in this article.
Supplementary Materials
Legend
Figure
Movie 1
Movie 2
Movie 3
Movie 4
Movie 5
Movie 6
Movie 7