

Abstract
We investigate the emergence of synchronization in two groups of oscillators; one group acts as a synchronization source, and the other as the target. Based on phase model simulations, we construct a synchrony index (SI): a combination of intra- and intergroup synchronies. The SI characterizes the extent of induced synchrony in the population. We demonstrate the usefulness of the measure in a test case of mesial temporal lobe epilepsy: the SI can be readily calculated from standard electroencephalographic measurements. We show that the synchrony index has a statistically significant increased value for the ictal periods and that the epileptic focus can be located by identifying the most synchronous pairs of electrodes during the initial part of ictal period of the seizure. We also show that it is possible in this pilot case to differentiate clinical and subclinical seizures based on the dynamical features of the synchronization. The synchronization index was found to be a useful quantity for the characterization of “pathological hypersynchronization” within a well-characterized patient with mesial temporal lobe epilepsy and thus has potential medical value in seizure detection, localizing ability, and association with later surgical outcome.
Introduction
Normal brain functions depend on the appropriate adjustment and coordination of temporally structured neuronal activities (1). Deterioration of the subtle coordination may result in brain disorders. For example, epileptic seizures are characterized by a sudden increase of synchronous neuronal activity, distinguished by paroxysmal activity that appears on electroencephalographic (EEG) measurements (2). Although the gold-standard in medical practice remains visual analysis of EEG data, mathematical methods have been developed for seizure anticipation, detection, and for characterization of seizure termination (3,4); the investigation of such dynamical features may aid in investigation, diagnosis, and ultimately, treatment.
Several studies have examined the application of signal processing tools to gain insight into the dynamics of epileptic seizures (4). Fourier transform analyses have shown that high-frequency oscillatory activity, especially in the γ-band, has been associated with epileptic events (5). The presence of such oscillations enables seizure detection (6) with, for example, wavelets (7) or the Gabor atom density technique (8). Complexity measures such as correlation dimension (9,10) and Lyapunov exponents (11) have been proposed to serve as potential seizure anticipation tools (12).
Bi- and multivariate analyses that characterize the interdependency (synchronization) of EEG signals could reveal essential spatial characteristics of the seizure dynamics. For example, primary generalized absence seizures displayed more long-range synchrony than generalized tonic motor seizures of secondary generalized epilepsy or frontal lobe epilepsy (13). Synchronization is a complex phenomenon; there are many types (and corresponding measures) of synchronization including phase, generalized, and identical synchronization (14). To what extent these various measures are applicable to epileptic seizures is not known; however, it has been determined empirically that many of them (nonlinear interdependence, mutual information, phase synchronization with Hilbert transform or wavelets) give useful information about the interdependency of the signals (15). The measures of synchrony can play a complementary role: a combination of measures has been used to demonstrate that human seizures have distinct initiation and termination dynamics (16). Synchrony is not necessarily increased in the pre-ictal and ictal periods (1,4); a long-lasting decrease of synchrony (17,18) has been observed that creates conditions for fast hypersynchronous activity (13,19,20).
Characterization of neuronal hypersynchrony over large brain areas is difficult because of the complex (and often unknown) interaction topology and the lack of individual measurements in the neuronal populations. The quantification of induced synchrony from a strongly synchronized source region to a weakly synchronized target region may provide a framework for a dynamical definition of seizures. Previously introduced synchronization measures, primarily developed for two interacting oscillators, could be further improved by considering the characteristic dynamical features of the seizures. The exploration of the role of neural synchrony in the generation of seizure activity requires refined synchrony measures that are capable of the characterization of the seizure initiation, propagation, and termination in a network of a large population of interacting oscillators.
In this article, we propose a measure that characterizes the extent of phase synchrony in a network consisting of two groups of interacting oscillators. A synchrony index (SI) is developed in numerical simulations, with phase models that incorporate both intra- and intergroup synchronies. We compare the new synchronization index to a traditional measure of synchrony (Kuramoto order (21)) with both positive (excitatory) and negative (inhibitory) intergroup interactions. The synchrony index can be readily calculated from standard EEG measurements; we demonstrate the usefulness of the measure in a test case of mesial temporal lobe epilepsy for the location of the epileptic focus. In addition, we investigate the capability of the measure to differentiate clinical and subclinical seizures based on the dynamical features of the synchronization.
Theory
Synchronization Index
Many biological networks are highly clustered (22–24); they contain nodes with high connectivity. This cluster property implies that interacting groups could convey (at least) some of the dynamical features of a highly structured network. A simplified interaction configuration for two groups is shown in Fig. 1. We assume that the interaction among elements in each group is global (all-to-all): that is, the groups interact with each other through their mean fields. (Although mean field interaction can be realized by cross-coupling of each oscillator of each group, it can also represent interactions that occur through global signals of the groups. An example is the mean field coupling of bacteria through quorum sensing (25)). The interaction between the groups (in both directions) can be different than those among the members of the groups. In the model, each circle represents a rhythmic unit; from a physical point of view each unit can be either a single rhythmic entity (e.g., a rhythmic cell) or a set of entities whose collective behavior can be considered as a single oscillator for the purpose of investigation. We model each rhythmic unit in the population with a phase model. These are simple yet accurate models of weakly interacting oscillators that describe the behavior of the phase of each oscillator (21).
Figure 1.
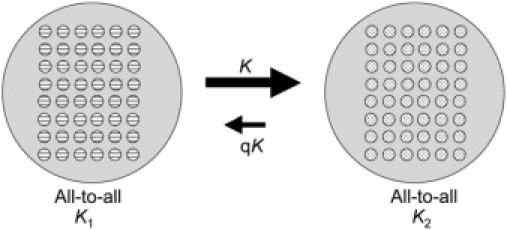
Coupling topology and strength for a simple model of two groups of interacting oscillators. The coupling in each group is global with coupling strengths K1, and K2, respectively. The coupling between the groups is through the mean field with coupling strength K for direction 1 → 2 and and qK for direction 2 → 1.
Dynamics of the isolated groups
First we consider the general dynamical features of isolated groups with global interactions. One of the simplest models that describe the emergence of collective oscillation is the Kuramoto model (21), given by
| (1) |
where φi and ωi are, respectively, the phase and the natural frequency of the oscillator i; N is the system size (i = 1,2,…,N); and K is the (positive) coupling intensity. Let g(ω) denote the normalized number density of the natural frequencies. We assume that g(ω) is unimodal and symmetric about the mean frequency ω0. The coupling within the groups is assumed to be all-to-all (global) and described by a sinusoidal function.
The collective oscillation of such a system can be characterized by the complex order parameter (21)
| (2) |
where I denotes the imaginary unit, and r and ψ are real numbers describing the amplitude and the phase of the collective oscillation, respectively. In terms of this order parameter, Eq. 1 is transformed to
| (3) |
One can thus see from this transformation that the phase φi of each oscillator tends to the collective phase ψ of the population and the coupling intensity is proportional to the collective order r.
In the absence of heterogeneity, i.e., g(ω) = δ(ω−ω0), such a system converges to the perfectly synchronous state, φi = φj for any i and j, for any positive K. Thus, r = 1 for any finite K. However, if g(ω) has nonvanishing variance, the oscillation amplitude r becomes very small unless the coupling is sufficiently strong. In particular, at the limit N → ∞, r vanishes for K < Kc = 2/πg(ω0) and collective oscillation appears (i.e., r > 0) only for K ≥ Kc (21). (Kc is of the order of the standard deviation of g(ω).)
Model of two interacting groups
We consider two groups of the Kuramoto systems, where the groups are labeled as α = 1 and 2. Our assumptions on the model are as follows. Each group consists of N oscillators. Inside the group α, coupling intensity is Kα. The couplings among the elements of the subsystems are all-to-all; the intensity from group 1 to 2 is K while that from group 2 to 1 is qK. In addition, each oscillator is subject to independent noise. The dynamical equations are
| (4) |
| (5) |
where and are, respectively, the phase and the natural frequency of the oscillator i in the group α. Using the order parameter of each group,
| (6) |
Equations 4 and 5 are transformed to
| (7) |
| (8) |
Order parameters
The dynamical behavior of a system defined by Eqs. 4 and 5 was investigated in detail (26,27). In a large region of parameter space one of the three distinct (trivial) types of behaviors can be observed: nonsynchronized, independently synchronized, or mutually synchronized. In the nonsynchronized region, the intra- and intercluster couplings are too weak to induce synchrony in the network. The time-averaged order parameter of the groups,
| (9) |
remains low (close to zero for infinite population size, order of N−0.5 for finite size population), and therefore the overall Kuramoto order
| (10) |
has low values as well. (T0 and T are the sufficiently large transient and sample times, respectively.) When the intragroup coupling is strong and the intergroup coupling is weak, there is a large order within each group and the collective oscillations of the groups are not synchronized. However, when the intergroup interactions are strong enough, the two synchronized groups become phase-locked and a mutually synchronized state is obtained.
Because phase-locking between the two groups may not be necessarily in-phase, the traditional average order parameter Eq. 10 is not good measure of synchrony. (For example, perfect anti-phase-locking would result in R = 0.) Therefore, we consider quantities that characterize overall order that is not dependent on the (constant) phase difference between the phase-locked groups. With two groups that are in phase in Eq. 10, R = (r1+r2)/2. To obtain the same value with two groups of fixed phase difference Ψ, the phase of the lagging group should be incremented by Ψ in Eq. 10. Therefore, a modified order parameter, Rmod, can be defined as
| (11) |
where Ψ* is the most probable phase difference between the two groups for period T. The value Ψ* can be obtained from the maximum of the probability density distribution of the cyclic phase difference ΔΨ(t) = mod(Ψ1(t)− Ψ2(t),2π). For perfectly phase-locked groups, Rmod is simply the mean of the group orders r1 and r2. When there is no apparent phase-locking, Rmod is expected to be small. (With unimodal phase difference distribution, the most probable phase difference Ψ* gives a maximal order in Eq. 11.)
Another order parameter, the Synchronization Index, can be constructed, which exhibits small and large values for non-phase-locked and phase-locked groups, respectively, as
| (12) |
where σ is a measure of phase synchrony between the two groups (28), and
| (13) |
where S is the Shannon entropy of the cyclic phase distribution and Smax is the maximal entropy. (The cyclic phase distribution is the distribution of 2π modulated difference ΔΨ(t) between the phases of the two groups: the distribution is divided into M bins, and pk is the probability that ΔΨ is in bin k; Smax = ln M.) The value σ exhibits a large (approximately unity) value for phase-locked groups and low (close to zero) value for phase-drifting.
For perfect phase-locking, SI has a value of the mean of the group orders (same as Rmod); however, for lack of phase-locking, SI is zero (because σ is zero) as opposed to the small but fluctuating values of Rmod. The definition of the order parameters thus implies that although both Rmod and SI are potentially good measures of synchrony, Rmod is more sensitive to intragroup and SI to intergroup synchronies, respectively.
Numerical simulations
We carried out numerical simulations of Eqs. 4 and 5 with various inter- and intracluster coupling strengths (K1, K2, K) and directionality index (q) and compared the values of the major synchrony measures (group order (r1, r2), phase synchrony (σ), overall (R) and modified overall (Rmod) order, and synchronization index (SI)).
The following numerical setup was employed. Each group size N is 1000. The distribution function g(α)(ω) is Gaussian with a standard deviation of 1. The mean frequencies of the groups 1 and 2 are ω0 + Δω and ω0, respectively. (Note that we may put ω0 = 0 by going into the rotating frame φ → φ−ω0t.) In each run of numerical simulations, we start from random phases distributed uniformly within [0,2π). We made the histogram (with 500 bins) of the phase difference ψ1−ψ2; the most probable phase difference Ψ* is defined by the phase with the largest probability density in the histogram. The various measures of synchrony (Eqs. 9–13) were calculated for T = 1000 (after T0 = 500 transient time).
Fig. 2 shows the results for the simple case K = K1 = K2, Δω = ω2 − ω1, = 0, and q = 1 (without any noise, ρ = 0). Under such a parameter set, the model is equivalent to the original Kuramoto model (Eq. 1). Fig. 2 a displays Rmod and SI as functions of K. Both quantities capture the emergence of collective oscillation at ∼K = 0.8. Note that in this case R (not shown) is practically the same as Rmod because the two groups are identical. In Fig. 2 b we can see that σ rises sharply with the emergence of the collective oscillation (at ∼K = 0.8). Note that at the limit N → ∞ (21), R = Rmod = 0 and σ = 0 for K < Kc = 4/πg(ω0) ≈ 0.8: for K ≥ Kc R = Rmod (nonzero) and σ = 1. Thus, for an infinite, all-to-all coupled population, all the synchrony measures are expected to have identical measures. For a finite size population Fig. 2 a implies that SI performs better in identifying the synchronization transition point because below the transition point the finite size fluctuations in the group orders are effectively suppressed by the low value of phase synchrony σ.
Figure 2.
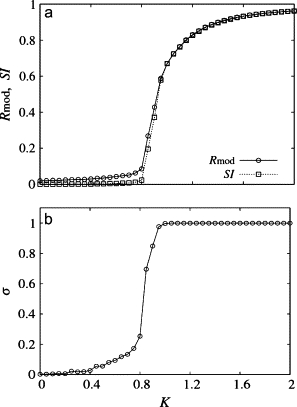
Measures of synchrony in the limit of a globally coupled population of oscillators. K = K1 = K2, q = 1; Δω = 0 and ρ = 0. (a) Order parameters Rmod, SI as function of K. (b) Phase synchrony σ versus K.
Next we show how synchrony can be induced between the two groups (whose inherent mean frequencies are somewhat different) with intergroup coupling. We take a scenario in which without intergroup coupling (K = 0), group-1 has larger dynamical order (K1 = 1.8 > Kc) than group-2 (which is close to the synchronization transition, K2 = 1.6 ≈ Kc). Therefore group-1 and 2 act as a synchronization source and target, respectively. (Other parameter values are Δω = 0.1 and q = 1. Note that in our simulations we have checked that the following results do not change qualitatively for other Δω and q-values.)
Fig. 3, a–c, show results for the dependence on positive intergroup coupling, K. With increasing K (and all other parameters fixed) there is a large increase in the target group order 〈r2〉 and the phase synchrony index σ (see Fig. 3 a); there is a small increase in source group order 〈r1〉 due to the bidirectional intergroup interactions (q = 1). The increase of R, Rmod, and SI indicate the enhancement of synchrony of the whole population by intergroup coupling. The variations of R and Rmod are very similar; this implies that the groups are almost in-phase, which can be confirmed in the phase difference histogram in Fig. 3 c. The SI seems to have parallel variations (especially at low K) to R and Rmod, however, starting from zero at K = 0. This numerical result again implies that while R and Rmod are measures for synchrony, Rmod is for overall, and SI is for induced synchrony in the population.
Figure 3.
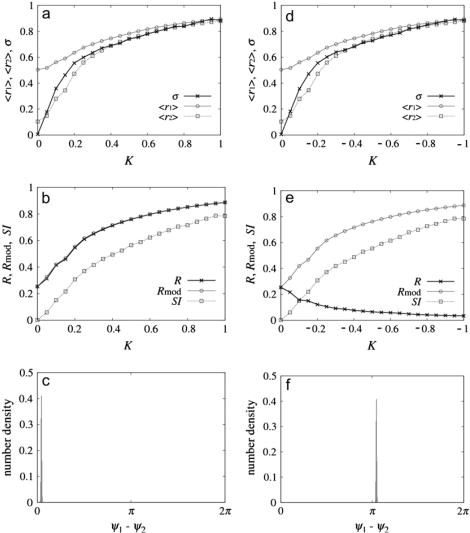
Enhancement of synchrony induced by positive (left column) and negative (right column) intergroup coupling K. K1 = 1.8, K2 = 1.6, ρ = 0.01, Δω = 0.1, and q = 1.0. (Top row) Phase synchrony (σ) and group orders 〈r1〉, 〈r2〉 versus K. (Middle row) Synchrony measures R, Rmod, and SI versus K. (Bottom row) Distribution of cyclic phase differences of the complex orders of the two populations (at ǀKǀ = 0.6).
Qualitatively the same results are found for negative (inhibitory) interactions (Fig. 3, d–f) except for one important measure: the traditional Kuramoto order, R fails to characterize the induced order: there is a decrease of R with increasing K (Fig. 3 e). The decrease of R is due to the fact that two groups are close to anti-phase for negative K, which can be seen in Fig. 3 f. In contrast to R, the measures Rmod and SI do capture the enhancement of synchrony between two groups even for negative K.
Results
Characterization of synchrony in seizures
The numerical calculations with phase models support the premise that the modified overall order, Rmod (Eq. 11) and the Synchronization Index (SI, Eq. 12) are physically meaningful measures of synchrony in groups of oscillator populations. Whereas Rmod expresses better the overall order, SI describes the induced order due to intergroup coupling. Since the induced synchrony between brain regions is expected to play an important role in the dynamics of seizures we used SI in an analysis of seizures in mesial temporal lobe epilepsy.
The calculation of SI from traditional EEG data is possible with certain approximation. By definition, SI requires measurement of the phases of all oscillators in the groups, construction of group orders and phases (r1, Ψ1, r2, Ψ2, with Eq. 6), the calculation of σ from the group phases (Eq. 13), and the final calculation of SI using Eq. 12. However, the phases of all individual oscillating neuronal circuits (that can be composed of a large number of neurons) below an EEG electrode are not known. Nevertheless, it has been shown theoretically and in supporting chemical experiments (29) that the features of the overall order can be extracted from measurements of global (mean) signals. The amplitude of the mean signal is proportional to the group order provided that the coupling topology within the group is global and the amplitudes of the oscillators are not affected by the coupling; in addition, the phase of the collective signal is a good approximation of the group phase.
The amplitude (rk) and phase (Ψk) are calculated for the kth EEG signal sk as
| (14) |
| (15) |
where Hk(t) is the Hilbert transform,
| (16) |
The value σ can be calculated with Eq. 13 for a pair of electrodes by using the phases from Eq. 15. Therefore, for EEG signals of electrodes k and l the time-dependent SI is evaluated as
| (17) |
(Note that by the theoretical definition, the maximum value of SI is 1. However, by the practical definition, the maximum value is the mean of the amplitudes of the EEG signal.) In this study the σ-values in Eq. 13 were evaluated for 1-s intervals and the order values rk were averaged for 1 s; thus the SI values in Eq. 17 were obtained for 1-s intervals of the original time-series data.
To investigate the role of neuronal synchrony we chose a test case of mesial temporal lobe epilepsy (MTLE): a condition of medically intractable seizures that arise from the limbic structures, which, on histopathology, demonstrate a lesion of gliosis and specific neuronal loss within the hippocampus. MTLE provides us with a well-characterized human model of focal-onset epileptic seizures.
The patient is a 43-year-old right-handed woman who presented with medically intractable complex partial seizures marked by behavioral arrest and orofacial and hand-wringing automatisms. Because noninvasive methods were inconclusive, confirmatory intracranial monitoring was performed. The patient underwent left anterior temporal lobectomy after localization of seizures to the left hippocampus. The diagnosis of MTLE was confirmed with histopathology showing hippocampal sclerosis. The patient is seizure- and aura-free one year postoperatively.
Intracranial recordings were performed with the use of 72 bilateral intracranial electrodes (with 1-cm center-interelectrode spacing), which were implanted in the following array (Fig. 4): orthogonally oriented intrahippocampal electrodes were inserted through temporal burr holes, and subdural electrodes were arrayed across bilateral subtemporal, lateral temporal, anterior frontal, lateral frontal, and frontoparietal regions.
Figure 4.
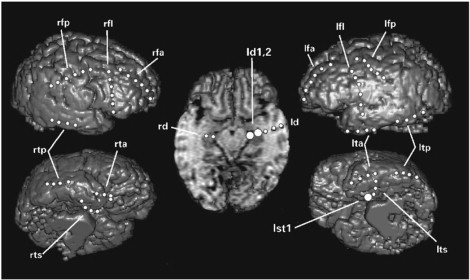
3D-MRI reconstruction demonstrating location of depth and subdural electrodes. Larger circles designate electrodes determined as the locations of seizure onset by visual interpretation of EEG (intrahippocampal electrodes ld1, ld2, and subtemporal electrode lst1).
Seizures were classified into two groups: subclinical seizures (SCSz) without clinical accompaniment, and clinical and electrographic complex partial seizures (CSz). EEG data were analyzed for 5 min on either side of electrographic onset as determined by traditional visual analysis with the use of standard clinical criteria. Onset of seizures was characterized by the appearance of rhythmic sustained patterns clearly distinct from electrographic background activity. These patterns included rhythmic spikes or sharp waves, low-voltage high-frequency potentials, or attenuation of electrographic activity with subsequent appearance of the previously described rhythmic change (30). Seizure duration was defined as the time span from electrographic ictal onset to cessation of ictal activity within the zone of ictal origin. EEG timing in relationship to ictal activity was classified into preictal, ictal, and postictal phases.
Four seizures arose during wakefulness from the anterior left hippocampal electrodes ld1, ld2, and left subtemporal electrode lst1 as determined by standard visual interpretation. All ictal onsets appeared as an abrupt appearance of rhythmic polyspike activity with a frequency >12 Hz (31). Seizures 1 (Sz1, 51-s duration) and 2 (73 s) were SCSz. Seizures 3 (164 s) and 4 (232 s) were CSz with clinical onsets 22 s and 19 s after electrographic onset.
The EEG channels and dynamical features of the synchrony measures (group orders, phase synchrony, Synchronization Index) for a typical subclinical seizure are shown in Fig. 5. Here the electrodes ld1, ld2, and lst1 were selected with the use of standard clinical criteria based on the inspection of the EEG (Fig. 5 a) showing seizure activity.
Figure 5.
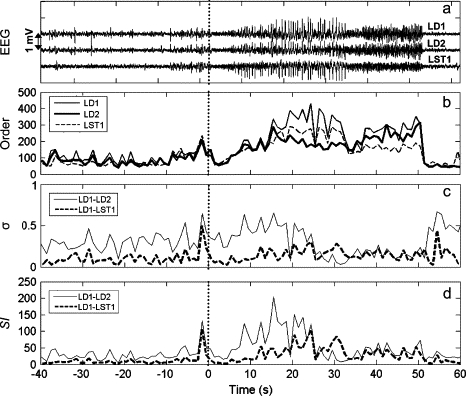
EEG and synchrony measures for pairs of intrahippocampal and subtemporal electrodes (chosen by visual analysis of EEG) during subclinical seizure. (a) EEG. (b) Group orders. (c) Measure of phase synchrony, σ. (d) Synchronization Index. Vertical dashed lines denote the electrographical onset of seizures as determined by standard clinical criteria (30).
First, let us consider only the left depth electrodes ld1 and ld2. After the seizure onset (t = 0 s) the group orders r1 and r2 (Fig. 5 b) exhibit an increase with a relatively slow buildup; the elevated values of the groups orders suddenly drop at ∼t = 50 s. The phase synchrony, σ, displays a somewhat elevated value at the onset, then drops to low values halfway through the seizure (t = 25 s), and increases abruptly at seizure termination to a slightly larger value than in the preictal periods. The slow buildup and sudden drop of group orders and the nontrivial variation of phase synchrony σ indicate the complexity of seizure dynamics; the seizure initiation, propagation, and termination most likely cannot be understood with a single measure of synchrony but rather with a combination of measures. The synchronization index SI for ld1-ld2, shown in Fig. 5 d, rises at the onset of synchrony indicating strong synchrony induction among the electrode pairs and drops (due to the loss of phase synchrony) after t = 25 s. (This initial rise of SI is mostly attributed to the sudden increase of the amplitude of the two signals and the σ-value keeps relatively large values with only a slight increase.) These results imply that induced synchrony between the electrode pairs may play an important role at the onset of seizure, but could be less important in seizure termination. Distinct from the other synchrony measures, the SI exhibits a peaklike behavior implying that it could be a good measure for characterizing seizure in its fully developed, most characteristic phase.
For comparison, the corresponding measures are also shown for the left subtemporal electrode lst1. Although the group order exhibits a very similar trend to those of ld1 and ld2 (Fig. 5 b), because of the increase of phase synchrony during the seizure, the SI value between ld1 and lst1 peaks at ∼25 s after the seizure onset, i.e., ∼10 s later than for electrodes ld1-ld2 (Fig. 5 d). Therefore, SI indicates that in the considered case the major induction of synchrony appears within the hippocampus (electrodes ld1 and ld2) whereas a weaker linkage is present between the hippocampus and the immediate subtemporal cortex (electrode lst1).
Since the SI exhibits a marked increase at the onset of seizure, it has the potential for objectively localizing the focus of the seizure. The method should not rely on the visual preselection of the electrodes, therefore, we calculated SI for every electrode pair for each one-second window of the time series for all the four seizures. For each seizure at each time, we picked the electrode pair that exhibits the largest SI value. Fig. 6 shows the occurrence rate of electrode pairs sharing the maximum SI for each one-second epoch during the first 30 s of the ictal portion of all the four recorded seizures. Maximum SI occurred most frequently between intrahippocampal electrodes ld1 and ld2. Electrode ld1, within the hippocampal head, was the most frequently paired electrode displaying maximum synchrony in relation to either ld2 or subtemporal electrode lst1 in 46.0% of the ictal epochs. The electrodes that manifested the most frequently paired maximum ictal SI, ld1, and ld2 within the anterior hippocampus coincided with those regions determined as the location of seizure foci by visual examination of the EEG.
Figure 6.
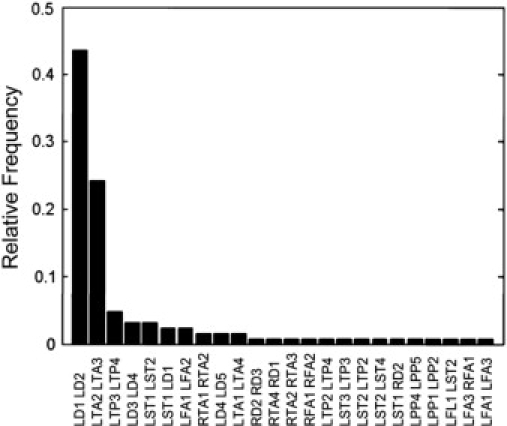
Distribution of the electrode pairs with maximum SI during 1-s epochs for the ictal portion of all seizures.
For a visual demonstration of the seizure dynamics, we calculated SI for the electrodes with electrode ld1 within the hippocampal head as the “base electrode” in 10-second epochs. The temporal profiles of SI between electrode ld1 and the electrodes with which it shares maximum SI (this electrode can change) within 10-s epochs are shown for two electrographic (Seizures 1 and 2, SCSz; Fig. 7 a) and two clinical seizures (Seizures 3 and 4, CSz; Fig. 7 b).
Figure 7.
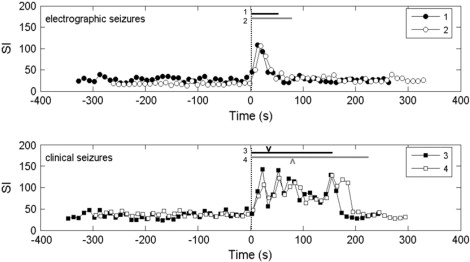
Maximum SI between the left hippocampal depth electrode within the hippocampal head (ld1) and the electrode with maximum SI within a serial 10-s epochs for electrographic (top) and clinical-electrographic (bottom) seizures. (The paired electrode can change with time.) Bars labeled by seizure number indicate duration of electrographic seizure. The character V indicates the time of clinical seizure onset in seizures 3 and 4.
The temporal profiles of maximum SI differed markedly between SCSz and CSz but remained similar within each group. During SCSz, SI was limited to brief (∼30 s) burst at the time of visual onset. In contrast, maximum SI at the onset of CSz varied between seizures, in one case bursting to a high SI (seizure 3) and in the other seizure, remaining closer to baseline. Maximum SI, however, remains at a high value ∼4–5 times of the preictal values for the duration of each CSz. SI abruptly dropped with cessation of clinical and electrographic seizure activity. The timing of clinical onset appears to have no clear relationship to the timing of maximal SI except that clinical onset occurs at SI values well above baseline, preictal SI values.
Fig. 8 shows the averaged maximal SI data within preictal, ictal, and postictal blocks for the four seizures with electrode ld1 as the base electrode (i.e., data from Fig. 7). Comparison of mean maximal SI values reflected findings observed above. Two-way ANOVA (Table 1) confirmed that maximal SI differed among seizure types and among pre-, ictal, and postictal blocks. Maximal SI during the ictal samples were significantly greater in CSz than in SCSz, whereas pre- and postictal SI were similar among seizures.
Figure 8.
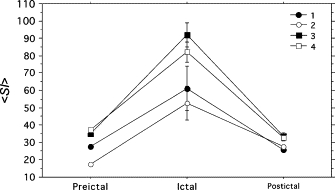
Mean ± SE of the SI (data from Fig. 7) by seizure and preictal, ictal, and postictal portions of seizures.
Table 1.
Two-way ANOVA of mean maximum synchrony index values within 10-s epochs compared among seizures and seizure portion (pre, ictal, and postictal)
| Variable | F | P |
|---|---|---|
| Full interaction seizures and seizure stage | ||
| 4.37 | 0.0003 | |
| Comparison by seizures | ||
| 21.406 | <0.0001* | |
| Post hoc | ||
| ESz 1 versus 2 | 0.12 | |
| CSz 1 versus 2 | 0.25 | |
| ESz versus CSz | <0.0001* | |
| Comparison by seizure stage (preictal, ictal, postictal) | ||
| 146 | <0.0001* | |
| Post hoc | ||
| Preictal versus ictal | <0.0001* | |
| Preictal versus postictal | 0.54 | |
| Ictal versus postictal | <0.0001* |
Post hoc analyses via Bonferroni/Dunn test.
Denotes significance level p < 0.05.
Discussion
The main findings of the article are: first, a synchronization index (SI) characterizing overall order has been developed based on a model for weakly interacting groups of oscillators; and second, this measure facilitates clinically relevant evaluation of a well-characterized syndrome of human epilepsy as applied to a single case study.
The theory of synchronization of two interacting oscillators or a population of all-to-all coupled oscillators with weak interactions is relatively well known (14); however, the characterization of the extent of synchrony in a population of an oscillator network (such as present in normal and pathological brain activity) is a difficult task. In this article, we considered a first step on the route from global to complex network coupling: we studied two interacting groups. We have shown with phase model simulations that the traditional Kuramoto order (21) (for a globally coupled population) can be modified to take into account the possibility of out-of-phase entrainment between the two groups. We have also shown that a synchronization index can be constructed that combines inter- and intragroup synchrony measures; this synchrony measure was shown to characterize synchrony induced in the oscillator population due to intergroup interactions.
Focal-onset epileptic seizures consist of a region of hypersynchronous brain activities that, in turn, spread to involve different brain regions (2). We expect the synchronization index to be a useful measure for seizure activities associated with induced synchrony between brain regions. The application of SI was based on an assumption that the neurons below each EEG electrode are densely (all-to-all) coupled, and the interaction between groups is through their mean field; this can be different from the interaction among the elements inside the groups. Such an oversimplified but not unrealistic (32) assumption enables us to investigate the role of neural synchrony at both local and global levels. The SI attains a large value if both electrodes exhibit large amplitude oscillations (local synchrony) and these oscillations have a fixed phase difference (remote synchrony).
Previous EEG analyses evaluated local and remote synchrony separately (1,4,6–8,11–13,15,17–20,33,34); our findings indicate that a proper combination of these measures could better capture the nature of the medical term “pathological hypersynchrony” (2). A purely mathematical combination of the measures (16) with multivariate linear discrimination was developed for a successful identification of seizure onset and termination. Our approach combines synchrony measures into a synchrony index based on physical arguments stemming from models of weakly interacting networks of oscillator populations.
The motivation for using an efficient synchrony measure in EEG signals is to obtain an objective methodology for medical applications, for example, for investigations in the initiation, recruitment, pattern stability, and termination (both spontaneous and induced) of oscillatory behavior. In this report, we demonstrated that maximal SI objectively identifies the region of seizure onset as determined by traditional visual examination. Thus, SI may yield a means of objective localization of seizure onset, an important task in the process of human epilepsy surgery. We also demonstrated that the intensity and anatomic and temporal pattern of SI differs with clinical symptoms and the severity of EEG involvement in this case of MTLE. For example, hippocampal-onset seizures without clinical symptoms have large SI values confined to the ipsilateral hippocampus. The intensity of induced synchrony within the region of onset is significantly higher in seizures with clinical symptoms. The differentiation of subclinical from clinical seizures in this study is important, considering that the presence of subclinical seizures during epilepsy monitoring with intracranial electrodes is associated with subsequent good surgical outcome (35). A striking difference in seizure-free outcome in those undergoing temporal lobectomy was seen in those with subclinical seizures and auras (80%) and those without (29%) (35). In this light, differences in the characteristics of SI, either between subclinical and clinical seizures, or among subtypes of clinical seizures, may yield additional, useful prognostic information. Of course, these pilot findings must be verified to determine the value of the measurement in seizure detection, localizing ability, and association with later surgical outcome.
Some limitations of the use of SI in the characterization of neural synchrony could be addressed with further improvment of the methodology. We used a broad-frequency approach: the EEG signal was not filtered for a particular frequency band. As both local and long-range synchronies may be affected by the frequency components (36), we expect that filtering, wavelets (7,37), or the application of Gaussian phase (38) for dominant frequency component of a particular seizure could improve the estimation of the SI index. However, blind application of such filters may hinder synchrony features; thus, it may be that in applications a compromise shall be made between the generality of the broad frequency approach and the improved quality of the decomposed signal due to elimination of noisy and less important frequency components.
Other limitations stem from the realities of undertaking human investigations. For example, the calculation of SI with standard EEG recordings with macroelectrodes was made possible with the assumption that local synchrony is proportional to the amplitude of the EEG signal. However, there are some factors, such as amplitude of the local spiking, alignment of dipole fields, as well as the different size and impedance of intraparenchymal versus subdural electrodes, that could make the evaluation of the local synchrony inaccurate by considering amplitudes only (1,2). From a synchronization perspective, the EEG techniques could be improved by refined measurements with the use of concurrent macro-, micro-, and ultramicro-electrodes (39). Such measurements could better serve the evaluation of network synchronization that occurs regionally and relates it to activity in different brain regions from cellular through multicellular to tissue levels.
Acknowledgments
We thank Yasumasa Nishiura for his hospitality and Yoshiki Kuramoto for stimulating discussions.
This work was supported in part by the National Science Foundation.
Footnotes
Editor: Herbert Levine.
References
- 1.Uhhaas P.J., Singer W. Neural synchrony in brain disorders: relevance for cognitive dysfunctions and pathophysiology. Neuron. 2006;52:155–168. doi: 10.1016/j.neuron.2006.09.020. [DOI] [PubMed] [Google Scholar]
- 2.Kandel E.R., Schwartz J.H., Jessel T.M. McGraw-Hill; New York: 2000. Principles of Neural Science. [Google Scholar]
- 3.Litt B., Echauz J. Prediction of epileptic seizures. Lancet Neurol. 2002;1:22–30. doi: 10.1016/s1474-4422(02)00003-0. [DOI] [PubMed] [Google Scholar]
- 4.Van Quyen M.L., Navarro V., Martinerie J., Baulac M., Varela F.J. Toward a neurodynamical understanding of ictogenesis. Epilepsia. 2003;44:30–43. doi: 10.1111/j.0013-9580.2003.12007.x. [DOI] [PubMed] [Google Scholar]
- 5.Rampp S., Stefan H. Fast activity as a surrogate marker of epileptic network function? Clin. Neurophysiol. 2006;117:2111–2117. doi: 10.1016/j.clinph.2006.02.023. [DOI] [PubMed] [Google Scholar]
- 6.Qu H., Gotman J. A seizure warning system for long-term epilepsy monitoring. Neurology. 1995;45:2250–2254. doi: 10.1212/wnl.45.12.2250. [DOI] [PubMed] [Google Scholar]
- 7.Osorio I., Frei M.G., Wilkinson S.B. Real-time automated detection and quantitative analysis of seizures and short-term prediction of clinical onset. Epilepsia. 1998;39:615–627. doi: 10.1111/j.1528-1157.1998.tb01430.x. [DOI] [PubMed] [Google Scholar]
- 8.Jouny C.C., Franaszczuk P.J., Bergey G.K. Characterization of epileptic seizure dynamics using Gabor atom density. Clin. Neurophysiol. 2003;114:426–437. doi: 10.1016/s1388-2457(02)00344-9. [DOI] [PubMed] [Google Scholar]
- 9.Babloyantz A., Destexhe A. Low-dimensional chaos in an instance of epilepsy. Proc. Natl. Acad. Sci. USA. 1986;83:3513–3517. doi: 10.1073/pnas.83.10.3513. [DOI] [PMC free article] [PubMed] [Google Scholar]
- 10.Lehnertz K., Elger C.E. Can epileptic seizures be predicted? Evidence from nonlinear time series analysis of brain electrical activity. Phys. Rev. Lett. 1998;80:5019–5022. [Google Scholar]
- 11.Moser H.R., Weber B., Wieser H.G., Meier P.F. Electroencephalograms in epilepsy: analysis and seizure prediction within the framework of Lyapunov theory. Physica D. 1999;130:291–305. [Google Scholar]
- 12.Mormann F., Andrzejak R.G., Elger C.E., Lehnertz K. Seizure prediction: the long and winding road. Brain. 2007;130:314–333. doi: 10.1093/brain/awl241. [DOI] [PubMed] [Google Scholar]
- 13.Dominguez L.G., Wennberg R.A., Gaetz W., Cheyne D., Snead O.C., Velazquez J.L.P. Enhanced synchrony in epileptiform activity? Local versus distant phase synchronization in generalized seizures. J. Neurosci. 2005;25:8077–8084. doi: 10.1523/JNEUROSCI.1046-05.2005. [DOI] [PMC free article] [PubMed] [Google Scholar]
- 14.Pikovsky A.S., Rosenblum M.G., Kurths J. University Press; Cambridge: 2001. Synchronization: A Universal Concept in Nonlinear Science. [Google Scholar]
- 15.Quiroga R.Q., Kraskov A., Kreuz T., Grassberger P. Performance of different synchronization measures in real data: a case study on electroencephalographic signals. Phys. Rev. E Stat. Nonlin. Soft Matter Phys. 2002;65:041903. doi: 10.1103/PhysRevE.65.041903. [DOI] [PubMed] [Google Scholar]
- 16.Schiff S.J., Sauer T., Kumar R., Weinstein S.L. Neuronal spatiotemporal pattern discrimination: the dynamical evolution of seizures. Neuroimage. 2005;28:1043–1055. doi: 10.1016/j.neuroimage.2005.06.059. [DOI] [PMC free article] [PubMed] [Google Scholar]
- 17.Le van Quyen M., Martinerie J., Navarro V., Baulac M., Varela F.J. Characterizing neurodynamic changes before seizures. J. Clin. Neurophysiol. 2001;18:191–208. doi: 10.1097/00004691-200105000-00001. [DOI] [PubMed] [Google Scholar]
- 18.Netoff T.I., Schiff S.J. Decreased neuronal synchronization during experimental seizures. J. Neurosci. 2002;22:7297–7307. doi: 10.1523/JNEUROSCI.22-16-07297.2002. [DOI] [PMC free article] [PubMed] [Google Scholar]
- 19.Mormann F., Lehnertz K., David P., Elger C.E. Mean phase coherence as a measure for phase synchronization and its application to the EEG of epilepsy patients. Physica D. 2000;144:358–369. [Google Scholar]
- 20.van Putten M. Nearest neighbor phase synchronization as a measure to detect seizure activity from scalp EEG recordings. J. Clin. Neurophysiol. 2003;20:320–325. doi: 10.1097/00004691-200309000-00004. [DOI] [PubMed] [Google Scholar]
- 21.Kuramoto Y. Springer; Berlin: 1984. Chemical Oscillations, Waves and Turbulence. [Google Scholar]
- 22.Watts D.J., Strogatz S.H. Collective dynamics of “small-world” networks. Nature. 1998;393:440–442. doi: 10.1038/30918. [DOI] [PubMed] [Google Scholar]
- 23.Eguiluz V.M., Chialvo D.R., Cecchi G.A., Baliki M., Apkarian A.V. Scale-free brain functional networks. Phys. Rev. Lett. 2005;94:018102. doi: 10.1103/PhysRevLett.94.018102. [DOI] [PubMed] [Google Scholar]
- 24.Kaneko K., Tsuda I. Springer; Berlin: 2001. Complex Systems: Chaos and Beyond: A Constructive Approach with Applications in Life Sciences. [Google Scholar]
- 25.Garcia-Ojalvo J., Elowitz M.B., Strogatz S.H. Modeling a synthetic multicellular clock: repressilators coupled by quorum sensing. Proc. Natl. Acad. Sci. USA. 2004;101:10955–10960. doi: 10.1073/pnas.0307095101. [DOI] [PMC free article] [PubMed] [Google Scholar]
- 26.Montbrio E., Kurths J., Blasius B. Synchronization of two interacting populations of oscillators. Phys. Rev. E Stat. Nonlin. Soft Matter Phys. 2004;70:056125. doi: 10.1103/PhysRevE.70.056125. [DOI] [PubMed] [Google Scholar]
- 27.Okuda K., Kuramoto Y. Mutual entrainment between populations of coupled oscillators. Prog. Theoretical Phys. 1991;86:1159–1176. [Google Scholar]
- 28.Tass P., Rosenblum M.G., Weule J., Kurths J., Pikovsky A., Volkmann J., Schnitzler A., Freund H.J. Detection of n: m-phase locking from noisy data: application to magnetoencephalography. Phys. Rev. Lett. 1998;81:3291–3294. [Google Scholar]
- 29.Zhai Y., Kiss I.Z., Daido H., Hudson J.L. Extracting order parameters from global measurements with application to coupled electrochemical oscillators. Physica D. 2005;205:57–69. [Google Scholar]
- 30.Blume W.T., Young G.B., Lemieux J.F. EEG morphology of partial epileptic seizures. Electroencephalogr. Clin. Neurophysiol. 1984;57:295–302. doi: 10.1016/0013-4694(84)90151-2. [DOI] [PubMed] [Google Scholar]
- 31.Wennberg R.A., Quesney L.F., Olivier A. Correlation between mesial temporal and temporal neocortical interictal spiking in acute ECoG and chronic depth electrode recordings. Electroencephalogr. Clin. Neurophysiol. 1998;48(Suppl):123–131. [PubMed] [Google Scholar]
- 32.Buzsaki G., Geisler C., Henze D.A., Wang X.J. Interneuron Diversity series: circuit complexity and axon wiring economy of cortical interneurons. Trends Neurosci. 2004;27:186–193. doi: 10.1016/j.tins.2004.02.007. [DOI] [PubMed] [Google Scholar]
- 33.Lachaux J.P., Rodriguez E., Martinerie J., Varela F.J. Measuring phase synchrony in brain signals. Hum. Brain Mapp. 1999;8:194–208. doi: 10.1002/(SICI)1097-0193(1999)8:4<194::AID-HBM4>3.0.CO;2-C. [DOI] [PMC free article] [PubMed] [Google Scholar]
- 34.Netoff T.I., Pecora L.M., Schiff S.J. Analytical coupling detection in the presence of noise and nonlinearity. Phys. Rev. E Stat. Nonlin. Soft Matter Phys. 2004;69:017201. doi: 10.1103/PhysRevE.69.017201. [DOI] [PubMed] [Google Scholar]
- 35.Sperling M.R., O’Connor M.J. Auras and subclinical seizures: characteristics and prognostic significance. Ann. Neurol. 1990;28:320–328. doi: 10.1002/ana.410280304. [DOI] [PubMed] [Google Scholar]
- 36.Ferri R., Stam C.J., Lanuzza B., Cosentino F.I., Elia M., Musumeci S.A., Pennisi G. Different EEG frequency band synchronization during nocturnal frontal lobe seizures. Clin. Neurophysiol. 2004;115:1202–1211. doi: 10.1016/j.clinph.2003.12.014. [DOI] [PubMed] [Google Scholar]
- 37.Le van Quyen M., Foucher J., Lachaux J.P., Rodriguez E., Lutz A., Martinerie J., Varela F.J. Comparison of Hilbert transform and wavelet methods for the analysis of neuronal synchrony. J. Neurosci. Methods. 2001;111:83–98. doi: 10.1016/s0165-0270(01)00372-7. [DOI] [PubMed] [Google Scholar]
- 38.DeShazer D.J., Breban R., Ott E., Roy R. Detecting phase synchronization in a chaotic laser array. Phys. Rev. Lett. 2001;8704:044101. doi: 10.1103/PhysRevLett.87.044101. [DOI] [PubMed] [Google Scholar]
- 39.Bragin A., Wilson C.L., Staba R.J., Reddick M., Fried I., Engel J. Interictal high-frequency oscillations (80–500Hz) in the human epileptic brain: entorhinal cortex. Ann. Neurol. 2002;52:407–415. doi: 10.1002/ana.10291. [DOI] [PubMed] [Google Scholar]