

Abstract
The plasma membrane-cytoskeleton interface is a dynamic structure participating in a variety of cellular events. Among the proteins involved in the direct linkage between the cytoskeleton and the plasma membrane is the ezrin/radixin/moesin (ERM) family. The FERM (4.1 ezrin/radixin/moesin) domain in their N-terminus contains a phosphatidylinositol 4,5 bisphosphate (PIP2) (membrane) binding site whereas their C-terminus binds actin. In this work, our aim was to quantify the interaction of ezrin with large unilamellar vesicles (LUVs) containing PIP2. For this purpose, we produced human recombinant ezrin bearing a cysteine residue at its C-terminus for subsequent labeling with Alexa488 maleimide. The functionality of labeled ezrin was checked by comparison with that of wild-type ezrin. The affinity constant between ezrin and LUVs was determined by cosedimentation assays and fluorescence correlation spectroscopy. The affinity was found to be ∼5 μM for PIP2-LUVs and 20-to 70-fold lower for phosphatidylserine-LUVs. These results demonstrate, as well, that the interaction between ezrin and PIP2-LUVs is not cooperative. Finally, we found that ezrin FERM domain (area of ∼30 nm2) binding to a single PIP2 can block access to neighboring PIP2 molecules and thus contributes to lower the accessible PIP2 concentration. In addition, no evidence exists for a clustering of PIP2 induced by ezrin addition.
Introduction
The plasma membrane-cytoskeleton interface is a dynamic structure, participating in a variety of cellular events including cell shape and motility, signal transduction, and cell polarization. Among the proteins involved in the linkage between components of the cytoskeleton and the plasma membrane, the proteins of the ezrin/radixin/moesin (ERM) family are recognized as being important regulators in the connection between membrane proteins and the cytoskeleton (1,2,3).
ERM proteins are organized in three distinct domains: i), the N-terminal membrane-binding domain is shared by the ERM proteins and by protein 4.1 and is referred to as the FERM domain (1); ii), an α-helical domain; and iii), the C-terminal actin-binding domain. Ezrin, one member of this family, is largely found in intestinal microvilli and in filopodia (4). Within the cell, ezrin can exist in two different states: either dormant, or inactive, when the N-and C-terminal domains are tightly associated thereby masking the F-actin and membrane binding sites (via intra- or intermolecular association) (5) or open, i.e., active, when the N-terminus is effectively accessible for membrane binding and the C-terminus is accessible for actin binding (Fig. 1).
Figure 1.
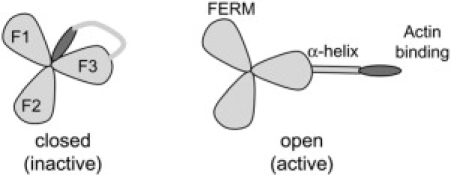
Scheme of the two possible conformations for ERM proteins, (left) inactive (or closed) conformation and (right) open (or active) conformation. The three lobs represent the FERM domain (subdomain A composed of F1, F2, and F3), the long rectangle represents the central helical region (subdomain B), and the C-terminal domain is the actin-binding region (ellipsoid).
The main pathway for activation of ezrin relies on the interaction of ezrin with phosphatidylinositol(4,5)-bisphosphate (PIP2) in the membrane, followed by phosphorylation of the Thr-567 residue in the C-terminal domain, resulting in a conformational change of the protein (1,6,7). The first direct evidence for ezrin binding to PIP2 came from Niggli et al. (8), who demonstrated that the N-terminal domain of ezrin (amino acids 1–309) was necessary and sufficient for interaction with PIP2-containing multilamellar vesicles. In that study, it was shown that ezrin binds preferentially to liposomes containing PIP2 as compared to other lipids such as phosphatidylserine and that this interaction occurred at physiological ionic strength. Under these conditions, ezrin could discriminate between PIP2, phosphatidylinositol-4-monophosphate, and phosphatidylserine (8). Unfortunately, multilamellar vesicles cannot be used for quantitative binding analysis because of their ill-defined geometry.
The first insights into the structural basis for the membrane interaction of ERM proteins via their FERM domain came from the study of Barret et al. (7). These authors demonstrated that the interaction of ezrin with multilamellar vesicles and with cell membrane was almost abolished by mutagenesis of specific residues located in subdomains F1 and F3 of the FERM domain. The second line of evidence came from the determination of the x-ray crystal structure of the radixin FERM domain complexed with IP3 (9). These results revealed the important role of residues in a basic cleft located between subdomains F1 and F3 (9). In addition, it was found that these two subdomains form a relatively flat molecular surface that seems to maximize the interactions with the membrane surface.
In a recent study, Charras et al. demonstrated that, after expansion of a bleb, ezrin was the first protein recruited to the membrane, followed by actin, actin-bundling proteins, and, finally, contractile proteins (10). In addition to its PIP2-dependent location at the plasma membrane, ezrin may be itself involved in the process of membrane deformation. This is suggested by a recent investigation on ezrin with giant unilamellar vesicles, where ezrin and moesin, similarly to protein 4.1, were found to open stable holes in vesicles containing an acidic lipid (11). All these findings suggest that PIP2, which represents ∼10% of all the phosphoinositides species and ∼1% of the total lipid in cell membranes (12), is an important determinant for ezrin morphogenic actions (13,14).
A useful model for investigating protein/lipid interactions is that of large unilamellar vesicles (LUVs) because these objects can be employed to quantitatively determine the association constant of a given protein for a membrane. Several more or less conventional methods are used to achieve this goal, as reviewed by Cho et al. (15). Among them are the quantitative cosedimentation assays using either unlabeled protein (16), radioactive protein or fluorescently labeled protein (17), surface plasmon resonance (18), and more recently fluorescence correlation spectroscopy (19,20).
In this study, our goal was to quantify the binding of ezrin to LUVs by means of cosedimentation assays and fluorescence correlation spectroscopy. In particular, we wanted to quantify the binding of ezrin to LUVs containing PIP2 in comparison with LUVs containing other acidic lipids such as phosphatidylserine (PS) and other phosphoinositides. We also wanted to determine whether the binding is cooperative, and whether PIP2 is relocalized upon binding to ezrin. The influence of the PIP2 content in the membrane upon ezrin binding, both at fixed lipid concentration or at increased lipid concentration were investigated. Experiments were performed with either unlabeled ezrin, or an engineered ezrin bearing a free cysteine residue labeled with Alexa488 maleimide.
Materials and methods
Reagents and buffer
Dimethyl sulfoxyde (DMSO) and dithiothreitol (DTT) were purchased from Sigma (St. Louis, MO). 1-Palmitoyl-2-oleoyl-sn-glycero-3-phosphatidylcholine) (POPC) and 1-palmitoyl-2-oleoyl-sn-glycero-3-phosphatidylserine (POPS) were obtained from Avanti Polar Lipids (Alabaster, AL). The ammonium salt of L-α-phosphatidylinositol(4,5)-bisphosphate (PIP2) was purchased from Lipid Products (Surrey, Great Britain). D-myo-phosphatidylinositol-4-phosphate (PI(4)P), D-myo-phosphatidylinositol-3,4-bisphosphate (PI(3,4)P2), and D-myo-phosphatidylinositol-3,4,5-triphosphate (PI(3,4,5)P3), Bodipy-TMR-PI(4,5)P2, (TMR-PIP2, reference C-45M16a), NBDC16-PIP2 (or NBD-PIP2, reference C-45N16a), Bodipy-FL-PI(4,5)P2 (Bodipy-FL-PIP2, reference C-45F16a) were purchased from Echelon Bioscience (Tebu-Bio, Le Perray en Yvelines, France), rhodamine DHPE from Molecular Probes (Eugene, OR) and α-methoxy-ω-carboxylic acid succinimidyl ester poly(ethylene glycol) (PEG, molecular weight of 5000) from Nektar Therapeutics (Birmingham, AL). The MARCKS (151–175) peptide was kindly provide by Prof. S. McLaughlin from Stony Brook University (Stony Brook, NY). All buffer solutions were prepared with deionized water (resistivity 18.2 MΩ/cm). Ezrin was kept at 4°C in an ezrin buffer containing 70 mM NaCl, 25 mM 2-(N-morpholino)ethanesulfonic acid (MES) at pH 6.2 (MES-NaCl buffer). For the binding experiments using the cosedimentation assay, the vesicles were prepared in a Hepes buffer containing 200 mM sucrose, 20 mM HEPES, 0.5 mM EGTA at pH 7.4 (Hepes-sucrose buffer). All other binding experiments (including fluorescence correlation spectroscopy (FCS) experiments) were performed in a Hepes buffer containing 100 mM KCl, 20 mM HEPES, 0.5 mM EGTA at pH 7.4 (Hepes-KCl buffer). For pegylation, PEG was dissolved in sodium borate 0.1 M at pH 8.5 (borate buffer).
Protein expression and purification
The expression and purification of wild-type (WT) ezrin cloned in the pGEX 2-T vector have already been described (21). Ezrin has only two cysteine residues that are indeed inaccessible. Thus, for labeling ezrin with a fluorescent maleimide derivative, an additional cysteine was added at the C-terminal of the molecule after two extra glycine residues (GGC). The quick change site-directed mutagenesis kit from Stratagene (Stratagene Europe, Amsterdam, The Netherlands) was used for this purpose. Constructions were verified by sequencing. Both wild-type ezrin and ezrin-cysteine were obtained using the same purification procedure. The diameter of ezrin and of ezrin-cysteine in the MES-NaCl buffer were measured using a Malvern nanosizer (Malvern, Worcestershire, UK).
Ezrin labeling
Labeling of ezrin-cysteine was performed using Alexa488-C5-maleimide (Molecular Probes). Purified ezrin conserved in MES-NaCl buffer was treated with a 10-fold molar excess of Alexa488-C5-maleimide (dissolved in 10 μl DMSO) for 1 h and 30 min at room temperature in ezrin buffer. The labeling reaction was subsequently quenched by adding an excess amount of DTT and the labeled protein was separated from the reagents using a Sephadex G25 column (GE Heathcare, France) eluted with the MES-NaCl buffer. The labeling efficiency of ezrin was estimated by determining the respective molar concentration of dye and of protein (molar absorptivity of Alexa488 at 495 nm is ɛ = 72,000 M−1 cm−1 and molar absorptivity of ezrin at 280 nm is ɛ = 69,000 M−1) and calculating the grafting ratio. Under our labeling conditions, ∼0.93 mol of Alexa488 was incorporated per mol of ezrin.
Vesicle preparation
LUVs were prepared by drying the appropriate lipid mixture in a Speedvac rotary evaporator overnight, hydrating the lipids in the Hepes-KCl buffer for 2 h at 37°C (interrupted by rigorous vortexing every quarter of hour), then extruding the multilamellar vesicles through a stack of two polycarbonate filters (100-nm pore size diameter, 21 passages) using the miniextruder from Avanti Polar Lipids (22). LUVs were extruded and stored at high concentration (14 mM, total lipid concentration or 7 mM accessible lipid concentration; taking into account that only the outermost layer of the bilayer membrane is accessible) for no more than 2 weeks. Final concentrations of lipids were measured using the Phospholipid B kit (Wako Chemicals GmbH, Neuss, Germany) and were within 90–95% of the expected concentration.
ξ-Potential measurements
The homogeneity in size and in charge of the vesicles was checked, respectively, by diffusion light scattering (DLS) and by ζ-potential measurements on a Malvern Zeta Sizer NanoZS (Malvern). The electrophoretic mobility of LUVs was measured at low vesicle concentration in a 50 mM KCl, 2 mM Hepes, 0.5 mM EGTA buffer at pH 7.4 and the ξ-potential, which is the electrostatic potential at the shear plane, was calculated using the Helmholtz-Smoluchowski (Eq. 1) (23):
| (1) |
where ξ is the ζ-potential of a vesicle (in mV); u is the velocity of the vesicle in a unit electric field; η is the viscosity of the aqueous solution; ɛR is the dielectric constant of the aqueous solution; and ɛ0 is the permittivity of free space. The ξ-potential is proportional to the surface charge density (23). Results are given as mean ± SD of 20 measurements on the same sample.
Cosedimentation assays
Ezrin affinity for phospholipids was determined by sedimentation assays with sucrose loaded LUVs. LUVs were dialyzed using a microdialyzer (Pierce, Rockford, IL) against Hepes-KCl buffer or, when possible, they were directly diluted in the Hepes-KCl buffer. The cosedimentation assays were achieved by varying the concentration of total lipids or, for a fixed lipid concentration, varying the percentage of PIP2 in the LUVs. For these experiments, ezrin concentration was kept constant at 400 nM. In another set of experiments, ezrin concentration was varied over a large range (from tens of nanomolars to tens of micromolars) but lipid concentration was fixed to a certain value. After incubation for 15 min at room temperature, the 100-μl samples were centrifuged at 223,000 × g for 1 h at 4°C using the 42.2Ti rotor (Beckman Coulter, Roissy, France). The top 80 μl of each sample were removed and considered as supernatant (SN); 8 μl of Triton X100 and 52 μl of KCl buffer were added to resuspend the pellet (P). For experiments with labeled ezrin, SN and P intensities were directly read in a 50-μl microcuvette using the LS55 spectrofluorimeter (Perkin Elmer, Waltham, MA) with excitation and emission slits set, respectively, at 488 and 519 nm (±2.5 nm). Alternatively, for experiments performed using unlabeled ezrin, SN and P were analyzed on a 10% SDS-PAGE, transferred on an Immobilon-P transfer membrane (Millipore, Molsheim, France) and the membrane stained using Coomassie blue for quantification. Membranes were scanned and images were analyzed using Image J 1.36b (National Institutes of Health, Bethesda, MD) (the mean density of each band was background corrected and we checked that band intensities were in the linear range of the scanner). Since 20 μl of the supernatant were counted as pellet and since the supernatant and pellet resuspension volume were identical, the true pellet intensity was calculated using the formula: IPellet = IP - 0.25ISN, where IP and ISN are the intensity of the pellet and supernatant, respectively. The corresponding percentage of ezrin bound was deduced (percentage of ezrin bound is IPellet / (IP + ISN)).
Affinity determination
The binding of protein to lipid bilayers can be described by defining an apparent association constant, K, as described previously (24). K is the proportionality constant between the fraction of proteins bound to the membrane, [Ez]B, and the molar concentration of the protein in the bulk aqueous phase, [Ez]F.
The fraction of ezrin bound is given by:
| (2) |
where [Ez]T is total ezrin and [PIP2]acc is the accessible PIP2 concentration. It is assumed here, in a first approximation, that all PIP2 on the outer leaflet is accessible. The association constant K deduced from Eq. 2 is the reciprocal of the apparent dissociation constant, which is often called the affinity constant Kd.
Fluorescence correlation spectroscopy measurements
Fluorescence correlation spectroscopy measurements were carried out on a two-photon FCS setup. Excitation was carried out with a tunable femtosecond infrared titanium sapphire laser (MaiTai from Spectra-Physics, Newport, Irvine, CA) set at 780 nm and 15 mW with a polarizing beamsplitter and one-half wave-plate (Karl Lambrecht, Chicago, IL). The excitation light was coupled to a Zeiss (Jena, Germany) Axiovert 200 M microscope, reflected by a Chroma (Rockingham, VT) 700DCSXR dichroic mirror, and focused onto the sample with a Zeiss Apochromat 63× 1.4 NA immersion objective. Emitted photons were detected through an infrared blocking filter (Chroma 700SP) with a dual channel ISS ALBA fluorescence correlation detector with avalanche photodiodes, with a Chroma Q565LP dichroic mirror to separate the red and green emissions, and a Chroma HQ610/75 and HQ525/50 bandpass filter for the two channels (rhodamine and Alexa 488, respectively). To prevent nonspecific adsorption of ezrin, PEGylation of the glass slide (thickness 170 μm) was performed following a protocol that has been described elsewhere (25) using Vectabond in a first step and PEG-succinimidyl ester in a second step. A silicone insulator (P24742, Molecular Probes) glued to the glass slides was used to prepare several wells, which were filled with 10 μl of sample. For all the FCS measurements, 10 μl of sample was deposited in each well. For the ezrin/LUVs interactions studies, ezrin-Alexa488 was used because Alexa488 is an excellent fluorophore for FCS measurements: it has low triplet state excitation, a high quantum yield, and high photostability (26). Also, attaching a rather hydrophilic fluorophore should not significantly affect the molar partition coefficient of the protein, in contrast to what was observed for hydrophobic fluorescent probes (like Texas red) attached to small peptides (27). For each experimental condition, the fluorescence fluctuation signal (i.e., the fluorescence signal detected in the small open volume defined by two-photon excitation probability) was measured at seven different locations in each well, for the labeled protein alone (15 nM) and for samples containing ezrin in contact with LUVs at increasing lipid concentration. The intensity fluctuations are time correlated to generate an autocorrelation function G(τ), defined as:
| (3) |
with τ being the lag time. Generally the fluorescence fluctuations can be considered to arise from concentration fluctuations within the effective volume, and a translational diffusion time, τd, can be extracted from the autocorrelation profile:
| (4) |
where N is the average number of molecules in the observation volume, and r0 and z0 the waist and height of the volume that are given by the three-dimensional Gaussian expression for the intensity profile:
| (5) |
The effective volume was calibrated from measurements using 60 nM fluorescein assuming a diffusion coefficient 300 μm2/s in terms of the volume derived from the intensity profile (the point-spread function), Vpsf, such that:
| (6) |
where 〈C〉 is the mean concentration of molecules and γ a factor. It provides a measure of the uniformity of the fluorescence intensity observed for molecules at different positions within the volume and the abruptness of the boundaries. Its value is taken to be ∼0.7.
In the case of the ezrin/LUVs system, the autocorrelation function can be analyzed in terms of the diffusion times of the bound and free species, and their respective fractional populations.
| (7) |
where Ff and Fb are the fractions of the free and bound species, respectively, and τdf and τdb their respective diffusion times. Data analysis was performed with the ISS Vista software. This program uses a Marquardt-Levenberg minimization algorithm and the goodness of the fittings can be judged by the recovered χ2. The series of autocorrelation curves were pooled (one curve for each lipid concentration) and were globally analyzed (linked analysis) with two diffusion coefficients (one for the free protein, one for the bound protein) (28). This analysis yielded the percentage of bound ezrin, which was finally plotted as a function of the total accessible PIP2 concentration for determination of the dissociation constant (Eq. 2). All experiments were performed at least three times with different LUVs and ezrin preparations.
Fluorescence quenching experiments
Self-quenching was measured using the LS55 spectrofluorimeter (Perkin Elmer, Courtaboeuf, France). Two different probes (NDB, excitation 472 nm/emission 529 nm, and Bodipy-TMR, excitation 547 nm/emission 570 nm) were used. The emission intensities were collected as unlabeled ezrin was added to the solution containing the LUVs. The following equation was used to calculate the percentage of quenching:
| (8) |
where Ip is the intensity of fluorescence emitted from labeled LUVs in the presence of ezrin, and I0 is the intensity of fluorescence emitted from labeled LUVs in the absence of ezrin. The quenching experiments were performed with vesicles containing fluorescent lipids present at the maximal molar fractions that did not exhibit appreciable self-quenching (4% for NBD lipids and 1% for Bodipy-TMR PIP2 in the LUVs). This amount of self-quenching due to the proximity of neighboring NBD lipids was determined by comparing the fluorescence intensity of LUVs containing increasing percentages of NBD lipids (from 0 to 6% of NBD-PC) and of the same lipids after perturbation of the LUVs membrane by addition of 1% Triton X100. The total lipid concentration was 40 μM for 99:1 PC/TMR-PIP2 and 30 μM for 96:4 PC/NBD-PIP2 LUVs, respectively. These concentrations are sufficiently high to bind up to 70% of PIP2 when ezrin concentration is ∼6 μM.
Results
Preparation of LUVs containing various amounts of PI(4,5)P2 and containing other phosphoinositides
The homogeneity in size and in charge of the vesicles was checked, respectively, by diffusion light scattering measurements (data not shown) and by ζ-potential measurements. As PIP2 is highly negatively charged, the lowering in the ζ-potential was measured when PIP2 concentration is increased in the LUVs. The ζ-potential of LUVs containing an increasing percentage of PIP2 is shown in Fig. 2. It steadily decreases when the mass percentage of PIP2 is increased, suggesting a uniform distribution of PIP2 in the vesicles for the different preparations. This is a proof for the effective incorporation of PIP2 in the LUVs in proportion to the percentage initially incorporated in the lipid mixture before the dehydration step. Indeed, the effective incorporation of the other phosphoinositides (respectively PI(4)P, PI(3,4)P2, and PI(3,4,5)P3) and of PS was confirmed by ζ-potential measurements on LUVs containing either 5% of the phosphoinositides and 20% of PS (see Table 2). As expected based on the molecular structures of the phosphoinositides headgroups, the ζ-potentials are in the order PI(3,4,5)P3 < PI(3,4)P2 ∼ PIP2 < PI(4)P and LUVs containing 5% of PIP2 are slightly less negative than those containing 20% of PS (−24.5 mV as compared to −27.7 mV). This is in agreement with previous reports on ζ-potential of multilamellar vesicles containing PS (29) and PIP2 (30).
Figure 2.
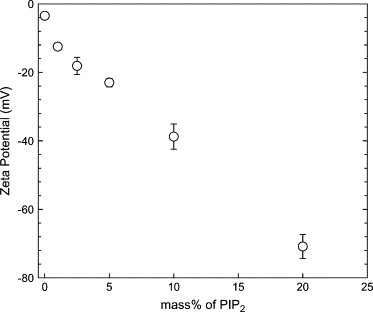
ζ-Potential of unilamellar vesicles as a function of the mass percentage of PIP2 in the LUVs. The electrophoretic mobility of the LUVs was measured and the ζ-potential was calculated according to Eq. 1. The ± SEs are calculated from 20 measurements on each sample.
Table 2.
Dissociation constants (Kd) expressed in terms of accessible acidic phosphospholipid (mean of two independent experiments ± SD) and measured by the cosedimentation assay using ezrin-Alexa488 or by fluorescence correlation spectroscopy
| ζ-potential (mV) | Kd (μM) Cosedimentation | Increase in Kd (fold) | Kd (μM) FCS | Increase in Kd (fold) | Cellular abundance (of all PI species) | |
|---|---|---|---|---|---|---|
| 20% PS | −27.7 ± 1.8 | 63.8 ± 10.5 | 16 | 580 ± 57 | 94 | – |
| PI(4,5)P2 | −24.5 ± 0.5 | 4.0 ± 0.5 | 1 | 6.2 ± 0.8 | 1 | ∼10%* |
| 5% PIP2 | NA | 4.2 ± 0.4 | 1.1 | 3.3 ± 0.8 | 0.5 | |
| 20% PS/5% PIP2 | NA | 4.1 ± 0.5 | 1.0 | NA | − | |
| 15% chol/5% PIP2 | ||||||
| 5% PI(4)P | −17.6 ± 1.6 | 13.1 ± 0.6 | 3.3 | 31.5 ± 9.4 | 5.1 | ∼10%* |
| 5% PI(3,4)P2 | −25.6 ± 1.2 | 5.3 ± 0.7 | 1.3 | 23.5 ± 5.6 | 3.8 | <0.15% |
| 5% PI(3,4,5)P3 | −30.5 ± 1.5 | 5.6 ± 0.7 | 1.4 | 9.6 ± 1.1 | 1.5 | <0.15% |
The ζ-potential of the LUVs is also given; NA, not available.
Values taken from Pendaries et al. (62).
Quantification of ezrin binding to PIP2 using cosedimentation assays
We determined the dissociation constant, expressed in terms of accessible acidic phospholipid (Kd), for the interaction between ezrin and LUVs of varying acidic phospholipid content. In a first set of experiments, quantitative cosedimentation assays on ezrin were performed. The concentration of protein (400 nM) was chosen to ensure: i), that the binding sites on the LUVs were not saturated; ii), that the ratio of protein to lipids is low; and iii), that the detection levels on stained membranes or via spectrofluorimetry were adequate. The experiments were performed with LUVs composed of phosphatidyl choline (PC) and the acidic phospholipid PIP2 or phosphatidyl serine (PS), PIP2 having a higher negative charge per molecule than PS (about −3 for PIP2 versus −1 for PS (30)). For WT ezrin, supernatant, and pellets were analyzed by SDS-PAGE followed by transfer on membranes, staining, and subsequent image analysis. Typical images of membranes representing the pellets and the supernatants of the PC/PIP2 LUVs (95:5) that have been cosedimented with ezrin (400 nM) are shown in Fig. 3 A for increasing accessible lipid concentration (from 10 μM to 2.2 mM). In Fig. 3 B, the percentage of ezrin bound is represented as a function of the accessible acidic lipid concentration for LUVs containing either PIP2 at 5% or PS at 20%. For comparison, LUVs made of pure PC are also shown. The binding of ezrin to LUVs increases when the concentration of LUVs is increased. The fit of the experimental data using Eq. 2 leads to Kd = 5.9 ± 0.7 μM for LUVs containing 5% PIP2 and 47.3 ± 8.3 μM for LUVs containing 20% PS, which is an approximately eightfold lower affinity (Table 1). Ezrin interaction with PC LUVs is negligible.
Figure 3.
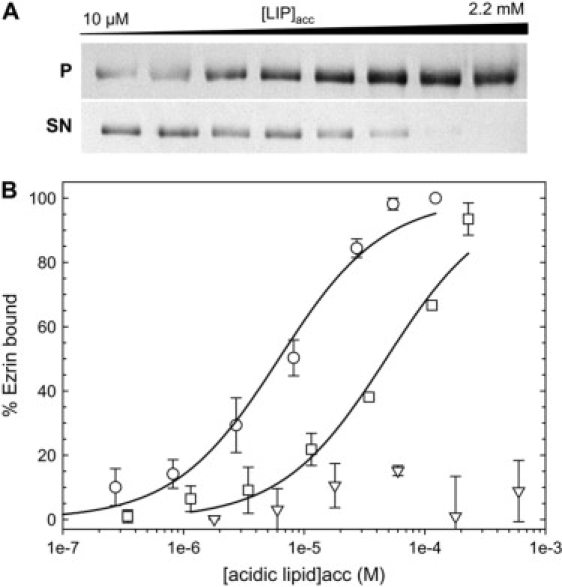
Binding of wild-type ezrin to LUVs as measured by the cosedimentation assay. Pellet and supernatants were migrated on gels and then transferred to membranes, stained with Coomassie blue for visualization and quantification. (A) Images of the membranes corresponding to the binding of ezrin to 95:5 PC/PIP2 LUVs (from left to right, increasing accessible lipid concentration from 10 μM to 2.2 mM); P corresponds to the pellet and SN to the supernatant. Ezrin was kept constant at 400 nM. (B) The percentage of ezrin bound is represented at different acidic lipid concentrations (○) (PC/PIP2, 95:5), x axis is the PIP2acc concentration; (□) (PC/PS, 80:20), x axis is the PSacc concentration; (▽), PC 100%, x axis is the accessible lipid concentration. The curves are the least squares fits of Eq. 2 to the data, which yield the value for the molar partition coefficient K from which the affinity constant Kd (Kd = 1/K) can be deduced (points are mean ± SD of three independent experiments).
Table 1.
Dissociation constants (Kd) expressed in terms of accessible acidic phosphospholipid (mean of three independent experiments ± SD) and measured by three different types of assay
| Lipid composition | Cosedimentation using WT ezrin (membrane staining) | Cosedimentation using ezrin-Alexa488 (spectrofluorimetry) | Fluorescence correlation spectroscopy | |||
|---|---|---|---|---|---|---|
| Kd (μM) | Increase in Kd (fold) | Kd (μM) | Increase in Kd (fold) | Kd (μM) | Increase in Kd (fold) | |
| 5% PIP2 | 5.9 ± 0.7 | 1 | 4.0 ± 0.5 | 1 | 6.2 ± 0.8 | 1 |
| 20% PS | 47.3 ± 8.3 | 8 | 63.8 ± 10.5 | 16 | 580 ± 57 | 94 |
| 20% PS/5% PIP2 | NA | – | 4.2 ± 0.4 | 1.1 | 3.3 ± 0.8 | 0.5 |
Ezrin-cysteine was used as well for analysis on membranes and results show that both type of ezrin present similar behavior, which indicated the mutation does not interfere with the binding of ezrin to the vesicles (see Supplementary Fig. S1). The binding of ezrin-Alexa488 to LUVs as measured by the cosedimentation assay followed by spectrofluorimetry analysis is represented in Fig. 4. By this method, we found that ezrin-Alexa488 binds to LUVs composed of PC and 5% PIP2 with Kd = 4.0 ± 0.5 μM and to LUVs composed of PC and 20% PS with Kd= 63.8 ± 10.5 μM, which is ∼16-fold lower affinity (Table 1). Thus, WT ezrin and ezrin-Alexa488 were found to behave similarly as these data are in good agreement with those obtained by cosedimentation and analysis on membrane. This also quantitatively confirms the previous finding that ezrin has binding specificity for PIP2 over PS (8).
Figure 4.
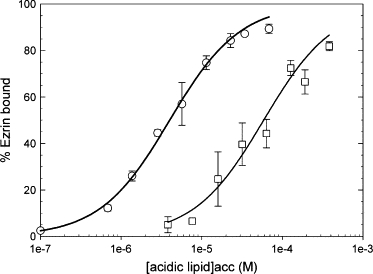
Binding of ezrin-Alexa488 to LUVs as measured by the cosedimentation assay followed by spectrofluorimetric analysis. The fluorescence of the pellet and supernatants were measured at excitation 488 nm and emission 519 nm. The percentage of ezrin bound is represented at different acidic lipid concentrations (○) (PC/PIP2, 95:5), x axis is the PIP2acc concentration; (□) (PC/PS, 80:20), x axis is the PSacc concentration. The curves are the least squares fits of Eq. 2 to the data, which yield the value for the molar partition coefficient K (points are mean ± SD of two independent experiments). Ezrin was kept constant at 400 nM. Note the similarity with Fig. 3.
Ezrin LUV interactions by fluorescence correlation spectroscopy
Recently, fluorescence correlation spectroscopy was employed to analyze the binding of MARCKS 151–175 to LUVs (20). The results obtained for this peptide were comparable to those obtained from binding measurements of radioactively labeled MARCKS 151–175 using a centrifugation technique. It was also used by Takakuwa et al., who investigated the binding of protein 4.1 (molecular mass, 80 kDa) with LUVs containing PS at different percentages (19). The principle of the measurement relies on the fact that LUVs and proteins, which have significantly different sizes, will have two distinct diffusion coefficients that will give rise to two correlation times (28).
In our case, we first we measured the diffusion coefficient of ezrin-Alexa488 and of LUVs containing 0.01% of DHPE-rhodamine (Fig. 5 A). The diffusion coefficient of LUVs was found to be of ∼3 μm2/s and that of ezrin of ∼55 μm2/s, i.e., ∼15-fold higher. This is in agreement with the value of 4 μm2/s and 58 μm2/s, respectively, for LUVs and ezrin, which can be estimated using the Stokes-Einstein equation (taking 7.5 nm for the measured ezrin diameter and 100 nm for the LUVs diameter, η = 0.89 mPa s for the viscosity of a 100 mM KCl solution at 25°C).
Figure 5.
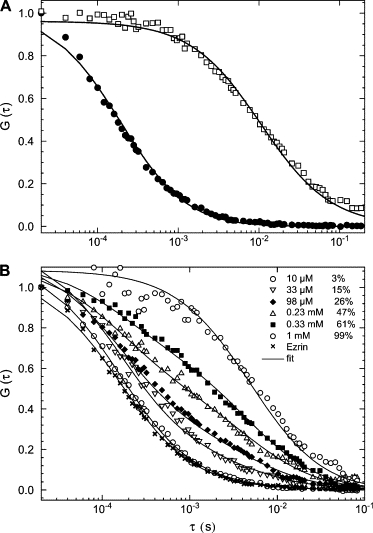
FCS measurements of ezrin, LUVs, and ezrin binding to PC/PIP2 (95:5) LUVs. (A) Autocorrelation curves of ezrin-Alexa488 (●) and rhodamine DHPE-labeled LUVs (□), which have a diameter of 100 nm. The diffusion coefficient was ∼55 μm2/s for ezrin and ∼3 μm2/s for the LUVs. (B) Autocorrelation curves obtained from a solution containing 15 nM ezrin-Alexa488 and different lipid concentrations are shown. Autocorrelation curves from left to right are shown for 5 μM to 1 mM accessible lipid concentrations, corresponding to 0% (×), 3% (○), 15% (∇), 26% (), 47% (△), 61% (■), and 99% (○) ezrin bound, respectively. The lines represent the best fit of the two-component model, Eq. 7.
Following the protocol described by Rusu et al. (20), we prepared solutions containing ezrin at a fixed concentration (typically 15 nM) and increased concentration of LUVs while keeping the fraction of PIP2 constant. Fig. 5 B shows autocorrelation curves for experiments where ezrin-Alexa488 was in LUVs solution containing increasing lipid concentration (from 10 μM to 1 mM accessible lipid). The autocorrelation curve on the left represents the case when all ezrin molecules are free. The population of bound ezrin grows as the lipid concentration increases as observed by the shift of the autocorrelation functions to longer timescales. Data analysis yielded the percentage of bound ezrin from left to right, as 0%, 3%, 15%, 26%, 47%, 61%, and 99%, respectively. Fig. 6 shows the percentage of ezrin bound to either PC/5%PIP2, PC/20%PS, or PC vesicles as a function of the accessible acidic lipid concentration. The curves are the least-square fits of Eq. 2 to the data. Ezrin binds more strongly to vesicles containing PIP2 (Kd = 6.2 ± 0.8 μM) than to those containing PS (Kd = 580 ± 57 μM), i.e., ∼90-fold lower and barely binds to PC LUVs. It should be noted that experiments performed at 15 and 45 nM ezrin concentration lead to similar results. In Table 1, the affinity constants deduced from these fitted data are compared to those from the cosedimentation assays. The data agree well in particular for the Kd values estimated for the PIP2 containing vesicles. However, the nonspecific (electrostatic) binding of ezrin to PS containing LUVs is apparently lower when measured by FCS. Indeed, it was reported that the charge and size of the vesicles may significantly affect the efficiency of the cosedimentation assays due to vesicle nonspecific aggregation (15). This may explain why the percentage of ezrin bound to PC/20% PS LUVs is systematically higher when measured by the cosedimentation assays.
Figure 6.
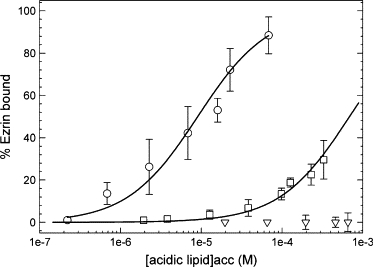
FCS measurements of ezrin binding to PC/PIP2, PC/PS, and PC LUVs (ezrin-Alexa 488 at 15 nM). The percentage of ezrin bound, deduced from data similar to those illustrated in Fig. 5 is plotted as a function of the accessible lipid concentration for (○) (PC/PIP2, 95:5), x axis being the PIP2acc concentration; (□) (PC/PS, 80:20), x axis being the PSacc concentration; and (∇) PC vesicles. The curves are the least squares fits of Eq. 2 to the data. Points are mean ± SD of seven measurements on each sample.
Phosphoinositide specificity of ezrin and role of PS and cholesterol in the binding
We next measured the effective dissociation constant of ezrin-A488 for LUVs containing different phosphoinositides using the quantitative cosedimentation assay and FCS to investigate the selectivity of ezrin for phosphoinositides. All the results are summarized in Table 2. The comparison of the binding of various phosphoinositides to ezrin indicates that ezrin has modest selectivity for PI(4,5)P2 (Table 2). The Kd is of the same order of magnitude for PIP2 and PI(3,4,5)P3 and is at least three-to fivefold lower for vesicles containing PI(3,4)P2 or the monophosphorylated phosphoinositide PI(4)P. However, the finding that ezrin's affinity for LUVs is about the same for PIP2 (ζ-potential of −24.5 mV) and for the more anionic PI(3,4,5)P3 (ζ-potential of −30.5 mV) as compared to the similarly charged PS LUVs (ζ-potential of −27.7 mV) confirms that the observed selectivity does not originate simply from nonspecific electrostatic interactions. The presence of two phosphate groups also seems to be important.
Recently, Hokanson et al. suggested that low concentrations of PS might contribute to the binding energy when myo1C is attached to the membrane via phosphoinositides (31). In another study, Gokhale et al. (32) found that Annexin 2t showed no detectable affinity for a membrane that contained 3 mol % PIP2 but without cholesterol. In our case, no detectable influence of a mixture of PS/PIP2 nor of cholesterol could be observed (Table 2).
Ezrin binding to PIP2 is not cooperative
An important question remains concerning the possible existence of cooperativity in the ezrin binding to the PIP2 containing LUVs. The assay for probing this question differed from the previous ones in that total lipid concentration (and thus LUVs concentration) was held constant and only the mass fraction of PIP2 was varied. We measured the binding of ezrin to 0.14 mM accessible total lipid composed of 0–15% PIP2 while holding the total lipid concentration constant (Fig. 7). A monotonic increase can be observed in the binding curve, not a sigmoidal shape. Therefore, the hyperbolic dependence of ezrin binding on the percentage of PIP2 was fitted using Eq. 2, which gave an apparent Kd of 2.3 ± 0.3 μM. Also, when the data are plotted as ezrin bound versus the accessible PIP2 concentration, the percentage of binding for 100 μM LUVs composed of 0–15% PIP2 and for LUVs composed of 5% PIP2 measured at different total lipid concentrations are similar (Fig. 7, inset, data for 5% PIP2 are taken from Fig. 4). Therefore, the interaction of ezrin with PIP2 is not cooperative, but rather has a 1:1 binding stochiometry.
Figure 7.
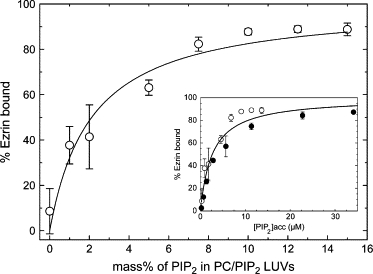
Binding of ezrin to LUVs for increasing PIP2 concentrations. Binding of 400 nM ezrin-Alexa488 to 0.14 mM LUVs (accessible lipid) composed of 0–15% PIP2 as measured by the cosedimentation assays followed by spectrofluorimetric analysis. The percent of ezrin bound is plotted as a function of the percentage of PIP2 in the LUVs rather than total lipid concentration. Each point is the average of three experiments. The curve is the best fit with Kd = 2.3 ± 0.3 μM. (Inset) Data in inset are represented as a function of accessible [PIP2] concentration and also include the data from Fig. 4 (●). The solid line is the best fit of all the data yielding Kd = 2.7 ± 0.3 μM.
Ezrin does not induce the clustering of PIP2
We then sought to investigate whether the binding of ezrin is able to cluster PIP2 molecules. Experimentally, we checked whether ezrin can produce self-quenching of NBD-labeled LUVs when the fluorescent lipid is present in the vesicles at a concentration just below the level that produced self-quenching. In a first step, it is thus necessary to determine the percentage at which self-quenching begins to occur in LUVs. We found for NBD-PC LUVs that self-quenching occurs at percentage above 4% (Supplementary Fig. S2). Unfortunately, in this control experiment, NBD-PIP2 could not be employed as we found that a strong quenching occurred upon disruption of the LUVs with 1% TrixonX-100. This quenching can presumably be attributed to the micelle forming capacity of PIP2 (and of NBD-PIP2 in solution) as already evidenced in the past (33). As a consequence, if we assume a similar behavior for NBD-PIP2, even a small redistribution of PIP2 in vesicles containing 4% NBD-labeled PIP2 should increase self-quenching. Thus, the percentage of self-quenching of NBD-PIP2 was measured for different ezrin concentrations and calculated according to Eq. 8. We found that ezrin did not induce self-quenching when it binds to the LUVs (Supplementary Fig. S2). This was confirmed using Bodipy-FL-PIP2 instead of TMR-PIP2. As a control experiment, we verified that MARCKS is effectively inducing the quenching of TMR-PIP2 in LUVs, as already shown in previous experiments (27,34). This quenching experiment suggests that ezrin does not sequester PIP2 in the membrane. When PC/1% TMR-PIP2 LUVs were used (1% being the maximal fraction that does not exhibit self-quenching (27), results were qualitatively similar and no self-quenching occurred (data not shown).
Ezrin binding may contribute to mask underlying PIP2 molecules not engaged in the interaction when PIP2 concentration in the LUVs is high
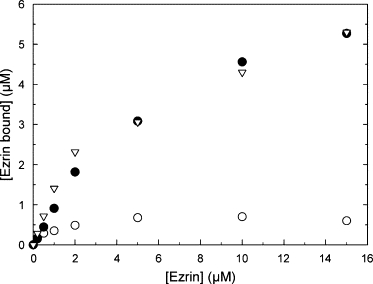
We next investigated the influence of ezrin concentration for a given accessible lipid concentration (thus also LUVs concentration) on the total amount of ezrin bound to LUVs containing various percentages of PIP2 (Fig. 8). This kind of experiment allows one to investigate the possibility for a restricted access to PIP2 targets, as one ezrin binds one PIP2 molecule. Due to the anisotropic shape and large area of the FERM domain (Figs. 9 and 10), ezrin may mask other PIP2 molecules that would be inaccessible. Thus, when plotted in terms of ezrin bound for different percentages of PIP2 in the LUVs, this phenomenon should lead to saturation in the amount of ezrin bound. In this experiment, the accessible lipid concentration was set at a high value (0.88 mM, which is equivalent to a LUVs concentration of 14.2 nM) so that the vesicle concentration itself was not the limiting factor, but rather the percentage of PIP2 The total amount of ezrin bound is represented as a function of the initial ezrin concentration, for LUVs containing either 1%, 5%, or 7.5% of PIP2 (Fig. 8). The amount of ezrin bound shows a steep increase for the 1% PIP2 concentration and levels off very rapidly when ezrin concentration reaches 4 μM. This indicates that all the binding sites are presumably saturated. On the other hand, the amount of ezrin bound steadily increases for LUVs composed of 5% PIP2 concentration and does not reach a plateau over the range of concentrations investigated, which indicates that there are still available binding sites for ezrin. The LUVs containing 7.5% of PIP2 have a very similar behavior to that containing 5% of PIP2. Thus, it seems that the maximal amount of ezrin bound is reached when the percentage of PIP2 is ∼5–7.5%. We suggest that this inaccessibility is due to the large size of ezrin FERM domain, which is “masking” PIP2 molecules. The range of values obtained here are in qualitative agreement with the values obtained in Fig. 7 at lower ezrin concentration and lower LUVs concentration. To verify this hypothesis, we performed a simple calculation based on the known percentage of PIP2 in the LUVs. We calculated the mean distance between two neighboring PIP2 molecules (dmin) according to Eq. 9, knowing the mass % of PIP2 in the spherical membrane, the surface area of PIP2 molecules estimated at 1.1 nm2 (33), the surface area of PC molecules estimated at 0.7 nm2, and the molar mass of PC and PIP2 (Fig. 9).
| (9) |
Figure 8.
Amount of ezrin-Alexa488 bound to 0.88 mM LUVs (accessible lipid) as a function of the initial concentration of ezrin, as measured by the spectrofluorimetric cosedimentation assay for LUVs containing 1% PIP2 (○), 5% PIP2 (●), and 7.5% PIP2 (∇).
Figure 9.
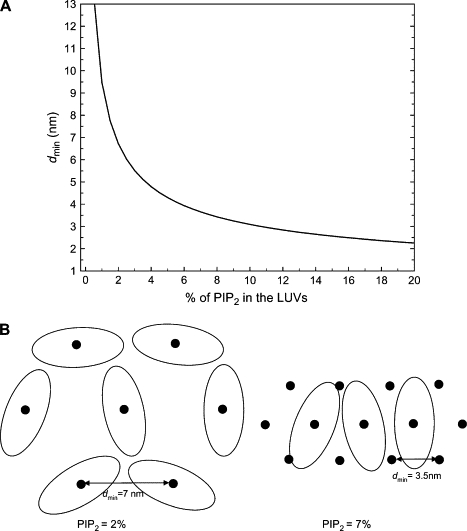
(A) Mean distance between two PIP2 molecules (dmin) as a function of the percentage of PIP2 in the LUVs. (B) Schematic of the interaction of the FERM domain of ezrin with PIP2 molecules (represented by black dots), when PIP2 concentration in the LUVs is set at 2% (left) and at 7% (right). (The FERM domain can be approximated to an ellipse with short and long axes of, respectively, 3.1 and 6.5 nm). This clearly shows that many PIP2 molecules are inaccessible when the concentration of PIP2 is high.
Figure 10.
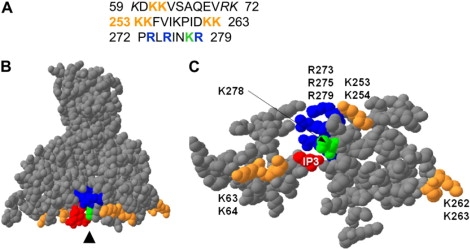
(A) Primary sequences of ezrin in the subdomains F1 and F3 of the FERM domain, where potential PIP2 and IP3 binding sites have been localized (Protein Data Bank code, 1GC6). Potential binding site in ezrin as identified by Barret et al. (7) who performed site-directed mutagenesis on three lysine pairs (K63, K64; K253, K254; K262, K263) are indicated in orange. The basic residues (K278 in green and R273, R275, R279 in blue) being part of the basic cleft, according to Hamada et al. (9) are also indicated. In italic are the arginine and lysine residues from the basic cleft but that are not on the surface of the FERM domain. (B) Three-dimensional visualization of the FERM domain (lateral view) by SPDB-Viewer 3.7. (C) A slab of 10 Å in the direction of the arrowhead, allowing one to visualize the molecularly flat surface of the FERM domain.
It should be noted that we assumed here that PIP2 molecules are not clustered in the membrane because: i), PIP2 has a net negative charge estimated at −3 (30), and ii), recent experimental evidence suggests that PIP2 alone does not form domains when incorporated in PC membrane (35); dmin rapidly decreases when the percentage of PIP2 increases. In Fig. 9 B, we present a schematic of the interaction between the FERM domain of ezrin with PIP2 molecules, for PIP2 concentrations of, respectively, 2% and 7% (corresponding to dmin ∼ 7 nm and dmin ∼ 3.5 nm, respectively). For this purpose, and according to the structural predictions of Hamada (9) for radixin (radixin and ezrin have 90% identity sequence), the ezrin FERM domain was approximated to an ellipse of axes 3.1 and 6.5 nm (distances were measured with SPDB-viewer, leading to an area of ∼30 nm2). This schematic shows that many PIP2 molecules are inaccessible when the concentration of PIP2 is high. As a consequence, for high PIP2 concentrations, the true accessible PIP2 concentration may be much lower than the PIP2 concentration initially introduced in LUVs. This is in agreement with the results of Fig. 8.
Discussion
Comparison with affinities of other proteins for PIP2
The Kd value for interaction with PIP2-LUVs (∼5 μM) is on the same order of magnitude to that of other membrane-associated proteins such as a fragment from N-WASP (36), talin (37), higher than for the PH-homology domain in β-spectrin (Kd ∼ 40 μM (38), but one order of magnitude lower than that of myosin 1c (31,39) and of annexin 2 (32). It is also two orders of magnitude lower than that of MARCKS (Kd ∼ 0.01 μM (20)). It has to be noted that, in the case of annexin 2, Kd was measured using surface plasmon resonance on LUVs adsorbed to the sensor chip. This different configuration may lead to different Kd values. In our case, we found that Kd estimated by surface plasmon resonance for 2% PIP2-LUVS was one order of magnitude lower (∼0.4 μM) than that found by spectrofluorimetry and by FCS (data not shown). In the case of surface adsorbed LUVs, it is difficult to estimate the true PIP2 concentration due to the vesicles immobilization.
Nonclustering of PIP2 upon interaction with ezrin
PIP2 has several important roles in vivo and it was hypothesized that it is concentrated in membrane microdomains, such as cholesterol-rich lipid rafts (40,41). Also, some in vitro studies suggest that it may exist in clusters (or is locally sequestered) when bound to proteins (32,34). According to Janmey et al. (41), three possible mechanisms could explain this clustering: i), local membrane curvature because PIP2 is a micelle-forming lipid that prefers curved surfaces instead of flat membrane (33); ii), presence of hydrogen bonds between adjacent PIP2 molecules and water bridging; iii), interactions with cytosolic proteins, or peripheral membrane-bound proteins or transmembrane receptors that contain a PIP2 binding site (usually a basic domain).
There are now several proofs of evidence that PIP2 does not by itself form domains when incorporated into model membranes. Atomic force microscopy observations on POPC supported lipid bilayers containing PIP2 showed a uniform distribution of the lipids (42). Similar results were found on LUVs using fluorescence measurements on 5% NBD-PIP2-containing POPC membrane (35) (they contradict another study performed by Gericke et al. (43) on LUVs but in this latter case, the acyl chain of the labeled PIP2 was much shorter (C6), which may explain the poor incorporation in the lipid membrane). The situation is different when PIP2 in the vesicle is interacting with proteins. Using a similar quenching assay, McLaughlin and co-workers (27,44) evidenced that the polybasic effector domain of MARCKS forms clusters of PIP2 in LUVs. Recently, annexin 2t was also found to induce PIP2 clustering in both LUVs (by observing a shift in the fluorescence emission of Laurdan) and GUVs (by using PIP2-labeled GUVs and labeled annexin 2t) (32). It has indeed been suggested, in the case of A2t, that the lateral interaction between proteins may increase PIP2 clustering. On the other hand, other proteins, like annexin 2 and the PH domain of PLCδ1, were found not to cluster PIP2 (32). Our data with ezrin suggest that PIP2 in LUVs is not forming domains upon ezrin interaction.
The 1:1 stoichiometry of ezrin/PIP2 binding presumably indicates that ezrin has only one interaction site with PIP2. In fact, x-ray crystallography data on radixin and moesin show that the FERM domain is organized in a cloverleaf structure containing three lobs (F1, F2, F3) (9,45). F1 and F3 are forming a molecularly flat surface that is positively charged and contains several basic residues (Fig. 10). According to the structure of the complex inositol-(1,4,5)-trisphosphate (IP3) with the radixin FERM domain, a basic cleft containing many lysine and arginine residues (Fig. 10, residues colored in blue and green), located between F1 and F3 subdomains, is responsible for a stereospecific interaction (9). At the same time, site-directed mutagenesis on ezrin allowed Barret et al. (7) to identify three pairs of lysine residues that are necessary for PIP2-membrane binding (K62,K63 in subdomain F1, and K253, K254, K262, K263 in F3; Fig. 10, residues colored in orange). This led Balla et al. to hypothesize that there are two potential PIP2 binding sites (46). However, by looking at the surface of the FERM domain (Fig. 10 C), we rather suggest that all the amino acids are important in the ezrin/PIP2 binding and contribute to stabilize the interaction.
Biological relevance of ezrin/phosphoinositides binding
Our results suggest that ezrin binds PIP2-containing membrane with a moderate affinity (Kd ∼ 5 μM) and that this interaction is specific. Ezrin has modest selectivity for PIP2 and binds equally well to PI(3,4,5)P3. However, in the cell in the resting state, PIP2 accounts for 99% of all the PI lipids whereas PI(3,4,5)P3 has only transient localized peaks during events such as chemotaxis (47), (48), macropinocytosis (a non-clathrin-mediated endocytotic pathway (49)), or phagocytosis (50). In phagosomal membrane, PI(4)P is the most abundant phosphoinositide produced, followed by PIP2, whereas PI(3,4,5)P3 is detected only occasionally (51). Indeed, actin assembly on phagosomes was found to require PIP2/ezrin interactions.
Events such as endocytosis and phagocytosis, if they disorganize the membrane-cytoskeleton architecture locally, do not seem to alter the general distribution of ezrin (52,53). But Araki et al. (49) suggested that proteins that can bind to both PIP2 and PI(3,4,5)P3 may be associated with macropinosomes longer than proteins that can bind only to PI(4,5)P2. Thus, ezrin would fall in this category, although it has never directly been shown to interact with PI(3,4,5)P3 in vivo. Interestingly, in epithelial cells, PI(3,4,5)P3 was recently found to be localized mainly on the basolateral membrane (54), whereas ezrin is enriched at the apical surface (55). Thus, the cellular localization of ezrin may well depend on the associated proteins in addition to specific phosphoinositides.
Ezrin/PIP2 interactions in mediating cytoskeletal changes
PIP2 is highly concentrated in actin-rich structures, where it regulates the activity of actin polymerization/depolymerization via gelsolin, N-WASP, or profilin (56). In fact, actin is negatively charged at pH 7.4 (pI = 5.6) and each actin monomer bears an excess of four negative charges (57). Thus, actin is not expected to directly bind the negatively charged PIP2. On the contrary, a number of actin-binding proteins such as ERM proteins (vinculin, talin, actinin, gelsolin, or profilin) bind PIP2. The final cellular effects of these proteins (actin bundling, (de)polymerization, or stabilization) and the variations in the PIP2 concentration, will depend on the balance between their relative amount and their cellular localization.
PIP2 is also known to regulate the adhesion energy between the cytoskeleton and the plasma membrane (58). Based on measurement of the adhesion energy between the plasma membrane and the cytoskeleton, Nebl et al. (59) suggest that there are several thousands of PIP2 molecules per μm2, each capable of binding with low affinity membrane-associated proteins. They hypothesize that large regions of eukaryotic cell surfaces are supported by either large numbers of low affinity interactions (i.e., very dynamic interactions) or by few, sparsely distributed high affinity interactions. In the first case, these interactions, although of weak affinity, would be cumulatively important and sufficient for many cellular processes.
A simple calculation allows one to estimate that, in a cell of 10 μm in diameter, a typical PIP2 concentration of 1% has an effective concentration of ∼15 μM on the membrane surface (60,61), which would be sufficient to fully activate ezrin. In addition, cellular specificity of ezrin for PIP2 would derive from a combination of modest PIP2 selectivity (Table 2) and the relative abundance of PIP2 over other phosphoinositides (62). Thus, ezrin-PIP2 interaction at the inner plasma membrane may serve to concentrate ezrin at regions where other proteins that can bind ezrin will come into play. ERM proteins, which can both bind PIP2 and actin, have thus an important role in the maintenance of cell shape and polarity. They were found to stabilize microvillar structures (63) and to be essential for motility and maintenance of Schwann cell polarity (64). In membrane blebs, ezrin was found to be the first protein recruited when bleb expansion ceased (10). Also, finally, chromophore assisted light inactivation (microCALI) experiments showed that the selective inactivation of ezrin induced an immediate reversible cell rounding demonstrating the role of ezrin in defining cell shape (65).
Conclusion
Using cosedimentation assays and fluorescence correlation spectroscopy, we found that ezrin interaction with PIP2-containing LUVs is specific with a Kd of ∼5 μM, which would be sufficient for allowing binding of ezrin to PIP2 in the plasma membrane in vivo. Fluorescently labeled ezrin (ezrin-Alexa488) was synthesized for the purpose of performing fluorescence spectroscopy techniques and may be used for performing subsequent microscopy studies. The interaction between ezrin and PIP2 was found to be noncooperative. Finally, by varying ezrin concentration in contact with LUVs at a fixed lipid concentration, we found that ezrin FERM domain (∼30 nm2) binding to a single PIP2 can block the access to neighboring PIP2 molecules and thus contributes to lower the accessible PIP2 concentration. In addition, no evidence exists for a clusterization of PIP2 upon ezrin interaction.
Acknowledgments
We thank Benoît Frisch (University of Strasbourg, Strasbourg, France) for discussions regarding ezrin labeling and Stuart McLaughlin (Stony Brook University, Stony Brook, NY) for discussions regarding the ζ-potential of membranes and the quenching experiments with MARCKS. We are grateful to Michel Terray and Sandrine Vieules from Malvern Instruments for providing the Zeta NanoZS apparatus.
C.P. is a Junior Member of the Institut Universitaire de France whose support is gratefully acknowledged.
Footnotes
Editor: Anthony Watts.
References
- 1.Bretscher A., Edwards K., Fehon R.G. ERM proteins and merlin: integrators at the cell cortex. Nat. Rev. Mol. Cell Biol. 2002;3:586–599. doi: 10.1038/nrm882. [DOI] [PubMed] [Google Scholar]
- 2.Mangeat P., Roy C., Martin M. ERM proteins in cell adhesion and membrane dynamics. Trends Cell Biol. 1999;9:187–192. doi: 10.1016/s0962-8924(99)01544-5. [DOI] [PubMed] [Google Scholar]
- 3.Tsukita S., Yonemura S. Cortical actin organization: lessons from ERM (ezrin/radixin/moesin) proteins. J. Biol. Chem. 1999;274:34507–34510. doi: 10.1074/jbc.274.49.34507. [DOI] [PubMed] [Google Scholar]
- 4.Yonemura S., Tsukita S. Direct involvement of ezrin/radixin/moesin (ERM)-binding membrane proteins in the organization of microvilli in collaboration with activated ERM proteins. J. Cell Biol. 1999;145:1497–1509. doi: 10.1083/jcb.145.7.1497. [DOI] [PMC free article] [PubMed] [Google Scholar]
- 5.Gary R., Bretscher A. Ezrin self-association involves binding of an N-terminal domain to a normally masked C-terminal domain that includes the F-actin binding site. Mol. Biol. Cell. 1995;6:1061–1075. doi: 10.1091/mbc.6.8.1061. [DOI] [PMC free article] [PubMed] [Google Scholar]
- 6.Simons P.C., Pietromonaco S.F., Reczek D., Bretscher A., Elias L. C-terminal threonine phosphorylation activates ERM proteins to link the cell's cortical lipid bilayer to the cytoskeleton. Biochem. Biophys. Res. Commun. 1998;253:561–565. doi: 10.1006/bbrc.1998.9823. [DOI] [PubMed] [Google Scholar]
- 7.Barret C., Roy C., Montcourrier P., Mangeat P., Niggli V. Mutagenesis of the phosphatidylinositol 4,5-bisphosphate (PIP(2)) binding site in the NH(2)-terminal domain of ezrin correlates with its altered cellular distribution. J. Cell Biol. 2000;151:1067–1080. doi: 10.1083/jcb.151.5.1067. [DOI] [PMC free article] [PubMed] [Google Scholar]
- 8.Niggli V., Andreoli C., Roy C., Mangeat P. Identification of a phosphatidylinositol-4,5-bisphosphate-binding domain in the N-terminal region of ezrin. FEBS Lett. 1995;376:172–176. doi: 10.1016/0014-5793(95)01270-1. [DOI] [PubMed] [Google Scholar]
- 9.Hamada K., Shimizu T., Matsui T., Tsukita S., Hakoshima T. Structural basis of the membrane-targeting and unmasking mechanisms of the radixin FERM domain. EMBO J. 2000;19:4449–4462. doi: 10.1093/emboj/19.17.4449. [DOI] [PMC free article] [PubMed] [Google Scholar]
- 10.Charras G.T., Hu C.K., Coughlin M., Mitchison T.J. Reassembly of contractile actin cortex in cell blebs. J. Cell Biol. 2006;175:477–490. doi: 10.1083/jcb.200602085. [DOI] [PMC free article] [PubMed] [Google Scholar]
- 11.Takeda S., Saitoh A., Furuta M., Satomi N., Ishino A., Nishida G., Sudo H., Hotani H., Takiguchi K. Opening of holes in liposomal membranes is induced by proteins possessing the FERM domain. J. Mol. Biol. 2006;362:403–413. doi: 10.1016/j.jmb.2006.07.071. [DOI] [PubMed] [Google Scholar]
- 12.Payrastre B., Missy K., Giuriato S., Bodin S., Plantavid M., Gratacap M. Phosphoinositides: key players in cell signalling, in time and space. Cell. Signal. 2001;13:377–387. doi: 10.1016/s0898-6568(01)00158-9. [DOI] [PubMed] [Google Scholar]
- 13.Fievet B.T., Gautreau A., Roy C., Del Maestro L., Mangeat P., Louvard D., Arpin M. Phosphoinositide binding and phosphorylation act sequentially in the activation mechanism of ezrin. J. Cell Biol. 2004;164:653–659. doi: 10.1083/jcb.200307032. [DOI] [PMC free article] [PubMed] [Google Scholar]
- 14.Niggli V. Regulation of protein activities by phosphoinositide phosphates. Annu. Rev. Cell Dev. Biol. 2005;21:57–79. doi: 10.1146/annurev.cellbio.21.021704.102317. [DOI] [PubMed] [Google Scholar]
- 15.Cho W., Bittova L., Stahelin R.V. Membrane binding assays for peripheral proteins. Anal. Biochem. 2001;296:153–161. doi: 10.1006/abio.2001.5225. [DOI] [PubMed] [Google Scholar]
- 16.Rebecchi M., Peterson A., McLaughlin S. Phosphoinositide-specific phospholipase C-delta 1 binds with high affinity to phospholipid vesicles containing phosphatidylinositol 4,5-bisphosphate. Biochemistry. 1992;31:12742–12747. doi: 10.1021/bi00166a005. [DOI] [PubMed] [Google Scholar]
- 17.Buser C.A., McLaughlin S. Ultracentrifugation technique for measuring the binding of peptides and proteins to sucrose-loaded phospholipid vesicles. Methods Mol. Biol. 1998;84:267–281. doi: 10.1385/0-89603-488-7:267. [DOI] [PubMed] [Google Scholar]
- 18.Stahelin R.V., Cho W. Differential roles of ionic, aliphatic, and aromatic residues in membrane-protein interactions: a surface plasmon resonance study on phospholipases A2. Biochemistry. 2001;40:4672–4678. doi: 10.1021/bi0020325. [DOI] [PubMed] [Google Scholar]
- 19.Takakuwa Y., Pack C.G., An X.L., Manno S., Ito E., Kinjo M. Fluorescence correlation spectroscopy analysis of the hydrophobic interactions of protein 4.1 with phosphatidyl serine liposomes. Biophys. Chem. 1999;82:149–155. doi: 10.1016/s0301-4622(99)00114-3. [DOI] [PubMed] [Google Scholar]
- 20.Rusu L., Gambhir A., McLaughlin S., Radler J. Fluorescence correlation spectroscopy studies of peptide and protein binding to phospholipid vesicles. Biophys. J. 2004;87:1044–1053. doi: 10.1529/biophysj.104.039958. [DOI] [PMC free article] [PubMed] [Google Scholar]
- 21.Roy C., Martin M., Mangeat P. A dual involvement of the amino-terminal domain of ezrin in F- and G-actin binding. J. Biol. Chem. 1997;272:20088–20095. doi: 10.1074/jbc.272.32.20088. [DOI] [PubMed] [Google Scholar]
- 22.Hope M.J., Bally M.B., Webb G., Cullis P.R. Production of large unilamellar vesicles by a rapid extrusion procedure: characterization of size distribution, trapped volume and ability to maintain a membrane potential. Biochim. Biophys. Acta. 1985;812:55–65. doi: 10.1016/0005-2736(85)90521-8. [DOI] [PubMed] [Google Scholar]
- 23.Hunter R.J. Academic Press; New York: 1981. Zeta Potential in Colloid Science. [Google Scholar]
- 24.Cantor C.R., Schimmel P.R. Freeman; Oxford, UK: 1998. Biophysical Chemistry. [Google Scholar]
- 25.Ha T., Rasnik I., Cheng W., Babcock H.P., Gauss G.H., Lohman T.M., Chu S. Initiation and re-initiation of DNA unwinding by the Escherichia coli Rep helicase. Nature. 2002;419:638–641. doi: 10.1038/nature01083. [DOI] [PubMed] [Google Scholar]
- 26.Schwille, P., and E. Haustein. 2002. Fluorescence correlation spectroscopy: a tutorial for the Biophysics Textbook Online (BTOL). http://www.biophysics.org/btol/index.html. [Online].
- 27.Gambhir A., Hangyas-Mihalyne G., Zaitseva I., Cafiso D.S., Wang J., Murray D., Pentyala S.N., Smith S.O., McLaughlin S. Electrostatic sequestration of PIP2 on phospholipid membranes by basic/aromatic regions of proteins. Biophys. J. 2004;86:2188–2207. doi: 10.1016/S0006-3495(04)74278-2. [DOI] [PMC free article] [PubMed] [Google Scholar]
- 28.Elson E.L. Fluorescence correlation spectroscopy measures molecular transport in cells. Traffic. 2001;2:789–796. doi: 10.1034/j.1600-0854.2001.21107.x. [DOI] [PubMed] [Google Scholar]
- 29.McLaughlin S. The electrostatic properties of membranes. Annu. Rev. Biophys. Biophys. Chem. 1989;18:113–136. doi: 10.1146/annurev.bb.18.060189.000553. [DOI] [PubMed] [Google Scholar]
- 30.Toner M., Vaio G., McLaughlin A., McLaughlin S. Adsorption of cations to phosphatidylinositol 4,5-bisphosphate. Biochemistry. 1988;27:7435–7443. doi: 10.1021/bi00419a039. [DOI] [PubMed] [Google Scholar]
- 31.Hokanson D.E., Laakso J.M., Lin T., Sept D., Ostap E.M. Myo1c binds phosphoinositides through a putative pleckstrin homology domain. Mol. Biol. Cell. 2006;17:4856–4865. doi: 10.1091/mbc.E06-05-0449. [DOI] [PMC free article] [PubMed] [Google Scholar]
- 32.Gokhale N.A., Abraham A., Digman M.A., Gratton E., Cho W. Phosphoinositide specificity of and mechanism of lipid domain formation by annexin A2-p11 heterotetramer. J. Biol. Chem. 2005;280:42831–42840. doi: 10.1074/jbc.M508129200. [DOI] [PubMed] [Google Scholar]
- 33.Sugiura Y. Structure of molecular aggregates of 1-(3-sn-phosphatidyl)-L-myo-inositol 3,4-bis(phosphate) in water. Biochim. Biophys. Acta. 1981;641:148–159. doi: 10.1016/0005-2736(81)90578-2. [DOI] [PubMed] [Google Scholar]
- 34.Golebiewska U., Gambhir A., Hangyas-Mihalyne G., Zaitseva I., Radler J., McLaughlin S. Membrane-bound basic peptides sequester multivalent (PIP2), but not monovalent (PS), acidic lipids. Biophys. J. 2006;91:588–599. doi: 10.1529/biophysj.106.081562. [DOI] [PMC free article] [PubMed] [Google Scholar]
- 35.Fernandes F., Loura L.M., Fedorov A., Prieto M. Absence of clustering of phosphatidylinositol-(4,5)-bisphosphate in fluid phosphatidylcholine. J. Lipid Res. 2006;47:1521–1525. doi: 10.1194/jlr.M600121-JLR200. [DOI] [PubMed] [Google Scholar]
- 36.Papayannopoulos V., Co C., Prehoda K.E., Snapper S., Taunton J., Lim W.A. A polybasic motif allows N-WASP to act as a sensor of PIP(2) density. Mol. Cell. 2005;17:181–191. doi: 10.1016/j.molcel.2004.11.054. [DOI] [PubMed] [Google Scholar]
- 37.Seelig A., Blatter X.L., Frentzel A., Isenberg G. Phospholipid binding of synthetic talin peptides provides evidence for an intrinsic membrane anchor of talin. J. Biol. Chem. 2000;275:17954–17961. doi: 10.1074/jbc.M002264200. [DOI] [PubMed] [Google Scholar]
- 38.Hyvonen M., Macias M.J., Nilges M., Oschkinat H., Saraste M., Wilmanns M. Structure of the binding site for inositol phosphates in a PH domain. EMBO J. 1995;14:4676–4685. doi: 10.1002/j.1460-2075.1995.tb00149.x. [DOI] [PMC free article] [PubMed] [Google Scholar]
- 39.Hokanson D.E., Ostap E.M. Myo1c binds tightly and specifically to phosphatidylinositol 4,5-bisphosphate and inositol 1,4,5-trisphosphate. Proc. Natl. Acad. Sci. USA. 2006;103:3118–3123. doi: 10.1073/pnas.0505685103. [DOI] [PMC free article] [PubMed] [Google Scholar]
- 40.Kwik J., Boyle S., Fooksman D., Margolis L., Sheetz M.P., Edidin M. Membrane cholesterol, lateral mobility, and the phosphatidylinositol 4,5-bisphosphate-dependent organization of cell actin. Proc. Natl. Acad. Sci. USA. 2003;100:13964–13969. doi: 10.1073/pnas.2336102100. [DOI] [PMC free article] [PubMed] [Google Scholar]
- 41.Janmey P.A., Lindberg U. Cytoskeletal regulation: rich in lipids. Nat. Rev. Mol. Cell Biol. 2004;5:658–666. doi: 10.1038/nrm1434. [DOI] [PubMed] [Google Scholar]
- 42.Herrig A., Janke M., Austermann J., Gerke V., Janshoff A., Steinem C. Cooperative adsorption of ezrin on PIP2-containing membranes. Biochemistry. 2006;45:13025–13034. doi: 10.1021/bi061064a. [DOI] [PubMed] [Google Scholar]
- 43.Redfern D.A., Gericke A. pH-Dependent domain formation in phosphatidylinositol polyphosphate/phosphatidylcholine mixed vesicles. J. Lipid Res. 2005;46:504–515. doi: 10.1194/jlr.M400367-JLR200. [DOI] [PubMed] [Google Scholar]
- 44.Wang L., Schönhoff M., Helmuth Möhwald H. Lipids coupled to polyelectrolyte multilayers: ultraslow diffusion and the dynamics of electrostatic interactions. J. Phys. Chem. 2002;106:9135–9142. [Google Scholar]
- 45.Pearson M.A., Reczek D., Bretscher A., Karplus P.A. Structure of the ERM protein moesin reveals the FERM domain fold masked by an extended actin binding tail domain. Cell. 2000;101:259–270. doi: 10.1016/s0092-8674(00)80836-3. [DOI] [PubMed] [Google Scholar]
- 46.Balla T. Inositol-lipid binding motifs: signal integrators through protein-lipid and protein-protein interactions. J. Cell Sci. 2005;118:2093–2104. doi: 10.1242/jcs.02387. [DOI] [PubMed] [Google Scholar]
- 47.Franca-Koh J., Kamimura Y., Devreotes P.N. Leading-edge research: PtdIns(3,4,5)P3 and directed migration. Nat. Cell Biol. 2007;9:15–17. doi: 10.1038/ncb0107-15. [DOI] [PubMed] [Google Scholar]
- 48.Huang Y.E., Iijima M., Parent C.A., Funamoto S., Firtel R.A., Devreotes P. Receptor-mediated regulation of PI3Ks confines PI(3,4,5)P3 to the leading edge of chemotaxing cells. Mol. Biol. Cell. 2003;14:1913–1922. doi: 10.1091/mbc.E02-10-0703. [DOI] [PMC free article] [PubMed] [Google Scholar]
- 49.Araki N., Egami Y., Watanabe Y., Hatae T. Phosphoinositide metabolism during membrane ruffling and macropinosome formation in EGF-stimulated A431 cells. Exp. Cell Res. 2007;313:1496–1507. doi: 10.1016/j.yexcr.2007.02.012. [DOI] [PubMed] [Google Scholar]
- 50.Dewitt S., Tian W., Hallett M.B. Localised PtdIns(3,4,5)P3 or PtdIns(3,4)P2 at the phagocytic cup is required for both phagosome closure and Ca2+ signalling in HL60 neutrophils. J. Cell Sci. 2006;119:443–451. doi: 10.1242/jcs.02756. [DOI] [PubMed] [Google Scholar]
- 51.Defacque H., Bos E., Garvalov B., Barret C., Roy C., Mangeat P., Shin H.W., Rybin V., Griffiths G. Phosphoinositides regulate membrane-dependent actin assembly by latex bead phagosomes. Mol. Biol. Cell. 2002;13:1190–1202. doi: 10.1091/mbc.01-06-0314. [DOI] [PMC free article] [PubMed] [Google Scholar]
- 52.Diakonova M., Bokoch G., Swanson J.A. Dynamics of cytoskeletal proteins during Fcgamma receptor-mediated phagocytosis in macrophages. Mol. Biol. Cell. 2002;13:402–411. doi: 10.1091/mbc.01-05-0273. [DOI] [PMC free article] [PubMed] [Google Scholar]
- 53.Erwig L.P., McPhilips K.A., Wynes M.W., Ivetic A., Ridley A.J., Henson P.M. Differential regulation of phagosome maturation in macrophages and dendritic cells mediated by Rho GTPases and ezrin-radixin-moesin (ERM) proteins. Proc. Natl. Acad. Sci. USA. 2006;103:12825–12830. doi: 10.1073/pnas.0605331103. [DOI] [PMC free article] [PubMed] [Google Scholar]
- 54.Gassama-Diagne A., Yu W., ter Beest M., Martin-Belmonte F., Kierbel A., Engel J., Mostov K. Phosphatidylinositol-3,4,5-trisphosphate regulates the formation of the basolateral plasma membrane in epithelial cells. Nat. Cell Biol. 2006;8:963–970. doi: 10.1038/ncb1461. [DOI] [PubMed] [Google Scholar]
- 55.Miller K.G. A role for moesin in polarity. Trends Cell Biol. 2003;13:165–168. doi: 10.1016/s0962-8924(03)00029-1. [DOI] [PubMed] [Google Scholar]
- 56.Yin H.L., Janmey P.A. Phosphoinositide regulation of the actin cytoskeleton. Annu. Rev. Physiol. 2003;65:761–789. doi: 10.1146/annurev.physiol.65.092101.142517. [DOI] [PubMed] [Google Scholar]
- 57.Deme B., Hess D., Tristl M., Lee L., Sackmann E. Binding of actin filaments to charged lipid monolayers: film balance experiments combined with neutron reflectivity. Eur. Phys. J. 2000;2:125–136. [Google Scholar]
- 58.Raucher D., Sheetz M.P. Cell spreading and lamellipodial extension rate is regulated by membrane tension. J. Cell Biol. 2000;148:127–136. doi: 10.1083/jcb.148.1.127. [DOI] [PMC free article] [PubMed] [Google Scholar]
- 59.Nebl T., Oh S.W., Luna E.J. Membrane cytoskeleton: PIP(2) pulls the strings. Curr. Biol. 2000;10:R351–R354. doi: 10.1016/s0960-9822(00)00465-6. [DOI] [PubMed] [Google Scholar]
- 60.McLaughlin S., Wang J., Gambhir A., Murray D. PIP(2) and proteins: interactions, organization, and information flow. Annu. Rev. Biophys. Biomol. Struct. 2002;31:151–175. doi: 10.1146/annurev.biophys.31.082901.134259. [DOI] [PubMed] [Google Scholar]
- 61.Liu A.P., Fletcher D.A. Actin polymerization serves as a membrane domain switch in model lipid bilayers. Biophys. J. 2006;91:4064–4070. doi: 10.1529/biophysj.106.090852. [DOI] [PMC free article] [PubMed] [Google Scholar]
- 62.Pendaries C., Tronchere H., Plantavid M., Payrastre B. Phosphoinositide signaling disorders in human diseases. FEBS Lett. 2003;546:25–31. doi: 10.1016/s0014-5793(03)00437-x. [DOI] [PubMed] [Google Scholar]
- 63.Brown M.J., Nijhara R., Hallam J.A., Gignac M., Yamada K.M., Erlandsen S.L., Delon J., Kruhlak M., Shaw S. Chemokine stimulation of human peripheral blood T lymphocytes induces rapid dephosphorylation of ERM proteins, which facilitates loss of microvilli and polarization. Blood. 2003;102:3890–3899. doi: 10.1182/blood-2002-12-3807. [DOI] [PubMed] [Google Scholar]
- 64.Gatto C.L., Walker B.J., Lambert S. Asymmetric ERM activation at the Schwann cell process tip is required in axon-associated motility. J. Cell. Physiol. 2007;210:122–132. doi: 10.1002/jcp.20844. [DOI] [PubMed] [Google Scholar]
- 65.Lamb R.F., Ozanne B.W., Roy C., McGarry L., Stipp C., Mangeat P., Jay D.G. Essential functions of ezrin in maintenance of cell shape and lamellipodial extension in normal and transformed fibroblasts. Curr. Biol. 1997;7:682–688. doi: 10.1016/s0960-9822(06)00295-8. [DOI] [PubMed] [Google Scholar]