

Abstract
Two strategies are described for detecting constitutive or induced protein–protein interactions in intact mammalian cells; these strategies are based on oligomerization domain-assisted complementation of rationally designed fragments of the murine enzyme dihydrofolate reductase (DHFR; EC 1.5.1.3). We describe a dominant clonal-selection assay of stably transfected cells expressing partner proteins FKBP (FK506 binding protein) and FRAP (FKBP–rapamycin binding protein) fused to DHFR fragments and show a rapamycin dose-dependent survival of clones that requires ≈25 molecules of reconstituted DHFR per cell. A fluorescence assay also is described, based on stoichiometric binding of fluorescein-methotrexate to reconstituted DHFR in vivo. Formation of the FKBP–rapamycin–FRAP complex is detected in stably and transiently transfected cells. Quantitative rapamycin dose-dependence of this complex is shown to be consistent with in vitro binding and distinguishable from a known constitutive interaction of FKBP and FRAP. We also show that this strategy can be applied to study membrane protein receptors, demonstrating dose-dependent activation of the erythropoietin receptor by ligands. The combination of these clonal-selection and fluorescence assays in intact mammalian cells makes possible selection by simple survival, flow cytometry, or both. High-throughput drug screening and quantitative analysis of induction or disruption of protein–protein interactions are also made possible.
Many processes in biology are mediated by noncovalently associated multienzyme complexes (1, 2). Examples include cellular machineries for transcription, translation, and metabolic or signal-transduction pathways. Much of modern biological research is concerned with identifying proteins involved in these cellular processes and with determining their functions and how, when, and where they interact with other proteins involved in specific biochemical pathways. The yeast two-hybrid system is a robust method to study protein–protein interactions in a specific cellular context (3). However, quantitative detection of protein–protein interactions in intact cells remains a significant experimental challenge.
We have developed a strategy to study protein–protein interaction in vivo based on protein-fragment complementation assays (PCAs; refs. 4–6). The basic principles of this approach were pioneered by Johnsson and Varshavsky (7). Similar in vivo protein–protein interaction assays also have been described (8, 9). Here, we report PCAs, based on the murine enzyme dihydrofolate reductase (DHFR), that allow for quantitative characterization of protein–protein interactions in mammalian cells. Our goal has been to develop a strategy that allows detection of elemental protein–protein interactions in vivo and in appropriate biological contexts, such as specific cell types or within particular cellular compartments. We show how the DHFR PCA can be used simultaneously in a strategy for dominant clonal selection and as a universal in vivo fluorescence assay for quantitative pharmacological analysis of protein and protein–small molecule binding.
MATERIALS AND METHODS
DNA Constructs.
Complementary oligonucleotides containing restriction sites and coding for a 10-aa flexible polypeptide linker consisting of (Gly⋅Gly⋅Gly⋅Gly⋅Ser)2 were inserted into the eukaryotic expression vector pMT3 (10). Fragments of DHFR (F[1,2] and F[3]) were amplified by PCR from the constructs Z-F[1,2:Phe31Ser] and Z-F[3] (6) and introduced at the 3′ end of the flexible linker. F[1,2] corresponds to amino acids 1–105, and F[3] corresponds to amino acids 106–186 of murine DHFR. FKBP (the FK506 binding protein) and FRB (FKBP–rapamycin binding domain of FRAP; FRAP is the FKBP–rapamycin binding protein; ref. 11] were amplified by PCR with appropriate eukaryotic initiation regions (12) from pNH1 (13) and pMRS315 (14), respectively. They were subcloned at the 5′ end of the flexible linker, resulting in the following constructs: FRB–F[1,2] and FKBP–F[3]. As negative controls for interactions, we generated constructs ZIP–F[1,2] and ZIP–F[3] by using PCR fragments corresponding to residues 235–281 of the GCN4 leucine zipper. For the erythropoietin receptor (EpoR) fusion constructs, a fragment comprising the extracellular and transmembrane-domain of the receptor was generated by PCR amplification from murine EpoR and fused to DHFR F[1,2] and F[3] via a 5-aa flexible linker, resulting in EpoR(1–270)–F[1,2] and EpoR(1–270)–F[3].
Creation of Stable Cell Lines (Survival Selection).
CHO DUKX-B11 (15) cells were split 24 h before transfection at 1 × 10⁵ in 12-well plates in α-MEM (Life Technologies; Grand Island, NY), which was enriched with dialyzed FBS (HyClone) and supplemented with 10 μg/ml of adenosine, deoxyadenosine, and thymidine (Sigma). Cells were transfected with the different constructs by using Lipofectamine reagent (Life Technologies) according to the manufacturer’s instructions. At 48 h after the beginning of the transfection, cells were split at ≈5 × 10⁴ in 6-well plates in selective medium consisting of α-MEM enriched with dialyzed FBS but without addition of nucleotides. Rapamycin (Calbiochem), for FRB/FKBP transfection, or Epo (R. W. Johnson Pharmaceutical Research Institute, Raritan, NJ), for EpoR/EpoR transfection, was added to the cells at a final concentration of 10 nM and 2 nM, respectively. After 5 days, a dozen surviving colonies were isolated for each transfection by trypsinizing in cloning cylinders and grown individually up to confluence.
Quantification of Selection.
Stably transfected CHO DUKX-B11 cells expressing FRB–F[1,2] and FKBP–F[3] were split at 5 × 10⁴ in 6-well plates in selective medium described above with rapamycin at concentrations ranging from 0 nM to 20 nM. The number of surviving colonies were counted after 4 days of incubation.
Fluorescence Microscopy.
CHO DUKX-B11 cells stably expressing FRB–F[1,2] and FKBP–F[3] were grown on 18-mm glass coverslips to ≈3 × 10⁵ in 12-well plates. Fluorescein-conjugated methotrexate (fMTX; Molecular Probes) was then added to the cells at a final concentration of 10 μM in selective medium, with or without addition of 20 nM rapamycin. After an incubation of 22 h at 37°C, the medium was removed, and the cells were washed with PBS and reincubated for 30 min in the selective medium (with 20 nM rapamycin in corresponding samples) to allow for efflux of unbound fMTX. The medium was removed, and cells were washed four times with PBS on ice and finally mounted on glass slides. The same procedure was followed for cells stably expressing EpoR(1–270)–F[1,2] and EpoR(1–270)–F[3], except that cells were treated with 10 nM Epo or 10 μM EMP1 (R. W. Johnson Pharmaceutical Research Institute) for only 30 min instead of overnight. Fluorescence microscopy was performed on live cells with a Zeiss Axiophot microscope (objective lens Zeiss Plan Neofluar 40×/0.75). COS-7 cells were transiently transfected with the DNA constructs by using Lipofectamine reagent as described above. Cells were grown in DMEM (Life Technologies) enriched with 10% cosmic calf serum (HyClone) and treated and analyzed by fluorescence microscopy as described for CHO DUKX-B11 cells.
Flow Cytometric Analysis.
The rapamycin-induced response of CHO DUKX-B11 cells stably expressing FRB–F[1,2] and FKBP–F[3] was monitored by fluorescence flow cytometry. Histograms are based on analysis of fluorescence intensity for 10,000 cells at flow rates of ≈1,000 cells per second. Data were collected on a fluorescence-activated cell sorter (FACS) analyzer (FACStar; Becton Dickinson) with stimulation with an argon laser tuned to 488 nm with emission recorded through a 525-nm bandwidth filter. Cells were prepared for analysis as described for fluorescence microscopy, except that after the PBS wash, cells were gently trypsinized, suspended in 500 μl of cold PBS supplemented with 10% FBS to increase cell viability, and kept on ice before cytometric analysis within 20 min. For the dose-response curve, mean fluorescence intensities were determined for three independent samples at each rapamycin concentration (between 0.1 nM and 300 nM). For the competition curve, a constant concentration of rapamycin (20 nM) was used with different concentrations of FK506 (between 0 μM and 6 μM, corresponding to a ratio of rapamycin:FK506 of 1: to 1:300, respectively). As a control, mean fluorescence intensities also were determined for each concentration of FK506 in the absence of rapamycin. For the dose-response curves of CHO DUKX-B11 cells expressing EpoR(1–270)–DHFR fragment fusions, mean fluorescence intensities were determined for three separate samples at each ligand concentration: between 0.0003 nM and 100 nM for Epo or between 0.0003 μM and 100 μM for EMP1. For all the curves, the y axis is the mean fluorescence intensity relative to the maximum intensity observed and renormalized to zero for the minimum response.
Calculation of the Number of Complexes per Cell.
CHO DUKX-B11 cells expressing FRB–F[1,2] and FKBP–F[3] were grown to confluence and treated with fMTX as described for microscopy. After a PBS wash, cells were lysed with detergent and centrifuged at 20,000 × g for 10 min to remove debris and unlysed cells. Supernatant was heated to 95°C for 10 min and centrifuged again to remove protein precipitate. Extracted fMTX was analyzed on a Luminescence Spectrometer (Perkin–Elmer LS50B; excitation and emission wavelengths were 497 nm ± 5 nm and 516 nm ± 5 nm, respectively). Concentration of fMTX in each sample was determined by direct comparison with a standard curve of fluorescence intensity vs. fMTX concentration. The number of FKBP–rapamycin–FRB complexes per cell was calculated according to:
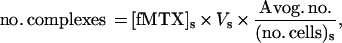 |
where no. complexes indicates the number of FKBP–rapamycin–FRB complexes; [fMTX]s is the concentration of fMTX determined in sample; Vs is the volume of sample; Avog. no. represents Avogadro’s number (6.023 × 10²³ molecules per mole); and (no. cells)s is the number of cells in sample.
RESULTS
The DHFR PCA Strategy.
The PCA strategy presented here is based on the reassembly of two designed complementary fragments of DHFR; this assembly has been successfully tested in bacteria (7). The gene for DHFR is rationally dissected into two fragments called F[1,2] and F[3]. Two proteins or protein domains that are thought to bind to each other can then be fused to either of the two DHFR fragments. Folding of DHFR from its fragments is catalyzed by the binding of the test proteins to each other and is detected as reconstitution of enzyme activity.
Prokaryotic and eukaryotic DHFRs are central to cellular one-carbon metabolism and are absolutely required for cell survival (16). Specifically, they catalyze the reduction of dihydrofolate to tetrahydrofolate for use in transfer of one-carbon units required for biosynthesis of serine, methionine, purines, and thymidylate. Reconstitution of enzyme activity can be monitored in vivo by cell survival in DHFR-negative cells grown in the absence of nucleotides. The principle of the survival DHFR PCA is that cells simultaneously expressing complementary fragments of DHFR fused to interacting proteins or peptides will survive in medium depleted of nucleotides (Fig. 1, Left). The second approach is a fluorescence assay based on the detection of fMTX binding to reconstituted DHFR (refs. 17–20; Fig. 1, Right). The basis of this assay is that complementary fragments of DHFR, when expressed and reassembled in cells, will bind with high affinity (Kd = 540 pM) to fMTX in a 1:1 complex. fMTX is retained in cells by this complex, whereas the unbound fMTX is actively and rapidly transported out of the cells (19, 20). In addition, binding of fMTX to DHFR results in a 4.5-fold increase in quantum yield. Bound fMTX, and by inference reconstituted DHFR, then can be monitored by fluorescence microscopy, FACS, or spectroscopy.
Figure 1.

Schematic representation of the strategy used to study the FKBP–rapamycin–FRB complex. (Left) FKBP and FRB are fused to one of the two complementary fragments of murine DHFR (F[1,2] and F[3]) to generate FRB–F[1,2] and FKBP–F[3]. The addition of rapamycin induces the association of FKBP with FRB, which in turn drives the reconstitution of DHFR (F-[1,2] + F-[3]), allowing DHFR-negative cells expressing these constructs to grow in medium lacking nucleotides. (Right) The fluorescence assay is based on high-affinity binding of the specific DHFR inhibitor fMTX to reconstituted DHFR. fMTX passively crosses the cell membrane, binds to reconstituted DHFR, and is thus retained in the cell. Unbound fMTX is released rapidly from the cells by active transport. Detection of bound and retained fMTX can then be detected by fluorescence microscopy, FACS, or fluorescence spectroscopy.
We chose, as our first test system, the pharmacologically well characterized rapamycin-induced association of FKBP to its target, FRB (11).
Survival Selection of Cells Expressing FKBP–Rapamycin–FRB Complex.
CHO DUKX-B11 cells were stably cotransfected with FRB and FKBP fused to one of the two DHFR complementary fragments (FRB–F[1,2] and FKBP–F[3]). Cotransfectants were selected for survival in nucleotide-free medium (selection for DHFR activity) and in the presence of rapamycin. Only cells grown in the presence of rapamycin undergo normal cell division and colony formation (Fig. 2A). In the presence of rapamycin, we clearly observed colony formation after 3–5 days, and cells became confluent after 10 days. In the absence of rapamycin, no colony formation was observed. Colony formation depended on rapamycin concentration (Fig. 2B). The threshold concentration for colony formation was found to be ≈0.05 nM. The number of colonies reached a plateau at 2 nM rapamycin with an EC50 of 600 pM. Rapamycin is a known cell-cycle inhibitor; therefore, these results would seem paradoxical, but they are not. The concentration range over which survival was induced is 100 times less than the typical EC50 necessary to arrest cell division (20). Survival depends only on the number of molecules of DHFR reassembled, and as we show below, at the threshold concentration this number is ≈25 molecules of DHFR per cell. The efficacy of selection was determined by mixing, at ratios of between 1:100 and 1:1,000,000, stably cotransfected cells with untransfected cells grown in selective medium. After 5 days of incubation, resistant clones could be detected at all dilutions up to 1 in 106 (Table 1).
Figure 2.

Survival selection of CHO DUKX-B11 cells expressing FRB–F[1,2] and FKBP–F[3]. (A) CHO DUKX-B11(DHFR−) cells were stably transfected with FRB–F[1,2] and FKBP–F[3] and selected in medium without nucleotides, rendering cells dependent on exogenous DHFR activity. Rapamycin was added to the cells at a final concentration of 10 nM to induce the association of FKBP with FRB (reconstitution of DHFR activity). Photos of cells were taken after 5 and 10 days of incubation in the selective medium in the presence (Upper) or in the absence (Lower) of rapamycin. (B) Survival selection curve showing that colony formation depends on the concentration of rapamycin. Stably transfected CHO DUKX-B11 cells expressing FRB–F[1,2] and FKBP–F[3] were split in different concentrations of rapamycin from 0 nM to 20 nM in selective medium without nucleotides. The number of colonies was established after 4 days of incubation in selective medium.
Table 1.
Efficacy of rapamycin-induced survival selection in CHO DUKX-B11 cells
| Ratio of FRB/FKBP cells:wild-type cells | Resistant colonies/ 3 × 10⁶ cells |
|---|---|
| 0:100 | 0 |
| 1:100 | 9,610 |
| 1:1,000 | 896 |
| 1:10,000 | 102 |
| 1:100,000 | 12 |
| 1:1,000,000 | 2 |
CHO DUKX-B11 cells stably expressing FRB-F[1,2] and FKBP-F[3] were mixed at various ratios with wild-type CHO DUKX-B11 cells, in a total of 3 × 10⁶ cells, and incubated in selective medium in the presence of 10 nM rapamycin. The number of colonies was established after 5 days.
Fluorescence Detection of Rapamycin-Induced FKBP/FRB Complex.
Fluorescence microscopy was performed on CHO DUKX-B11 cells expressing FRB–F[1,2] and FKBP–F[3] (Fig. 3A) and on COS-7 cells transiently expressing the same fusions (Fig. 3B). Cotransfected cells were incubated for 22 h with 10 μM fMTX in the presence or absence of saturating concentrations of rapamycin (20 nM). A strong fluorescent signal was observed in the presence of rapamycin. However, a light background of fluorescence also was observed in its absence, reflecting the weak constitutive FKBP/FRB association observed previously (11, 14). To exclude the possibility that this signal might be caused by spontaneous complementation of the F[1,2] and F[3] DHFR fragments rather than association of FKBP with FRB, we cotransfected either FRB–F[1,2] or FKBP–F[3] with noninteracting GCN4 leucine zipper-forming sequences fused to complementary DHFR fragments (ZIP–F[1,2] and ZIP–F[3]). The leucine zipper complementary pairs gave a positive signal as predicted. However, cotransfection of either of the noninteracting pairs FRB–F[1,2] with ZIP–F[3] or ZIP–F[1,2] with FKBP–F[3] resulted in no detectable fluorescence (compared with nontransfected cells).
Figure 3.

Fluorescence microscopy of cells expressing FRB–F[1,2] and FKBP–F[3]. (A) CHO DUKX-B11 cells stably expressing the fusions were incubated with fMTX at a final concentration of 10 μM, with or without addition of 20 nM rapamycin, for 22 h at 37°C. (B) COS-7 cells were transiently transfected with the fusions and treated and analyzed by fluorescence microscopy as in A. Controls include the positive interaction by leucine zipper formation (ZIP–F[1,2] + ZIP–F[3]) and negative controls for noninteracting pairs (FRB–F[1,2] + ZIP–F[3]; ZIP–F[1,2] + FKBP–F[3], not shown).
The fluorescence response of cell populations was quantified by FACS. The rapamycin-induced formation of FKBP/FRB was monitored by the shift in mean cell population fluorescence compared with noninduced cells (Fig. 4A). This shift corresponds to an 8-fold increase of fluorescence in the cell population. Rapamycin-induced fluorescence was consistent with the known pharmacological response, where cell fluorescence vs. rapamycin concentration showed single-site saturable binding with a calculated Kd of 6 nM (Fig. 4B), compared with a value of 3 nM determined in vitro (11). FK506, a competitive inhibitor of rapamycin for binding to FKBP, diminished rapamycin-induced fluorescence with a Ki of 53 nM, which is also comparable to the Ki of FK506 to compete for this interaction in vitro (Fig. 4C; ref. 11). Finally, to determine whether the constitutive interaction is mediated by the FK506/rapamycin binding pocket, we tested whether background fluorescence could be competed away with FK506 in the absence of rapamycin (Fig. 4C). No reduction in background fluorescence was observed, suggesting that the constitutive interaction of FKBP with FRB is not mediated by interactions of FRB with the FKBP binding pocket. Alternatively, some other elements on the surface of FKBP must make contact with FRB (22).
Figure 4.

Flow cytometric analysis, dose-response, and competition curves of CHO DUKX-B11 cells labeled with fMTX. (A) Induced formation of FKBP–rapamycin–FRB complex was monitored by fluorescence flow cytometry. The gray histogram corresponds to cells expressing FRB–F[1,2] and FKBP–F[3] that had been treated overnight with 20 nM rapamycin. The white histogram corresponds to untreated cells. (B) The dose-response curve for rapamycin was based on flow cytometric analysis of CHO DUKX-B11 cells expressing the same fusions. Mean fluorescence intensities were determined for three independent samples at each rapamycin concentration (between 0.1 nM and 300 nM). (C) Competition curve with the inhibitor FK506, an analog of rapamycin. Mean fluorescence intensities were determined for three independent samples at each inhibitor concentration (between 0 μM and 6 μM, corresponding to a ratio of rapamycin:FK506 of 1:0 to 1:300; closed circles). The concentration of rapamycin was kept constant at 20 nM. As a control, mean fluorescence intensities also were determined for each concentration of FK506 in the absence of rapamycin (open triangles).
Determination of the Number of FKBP–Rapamycin–FRB Complexes per Cell.
It has been shown that the fMTX concentration in cells directly correlates with the number of DHFR molecules (20). It is then possible to calculate, based on direct spectroscopic analysis, the average number of FKBP–rapamycin–FRB complexes in the cell population. Assuming that one FKBP–rapamycin–FRB complex equals one reconstituted DHFR molecule in 1:1 complex with fMTX, we calculated a number of ≈3,000 FKBP–rapamycin–FRB complexes per cell at saturating concentrations of rapamycin (20 nM) in CHO DUKX-B11 cells stably expressing these fusions. Knowing that the minimal concentration of rapamycin for cell survival is 0.05 nM (Fig. 2B), we determined that at this concentration, 25 molecules of DHFR would be reconstituted.
Fluorescence Detection of Ligand-Induced EpoR Activation.
We have also applied the DHFR PCA strategy to study the induced activation of EpoR by Epo and the EpoR agonist peptide EMP1 to show quantitative detection of induced protein assembly on the cell surface (22). CHO DUKX-B11 cells were cotransfected with EpoR extracellular and transmembrane domains [EpoR(1–270)] fused to one of the two DHFR fragments, F[1,2] or F[3]. Cotransfectants were selected for survival in nucleotide-free medium (selection for DHFR activity) and in the presence of Epo (2 nM). Fluorescence microscopy of unfixed cotransfected cells that had been incubated with fMTX showed high levels of fluorescence when cells were treated with Epo or with EMP1 at saturating concentrations (Fig. 5A). No detectable fluorescence was observed (compared with nontransfected cells) in the absence of ligands. Both Epo and EMP1 showed saturable binding isotherms with Kds of 164 pM and 168 nM, respectively (Fig. 5B). These values are consistent with previous studies of cellular binding constants. Further, our results are consistent with a single binding constant, typically observed for both Epo and EMP1 binding to receptors expressed on a variety of cell types (24, 27).
Figure 5.

Fluorescence microscopy and dose-response curves of CHO DUKX-B11 cells expressing EpoR(1–270)–DHFR fragment fusions. (A) CHO DUKX-B11 cells were stably transfected with EpoR(1–270)–F[1,2] and EpoR(1–270)–F[3] and grown in selective medium in the presence of 2 nM Epo. For microscopy, cells were incubated with fMTX as described for Fig. 3A and then treated with 10 nM Epo or 10 μM EMP1 for 30 min at 37°C. (B) Dose-response curves for Epo and EMP1 were based on flow cytometric analysis of CHO DUKX-B11 cells expressing the same fusions. Mean fluorescence intensities were determined for three separate samples at each ligand concentration: between 0.0003 nM and 100 nM for Epo (triangles) or between 0.0003 μM and 100 μM for EMP1 (circles).
DISCUSSION
We have reported the development of mammalian PCA assays to study protein–protein interactions based on DHFR. The fluorescence assay can be used in any mammalian cell line, whereas the dominant survival selection assay can be used in cells lacking DHFR activity. Recessive selection strategy in cell lines that have constitutive wild-type DHFR activity is also possible. In the experiments performed here, we used a known methotrexate resistance mutation, Phe-31 → Ser, in DHFR fragment F[1,2] (7, 28). This mutation results in a DHFR that binds to methotrexate with a Ki of 0.54 nM, which is 500 times lower in affinity than wild-type DHFR (29). The DHFR survival PCA therefore could be used in a recessive selection strategy in other mammalian cells, in which the intrinsic wild-type enzyme activity is suppressed with methotrexate at concentrations to which the reconstituted DHFR (F[1,2] + F[3]) is insensitive.
The DHFR PCAs can be used in prokaryotic or eukaryotic cells and in any subcellular compartment or membrane universally, because the components of the assay system are complete; no other cell-specific molecular machinery are necessary for the assays to work. There are specific features of the DHFR PCAs that make it particularly useful in quantitative analysis of protein–protein interactions in vivo. These features stem from the fact that the design of this system begins with dissection of a small, monomeric enzyme of known structure. First, because the enzyme is monomeric and results from association-folding of two fragments, clearly, it can be assumed that an observed response is caused by a binary protein–protein interaction. Second, the absolute regiospecific and stereospecific requirement that fragments be sufficiently close to fold-reassemble into the enzyme’s three-dimensional structure means that a false response, which might occur if fused interacting proteins are merely proximal, is unlikely. Third, we can control the stringency of the assay by introducing fragment-interface mutations that disrupt spontaneous reassembly of the fragments. We have demonstrated the use of such “stringency” mutants for other test systems in an Escherichia coli survival assay (7).
Finally, it is notable that the FKBP–rapamycin–FRB complex studied here is in fact an example of a “three-hybrid” interaction in which a protein–protein interaction is mediated by a third molecule (30, 33). As well as demonstrating this immediate extension of the DHFR PCA to applications of this sort, our results suggest another feature. The simple survival assay depends on the reassembly of a very small number of DHFR molecules and explains why an otherwise potent cell-cycle inhibitor such as rapamycin can be used in these studies. These results suggest that the DHFR assays would have some utility in testing compounds, or combinatorial libraries of compounds, designed to induce or inhibit protein–protein interactions at concentrations that would not cause specific or nonspecific toxic effects on living cells. Potentially toxic genes, expressed at low levels, could be used in the DHFR PCA without detrimental effects on cells because of the sensitivity of the assay. Combined with the use of inducible promoters and the ability to detect the rare events described here (Table 1), these results suggest a robust cDNA screening strategy that could be used in a broad number of cell types.
Acknowledgments
We thank Monique Davies for the gifts of the pMT3 vector and the CHO DUKX-B11 cell line, Joe Heitman for the plasmid pMRS315, Ursula Klingmuller for the EpoR clone, and Dana Johnson and Linda Jolliffe for Epo and EMP1. This work was supported by the Burroughs–Wellcome Fund, and S.W.M. is a Burroughs–Wellcome Fund New Investigator Awardee.
ABBREVIATIONS
- DHFR
dihydrofolate reductase
- PCA
protein-fragment complementation assay
- FKBP
FK506 binding protein
- FRAP
FKBP–rapamycin binding protein
- FRB
FKBP–rapamycin binding domain of FRAP
- Epo
erythropoietin
- EpoR
Epo receptor
- fMTX
fluorescein-conjugated methotrexate
- FACS
fluorescence-activated cell sorter
Footnotes
This paper was submitted directly (Track II) to the Proceedings Office.
References
- 1.Reed L J. Acc Chem Res. 1974;7:40–46. [Google Scholar]
- 2.Perham R N. Philos Trans R Soc London B. 1975;272:123–136. doi: 10.1098/rstb.1975.0075. [DOI] [PubMed] [Google Scholar]
- 3.Fields S, Song O. Nature (London) 1989;340:245–246. doi: 10.1038/340245a0. [DOI] [PubMed] [Google Scholar]
- 4.Johnsson N, Varshavsky A. Proc Natl Acad Sci USA. 1994;91:10340–10344. doi: 10.1073/pnas.91.22.10340. [DOI] [PMC free article] [PubMed] [Google Scholar]
- 5.Pelletier J N, Michnick S W. Protein Eng. 1997;10:89. [Google Scholar]
- 6.Pelletier, J. N., Remy, I. & Michnick, S. W. (1998) J. Biomol. Tech. acc. no. 50012.
- 7.Pelletier J N, Campbell-Valois F-X, Michnick S W. Proc Natl Acad Sci USA. 1998;95:12141–12146. doi: 10.1073/pnas.95.21.12141. [DOI] [PMC free article] [PubMed] [Google Scholar]
- 8.Rossi F, Charlton C A, Blau H M. Proc Natl Acad Sci USA. 1997;94:8405–8410. doi: 10.1073/pnas.94.16.8405. [DOI] [PMC free article] [PubMed] [Google Scholar]
- 9.Karimova G, Pidoux J, Ullmann A, Ladant D. Proc Natl Acad Sci USA. 1998;95:5752–5756. doi: 10.1073/pnas.95.10.5752. [DOI] [PMC free article] [PubMed] [Google Scholar]
- 10.Kaufman R J, Davies M V, Pathak V K, Hershey J W. Mol Cell Biol. 1989;9:946–958. doi: 10.1128/mcb.9.3.946. [DOI] [PMC free article] [PubMed] [Google Scholar]
- 11.Chen J, Zheng X F, Brown E J, Schreiber S L. Proc Natl Acad Sci USA. 1995;92:4947–4951. doi: 10.1073/pnas.92.11.4947. [DOI] [PMC free article] [PubMed] [Google Scholar]
- 12.Kozak M. Annu Rev Cell Biol. 1992;8:197–225. doi: 10.1146/annurev.cb.08.110192.001213. [DOI] [PubMed] [Google Scholar]
- 13.Standaert R F, Galat A, Verdine G L, Schreiber S L. Nature (London) 1990;346:671–674. doi: 10.1038/346671a0. [DOI] [PubMed] [Google Scholar]
- 14.Cardenas M E, Heitman J. EMBO J. 1995;14:5892–5907. doi: 10.1002/j.1460-2075.1995.tb00277.x. [DOI] [PMC free article] [PubMed] [Google Scholar]
- 15.Urlaub G, Chasin L A. Proc Natl Acad Sci USA. 1980;77:4216–4220. doi: 10.1073/pnas.77.7.4216. [DOI] [PMC free article] [PubMed] [Google Scholar]
- 16.Bertino J R, Hillcoat B L. Adv Enzyme Regul. 1968;6:335–349. doi: 10.1016/0065-2571(68)90021-6. [DOI] [PubMed] [Google Scholar]
- 17.Blakley R L. In: Folates and Pterins: Chemistry and Biochemistry of Folates. Blakley R, Benkovic S, editors. Vol. 1. New York: Wiley; 1984. pp. 191–253. [Google Scholar]
- 18.Gapski G R, Whiteley J M, Rader J I, Cramer P L, Henderson G B, Neef V, Huennekens F M. J Med Chem. 1975;18:526–528. doi: 10.1021/jm00239a020. [DOI] [PubMed] [Google Scholar]
- 19.Israel D I, Kaufman R J. Proc Natl Acad Sci USA. 1993;90:4290–4294. doi: 10.1073/pnas.90.9.4290. [DOI] [PMC free article] [PubMed] [Google Scholar]
- 20.Kaufman R J, Bertino J R, Schimke R T. J Biol Chem. 1978;253:5852–5860. [PubMed] [Google Scholar]
- 21.Chung J, Kuo C J, Crabtree G R, Blenis J. Cell. 1992;69:1227–1236. doi: 10.1016/0092-8674(92)90643-q. [DOI] [PubMed] [Google Scholar]
- 22.Choi J, Chen J, Schreiber S L, Clardy J. Science. 1996;273:239–242. doi: 10.1126/science.273.5272.239. [DOI] [PubMed] [Google Scholar]
- 23.Remy I, Wilson I A, Michnick S W. Science. 1999;283:990–993. doi: 10.1126/science.283.5404.990. [DOI] [PubMed] [Google Scholar]
- 24.D’Andrea A D, Lodish H F, Wong G G. Cell. 1989;57:277–285. doi: 10.1016/0092-8674(89)90965-3. [DOI] [PubMed] [Google Scholar]
- 25.D’Andrea A D, Yoshimura A, Youssoufian H, Zon L I, Koo J W, Lodish H F. Mol Cell Biol. 1991;11:1980–1987. doi: 10.1128/mcb.11.4.1980. [DOI] [PMC free article] [PubMed] [Google Scholar]
- 26.Johnson D L, Farrell F X, Barbone F P, McMahon F J, Tullai J, Hoey K, Livnah O, Wrighton N C, Middleton S A, Loughney D A, et al. Biochemistry. 1998;37:3699–3710. doi: 10.1021/bi971956y. [DOI] [PubMed] [Google Scholar]
- 27.Wrighton N C, Farrell F X, Chang R, Kashyap A K, Barbone F P, Mulcahy L S, Johnson D L, Barrett R W, Jolliffe L K, Dower W J. Science. 1996;273:458–464. doi: 10.1126/science.273.5274.458. [DOI] [PubMed] [Google Scholar]
- 28.Thillet J, Absil J, Stone S R, Pictet R. J Biol Chem. 1988;263:12500–12508. [PubMed] [Google Scholar]
- 29.Appleman J R, Prendergast N, Delcamp T J, Freisheim J H, Blakley R L. J Biol Chem. 1988;263:10304–10313. [PubMed] [Google Scholar]
- 30.Liberles S D, Diver S T, Austin D J, Schreiber S L. Proc Natl Acad Sci USA. 1997;94:7825–7830. doi: 10.1073/pnas.94.15.7825. [DOI] [PMC free article] [PubMed] [Google Scholar]
- 31.Licitra E J, Liu J O. Proc Natl Acad Sci USA. 1996;93:12817–12821. doi: 10.1073/pnas.93.23.12817. [DOI] [PMC free article] [PubMed] [Google Scholar]
- 32.Sengupta D J, Zhang B L, Kraemer B, Pochart P, Fields S, Wickens M. Proc Natl Acad Sci USA. 1996;93:8496–8501. doi: 10.1073/pnas.93.16.8496. [DOI] [PMC free article] [PubMed] [Google Scholar]
- 33.Zhang J, Lautar S. Anal Biochem. 1996;242:68–72. doi: 10.1006/abio.1996.0429. [DOI] [PubMed] [Google Scholar]