Abstract
The synthesis of fatty acids and cholesterol, the building blocks of membranes, is regulated by three membrane-bound transcription factors: sterol regulatory element-binding proteins (SREBP)-1a, -1c, and -2. Their function in liver has been characterized in transgenic mice that overexpress each SREBP isoform and in mice that lack all three nuclear SREBPs as a result of gene knockout of SREBP cleavage-activating protein (SCAP), a protein required for nuclear localization of SREBPs. Here, we use oligonucleotide arrays hybridized with RNA from livers of three lines of mice (transgenic for SREBP-1a, transgenic for SREBP-2, and knockout for SCAP) to identify genes that are likely to be direct targets of SREBPs in liver. A total of 1,003 genes showed statistically significant increased expression in livers of transgenic SREBP-1a mice, 505 increased in livers of transgenic SREBP-2 mice, and 343 showed decreased expression in Scap–/– livers. A subset of 33 genes met the stringent combinatorial criteria of induction in both SREBP transgenics and decreased expression in SCAP-deficient mice. Of these 33 genes, 13 were previously identified as direct targets of SREBP action. Of the remaining 20 genes, 13 encode enzymes or carrier proteins involved in cholesterol metabolism, 3 participate in fatty acid metabolism, and 4 have no known connection to lipid metabolism. Through application of stringent combinatorial criteria, the transgenic/knockout approach allows identification of genes whose activities are likely to be controlled directly by one family of transcription factors, in this case the SREBPs.
The two major building blocks for animal cell membranes are cholesterol and fatty acids. Their synthesis begins with a common precursor, acetyl-CoA, which originates from the catabolism of carbohydrates, proteins, and lipids. Acetyl-CoA is converted to cholesterol in a pathway involving at least 23 enzymes. Acetyl-CoA is also polymerized to form fatty acids in a pathway involving up to 12 enzymatic steps. Many of the mRNAs encoding enzymes in these two pathways are regulated coordinately by the sterol regulatory element-binding protein (SREBP) family of membrane-bound transcription factors (1).
The three SREBP isoforms in mammals are designated SREBP-1a, SREBP-1c, and SREBP-2 (2). They belong to the basic helix–loop–helix leucine zipper (bHLH-Zip) family of transcription factors. Unlike other bHLH-Zip proteins, SREBPs are intrinsic membrane proteins of the endoplasmic reticulum (ER). All SREBP precursors consist of an NH2-terminal ≈500 aa that contains the bHLH-Zip region, two hydrophobic transmembrane-spanning segments interrupted by a short ≈30-aa segment, and an ≈590-aa COOH-terminal domain that has a regulatory function. The NH2-terminal segment of SREBP, designated the nuclear form (nSREBP), must be released from the membrane so that it can enter the nucleus and activate transcription of target genes.
The release of active nSREBPs requires two sequential cleavages (2). This process is initiated when the COOH-terminal domain of the membrane-bound SREBP binds to SREBP cleavage-activating protein (SCAP). SCAP serves both as a sensor of sterols and as an escorter of SREBPs. When the ER membrane becomes depleted in cholesterol, SCAP escorts SREBP from the ER to the Golgi, where it is cleaved sequentially by two proteases to liberate the nSREBP. In the nucleus, nSREBPs bind to 10-bp repeats known as sterol response elements located in the promoters of target genes (2).
When the cholesterol content of the ER membrane rises, a conformational change in SCAP facilitates its binding to one of two related proteins designated Insig-1 and Insig-2 (3, 4). This interaction results in the retention of the SCAP/SREBP complex in the ER, thus preventing its incorporation into ER transport vesicles. The net result is that SREBPs no longer are processed proteolytically in the Golgi, their bHLH-Zip domains cannot be released from the ER membrane, and the transcription of target genes is reduced.
When expressed at superphysiologic levels, the nuclear forms of all three SREBPs activate genes encoding multiple enzymes in the cholesterol and fatty acid biosynthetic pathways as well as the low-density lipoprotein (LDL) receptor (1). The relative activities of the three isoforms differ. SREBP-1a is a potent activator of all SREBP-responsive genes, owing to its long transactivation domain encoded by its first exon. SREBP-1c, an alternatively spliced version of SREBP-1a, differs from SREBP-1a by only the first exon. In SREBP-1c, this exon encodes a shorter transactivation domain that is less potent than SREBP-1a (1). Although they differ in potency, SREBP-1a and -1c both activate genes involved in the synthesis of fatty acids and their incorporation into triglycerides and phospholipids. SREBP-2, encoded by a different gene, preferentially activates genes for cholesterol synthesis and the LDL receptor (5).
The function of SREBPs in vivo has been characterized through studies in transgenic and knockout mice that overexpress or lack single components of the SREBP pathway (1). The overexpression of nSREBP-1a produced the most dramatic phenotype. These transgenic mice developed a massive fatty liver engorged with both triglycerides and cholesteryl esters (6). Genes controlling fatty acid synthesis were more dramatically activated than those for cholesterol synthesis. The preferential activation of fatty acid synthesis (26-fold increase) relative to cholesterol synthesis (5-fold increase) explained the greater accumulation of hepatic triglycerides. Overexpression of the weaker nSREBP-1c in liver of transgenic mice produced a triglyceride-enriched fatty liver with no increase in cholesterol (1). Overexpression of nSREBP-2 in liver increased the mRNAs encoding all cholesterol biosynthetic enzymes, the most dramatic of which was a 75-fold increase in 3-hydroxy-3-methylglutaryl coenzyme A reductase mRNA (5). There was a lesser effect on mRNAs necessary for fatty acid synthesis. The in vivo rate of cholesterol synthesis was increased 28-fold in transgenic nSREBP-2 livers, whereas fatty acid synthesis was increased only 4-fold.
Germ-line deletion of genes required for SREBP processing (Scap or one of the proteases) results in early embryonic death (1). To study the metabolic consequence of total nSREBP deficiency in liver, we produced conditional knockouts of Scap in adult mouse liver by using the Cre-lox recombination system (7). The disruption of Scap dramatically reduced nSREBP-1 and nSREBP-2 in liver and the coordinate expression of their target genes in the cholesterol and fatty acid biosynthetic pathways. As a result, the rates of cholesterol and fatty acid synthesis fell by 70–80% in livers of Scap knockout mice.
Although many direct targets of SREBP action have been identified through studies of SREBP binding to enhancer regions, the list is likely incomplete. Direct SREBP targets cannot be identified by DNA sequence alone because sequences recognized by SREBPs show great variability among genes, and no universal consensus sequence can be formulated (8).
In the current paper, we attempt to identify direct SREBP targets through the use of microarray analysis. This goal was accomplished by using Affymetrix oligonucleotide arrays hybridized with RNA from livers of three types of mice: transgenic mice that overexpress nSREBP-1a (TgSREBP-1a), transgenic mice that overexpress nSREBP-2 (TgSREBP-2), and knockout SCAP mice (Scap–/–) that manifest reduced expression of all SREBPs. As a strict criteria for SREBP target genes, we selected genes that were up-regulated in both transgenic models and down-regulated in Scap–/– mice. This filter identified 33 genes, 13 of which are known direct targets of SREBP action. The remaining 20 had not been identified previously as direct SREBP target genes.
Methods
Methods for confirmatory cDNA microarray studies and real-time PCR may be found in Supporting Methods, which is published as supporting information on the PNAS web site, www.pnas.org.
Animals. The transgenic mice that overexpress transcriptionally active nuclear forms of human SREBP-1a (TgSREBP-1a) or SREBP-2 (TgSREBP-2) and mice that lack SCAP (Scap–/–) in liver have been described (5–7). All mice were housed in colony cages in rooms maintained on a 12-h light/12-h dark cycle and fed Teklad Mouse/Rat Diet no. 7002 from Harlan Teklad Premier Laboratory Diets (Madison, WI). The transgenic mouse studies included five 12- to 16-wk-old male TgSREBP-1a and TgSREBP-2 mice and 5 male littermate wild-type controls that were fed a high protein/low carbohydrate diet for 2 weeks before killing (6). This diet was used to elicit high-level expression of the nSREBPs, whose promoters were driven by the phosphoenol-pyruvate carboxykinase (PEPCK) enhancer, the expression of which is increased by low carbohydrate diet (6). Studies using liver-specific Scap–/– mice included five 10- to 12-wk-old male Scap–/–;MX1-Cre and corresponding wild-type mice that received four i.p. injections of polyinosinic-polycytidylic acid to induce the Cre recombinase as described (7). These mice were fed the Teklad chow and killed 14 days after the last injection.
RNA Isolation, Affymetrix Oligonucleotide Array Hybridization, and Data Analysis. Total RNA was prepared from each liver by using RNA STAT-60 (Tel-Test, Friendswood, TX). Equal aliquots of total RNA from each of five mouse livers in each group were pooled (total, 20 μg) and used for biotin labeling as described in the Affymetrix technical bulletin. Hybridization, washing, scanning, and analysis of the Affymetrix GeneChip Murine Genome MU74A, -B, and -C version 2 arrays (Affymetrix, Santa Clara, CA) were carried out as described (9). Duplicate hybridizations were performed with each RNA sample. Data obtained from the microarray hybridizations was processed with MICROARRAY SUITE 5.0 (Affymetrix) software.
Results
The expression of ≈36,700 transcripts represented on the Affymetrix Mouse Genome MU74A, -B, and -C version 2 microarrays was quantified in pooled liver samples from transgenic mice that overexpress nSREBP-1a or nSREBP-2 or that have a deficiency of all SREBP isoforms as a result of deleting Scap in liver. Duplicate hybridizations were performed for each sample. Overall, ≈8,000 transcripts (22%) were expressed in livers of wild-type mice (identified as “present” by Affymetrix software). The TgSREBP-1a mouse livers expressed 9,229 transcripts, TgSREBP-2 livers 8,341 transcripts, and Scap–/– livers 7,719 transcripts (Table 5, which is published as supporting information on the PNAS web site).
Using the Mann–Whitney ranking feature of the Affymetrix software as criteria for statistical significance, we identified 1,003 transcripts as increased in livers of TgSREBP-1a mice, 505 increased in the TgSREBP-2 mice, and 343 decreased in Scap–/– mice. The majority of these changes are not caused by direct actions of SREBPs but are secondary to the long-term changes in metabolism that occur when nSREBP levels are manipulated.
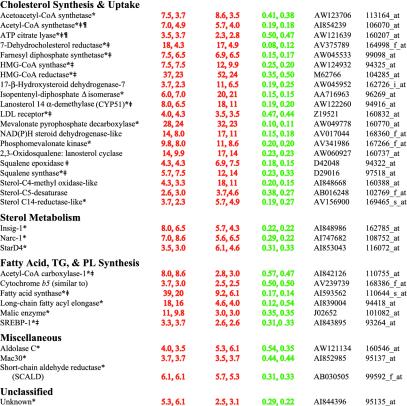
To identify genes that are likely to be direct targets of nSREBPs, we filtered genes according to various criteria outlined in Tables 1, 2, 3, 4. The most stringent criteria are shown in Table 1, which lists genes whose mRNAs were increased >2.5-fold in livers of both TgSREBP-1a and TgSREBP-2 mice and decreased by >40% in Scap–/– mice. These highly stringent criteria identified most, but not all, of the genes previously identified as direct SREBP targets on the basis of short-term transcription reporter assays in cultured cells and/or DNA binding assays. Thirty-three genes met these stringent criteria (Table 1). Nineteen genes encode proteins that participate in cholesterol biosynthesis and 1 in cholesterol uptake (low-density lipoprotein receptor). Ten of these 19 cholesterol-related genes had been characterized previously as direct SREBP targets (denoted by symbol ‡ in Table 1) (1, 8).
Table 1.
Genes whose transcripts in mouse liver increase in TgSREBP-1a, increase in TgSREBP-2, and decrease in Scap–/–
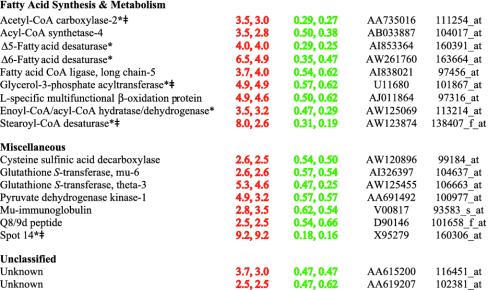
Table 2.
Genes whose transcripts in mouse liver increase in TgSREBP-1a, decrease in Scap–/–, and are unchanged in TgSREBP-2
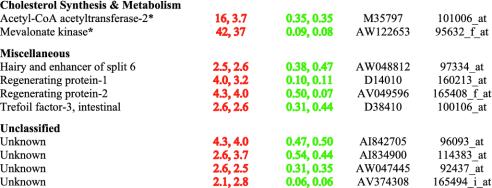
Table 3.
Genes whose transcripts in mouse liver increase in TgSREBP-2, decrease in Scap–/–, and are unchanged in TgSREBP-1a
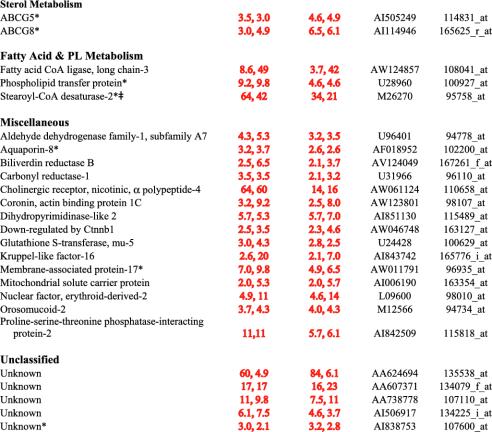
Table 4.
Genes whose transcripts in mouse liver increase in TgSREBP-1a, increase in TgSREBP-2, and are unchanged in Scap–/–
In addition to the 19 cholesterol biosynthetic genes, 3 genes encode proteins involved in other aspects of sterol metabolism: Insig-1, Narc-1, and StarD4 (Table 1). Insig-1 blocks SREBP activation by inhibiting movement of the SCAP/SREBP complex from the ER to the Golgi in the presence of sterols (3). Its up-regulation by SREBPs provides a feedback mechanism to reduce SREBP cleavage when adequate sterol levels are present in cells. A potential SREBP-binding site exists in the promoter of Insig-1, but analysis of promoter function has not been performed.
Narc-1 is a serine protease that belongs to the proteinase K subfamily of subtilases (10). Mutations in its human orthologue cause a rare autosomal dominant form of hypercholesterolemia, suggesting that Narc-1 is involved in lipid metabolism (11). Its regulation by SREBPs has not been reported previously. StarD4 was recently identified in microarray analysis of mouse liver as a gene that is negatively regulated by cholesterol feeding, consistent with it being an SREBP target (12). Although the function of StarD4 is not known, it belongs to a family of proteins that contain a START (steroidogenic acute regulatory protein–related lipid transfer) domain. The founding member of this family, StAR, delivers cholesterol to the mitochondria in steroidogenic cells (12), but it is not expressed in liver. A second family member, StarD3/MNL64, binds cholesterol in vitro (13), but is not regulated by SREBPs. Like its relatives, StarD4 may be involved in sterol transport, and a potential SREBP-binding site is present in the StarD4 promoter (12).
Among the 33 genes that met the strict criteria of Table 1, 6 are involved in fatty acid, triglyceride, and phospholipid synthesis. Three were previously characterized as direct SREBP targets (denoted by ‡ in Table 1) (1). One additional gene, long-chain fatty acyl elongase, is regulated by SREBPs, although no formal promoter studies have been performed (1). Cytochrome b5 is a membrane-bound protein that donates electrons to a variety of acceptors that are intermediates in fatty acid desaturation as well as cholesterol biosynthesis (14). The induction of cytochrome b5 is likely required to maintain the high rates of cholesterol and fatty acid biosynthesis present in livers of SREBP transgenic mice. In addition to the above 6 genes, 2 genes listed under cholesterol synthesis (acetyl-CoA synthetase and ATP citrate lyase) also participate in fatty acid biosynthesis.
Three genes listed in Table 1 are labeled “miscellaneous,” and one encodes a novel protein of unknown function. The three miscellaneous genes may have indirect roles in lipid metabolism. Aldolase C is a glycolytic enzyme that catalyzes the cleavage of fructose-1,6-bisphosphate, which produces glyceraldehyde-3-phosphate and dihydroacetone phosphate, the fourth step in the glycolytic pathway. Up-regulation of aldolase C by SREBPs may increase the supply of acetyl-CoA for fatty acid and cholesterol biosynthesis. Mac30 is structurally related to the family of insulin-like growth factor binding proteins, but its function is unknown. The short-chain aldehyde reductase (SCALD) was recently identified as a gene activated by SREBPs by using suppressive subtractive hybridization of tissues from TgSREBP-1a mice (15). SCALD catalyzes the reduction of potentially toxic short-chain fatty aldehydes, such as nonanal and 4-hydroxynonenal, converting them to less toxic alcohols. Fatty aldehydes can be formed when unsaturated fatty acids undergo oxidation; thus, it is hypothesized that regulation of SCALD by SREBPs is a protective cellular response to increased production of unsaturated fatty acids that occurs when SREBPs are activated.
Table 2 lists genes whose expression was increased in livers of TgSREBP-1a mice, reduced in Scap–/– mice, and unchanged in TgSREBP-2 mice. Nine genes involved in fatty acid synthesis and metabolism were identified, 3 of which [acetyl-CoA carboxylase-2, glycerol-3-phosphate acyltransferase, and stearoyl-CoA desaturase (SCD)] were previously identified as SREBP target genes (1, 16, 17). Of the remaining 4 genes, 2 (acyl-CoA synthetase-4 and fatty acid CoA ligase, long-chain 5) add the CoA moiety to long-chain fatty acids, resulting in their activation, a step required for their incorporation into triglycerides, phospholipids, and cholesteryl esters. The last 2 identified genes involved in fatty acid synthesis and metabolism (L-specific multifunctional β-oxidation protein and a putative enoyl-CoA/acyl-CoA hydratase/dehydrogenase) are both likely to be peroxisomal enzymes involved in the oxidation of very long-chain fatty acids. Whether these are direct targets of SREBP-1a, or whether they are activated as a secondary response to increased fatty acid levels, is unknown.
In the miscellaneous and unclassified categories of Table 2, only spot 14 was previously described as a direct transcriptional target of SREBPs (18). Spot 14 mRNA levels are regulated in a manner similar to all genes involved in lipogenesis; its function is not known (19). Three of the miscellaneous genes in Table 2 (cysteine sulfinic acid decarboxylase; glutathione S-transferase, mu-6; and glutathione S-transferase, theta-3) may protect cells from oxidative products. Cysteine sulfinic acid decarboxylase converts cysteine sulfinate to taurine, which may protect cells from oxidative injury through formation of taurine chloramines that are produced by myeloperoxidase (20). The general function of glutathione S-transferases is to detoxify compounds by addition of glutathione sulfhydryl groups to electrophilic molecules. The physiologic substrates of the mu-6 and theta-3 forms of glutathione S-transferase are not known, but they may be induced to detoxify oxidized lipids that may accumulate in the fatty livers of the TgSREBP-1a mice. Six additional members of the glutathione S-transferase family (theta-1, theta-2, mu-2, mu-5, and glutathione peroxidases-3 and -4) were increased in TgSREBP-1a mouse livers, but not decreased in livers of Scap–/– mice (see Table 5).
Table 3 lists 10 genes whose pattern of expression was increased in livers of TgSREBP-2 mice, decreased in Scap–/– mice, and unchanged in TgSREBP-1a mice. Two of the 10 genes are in the cholesterol biosynthetic pathway, one of which, mevalonate kinase, was strikingly increased (>40-fold) in TgSREBP-2 livers and markedly decreased (≈92%) in livers of Scap–/– mice (Table 3). The 8 miscellaneous and unclassified genes have no obvious connection to lipid metabolism.
Table 4 lists 25 genes whose pattern of expression was increased in livers of TgSREBP-1a and TgSREBP-2 mice and unchanged in livers of Scap–/– mice. This pattern of regulation suggests that these 25 genes are capable of responding to SREBPs, either directly or indirectly, but their basal expression does not require nSREBPs. Two ATP-binding cassette proteins, ABCG5 and ABCG8, are directly involved in sterol metabolism. These proteins form heterodimers that transport sterols across the plasma membrane in liver and intestine (21). Mutations in either ABCG5 or ABCG8 result in β-sitosterolemia, an autosomal recessive human disorder characterized by increased intestinal absorption and decreased biliary excretion of dietary sterols and hypercholesterolemia (21). The only characterized transcriptional regulators of ABCG5 and ABCG8 are the nuclear receptors LXR-α and LXR-β (22). Activation of cholesterol biosynthesis by SREBPs produces endogenous oxysterol ligands that activate LXR (23), which in turn transcriptionally activates expression of ABCG5 and ABCG8.
Three additional genes involved in fatty acid and phospholipid metabolism (fatty acid CoA ligase, long chain-3; phospholipid transfer protein; and SCD-2) were markedly increased in TgSREBP-1a and TgSREBP-2 livers. Fatty acid CoA ligase is involved in the activation of fatty acids. Phospholipid transfer protein, like ABCG5 and ABCG8, is regulated by LXRs (24) and may be increased as a result of activation of this nuclear receptor. Previously, SCD-2 was identified as an SREBP target gene (16). SCD-2 is not normally expressed in livers of wild-type mice, but is expressed in TgSREBP-1a and -2 livers, thus explaining why it was not detected as decreased in livers of Scap–/– mice (19).
Fifteen genes are listed in the miscellaneous category in Table 4. Aquaporin-8 is a member of a family of membrane proteins that function as water-selective channels. Aquaporin-8 has been localized intercellularly to the canalicular membrane, which suggests that it may be involved in water transport into bile (25). Biliary cholesterol secretion is markedly increased in SREBP transgenic mice (J.D.H., unpublished observations), and this may be coupled with enhanced water excretion.
Four of the 15 genes in the miscellaneous category of Table 4 (aldehyde dehydrogenase family 1; biliverdin reductase B; glutathione S-transferase, mu-5; and nuclear factor, erythoid-derived-2) have roles in protecting cells from oxidative injury. Cytosolic aldehyde dehydrogenase participates in the oxidation of various aldehydes, including all-trans-retinal and 4-hydroxynonenal, a major aldehyde product of lipid peroxidation (26). Biliverdin, a product of heme oxygenase activity, is metabolized by biliverdin reductase to produce bilirubin, which is a potent antioxidant (27).
In formulating the criteria in Tables 1, 2, 3, 4, we included only those genes whose mRNAs rose by >2.5-fold or declined to <60% of the basal value. The Affymetrix software identifies mRNAs that change in a statistically significant manner without regard to arbitrary cutoffs. Table 6 (which is published as supporting information on the PNAS web site) compares the number of genes that meet our criteria and the Affymetrix statistical criteria. In each case, the Affymetrix criteria identified additional genes whose expression changed in a statistical sense, but <2.5-fold.
Discussion
In the current experiments, we devise a method of combinatorial analysis of microarrays to define a set of genes whose transcription in liver increases in response to elevated nSREBPs and whose basal expression depends on SREBPs, as indicated by a fall in mRNA levels in Scap–/– liver. Genes that satisfy these stringent criteria are likely to be directly responsive to SREBPs by virtue of SREBP binding sites in their enhancer regions. This conclusion is supported by the finding that 19 of 23 genes in the cholesterol biosynthetic pathway met these stringent criteria (Table 1). The same is true for 5 of 10 genes in the pathway for synthesis of fatty acids.
In revealing genes that are direct SREBP targets, the combined microarray analysis may suggest a function for the encoded gene products. One example is 17-β-hydroxysteroid dehydrogenase-7, which meets the stringent criteria for direct SREBP regulation and shows highest expression in TgSREBP-2 mice, suggesting that it plays a role in cholesterol synthesis. This enzyme reduces the 17-keto group of estrone, converting it to estradiol (28). However, it is possible that this enzyme also reduces the 3-keto group of cholesterol precursors, a necessary step in cholesterol synthesis and one for which no enzyme has heretofore been identified.
Among the 33 genes that met the strict criteria for SREBP gene targets, there was a relative difference between those involved in cholesterol and fatty acid metabolism. In general, the cholesterol-related genes tended to be more strongly activated by overexpression of nSREBP-2 and the fatty acid-related genes were more strongly affected by nSREBP-1a (see Tables 1, 2, 3).
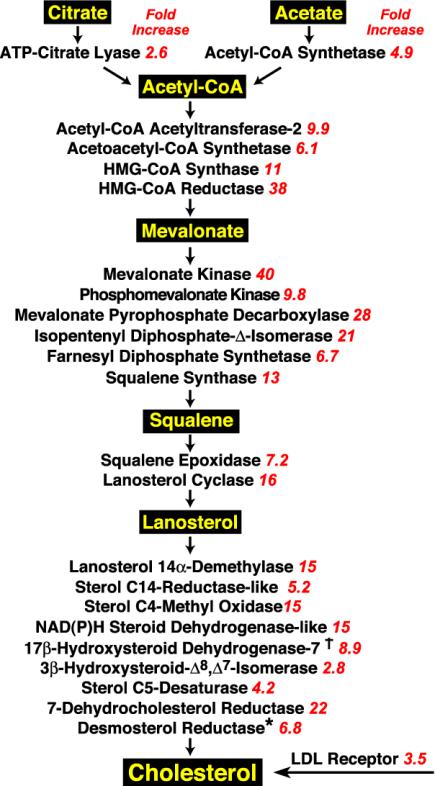
Fig. 1 lists the known enzymes in the cholesterol biosynthetic pathway and indicates the average fold activation of each gene in TgSREBP-2 mice. Twenty-two of the 23 genes were analyzed on the microarray. The remaining gene (desmosterol reductase) was not present on the chip, but was analyzed in the same RNA samples by real-time PCR. All of these genes were activated in TgSREBP-2 mice, and the fold increase in mRNA ranged from 2.6-fold to 40-fold (median of 9.9-fold). Nineteen of the 23 genes met stringent criteria of increased expression in both transgenics and decreased expression in Scap–/– liver. Two of the four exceptions were acetyl-CoA acetyltransferase-2 and mevalonate kinase, which were elevated by 10- and 40-fold, respectively, in TgSREBP-2 mice and decreased by 65% and 90%, respectively, in Scap–/– mice, but were not elevated in TgSREBP-1a mice (Table 2). A third exception, 3β-hydroxysteroid-Δ8,Δ7-isomerase, just missed the stringent criteria for inclusion (see Table 6), but was recently identified as a direct SREBP target (29). The fourth exception, desmosterol reductase, was not represented on the microarray, but its regulation was confirmed by real-time PCR.
Fig. 1.
SREBP-2 mediated activation of the entire pathway for cholesterol synthesis in mammalian cells. Key biosynthetic intermediates are highlighted in yellow. Red italics denotes the fold increase in mRNA levels for each enzyme in TgSREBP-2 liver. Each value is the average of the two microarray hybridizations listed in Tables 1 and 3. *, Desmosterol reductase was not represented on the microarray. The fold-increase value is from real-time PCR. †,17β-Hydroxysteroid dehydrogenase-7 has not been confirmed as a cholesterol biosynthetic enzyme.
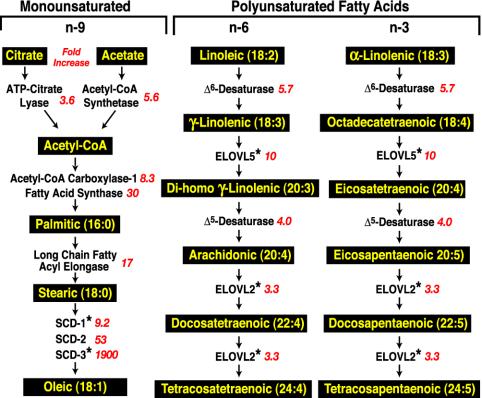
Fig. 2 shows the fold increase in TgSREBP-1a mice of genes that participate in the synthesis of fatty acids. The most highly induced genes were those responsible for synthesis of monounsaturated fatty acids (acetyl-CoA carboxylase-1, fatty acid synthase, long-chain fatty acyl elongase, and SCD-1, -2, and -3). As indicated by the marked fold-increase values, SCD-2 and SCD-3 are essentially only expressed in liver under conditions of SREBP activation. The enzymes required for elongation of very long-chain polyunsaturated fatty acids (Δ6-desaturase, Elovl5, Δ5-desaturase, and Elovl2) were induced, but to a lesser extent than those involved in monounsaturated fatty acid synthesis.
Fig. 2.
SREBP-1a mediated activation of pathways for monounsaturated and polyunsaturated fatty acid synthesis in mammalian cells. Fatty acid products are highlighted in yellow. Red italics denotes the fold increase in mRNA levels for each enzyme in TgSREBP-1a liver. Each value is the average of the two microarray hybridizations listed in Tables 1 and 2 except as indicated. *, Results are from real-time PCR.
The filter afforded by the combined use of transgenic and knockout mice helped to eliminate genes that are activated indirectly by the products of SREBP action, rather than by SREBP directly. For example, we were able to exclude genes that are regulated by the nuclear receptors LXRα and LXRβ. LXRs form heterodimers with retinoid X receptors (RXR) and are activated by a variety of sterols, including oxysterol intermediates in the synthesis of cholesterol (23, 30). The increase in cholesterol biosynthesis that results from SREBP overexpression produces endogenous ligands that activate LXR. Using the combined approach, we identified phospholipid transfer protein, lipoprotein lipase, ABCG5, and ABCG8 as genes activated in transgenic livers, but not decreased in livers of Scap–/– mice (Table 4). These genes are known to be activated by LXR. Two additional LXR-regulated genes, SREBP-1c and fatty acid synthase, also contain SREBP-binding sites in their promoters (30–32) and were correctly identified as direct SREBP target genes (Table 1).
The current studies also illustrate the importance of correlating tissue culture promoter-reporter assays with results in relevant organs in vivo. In cultured cells, overexpressed SREBPs bind to the promoters of and activate the transcription of genes encoding apoAII, (33) and SR-BI (34). However, in TgSREBP-1a and TgSREBP-2 livers, no induction of the mRNA for these two genes was observed nor did their expression decrease in Scap–/– mice. Similarly, in vitro studies showed that SREBP-2 inhibits the transcription of Cyp8bl (35), a finding that was not reproduced in livers of TgSREBP-2 and Scap–/– mice.
In addition to genes that met stringent criteria for SREBP regulation, we identified ≈600 transcripts that were significantly increased in livers of TgSREBP-1a mice without change in the other gene-manipulated mice (Tables 5 and 6). In these cases, induced gene expression was most likely a secondary effect, owing to the enhanced lipid synthesis and accumulation in TgSREBP-1a mice. Although these are not direct effects, the characterization of the secondary effects may also provide important insight into the regulation of other metabolic pathways or disease processes.
One such example comes from further analysis of genes activated in TgSREBP-1a livers. A well-documented association exists between fat accumulation in liver and the development of nonalcoholic steatohepatitis (NASH), which can lead to cirrhosis and liver failure (36). NASH can result from hepatocellular injury, owing to oxidant stress. Lipid peroxidation leads to the formation of several membrane-derived products, including unsaturated aldehydes that potentiate oxidant stress. The increased expression of certain aldehyde reductases (SCALD and alcohol dehydrogenase family-1, subfamily A7) may be a response to the increased formation of these products. At least 10 additional genes involved in the detoxification of oxidized lipids (8 glutathione S-transferase family members; cysteine sulfinic acid decarboxylase; and M-LP, Mpv17-like protein) were also induced in TgSREBP-1a mouse livers. It is likely that these changes in gene expression occur in response to the excessive fatty acids that accumulate in livers of TgSREBP-1a mice. The full characterization of these effects and identification of the mediators of these gene changes may give important clues into the sequence of events that result in liver damage in fatty livers.
Supplementary Material
Acknowledgments
This work was supported by grants from the National Institutes of Health (HL-20948), the Perot Family Foundation, the Keck Foundation, and the Moss Heart Fund. J.D.H. is a Pew Scholar in Biomedical Sciences and recipient of an Established Investigator Grant from the American Heart Association.
Abbreviations: ABC, ATP-binding cassette; bHLH-Zip, basic helix–loop–helix leucine zipper; ER, endoplasmic reticulum; nSREBP, nuclear form of cleaved sterol regulatory element-binding protein; SCALD, short-chain aldehyde reductase; SREBP, sterol regulatory element-binding protein; SCAP, SREBP cleavage-activating protein; SCD, stearoyl-CoA desaturase; TgSREBP, transgene encoding the nuclear form of SREBP.
References
- 1.Horton, J. D., Goldstein, J. L. & Brown, M. S. (2002) J. Clin. Invest. 109, 1125–1131. [DOI] [PMC free article] [PubMed] [Google Scholar]
- 2.Goldstein, J. L., Rawson, R. B. & Brown, M. S. (2002) Arch. Biochem. Biophys. 397, 139–148. [DOI] [PubMed] [Google Scholar]
- 3.Yang, T., Espenshade, P. J., Wright, M. E., Yabe, D., Gong, Y., Aebersold, R., Goldstein, J. L. & Brown, M. S. (2002) Cell 110, 489–500. [DOI] [PubMed] [Google Scholar]
- 4.Yabe, D., Brown, M. S. & Goldstein, J. L. (2002) Proc. Natl. Acad. Sci. USA 99, 12753–12758. [DOI] [PMC free article] [PubMed] [Google Scholar]
- 5.Horton, J. D., Shimomura, I., Brown, M. S., Hammer, R. E., Goldstein, J. L. & Shimano, H. (1998) J. Clin. Invest. 101, 2331–2339. [DOI] [PMC free article] [PubMed] [Google Scholar]
- 6.Shimano, H., Horton, J. D., Hammer, R. E., Shimomura, I., Brown, M. S. & Goldstein, J. L. (1996) J. Clin. Invest. 98, 1575–1584. [DOI] [PMC free article] [PubMed] [Google Scholar]
- 7.Matsuda, M., Korn, B. S., Hammer, R. E., Moon, Y.-A., Komuro, R., Horton, J. D., Goldstein, J. L., Brown, M. S. & Shimomura, I. (2001) Genes Dev. 15, 1206–1216. [DOI] [PMC free article] [PubMed] [Google Scholar]
- 8.Edwards, P. A., Tabor, D., Kast, H. R. & Venkateswaran, A. (2000) Biochim. Biophys. Acta 1529, 103–113. [DOI] [PubMed] [Google Scholar]
- 9.Mahadevappa, M. & Warrington, J. A. (1999) Nat. Biotechnol. 17, 1134–1136. [DOI] [PubMed] [Google Scholar]
- 10.Seidah, N. G., Benjannet, S., Wickham, L., Marcinkiewicz, J., Jasmin, S. B., Stifani, S., Basak, A., Prat, A. & Chretien, M. (2003) Proc. Natl. Acad. Sci. USA 100, 928–933. [DOI] [PMC free article] [PubMed] [Google Scholar]
- 11.Abifadel, M., Varret, M., Rabes, J.-P., Allard, D., Ouguerram, K., Devillers, M., Cruaud, C., Benjannet, S., Wickham, L., Erlich, D., et al. (2003) Nat. Genet. 34, 154–156. [DOI] [PubMed] [Google Scholar]
- 12.Soccio, R. E., Adams, R. M., Romanowski, M. J., Sehayek, E., Burley, S. K. & Breslow, J. L. (2002) Proc. Natl. Acad. Sci. USA 99, 6943–6948. [DOI] [PMC free article] [PubMed] [Google Scholar]
- 13.Tsujishita, Y. & Hurley, J. H. (2000) Nat. Struct. Biol. 7, 408–414. [DOI] [PubMed] [Google Scholar]
- 14.Borgese, N., D'Arrigo, A., De Silvestris, M. & Pietrini, G. (1993) FEBS Lett. 325, 70–75. [DOI] [PubMed] [Google Scholar]
- 15.Kasus-Jacobi, A., Ou, J., Bashmakov, Y. K., Shelton, J. M., Richardson, J. A., Goldstein, J. L. & Brown, M. S. (2003) J. Biol. Chem. 278, 32380–32389. [DOI] [PubMed] [Google Scholar]
- 16.Edwards, P. A., Kast, H. R. & Anisfeld, A. M. (2002) J. Lipid Res. 43, 2–12. [PubMed] [Google Scholar]
- 17.Oh, S.-Y., Park, S.-K., Kim, J.-W., Ahn, Y.-H., Park, S.-W. & Kim, K.-S. (2003) J. Biol. Chem. 278, 28410–28417. [DOI] [PubMed] [Google Scholar]
- 18.Mater, M. K., Thelen, A. P., Pan, D. A. & Jump, D. B. (1999) J. Biol. Chem. 274, 32725–32732. [DOI] [PubMed] [Google Scholar]
- 19.Shimomura, I., Shimano, H., Korn, B. S., Bashmakov, Y. & Horton, J. D. (1998) J. Biol. Chem. 273, 35299–35306. [DOI] [PubMed] [Google Scholar]
- 20.Park, E., Park, S.-K., Wang, C., Xu, J., LaFauci, G. & Schuller-Levis, G. (2002) Biochim. Biophys. Acta 1574, 403–406. [DOI] [PubMed] [Google Scholar]
- 21.Berge, K. E., Tian, H., Graf, G. A., Yu, L., Grishin, N. V., Schultz, J., Kwiterovich, P., Shan, B., Barnes, R. & Hobbs, H. H. (2000) Science 290, 1771–1775. [DOI] [PubMed] [Google Scholar]
- 22.Repa, J. J., Berge, K. E., Pomajzl, C., Richardson, J. A., Hobbs, H. & Mangelsdorf, D. J. (2002) J. Biol. Chem. 277, 18793–18800. [DOI] [PubMed] [Google Scholar]
- 23.DeBose-Boyd, R. A., Ou, J., Goldstein, J. L. & Brown, M. S. (2001) Proc. Natl. Acad. Sci. USA 98, 1477–1482. [DOI] [PMC free article] [PubMed] [Google Scholar]
- 24.Cao, G., Beyer, T. P., Yang, X. P., Schmidt, R. J., Zhang, Y., Bensch, W. R., Kauffman, R. F., Gao, H., Ryan, T. P., Liang, Y., et al. (2002) J. Biol. Chem. 277, 39561–39565. [DOI] [PubMed] [Google Scholar]
- 25.Huebert, R. C., Splinter, P. L., Garcia, F., Marinelli, R. A. & LaRusso, N. F. (2002) J. Biol. Chem. 277, 22710–22717. [DOI] [PubMed] [Google Scholar]
- 26.Luckey, S. W. & Petersen, D. R. (2001) Arch. Biochem. Biophys. 389, 77–83. [DOI] [PubMed] [Google Scholar]
- 27.Baranano, D. E., Rao, M., Ferris, C. D. & Snyder, S. H. (2002) Proc. Natl. Acad. Sci. USA 99, 16093–16098. [DOI] [PMC free article] [PubMed] [Google Scholar]
- 28.Nokelainen, P., Peltoketo, H., Vihko, R. & Vihko, P. (1998) Mol. Endocrinol. 12, 1048–1059. [DOI] [PubMed] [Google Scholar]
- 29.Misawa, K., Horiba, T., Arimura, N., Hirano, Y., Inoue, J., Emoto, N., Shimano, H., Shimizu, M. & Sato, R. (July 10, 2003) J. Biol. Chem., 10.1074/jbc.M302387200. [DOI] [PubMed]
- 30.Repa, J. J., Liang, G., Ou, J., Bashmakov, Y., Lobaccaro, J.-M. A., Shimomura, I., Shan, B., Brown, M. S., Goldstein, J. L. & Mangelsdorf, D. J. (2000) Genes Dev. 14, 2819–2830. [DOI] [PMC free article] [PubMed] [Google Scholar]
- 31.Amemiya-Kudo, M., Shimano, H., Yoshikawa, T., Yahagi, N., Hasty, A. H., Okazaki, H., Tamura, Y., Shionoiri, F., Iizuka, Y., Ohashi, K., et al. (2000) J. Biol. Chem. 275, 31078–31085. [DOI] [PubMed] [Google Scholar]
- 32.Joseph, S. B., Laffitte, B. A., Patel, P. H., Watson, M. A., Matsukuma, K. E., Walczak, R., Collins, J. L., Osborne, T. F. & Tontonoz, P. (2002) J. Biol. Chem. 277, 11019–11025. [DOI] [PubMed] [Google Scholar]
- 33.Pissios, P., Kan, H. Y., Nagaoka, S. & Zannis, V. I. (1999) Arterioscler. Thromb. Vasc. Biol. 19, 1456–1469. [DOI] [PubMed] [Google Scholar]
- 34.Lopez, D. & McLean, M. P. (1999) Endocrinology 140, 5669–5681. [DOI] [PubMed] [Google Scholar]
- 35.del Castillo-Olivares, A. & Gil, G. (2002) J. Biol. Chem. 277, 6750–6757. [DOI] [PubMed] [Google Scholar]
- 36.Neuschwander-Tetri, B. A. & Caldwell, S. H. (2003) Hepatology 37, 1202–1219. [DOI] [PubMed] [Google Scholar]
Associated Data
This section collects any data citations, data availability statements, or supplementary materials included in this article.


