Abstract
Using Monte Carlo techniques, I calculate the effects of internally generated noise on information transfer through the passage of action potential spikes along unmyelinated axons in a simple nervous system. I take the Hodgkin–Huxley (HH) description of Na and K channels in squid giant axons as the basis of the calculations and find that most signal transmission noise is generated by fluctuations in the channel open and closed populations. To bring the model closer to conventional descriptions in terms of thermal noise energy, kT, and to determine gating currents, I express the HH equations in the form of simple relations from statistical mechanics where the states are separated by a Gibbs energy that is modified by the action of the transmembrane potential on dipole moments held by the domains. Using the HH equations, I find that the output response (in the probability of action potential spikes) from small input potential pulses across the cell membrane is increased by added noise but falls off when the input noise becomes large, as in stochastic resonance models. That output noise response is sharply reduced by a small increase in the membrane polarization potential or a moderate increase in the channel densities. Because any reduction of noise incurs metabolic and developmental costs to an animal, the natural noise level is probably optimal and any increase in noise is likely to be harmful. Although these results are specific to signal transmission in unmyelinated axons, I suggest that the conclusions are likely to be general.
Axons must transmit signals quickly and with a minimum of false signals generated by stochastic noise. For axons moving information small distances, the discrimination against stochastic noise is likely to be more important than signal velocity. In consideration of the simplicity and completeness of the Hodgkin–Huxley (HH) description (1) of the conduction in squid giant axon ion channels, I use that description to examine quantitatively the effects of noise on signal transmission in unmyelinated axon systems and the effects on the noise, and that transmission, of different membrane resting potentials and different ion channel densities. That analysis shows that the requisite discrimination requires developmental costs and metabolic energy costs and provides some insights into the characteristics of axon design that have evolved under evolutionary pressures.
The Structure of Voltage-Gated Channels
Sodium channels in a variety of locations in a variety of species are found to be made up of a central α element with a mass of ≈270 kDa (2–5) and usually β elements, β1 and β2, with masses near 35 kDa. The α channel is made up of four very similar domains (3, 6) labeled conventionally I, II, III, and IV. Each domain is made up of six α-helical subunits, S1...S6, which span the membrane. The four domains seem to be arranged symmetrically about a channel axis that can open to form a pore that selectively passes Na+ ion currents.
The channels open and close stochastically at rates that depend on the membrane potential. The channel dynamics are surely complex and not well understood (7, 8). However, the canonical Hodgkin and Huxley (1) (HH) description is well-defined and fits large and important sets of relevant dynamic data. Hence, in this analysis, I use that HH description as a simulacrum of the data and presume that my results will pertain to the actual channel dynamics to an acceptable degree.
According to HH, three of the domains, labeled m, are normally closed at the membrane resting potential of ≈–60 mV and open on depolarization. The fourth, labeled h is largely open (or active) at the resting potential and closes slowly (becomes inactive) on depolarization. The channel is open when the three similar m domains are open and the h domain is active, and closed otherwise. On opening, Na ions pass into the cell driven by an electrochemical gradient established by ion pumps.
The K channel is made up of four identical n domains that are largely in a closed state at the resting potential and go to an open state on depolarization. Again, the channel is open when all domains are open and closed otherwise. Thus, the K channels are also largely closed at the resting potential and then open when the membrane is depolarized allowing K+ ions to escape driven also by an electrochemical gradient. However, the K channels open more slowly than the Na channels and close slowly only on repolarization.
HH assume that the domain dynamics are Markov chain processes with domain transition rates that are independent of their history and depend only on the transmembrane potential difference.
The mechanisms through which changes in the membrane potential drive open-close domain transitions are not well understood. However, attractive models of the motion (3, 9, 10) suggest that the primary transition action follows from a displacement of the α-helix largely making up the S4 segment of the domains. A small displacement of the helix with respect to the surrounding structure, about equal to the distance between charged amino acid elements, changes the dipole moment contribution of the helix. As a consequence of the different dipole moments, different helix equilibrium states will be favored differently for different transmembrane electric fields. The configuration of some of these states may allow ion flow through the channel; some configurations may block that flow. Thus, an increase (or decrease) of the field can generate transitions between open and closed domain equilibrium states.
The HH Model of Ion Channel Dynamics
In their seminal publication, Hodgkin and Huxley (1) fit the data from a large set of measurements of properties of channels in the giant axon of the squid with simple rate equations.
I restate those HH equations, for convenient referral, in a form where the effective voltage, Vm, is the transmembrane potential with the resting potential taken as –60 mV, and not, as in the original equations, the variation from the resting voltage, VHH. Thus, Vm = –VHH – 60 mV.
The calculations are conducted assuming a specific active area that will depend on the characteristics of the axon. The dynamics depend on conductances per unit area but are independent of area otherwise. However, the noise created by the stochastic opening and closing of channels depends on the number of channels and, hence, on that area.
Channel conductances. The sodium ion current is;
 |
[1] |
Here, A is the effective membrane area, Vm is the membrane potential, and VNa = 50 mV is the sodium Nernst potential. The conductance ḡNa = 120 mS/cm2 and m and h are dimensionless numbers such that 0 ≤ m ≤ 1 and 0 ≤ h ≤ 1 representing the probability that the domain is open or active.
The values of m and h change with time according to the relations:
 |
[2] |
where α and β are rates with dimensions of 1/t and,
 |
[3] |
and
 |
[4] |
where, by convention, the unit of potential is taken as the millivolt, the unit of time the millisecond.
The potassium ion current is,
 |
[5] |
Here, VK = –72 mV is the potassium Nernst potential, gK = 36 mS/cm2 and 0 ≤ n ≤ 1. Then,
 |
[6] |
where
 |
[7] |
Leakage Conductance. HH assume a further leakage current, iL, where the specific conductance is ḡL = 0.3 mS/cm2. Thus,
 |
[8] |
were ḡL = 3 ms/cm2 while VL = –49.387 mV is chosen so that the resting potential is exactly –60 mV.
Although some part of the “leakage” current corresponds to passive ion currents, some of that current represents the effects of the Na-K pumps that establish the cell polarization.
Statistical Mechanics Description of the Channel States. In the HH formulation of the channel dynamics, the state of the domains depends only on the transmembrane potential difference and not on the ion concentration differences. Although the overall axon system is not at equilibrium (the ion concentration differences are generated by metabolically driven ion pumps), we can take the channel proteins as residing at local equilibria and, thus, describe the occupation of the states by using relations from statistical mechanics (SM).
In that SM formulation, I take it that the open and closed HH domain states are dominant in the region of membrane potentials between the resting potential of Vm ≈ –60 mV and the depolarized potential, Vm = 0. These states are presumably macroscopic protein configurations (3) with definite characteristic energies and microscopic level densities. Then, we find for the probabilities that the domains are open, Pop and closed, Pcl,
 |
[9] |
where U = ΔG/kT = (ΔE – ΔST)/kT is the difference in the Gibbs energy between the closed and open states in units of kT. Here, the entropy difference, ΔS = k[log(wo) – log(wc)], where w is the density of levels or substates (11) at the closed or open domain configurations and ΔE = Eo – Ec is the difference in the internal energies of the two states.
At equilibrium,
 |
[10] |
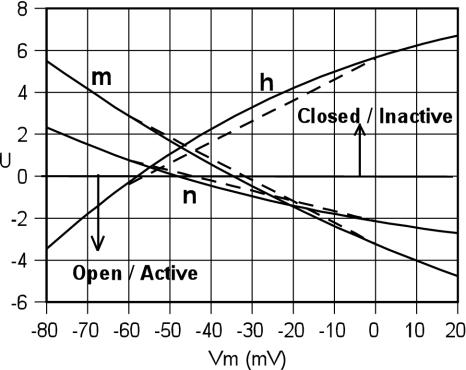
Fig. 1 shows the variations of U as a function of Vm as calculated from Eq. 10 and the HH values for the different domain types m, h, and n. The dashed lines show Ū, a linear fit to values of U taken at Vm = –60 mV and Vm = 0, a range most important in the generation of action spikes. Thus, Ū represents the contribution from a simple two-state domain model, assuming that the contributions from much higher states can be neglected and that the difference between the energies and dipole moments of the open and closes states does not vary with Vm. In that sense, the slope of the dashed line then defines the average difference between the dipole moments of the open and closed states. The near fit of the HH equations to the straight line SM fits in Fig. 1 supports the HH view that, over the normal range of membrane potentials, channel dynamics may be dominated by transitions between two domain states, each with a definite Gibbs energy.
Fig. 1.
Values of U = ΔE/kT = log(β/α), plotted as a function of Vm for the Na domain types m and h and the K domain type n where the rates α and β are taken from HH formulae. The dashed lines show linear expressions of Ū fitted to values at –60 mV and 0 mV.
Writing  , then we find Ūm = –3.23 – 0.102 Vm, Ūh = 5.61 + 0.100 Vm, Ūn = –2.14 – 0.048 Vm. For any value of Vm, measured in mV, the value of Ū is the Gibbs energy difference between the two states measured in units of kT.
Expressed in units of the electron charge, the gating charge for a domain derived from that slope is Q̄m ≈ 2.5e and Q̄h ≈ –2.5e whereas Q̄n ≈ 1.25e. The values are consistent with measurements of gating charge transfers in Na and K channels (12). The ratio 2.5e/1.25e ≈ 2/1 of the gating charges of both Na domains to that of the K domains suggests simple structural relations.
For both the Na and K channels, the energy difference between the systems at the resting potential and under depolarization follows from the effects of the membrane field on the dipole moments held by the different domains. Hence, the part of the domain that is acted on by the field transmits the energy of that action to open or close the domain. Thus, the common label “voltage-sensing element” can be misleading. That action of the electric field on that dipole moment drives the domain open-closed transitions.
The changes in dipole moments that generate the openings are manifest by a transfer of charge across the membrane. This “gating current,” was predicted by Hodgkin and Huxley (1) and later measured (13, 14). The gating charge transfer, calculated by using the SM model, is ≈10.4 electron charges, in qualitative agreement with the HH estimate of six charges made in 1952 and in good agreement with later measurements (8, 14).
Change in Membrane Potential. The flow of current generated by a change in membrane potential will cause a further change in the potential such that
 |
[11] |
where, c̄, the capacitance per unit area, is taken as 1μF/cm2.
The channel densities do not enter explicitly into the HH description, but those densities are important in estimations of the membrane noise. Taking the channel conductivities from Conti et al. (15, 16) as 4 pS per Na channel and 12 pS per K channel, I take the Na channel density as 300 channels per μm2 and the K channel density as 30 per μm2.
Action Potentials. On a sufficiently large voltage impulse, the Na+ channel m domains open, thus opening the channels. Driven by electrochemical gradients, more Na+ ions enter the cell than K+ ions leave, thus further raising the membrane potential in a positive feedback relation that leads to a depolarization of the cell. At this time, the Na+ channels close through inaction of the h domain, and the K channels, now wide open, allow a K+ current to leave the cell, thus bringing the cell potential back to the resting value of Vm ≈ –60 mV generated by metabolically driven ion pumps that expel Na+ ions from the cell interior and impel K+ ions. This “action pulse” has a “width” of ≈2 ms.
If the voltage impulse is not sufficiently large, the Na+ inflow current will not be sufficient to counter the increase in the K+ outflow current, and the membrane potential subsides back to the resting potential.
Such variations with time of the open-closed channel probabilities on a change in membrane potential (including the generation of action pulses) were determined numerically from Eqs. 1–9. The calculations were made in a straightforward manner by treating the differential equations (which can be considered as elements of a Chapman–Kolmogorov matrix equation) as time-difference equations. For the most part, the calculations were made taking a basic time interval of 50 μs, but the results were checked by using a 10-μs interval, and all of the salient results were independent of the choice of interval.
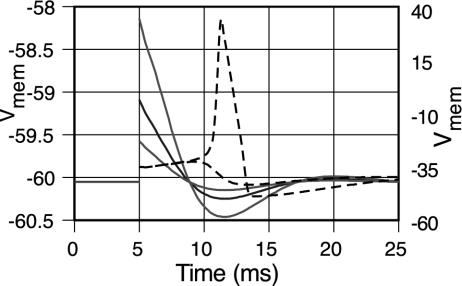
Calculations of the variation of membrane potential with time after membrane voltage pulses with magnitudes just above and just below a threshold (17) of ≈6.85 mV above the resting potential of –60 mV are shown by the dashed lines in Fig. 2. These are in accord with figure 9 of Koch in ref. 18. The variations after voltage pulses of 2 mV, 1 mV, and 0.5 mV are shown by the solid lines in the figure.
Fig. 2.
Membrane voltage variations, in the absence of noise, as a function of time after voltage pulses at a clock-time of 5 ms. The dashed lines show variations after pulses just below and just above the threshold of ≈6.85 mV. The solid lines show variations after pulses of 2, 1, and 0.5 mV.
Noise
Axon systems will transmit some signal noise in the form of rogue action pulses generated by fluctuations in the synapse actions that initiate action pulses and by fluctuations in the opening and closing of the voltage gated ion channels that act to propagate the signals along the axons. Here, we consider that propagation noise.
Channel-Open Fluctuations. Channels are continually opening and closing through thermal agitation; hence, there are fluctuations in the number of open (or closed) channels and thus the ion current admitted by the channels. We consider first the channel transitions from open to closed. All open channels have all three m domains in the open state and the h domain in an active (or open) position. If any of these change to a closed state, the channel will close. Then, writing the number of open Na channels as Naop = NNam3h where NNa is the total number of Na channels, the number of open channels that will close over a time Δt will be,
 |
[12] |
Similarly, the number of closed channels that will open in a time, Δt, is;
 |
[13] |
where the transition rates, α and β, are functions only of the membrane potential.
In the HH scheme, at a given membrane potential, the two sets of transitions will be independent, and the fluctuations will be normally distributed with a standard deviation of,
 |
[14] |
Similarly, for the K channels,
 |
[15] |
with fluctuations,
 |
[16] |
Monte Carlo Procedures. The calculations of the channel behavior were conducted by using the relations described in the previous section. The number of channels opened and closed in each time interval was generated by using a random number generator, and a look-up table was arranged to give normal distributions about means with standard deviations expressed by Eqs. 14 and 16. That stochastic variation in the number of open channels translates to noise variations in the charge transmitted through the channels and, thus, to noise in the transmembrane potential.
Voltage Noise Power Density Spectrum. Taking the noise power density at a time t as S(t), I determined the densities Sn at a frequency νn by a Fourier analysis (19),
 |
[17] |
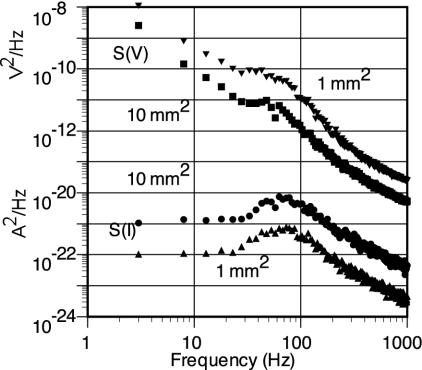
The points on Fig. 3 show the noise power spectra S(V) and S(I), calculated numerically by using the Monte Carlo procedures and the postulated channel parameters, for effective areas A of 1 mm2 and 10 mm2.
Fig. 3.
The points show the calculated power spectra of the membrane voltage and current noise generated by channel opening and closing fluctuations, ion shot noise, and gating charge noise for single excitation sectors with areas of 1 and 10 mm2. The point-to-point fluctuations follow from the limitations of the Monte Carlo calculations used to generate the spectrum.
Both S(V) and S(I) seem to follow Lorentzian functions (19, 20), S(ν) = S(0)/[1 + (2πντ)2] with τ ≈ 2.5 ms, approximately at frequencies ν > 60 Hz. This modification in the spectra at low frequencies has been considered as largely an effect of what has been called an impedance resonance (22–24). I note that the value of τ seems to correspond to the initial recovery times for small fluctuations shown in Fig. 2. Similarly, both spectra deviate from a simple Lorentzian at low frequencies, ν < 60 Hz. This result may be related to the times of the order of 10 ms required for the whole recovery from voltage excursions.
Both the voltage and current noise spectra are dominated by fluctuations in the Na channel openings and closings, which account for ≈86% of the values; the K channel fluctuations account for ≈14%. Contributions from shot noise and fluctuations in gating charges were included in the calculations but are, in fact, negligible. Johnson–Nyquist noise, dominant at higher frequencies, is not important below 1 kHz. I note that the HH leakage current, probably dominated by currents from the Na–K pumps, is larger than the Na current at the resting potential, but any fluctuations in that current are ignored in this analysis.
Although there are qualitative similarities between the values S(V) from this simulation of living cell membranes and the values from current clamped membranes (21), there are also fundamental differences. These differences are seen also in the comparison of the calculated values of S(I) and the measurement of Conti, DeFelice, and Wanke (15, 19) on voltage-clamped membranes held at potentials near –45 mV. Similarly, the dominance of the contribution to the noise from the Na channels calculated here is quite different from the K channel dominance found by DeFelice et al. although for membranes clamped at a potential of ≈–45 mV.
Effective Excitation Area of the Axon Cable. If only a very small sector of the axon cable were excited, the ion flow through that sector would charge a capacitance that was much greater than the capacitance of that sector and, hence, generate only a very small potential change in the cable membrane. Moreover, the shunt conductance of adjoining areas of the axon would probably be significant. In general, the effective capacitance will extend along the cable to a length, ≈λ, where the resistance of the membrane is equal to the resistance of the cytoplasm (25, 26). The membrane resistance over that area will be  where a is the axon radius and
  Ωm2 is the specific membrane resistivity per unit area. By direct calculation from the HH equations, the membrane resistivity at the resting potential Vm = –60 mV is
  Ωm2. The cytoplasm resistance will be
  where ρI ≈ 1 Ωm is the cytoplasm resistivity. Then
 |
[18] |
I then take the minimum effective excitation area of the squid axon as A = 2πaλ. I label this area as an “excitation sector.” For a squid giant axon with a radius of a = 0.5 mm, λ ≈ 2.65 mm and A ≈ 1.2 × 10⁻⁵ m2. From these recipes  and A ∝ a3/2.
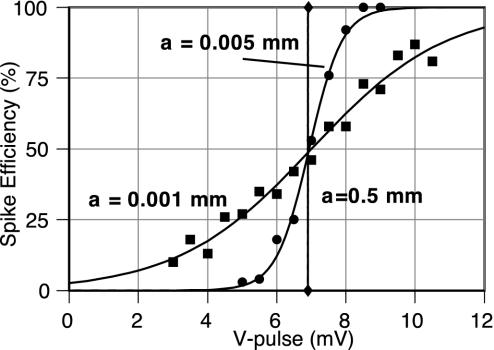
Effects of Noise on the Generation of Action Pulses. The noise in the membrane potential generates fluctuations in the voltage threshold for the generation of action pulses. Lecar and Nossal have considered such fluctuations in myelinated nerves (27, 28). Fig. 4 shows the probability of generating an action pulse as a function of the voltage impulse, ΔVm over a single excitation sector for different noise amplitudes set by different choices of axon radii, and thus different effective areas. For an axon with a total active length, Nλ, the probability of a chance noise-generated excitation spike in a given time will be approximately proportional to N.
Fig. 4.
The variation of the probability of the generation of action pulses as a function of the voltage impulse, ΔVm, to a single action-sector for different axon radii and, thus, different levels of noise. The points are from the Monte Carlo calculations; the lines are to guide the eye.
Signals too small to generate a significant level of output pulses in a nearly noise-free environment can be sometimes pushed over the threshold for the generation of such output signals by positive noise fluctuations. Conversely, larger input signals, nominally sufficient to generate output pulses in a noise-free environment, are sometimes suppressed by negative fluctuations from the input noise. When the rate of output signals generated by noise in the absence of an input signal is large, the interference of those pulses (which generate an inactive dead time) further reduces the output response to input signals.
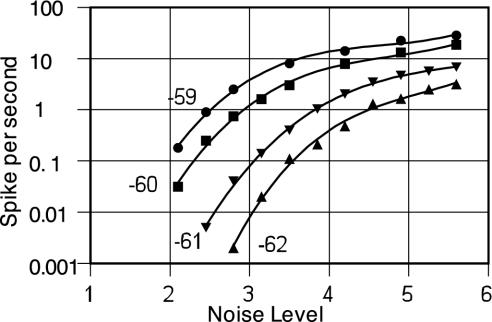
The high signal transmission velocity required by the animal to drive a tail-flick reaction and escape danger requires the large diameter of the giant axon. With so large an area the production of action pulses (and random unwanted tail-flicks) by transmission noise in that axon is quite rare and likely smaller than the effects of noise from other sources. However, other elements of the complex squid nervous system must rely on much smaller axons. Too much noise in some of those systems might well generate unwanted signals. The rate of such “accidental” signals can be reduced by reducing the noise or by increasing the magnitude of the resting potential. Fig. 5 shows the variation of the rate of noise pulses from one excitation sector of a 0.005-mm axon on the input noise level for different values of the resting potential. A change of the resting potential from the standard HH value of Vm = –60 mV to Vm = –62 mV reduces the accidental rate by a factor of ≈500 at lower noise levels. Because the noise level is proportional to the square-root of the channel density, an increase in channel density of ≈40% can also reduce the accidental rate by about a factor of 500.
Fig. 5.
The variation of rate of noise pulses generated in one action-sector of an axon with a radius of 0.005 mm for different input noise amplitudes (and thus channel densities) as the resting potential is changed. The abscissa “noise levels” are multiples of the standard noise calculated according to the regular HH prescriptions. The lines are to guide the eye.
Small modifications in the in-out Na and K ion ratios (generated by modifications in pumping rates) can so modify the resting potential at modest metabolic cost. However, the (noise-free) threshold for the generation of an action pulse is increased (from ≈6.85 mV) ≈10% for every increase of 1 mV in the magnitude of the resting potential. Although the increase in the magnitude of the resting potential, as well as the increased requirement in signal amplitude, incurs physiological costs in terms of metabolic energy, the animal may consider that cost a bargain.
For some systems (e.g., the axons that send signals to McCulloch–Pitts (29) coincidence circuits), the constraints against “accidental” noise signals need not be so severe (30). Also, little is to be gained by reducing the channel noise below noise from other sources, especially from synapse efficiency variations.
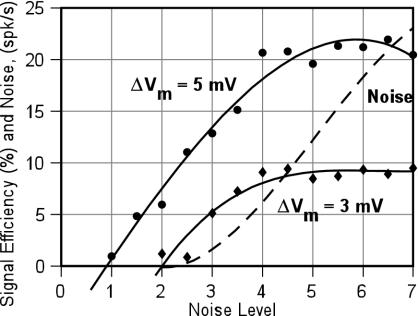
Stochastic Resonance. If moderate noise is added to the input of a system that discriminates against noise (and thus small signals), some of the small signals will pass the discriminator threshold and generate output signals, thus increasing the nominal sensitivity of the system (31–36). If much noise is added, the noise itself will trigger output signals, masking effects from the input signals. The increase in the sensitivity to small signals with increasing noise and the subsequent decrease with a further addition of input noise has been labeled “stochastic resonance.” It is clear from Fig. 4 that increased noise in the HH system leads to a greater sensitivity of the system to small signals.
The effects of noise on small signals in the HH system is addressed more completely in Fig. 6 where the output (the probability of the generation of action pulses by an input pulse) is plotted as a function of the noise level for various input pulse amplitudes. The increase of that output probability followed by a later decrease as the noise increases is qualitatively similar to that from conventional descriptions of stochastic resonance.
Fig. 6.
The solid lines show the variation of the probability of the generation of action pulses in a single action-sector of an axon with a radius of 0.005 mm taken as a function of the noise amplitude for different values of the voltage impulse signal, ΔVm. The fluctuations calculated from the HH formulae are taken as generating a unit noise amplitude. The dashed line shows the frequency of action pulses generated in a single action-sector by the noise alone.
In general (as suggested by this analysis of the HH system), an animal requires less metabolic work and fewer ion channels to increase system noise, and more work and more channels to reduce the noise. Therefore, we can expect that evolutionary pressures lead to the maximum level of noise commensurate with the survival of the animal. Hence, we should expect that any exogenous addition of noise (33) will serve overall to harm the animal although that noise may increase some especially defined sensitivity.
Limitations of the HH Model
In both the original HH model and the statistical mechanics description of the model, the four different domains of the Na and K channels are presumed to act independently. However, there must be some appreciable coupling between channels as a consequence of the effects of the electric fields generated by the domain dipole moments. Whereas the polarization of the aqueous medium surrounding the domains can greatly reduce this coupling, some significant level of effects must remain.
Moreover, the HH model does not completely account for all channel behavior even in the squid giant axon. Among salient criticisms, hyperpolarization effects have been noted that fall outside of the HH description (9, 13, 14); Oxford (38) has shown that the reactivation transition in the Na channel from the open to closed state proceeds more slowly than predicted by the standard HH model; some observations suggest that inaction is linked to the opening of the channel (39), which is not the case for generic HH models; and the Hodgkin–Huxley scheme (of three m states and an inactive h state) may not account for channel open-time statistics as well as certain other Markov models (40).
Hence, the HH Markov chain model of two-state domains acting completely independently must be an approximation to a much more complex reality. Thus, the existence of modest deviations from the model does not necessarily impeach its possible basic validity. More important, such defects in the model should not impeach the general conclusions concerning the impact of channel noise on the generation of action pulses in unmyelinated axons.
A Conjecture
In the special case of unmyelinated axons, we take these calculations based on the HH description of such axons as demonstrating that the signal transmission noise level is reduced by either increasing the density of channels or by increasing the axon polarization. The first requires increased developmental costs, the second increased metabolic energy costs. Conversely, a reduction in those expenditures will result in greater signal noise. Taking the position that evolutionary pressures act to select optimal biological solutions among nearby variations, we conclude that these systems reject noise in an optimum manner. Thus, any increase in noise must degrade the overall performance of the organism although some select set of actions may benefit.
Whereas the evidence provided here applies only to the transmission of signals through unmyelinated axons, I suggest that the suggested conclusion is general. The suppression of noise is biologically expensive, and, hence, any organism allows the maximum noise consistent with its survival and reproduction. Therefore, stochastic noise added in any manner always degrades the overall performance of an organism.
Acknowledgments
I thank Profs. Harvey Fishman, Frederick Sigworth, and R. Dean Astumian for invaluable comments and criticisms.
Abbreviations: HH, Hodgkin–Huxley; SM, statistical mechanics.
References
- 1.Hodgkin, A. L. & Huxley, A. F. (1952) J. Physiol. (London) 117, 500–544. [DOI] [PMC free article] [PubMed] [Google Scholar]
- 2.Miller, J. A., Agnew, W. S. & Levinson, S. R. (1983) Biochemistry 22, 462–470. [DOI] [PubMed] [Google Scholar]
- 3.Catterall, W. A. (1995) Annu. Rev. Biochem. 64, 493–531. [DOI] [PubMed] [Google Scholar]
- 4.Messner, D. L. & Catterall, W. A. (1986) J. Biol. Chem. 261, 211–215. [PubMed] [Google Scholar]
- 5.Messner, D. L., Feller, D. J., Scheuer, T. & Catterall, W. A. (1986) J. Biol. Chem. 261, 14882–14890. [PubMed] [Google Scholar]
- 6.Noda, M., Shimizu, S., Tanabe, T., Takai, T., Kayano, T., Ikeda, T., Takahashi, H., Nakayama, H., Kanaoka, Y., Minamino, N., et al. (1984) Nature 312, 121–127. [DOI] [PubMed] [Google Scholar]
- 7.Sigworth, F. J. (1993) Q. Rev. Biophys. 27, 1–40. [DOI] [PubMed] [Google Scholar]
- 8.Hille, B. (2001) Channels of Excitable Membranes (Sinauer, Sunderland, MA), 2nd Ed.
- 9.Armstrong, C. M. (1981) Physiol. Rev. 61, 644–683. [DOI] [PubMed] [Google Scholar]
- 10.Catterall, W. A. (1988) Science 242, 50–61. [DOI] [PubMed] [Google Scholar]
- 11.Frauenfelder, H. S., Sligar, G. & Wolynes, P. G. (1991) Science 254, 1598–1603. [DOI] [PubMed] [Google Scholar]
- 12.Armstrong, C. M. & Bezanilla, F. (1973) Nature 242, 459–461. [DOI] [PubMed] [Google Scholar]
- 13.Keynes, R. D. & Rojas, E. (1976) J. Physiol. (London) 255, 157–189. [DOI] [PMC free article] [PubMed] [Google Scholar]
- 14.Armstrong, C. M. & Bezanilla, F. (1974) J. Gen. Physiol. 63, 533–552. [DOI] [PMC free article] [PubMed] [Google Scholar]
- 15.Conti, F., DeFelice, L. J. & Wanke, E. (1975) Q. Rev. Biophys. 8, 451–506. [DOI] [PubMed] [Google Scholar]
- 16.Conti, F. & Stuhmer, W. (1986) Eur. Biophysics J. 17, 53–59. [DOI] [PubMed] [Google Scholar]
- 17.Noble, D. & Stein, R. B. (1966) J. Physiol. (London) 187, 129–162. [DOI] [PMC free article] [PubMed] [Google Scholar]
- 18.Koch, C. (1999) Biophysics of Computation (Oxford Univ. Press, New York).
- 19.DeFelice, L. J. (1981) Introduction to Membrane Noise (Plenum, New York).
- 20.Stevens, C. F. Biophys. J. 12, 1028–1047. [DOI] [PMC free article] [PubMed]
- 21.Fishman, H. M., Poussart, D. J. M. & Moore, L. E. (1975) J. Membr. Biol. 24, 281–304. [DOI] [PubMed] [Google Scholar]
- 22.Cole, K. S. (1968) Membrane Ions & Impulses (Univ. of California Press, Berkeley).
- 23.Conti, F. (1970) Biophysik 6, 257–270. [DOI] [PubMed] [Google Scholar]
- 24.Mauro, A., Conti, F., Dodge, F. & Schorr, R. (1970) J. Gen. Physiol. 55, 497–523. [DOI] [PMC free article] [PubMed] [Google Scholar]
- 25.Johnson, D. & Wu, S. M.-S. (1995) Foundations of Cellular Neurophysiology (MIT Press, Cambridge, MA).
- 26.Jack, J. J. B., Noble, D. & Tsien, R. W. (1975) Electric Current Flow in Excitable Cells (Oxford Univ. Press, Oxford).
- 27.Lecar, H. & Nossal, R. (1971) Biophys. J. 11, 1048–1084. [DOI] [PMC free article] [PubMed] [Google Scholar]
- 28.Sigworth, F. (1980) J. Physiol. (London) 307, 97–129. [DOI] [PMC free article] [PubMed] [Google Scholar]
- 29.McCulloch, W. S. & Pitts, W. (1943) Bull. Math. Biophys. 5, 115–113. [DOI] [PubMed] [Google Scholar]
- 30.Adair, R. K. (2001) Proc. Natl. Acad. Sci. USA 98, 7253–7258. [DOI] [PMC free article] [PubMed] [Google Scholar]
- 31.Adair, R. K. (1996) Biolelectromagnetics 17, 242–245. [DOI] [PubMed] [Google Scholar]
- 32.Benzi, R., Sutera, A., Vulpiani, A. (1981) J. Phys. A 14, 453–460. [Google Scholar]
- 33.Douglas J. K., Wilkens L., Pantazelou E. & Moss F. (1993) Nature 365, 337–340. [DOI] [PubMed] [Google Scholar]
- 34.Kruklikov, I. L. & Dettlinger, H. (1994) Bioelectromagnetics 15, 539–547. [DOI] [PubMed] [Google Scholar]
- 35.McNamara, B. & Wiesenfeld, K. (1989) Phys. Rev. A 39, 4854–4869. [DOI] [PubMed] [Google Scholar]
- 36.Collins, J. J., Chow, C. C., Capella, A. C. & Imhoff, T. T. (1996) Phy. Rev. E 54, 5575–5584. [DOI] [PubMed] [Google Scholar]
- 37.Hodgkin, A. L., Huxley, A. F. & Katz, B. (1952) J. Physiol. (London) 116, 424–448. [DOI] [PMC free article] [PubMed] [Google Scholar]
- 38.Oxford, G. S. (1981) J. Gen. Physiol. 77, 1–22. [DOI] [PMC free article] [PubMed] [Google Scholar]
- 39.Bezanilla, F. & Armstrong, C. M. (1977) J. Gen. Physiol. 70, 549–566. [DOI] [PMC free article] [PubMed] [Google Scholar]
- 40.Horn, R. & Vandenberg, C. (1984) J. Gen. Physiol. 84, 505–534. [DOI] [PMC free article] [PubMed] [Google Scholar]


