Abstract
There has been a longstanding debate regarding the role of proteolysis in Huntington's disease. The toxic peptide theory posits that N-terminal cleavage fragments of mutant Huntington's disease protein [mutant huntingtin (mhtt)] enter the nucleus to cause transcriptional dysfunction. However, recent data suggest a second model in which proteolysis of full-length mhtt is inhibited. Importantly, the two competing theories differ with respect to subcellular distribution of mhtt at initiation of toxicity: nuclear if cleaved and cytoplasmic in the absence of cleavage. Using quantitative single-cell analysis and time-lapse imaging, we show here that transcriptional dysfunction is “downstream” of cytoplasmic dysfunction. Primary and reversible toxic events involve destabilization of microtubules mediated by full-length mhtt before cleavage. Restoration of microtubule structure by taxol inhibits nuclear entry and increases cell survival.
The primary and potentially reversible steps of toxicity mediated by mutant Huntington's disease (HD) protein [mutant huntingtin (mhtt)] are controversial. A major model suggests that short cleavage products of mhtt migrate to the nucleus and cause transcriptional dysfunction (1). The N-terminal truncated form of mhtt is known to bind and interfere with nuclear factors such as cAMP response element-binding protein (CREB) (2), CREB-binding protein (3), corepressor (4), and transcriptional activator Sp1 (5). Restoration of transcription by histone deacetylase inhibitors improves survival of affected neurons in a Drosophila model for HD (6), indicating that mhtt can cause deleterious alterations in transcription. However, transcriptional dysfunction is caused in cell, mouse, or fly models by expression of only the short truncated fragment of the mhtt (6–10). Short fragments can freely migrate into the nucleus and cause dys-function there (10). In vivo, however, fragments must arise from cleavage of full-length mhtt, a large cytoplasmic protein with no nuclear localization signal (NLS) (10). Yet neither the timing nor the extent of cleavage of the full-length mhtt in vivo is known. Recent data suggest that cleavage of mhtt may be slow in human HD tissue (11) and raise the possibility that N-terminal cleavage may not be an early or primary event in toxicity.
In fact, several lines of evidence suggest that nuclear events may not be sufficient to account for the initial toxic effects of mhtt. In presymptomatic or late-onset disease tissue, nuclear inclusions (NI) are often absent in patients, whereas cytoplasmic inclusions can exceed NIs (12). Second, many mhtt-interacting proteins identified by yeast two-hybrid are cytoplasmic proteins (13). Microarray analysis of HD mice reveals that expression of many trafficking proteins and cytoplasmic metabolizing enzymes is affected early in the toxic progression (14). Moreover, Sp1 has been shown to be a major target of mhtt, presumably mediating toxicity by repression of Sp1-dependent genes (15). However, many Sp1-dependent genes are unaffected by expression of mhtt (16). Finally, Sp1 specifically interacts with mhtt, and this interaction is stronger with the soluble mutant form than with the insoluble form associated with intranuclear aggregates. Thus, it is unlikely that sequestration of transcription factors into nuclear aggregates is sufficient to account for the transcriptional deregulation (17).
The inability to follow individual cells with time has precluded precise localization of mhtt at the initial stages of cellular dysfunction. Thus, distinction between major models for proteolysis has not been possible. Here, we follow the fate of full-length mhtt from expression to cell death. We present results using single-cell time-lapse imaging that precisely and quantitatively measures subcellular localization of full-length mhtt in individual primary neurons with time. When full-length mhtt is expressed, we show here that toxicity occurs in a distinctly sequential manner. The primary and reversible toxic events occur in the cytoplasm by destabilization of microtubules. Disruption of the cellular architecture precedes nuclear entry of mhtt that occurs as cells approach death. Microtubule stabilization by taxol inhibits nuclear entry and enhances cell survival.
Materials and Methods
Primary Cell Cultures. Primary striatal neurons (STR) and cortical neurons (18), dorsal root ganglionic neurons (19), and cardiac myocytes (20) were prepared according to published protocols. Striatal cultures were stained with polyclonal antimethionine–enkephalin–Arg-Phe antibody (1:200; Peninsula Laboratories). We found that 50% of our cultures were enkephalin-positive.
Transgenic Mice. The following mouse models were used: control FVB/N (21) with seven glutamines in mouse endogenous huntingtin (htt) homolog and homozygous transgenic with full-length human htt cDNA containing 16 (HD16) (22) or 72 (HD72) (23) CAG repeats.
Plasmid Construction and Transfection. Control GFP proteins and mhtt plasmids were derived from insertion of sequence into pEGFP-C1 vector (Clontech). Primary neurons and myocytes were transfected by using Lipofectamine 2000 (Invitrogen) and Nupherin-neuron (Biomol, Plymouth Meeting, PA).
Injection of Mammalian Cells and Quantification of Fluorescence Intensity. Dextrans of different molecular masses were preconjugated with FITC (Molecular Probes) and microinjected into the cytosol of cells. Details of confocal imaging are in Supporting Methods, which is published as supporting information on the PNAS web site, www.pnas.org. The nuclear/cytoplasmic (Nuc/Cyt) ratios of fluorescence intensity were determined by dividing the fluorescence intensity of the nucleus by the cytoplasmic fluorescence intensity normalized for volume. The total intensity in the nucleus and in the cytoplasm was determined by integrating the intensity of optical scans by using the analyze (Mayo Foundation) software, and total intensity of each compartment was normalized to its volume. An average Nuc/Cyt ratio ≈1.0 was indicative of nuclear localization, whereas a ratio «1.0 indicated exclusion of a macromolecule from the nucleus. Ratios between 0.8 and 1.2 indicated that dextran molecular weights were near the exclusion limit of the nucleus.
Time-Lapse Imaging of Cells. Neuronal cultures were placed on the motorized thermostated stage, and an arbitrary reference point was determined. After identification, the position of each cell was marked by the computer and programmed to return to the same position at a determined time interval. Details of imaging are published in Supporting Methods.
Scaled Values for Cell Death Curves. The values of the cell death scale ranged from 1.0 to 0 and corresponded to the stages of cell death as described (stages 1–5). Details of the scaling procedure are published in Supporting Methods.
Hoechst and Propidium Iodide (PI) Staining. Cells were fixed with 4% paraformaldehyde and washed with PBS. Hoechst dye was added to a final concentration of 1.0 μg/ml. PI was added to live cells 12–16 h after transfection to a final concentration of 1 μg/ml. Imaging was performed as described in Supporting Methods.
Tubulin (TB) Staining and Analysis. Primary antibodies were: monoclonal anti-α-TB N356 directed to the C-terminal domain (amino acids 426–450), 1:500 (Amersham Biosciences) and monoclonal anti-α-TB B512 directed against the C-terminal domain (amino acids 307–451), 1:2,000 (Sigma). The secondary antibody was goat anti-mouse Cy 5, 1:1500 (Amersham Biosciences). Imaging parameters are described in Supporting Methods.
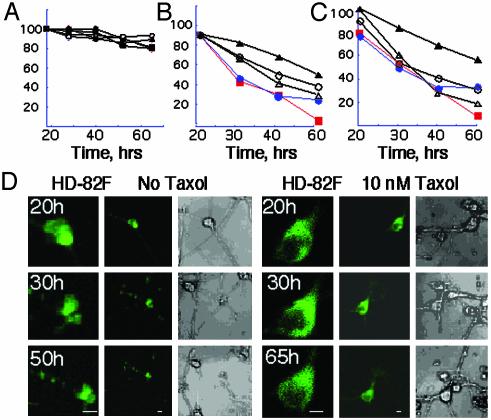
Taxol Treatment. Cells were kept in phenol red-free serum-supplemented (10%) DMEM. Primary rat STR (E17) 7 days after plating were transfected with mhtt plasmid (HD-82F). Different doses of taxol (200, 100, 50, 20, 10, and 5 nM) were added to the cells before transfection and were maintained through the course of the experiment. The percent of survival curves shown in Fig. 7 represents five independent experiments as an absolute number. In the population study, the number of viable cells in three experiments was averaged for every time point and plotted vs. the taxol dose.
Fig. 7.
Taxol treatment inhibits nuclear entry and increases neuronal survival in cells expressing mhtt. (A) Taxol is nontoxic to neurons. Taxol concentrations were: 5 nM (open triangles); 10 nM (filled triangles); 20 nM (open circles); 100 nM (filled circles); and no taxol (filled squares). (B and C) Taxol treatment increased cell survival of STR transfected with HD-82F in single-cell analysis (B) and population analysis (C). Taxol concentrations are as in A. (D) Single-cell analysis of representative STR expressing HD-82F without (Left) and with (Right) 10 nM taxol. Time posttransfection is indicated. A time course for each neuron is shown. (Left) ×40 (×3 zoom) image, (Center) ×40 image, (Right) transmitted light image.
Results
mhtt Migrates by Passive Diffusion. If nuclear localization is required for toxicity, then mhtt must be present in the nucleus before cell death. Typically, a healthy mammalian nucleus excludes proteins ≈50 kDa (24). However, the full-length htt has been observed in the nucleus of neurons in humans (25) and mice (26). htt is a large cytoplasmic protein (350 kDa) and contains no canonical NLS (10). Therefore, it is surprising that the full-length htt can migrate to the nucleus if neurons are healthy and intact. There are three possibilities to explain full length htt in the nucleus: neurons normally allow large molecules to enter the nucleus and provide precursors for toxicity; htt is actively transported to the nucleus by a noncanonical mechanism; or neurons are compromised by toxicity before nuclear entry of large molecules.
We found that large molecules were excluded from the nucleus of intact neurons (Fig. 1 A and B). The nuclear diffusion limit (DL) was determined either by injecting FITC-dextrans (Fig. 1 A and B) or by transfecting GFP proteins (Fig. 1C). The DL defined the minimum size of molecules excluded from the nucleus of a healthy cell and was quantified by measuring the fluorescence ratio in the nucleus and in cytoplasm (Nuc/Cyt). Because subcellular localization of htt might be influenced by toxicity, we first established the DL by using nontoxic FITC-dextrans of discrete sizes (Fig. 1 A and B).
Fig. 1.
DL of nuclear entry of htt and control proteins. (A) Subcellular localization of FITC-dextrans in primary STR. Relative intensity of the color scale is shown. (Bar = 10 μm.) FITC-dextrans of different molecular masses were conjugated with FITC, microinjected into the STR cytosol, and observed after 12 h. (B) Nuc/Cyt ratios of FITC-dextrans normalized for volume. Data presented as (++) indicate Nuc/Cyt »1.0; (+) Nuc/Cyt ≈1.0; (–) Nuc/Cyt ≈0. Numbers in parentheses indicate averaged cells. DL is the diffusion limit of cells determined by dextrans. (C) Nuc/Cyt ratios for localization of the transfected GFP-fusion proteins in different cell types based on confocal microscopy. Molecular masses of expressed proteins are indicated. DL for each cell type is indicated; (n), the number of cells measured; nd, not determined; MYO, primary cardiac myocytes.
All mammalian cells tested allowed molecules at or <40 kDa to freely enter the nucleus (Fig. 1B, ++) but excluded dye molecules >70 kDa (Fig. 1B, –). The measured DL was identical for any type of neuron (STR or dorsal root ganglionic) and, therefore, did not distinguish affected from spared neurons in HD. Membrane depolarization did not influence the measured DL (Fig. 1B; +KCl). In fibroblasts (CV-1) and in neuroblastoma (SKN) cells, the 40-kDa dextrans had reduced ability to enter the nucleus, suggesting the DL to be near 40 kDa (Fig. 1B, +), whereas in primary cardiac myocytes, dextran dyes of 40 kDa were completely excluded (Fig. 1B, –). Thus, full-length mhtt must reside in the cytoplasm of neurons if intact.
Migration properties of expressed control proteins were similar to dextrans (Fig. 1C). Control GFP proteins contained neither polyglutamine regions nor NLS (with the exception of GFP-29 × 4NLS) but differed in size. Therefore, the subcellular localization of control proteins was determined in all cases by the DL of the respective cells (Fig. 1C). A protein with four copies of GFP [GFP-29 × 4 (116 kDa)] was excluded from all cell types tested (Fig. 1C, –), and the attachment of NLS (GFP-29 × 4NLS) allowed nuclear entry (Fig. 1C, ++). Thus, each cell type was capable of active nuclear transport. However, control GFP proteins entered the nucleus only if the size of the molecule was less than the defined DL (Fig. 1 B and C).
We found no evidence for a noncanonical active transport mechanism for mhtt. All expressed mhtt proteins localized in cells by passive diffusion. GFP-fusion htt proteins contained either full-length normal (HD-23F), expanded (HD-82F), or the corresponding truncated proteins (HD-19T or -82T). In primary neurons, the full-length forms (HD-23F or -82F) were found in the cytoplasm of healthy neurons, whereas the truncated form (HD-19T) localized to both cytoplasmic and nuclear compartments (Fig. 1C). In CV-1, SKN, or cardiac myocyte cells with smaller DL, the truncated mhtt was found in the cytoplasm (Fig. 1C). Thus, the localization of mhtt to the cytoplasm or nucleus was determined by protein size and the DL of the cell.
In primary STR, we found no evidence of N-terminal htt cleavage at early steps of protein expression. When the full-length protein was expressed, no GFP was observed in the nucleus, even though migration of fragments <70 kDa was allowed. Large or full-length htt was restricted to the cytoplasm, whereas neurons were intact and healthy. These data raised the possibility that neurons are compromised by toxicity before nuclear entry.
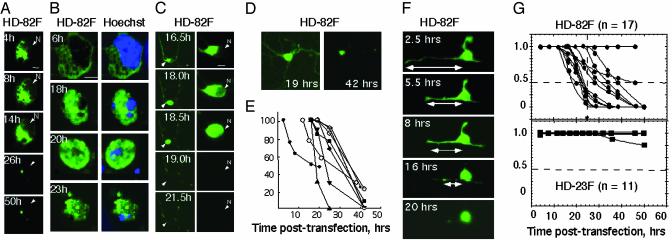
Cytoplasmic Localization of Full-length mhtt Is Associated with Toxicity. We quantified the subcellular localization of mhtt from the beginning of its expression until cell death by using single-cell time-lapse microscopy. Single-cell analysis has the advantage that progression to cell death can be independently quantified in individual cells despite variation in expression. The majority of STR expressing HD-82F died within 14–26 h posttransfection (Fig. 2), and GFP fluorescence of HD-82F was localized in the cytoplasm (Fig. 2 A–C). The position of HD-82F with respect to the nucleus was also confirmed in independent experiments by immunocytochemistry (Fig. 2B). By either method, GFP fluorescence of HD-82F was observed in the nucleus only as cells underwent rapid morphological changes. Initially, neurons had intact morphology, and the HD-82F fluorescence resided exclusively in the cytoplasm (Nuc/Cyt » 1.0) (Fig. 2 A–C). However, with time, cells progressed to death in five distinct steps (Fig. 2 A–F).
Fig. 2.
Cytosolic localization of mhtt is associated with initiation of toxicity. (A) Single-cell time-lapse imaging of HD-82F expression in STR with time. N indicates position of nucleus. (B) Subcellular localization of HD-82F in representative STR with time as measured by immunocytochemistry. Blue indicates the nucleus with Hoechst-stained DNA (Right); green is the expressed HD-82F (Left). (C) Single-cell time-lapse imaging of STR and loss of neurites in representative STR neuron expressing HD-82F. (D) STR expressing HD-82F before and after neurite retraction. Images were acquired at high gain to visualize neurites (at the expense of distinction between nuclear and cytoplasmic compartments). (E) Quantification of neurite shortening with time in individual STR (see F) after transfection with HD-82F. (F) Example of a single STR undergoing neurite retraction on expression of HD-82F (high gain). (G) Quantification of cell death and inclusion formation for individual STR expressing HD-82F or -23F with time; n is the number of cells observed; dashed line indicates time of propidium iodide uptake and midpoint of death where HD-82F is in both nuclear and cytoplasmic compartments.
First, neurites became visibly thinner or started to retract (stage 1; Fig. 2 C–F). In stage 2, cell bodies began to lose their morphology (Fig. 2C, 16.5 h, Nuc/Cyt <1.0). In stage 3, extensive rounding initiated nuclear entry, and GFP fluorescence was present in the cytoplasm and nucleus. Cells at stage 3 varied in their Nuc/Cyt ratios. Most cells had Nuc/Cyt ratios ≈1.0 (Fig. 2C; 18.0 h), but a few could be detected that had extensive fluorescence in the nucleus and displayed Nuc/Cyt ratios up to 8.0 (see Fig. 3). In stage 4, subcellular integrity and the ability to distinguish nucleus and cytoplasm were lost (Fig. 2C; 18.5 h). The Nuc/Cyt ratio was ≈1.0, but cells appeared smaller and shrunken relative to stage 3. In the final stage 5, many cells died and detached, whereas others formed residual bodies that often lacked a nucleus (Fig. 2). From the five stages of toxic progression, single cells were assigned a scaled value ranging from 1.0 (intact cells) to 0 (residual bodies) at key time points (see Supporting Methods). Roughly 80% of the neurons expressing HD-82F approached death between 18 and 26 h (Fig. 2G; midpoints). However, nuclear entry (Nuc/Cyt = 1.0) did not typically occur until stage 3, in which there were substantial alterations in the cellular architecture (Fig. 2C). It has been debated whether insoluble NIs can cause toxicity. We found that 30–50% of neurons expressing HD-82F formed inclusions but only at late time points posttransfection (data not shown).
Fig. 3.
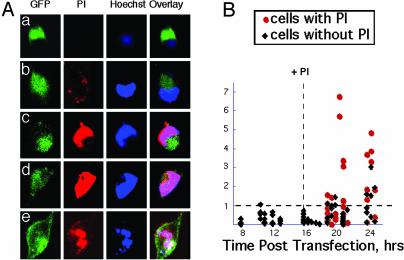
Nuclear entry of mhtt occurs after neurons are compromised. (A) Uptake of PI coincides with nuclear entry of mhtt. GFP indicates localization of HD-82F; Hoechst defines the nucleus; nuclear entry is defined by overlap of Hoechst and GFP. (a–e) Cells captured with increasing degree of PI uptake. (B) Quantification of PI uptake, nuclear entry of HD-82F, and cell death. Nuc/Cyt ratio of GFP was calculated for intact cells (black diamonds) and cells that have taken up PI (red circles). Vertical dashed line indicates addition of PI; horizontal dashed line represents Nuc/Cyt ratio of 1.0. Below line, HD-82F is primarily in the cytoplasm; above line, HD-82F is primarily in the nucleus.
To more precisely quantify the subcellular site at the time of toxicity, HD-82F-expressing STR were simultaneously costained with Hoechst and PI at 16 h posttransfection and followed to cell death (Fig. 3). If toxicity depended on nuclear entry, then mhtt should be present in the nucleus before commitment to cell death. However, in the majority of cells, mhtt entered the nucleus (overlap of Hoechst and GFP) after or with PI (Fig. 3A b–e) when cells became committed to death (Nuc/Cyt >1.0) (Fig. 3B, red). Other large proteins, including the full-length htt, were also allowed into the nucleus (data not shown). These results indicated that the primary initiating event for toxicity of HD-82F occurred in the cytoplasm, and nuclear events took place later in the toxic progression.
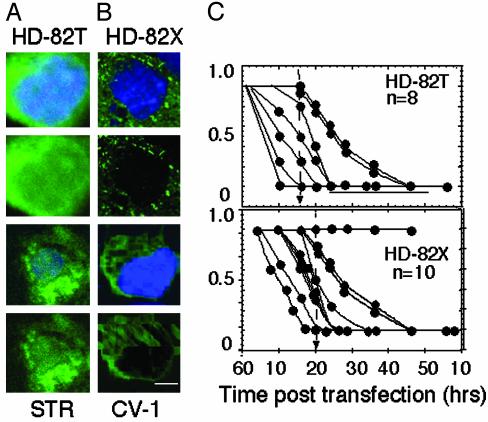
The timing of mhtt cleavage could also be estimated. In each protein, the GFP tag was located at the N terminus to monitor the cleavage and release of small N-terminal fragments. If cleavage occurred during the experiment, then the GFP fluorescence should mark the localization of the released fragment. The absence of significant GFP intensity in the nucleus of neurons after expression of HD-82F suggested that N-terminal fragments were not released before commitment to cell death (Fig. 2 A and B). Indeed, when N-terminal fragments of mhtt were expressed (HD-82T), they freely migrated into the nucleus and were readily detected by GFP intensity there (Fig. 4A). Furthermore, HD-82T initiated death far more quickly than did expression of HD-82F and localized differently in cells. These data indicated that cleavage of HD-82F was not the initiating event in toxicity (Figs. 2G and 4C).
Fig. 4.
Expression of truncated mhtt in STR or CV-1 cells leads to cell death whether or not it is present in the nucleus. (A) Subcellular localization of HD-82T in STR at 10 h posttransfection. (B) Subcellular localization of HD-82X in CV-1 at 10 h posttransfection. (C) Quantification of cell death curves for individual STR expressing HD-82T and -82X. n is number of cells observed.
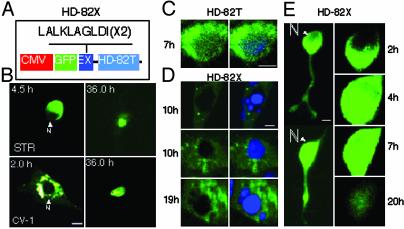
Nuclear Localization of mhtt Is Not Required for Cell Death. It was formally possible that N-terminal fragments were generated in neurons and caused cell death but that the level was below the detection limit. To test the requirement of nuclear localization for cell death in primary neurons, we prevented nuclear accumulation of the N-terminal truncated protein by attaching two copies of a nuclear export signal to HD-82T to create HD-82X (Fig. 5A). Lack of nuclear accumulation did not prevent cell death in STR (Fig. 5B, STR) and fibroblasts (Fig. 5B, CV-1). Single-cell analysis revealed that most neurons expressing HD-82X (Fig. 5 D and E) died between 5 and 30 h posttransfection, similar to HD-82T (Fig. 4C). Neurons expressing HD-82X underwent neurite retraction, followed by cell body rounding, nuclear entry, and residual body formation similar to HD-82F (Fig. 5E). We concluded that neither nuclear localization nor NIs was required for cell death. The midpoint of cell death for HD-82X was shifted to the right (slower) as compared with HD-82T (Fig. 4C), indicating that cytoplasmic localization of N-terminal fragments caused cell death more slowly.
Fig. 5.
Export of HD-82T prevents nuclear accumulation but not cell death. (A) HD-82X construct is identical to HD-82T with the exception of two copies of the export signal (EX) at the N terminus. (B) Absence of HD-82X in the nucleus of either STR or CV-1 does not prevent cell death. Time after transfection is indicated. Images are viewed with a ×32 objective. (C and D) Comparison of the subcellular localization of HD-82T (C) and HD-82X (D)atthe indicated times posttransfection in STR. Images were taken at ×100. (E) Single-cell analysis of STR expressing HD-82X as it progresses toward cell death. Note neurite retraction (Left) and progressive nuclear entry (Right).
Nuclear export of mhtt prevented nuclear accumulation but did not prevent nuclear entry. To block nuclear entry, we used an independent approach that took advantage of cells with smaller DL. Unlike neurons (Fig. 1; DL <70 kDa), CV-1 cells have smaller DL (≈40 kDa), and little nuclear entry of HD-82T can occur (Fig. 1C). If toxicity required nuclear localization, cells with smaller DL (CV-1) should prevent nuclear entry and display increased survival compared with neurons. However, preferential localization of HD-82T in the cytoplasm of CV-1 cells (Fig. 4B) did not prevent cell death. Neither blocking of nuclear accumulation (Fig. 5) nor nuclear entry (Fig. 4) prevented cell death. Therefore, nuclear entry appeared to influence toxicity, but toxicity did not critically depend on nuclear entry.
Deleterious Interactions of mhtt in the Cytoplasm Cause Disruption of Microtubule Tracts. We next evaluated mechanisms by which cytoplasmic interactions of mhtt might mediate toxicity. Single-cell analysis revealed that an early event of the toxic progression involved neurite retraction (Fig. 2 C–F), suggesting disruption and/or collapse of the cytoskeletal architecture. We therefore tested whether components of the cytoskeleton, particularly microtubules, were altered in neurons expressing mhtt.
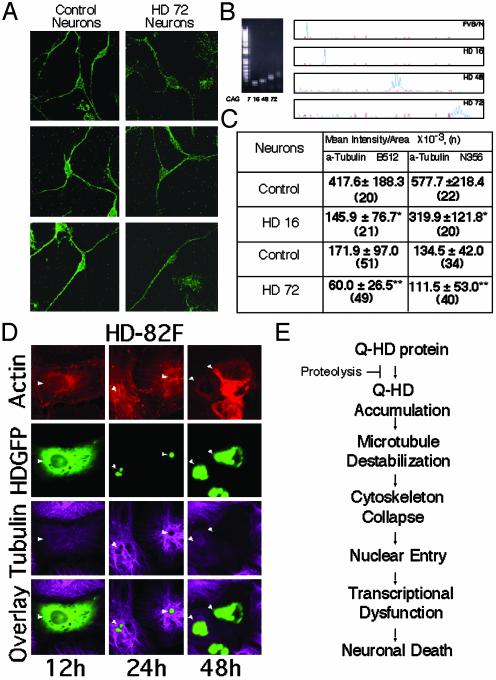
htt binds to monomeric TB (27) and to assembled microtubules (28). We found not only that htt bound to microtubules in vivo, but also that expanded glutamine tract in mhtt altered both its association with and the integrity of the microtubule filaments. Both in neurons of transgenic animals (Fig. 6 A–C) and in patient fibroblasts (not shown), detection of TB with specific antibodies was diminished by more than half in cells expressing mhtt relative to control (Fig. 6 A and C). The presence of mhtt blocked detection of the TB epitope, confirming that mhtt interacts differently with microtubules in disease tissue.
Fig. 6.
TB staining is diminished in cells expressing mhtt. (A) α-TB staining detected by using multiple C-terminal antibodies is diminished in neurons from HD72 transgenic mice. (B) Verification of repeat lengths in control (FVB/N) and transgenic mice expressing human htt with 16, 48, and 72 glutamines. CAG repeat length was determined by mobility on agarose gels (Left) and genescan analysis (Right). (C) Quantification of α-TB staining (by antibodies from A) in STR from control (FVB/N) and HD mice. Values are mean ± SD. *, P < 0.001; **, P < 0.01. (n) is number of cells observed. Experiment was repeated five times. (D) Microtubule structure is disrupted with time in CV-1 cells transfected with HD-82F. (E) Proposed mechanism for toxicity in HD.
To determine whether interaction of mhtt disrupted cytoskeletal architecture, we followed the fate of microtubules, with time, in fibroblasts transfected with HD-82F (Fig. 6D). As with neurons, cells transfected with HD-82F had diminished TB staining relative to untransfected surrounding cells (12 h; Fig. 6D). By 24 h posttransfection, many cells had developed inclusions that were detected as green aggregates (24 h; Fig. 6D). Green inclusion bodies could not be stained with TB antibody (Fig. 6D). By 48 h, cells were approaching death, and both microtubule and actin networks were affected. Residual bodies did not stain with TB antibody, even though surrounding cells were easily detected. These data suggested that microtubules were progressively disrupted by expression of mhtt.
Taxol Inhibits mhtt Toxicity in Neurons. If disruption of microtubules represents a critical early event leading to toxicity, then agents that stabilize microtubules might delay or prevent cell death. To test this hypothesis, we transfected primary STR with HD-82F in the presence or absence of taxol. Taxol is a microtubule-binding protein that promotes assembly and stabilizes microtubules (29). Concentrations of taxol <200 nM were nontoxic in neuronal cultures (Fig. 7A), in agreement with published data (30). Little to no effect on cell survival was observed at high concentrations (>50 nM). However, taxol concentrations between 5 and 20 nM inhibited cell death in neurons expressing HD-82F (Fig. 7 B–D). For 10 nM, the optimum taxol concentration, cell death was nearly absent at 30 h, at which time 50% of untreated STR died (Fig. 7 B–D). Consistent with a sequential mechanism of mhtt-mediated cell death, treatment with 10 nM taxol delayed or prevented nuclear entry of mhtt compared with untreated cells (Fig. 7D). Thus, stabilization of microtubules prolonged cell survival and decreased nuclear entry of mhtt.
Discussion
The role of proteolysis in toxicity mediated by mhtt has been controversial. Here, we present evidence that proteolytic cleavage producing N-terminal fragments can contribute to toxicity but is unlikely to be the primary event. When the full-length mhtt (the form existing in vivo) is expressed, toxicity occurs by a distinctly sequential mechanism. Microtubule destabilization, neurite retraction, and disruption of the cellular architecture precede nuclear entry of mhtt (Fig. 6E). Cytoplasmic dysfunction is primary because stabilization of microtubules with taxol inhibits cell death despite the potential for generating small N-terminal fragments and consequent transcriptional dysfunction. Thus, cleavage is slow and occurs late in HD progression. In experimental models, expression of short N-terminal fragments can lead directly to transcriptional dysfunction because the cleavage step is bypassed.
Cytoplasmic dysfunction as a primary event in toxicity is supported by observations in vivo. Dystrophic neurites have been observed in presymptomatic HD patients with few NIs (31) and in mouse models at early stages of toxicity (32). Affected neurons display cytoplasmic alterations such as decrease in dendritic spines and a thickening of proximal dendrites long before detectable cell loss (31). When full-length mhtt is expressed, the stages of neuronal death that we observed by single-cell analysis recapitulate features of human disease. It is known that expression of the full-length mhtt induces toxicity at a much slower rate than expression of a truncated N-terminal fragment. These data are consistent with observations that inhibition of mhtt cleavage delays cell death (33), whereas enhanced cleavage and nuclear entry of mhtt fragments promote death (34).
We expect that disruption of microtubules will adversely affect microtubule-dependent processes such as stability of neurite cytoskeleton and vesicle trafficking. Indeed, we have recently found that microtubule-dependent vesicular trafficking is affected in neurons in the presence of mhtt (E.T. and R.B.D., unpublished results). Consistent with a sequential model for toxicity, there is evidence that neurite retraction and collapse of the cytoskeleton compromise the integrity of the nucleus. Abnormal nuclear “ruffling” has been found by electron microscopy in neurons of patients with HD (35). Nuclear membrane or pores may become leaky due to disruption of the cytoskeleton, and deterioration of the nuclear membrane may allow nuclear entry even though nuclear and cytoplasmic compartments appear distinct.
We cannot exclude the possibility that an undetectable amount of highly toxic N-terminal fragments exists in the nucleus before death and is responsible for killing cells. If N-terminal fragments at undetectable levels were sufficient to kill cells, then, in vivo, susceptible cells would be expected to undergo acute cell death without the need to accumulate toxic fragments. Such a result is inconsistent with features of human disease. In humans, onset of disease occurs typically in midlife, even though mhtt is present from early development. Despite detectable levels of N-terminal fragments in human brain, late onset rather than acute death occurs. Thus, the gradual disruption of microtubules may be more consistent with the progression and late-onset nature of the disease.
Finally, cytoplasmic dysfunction as a primary event provides a context for transcriptional dysfunction (1). After nuclear entry, the binding of mhtt to transcription factors can rapidly alter gene expression. A sequential mechanism in which cytoplasmic dys-function precedes transcriptional dysfunction explains why taxol or deacetylase inhibitors might reverse toxicity and why nuclear localization contributes to but is not required for cell death.
Supplementary Material
Acknowledgments
We thank BethAnn McLaughlin for help with primary neuronal cultures, Marie-Francois Chesselet for advice, Timothy Farnham for manuscript preparation, and Jim Tarara and the optical morphology core facility for technical assistance. This work was supported by the Mayo Foundation; by National Institutes of Health Grants NS40738, DK 43694-01, and MH-56207; and by National Science Foundation Grant IBN 9728120 (to C.T.M.).
Abbreviations: HD, Huntington's disease; htt, huntingtin; mhtt, mutant htt; NI, nuclear inclusions; NLS, nuclear localization signal; DL, diffusion limit; TB, tubulin; STR, primary striatal neurons; PI, propidium iodide; Nuc/Cyt, nuclear/cytoplasmic.
References
- 1.Cha, J. H. (2000) Trends Neurosci. 23, 387–392. [DOI] [PubMed] [Google Scholar]
- 2.Wyttenbach, A., Swartz, J., Kita, H., Thykjaer, T., Carmichael, J., Bradley, J., Brown, R., Maxwell, M., Schapira, A., Orntoft, T. F., et al. (2001) Hum. Mol. Genet. 10, 1829–1845. [DOI] [PubMed] [Google Scholar]
- 3.Nucifora, F. C., Jr., Sasaki, M., Peters, M. F., Huang, H., Cooper, J. K., Yamada, M., Takahashi, H., Tsuji, S., Troncoso, J., Dawson, T. M., et al. (2001) Science 291, 2423–2428. [DOI] [PubMed] [Google Scholar]
- 4.Kegel, K. B. Meloni, A. R., Yi, Y., Kim, Y. J., Doyle, E., Cuiffo, B. G., Sapp, E., Wang, Y., Qin, Z. H., Chen, J. D., et al. (2002) J. Biol. Chem. 277, 7466–7476. [DOI] [PubMed] [Google Scholar]
- 5.Dunah, A. W., Jeong, H., Griffin, A., Kim, Y. M., Standaert, D. G., Hersch, S. M., Mouradian, M. M., Young, A. B., Tanese, N., Krainc, D., et al. (2002) Science 296, 2238–2243. [DOI] [PubMed] [Google Scholar]
- 6.Steffan, J. S., Bodai, L., Pallos, J., Poelman, M., McCampbell, A., Apostol, B. L., Kazantsev, A., Schmidt, E., Zhu, Y. Z., Greenwald, M., et al. (2001) Nature 413, 739–743. [DOI] [PubMed] [Google Scholar]
- 7.Marsh, J. L., Walker, H., Theisen, H., Zhu, Y. Z., Fielder, T., Purcell, J. & Thompson, L. M. (2000) Hum. Mol. Genet. 9, 13–25. [DOI] [PubMed] [Google Scholar]
- 8.McGowan, D. P., van Roon-Mom, W., Holloway, H., Bates, G. P., Mangiarini, L., Cooper, G. J., Faull, R. L. & Snell, R. G. (2000) Neuroscience 100, 677–680. [DOI] [PubMed] [Google Scholar]
- 9.Schilling, G., Becher, M. W., Sharp, A. H., Jinnah, H. A., Duan, K., Kotzuk, J. A., Slunt, H. H., Ratovitski, T., Cooper, J. K., Jenkins, N. A., et al. (1999) Hum. Mol. Genet. 8, 943–950. [DOI] [PubMed] [Google Scholar]
- 10.Hackam, A. S., Singaraja, R., Zhang, T., Gan, L. & Hayden, M. R. (1999) Hum. Mol. Genet. 8, 25–33. [DOI] [PubMed] [Google Scholar]
- 11.Dyer, R. B. & McMurray, C. T. (2001) Nat. Genet. 29, 270–278. [DOI] [PubMed] [Google Scholar]
- 12.Sapp, E., Penny, J., Young, A., Aronin, N., Vonsattel, J.-P. & DiFiglia, M. (1999) J. Neuropathol. Exp. Neurol. 58, 165–173. [DOI] [PubMed] [Google Scholar]
- 13.Faber, P. W., Barnes, G. T., Srinidhi, J., Chen, J., Gusella, J. F. & MacDonald, M. E. (1998) Hum. Mol. Genet. 7, 1463–1474. [DOI] [PubMed] [Google Scholar]
- 14.Sipione, S., Rigamonti, D., Valenza, M., Zuccato, C., Conti, L., Pritchard, J., Kooperberg, C., Olson, J. M. & Cattaneo, E. (2002) Hum. Mol. Genet. 11, 1953–1965. [DOI] [PubMed] [Google Scholar]
- 15.Dunah, A. W., Jeong, H., Griffin, A., Kim, Y. M., Standaert, D. G., Hersch, S. M., Mouradian, M. M., Young, A. B., Tanese, N. & Krainc, D. (2002) Science 21, 2238–2243. [DOI] [PubMed] [Google Scholar]
- 16.Krainc, D., Bai, G., Okamoto, S., Carles, M., Kusiak, J. W., Brent, R. N. & Lipton, S. A. (1998) J. Biol. Chem. 273, 26218–26224. [DOI] [PubMed] [Google Scholar]
- 17.Yu, Z. H., Li, S. H., Nguyen, H. P. & Li, X. J. (2002) Hum. Mol. Genet. 11, 905–914. [DOI] [PubMed] [Google Scholar]
- 18.McLaughlin, B. A., Nelson, D., Erecinska, M. & Chesselet, M. F. (1998) J. Neurochem. 70, 2406–2415. [DOI] [PubMed] [Google Scholar]
- 19.Conti, A. M., Fischer, S. J. & Windebank, A. J. (1997) Ann. Neurol. 42, 838–846. [DOI] [PubMed] [Google Scholar]
- 20.Perez-Terzic, C., Gacy, A. M., Bortolon, R., Dzeia, P. P., Puceat, M., Jaconi, M., Prendergast, F. G. & Terzic, A. (1999) Circ. Res. 84, 1292–1301. [DOI] [PubMed] [Google Scholar]
- 21.Barnes, G. T., Duyao, M. P., Ambrose, C. M., McNeil, S., Persichetti, F., Srinidhi, J., Gusella, J. F. & MacDonald, M. E. (1994) Somat. Cell Mol. Genet. 20, 87–97. [DOI] [PubMed] [Google Scholar]
- 22.Reddy, P. H., Williams, M., Charles, V., Garrett, L., Pike-Buchanan, L., Whetsell, W. O., Jr., Miller, G. & Tagle, D. A. (1998) Nat. Genet. 20, 198–202. [DOI] [PubMed] [Google Scholar]
- 23.Hodgson, J. G., Agopyan, N., Gutekunst, C.-A., Leavitt, B. R., LePiane, Singararja, R., Smith, D. J., Bissada, N., McCutcheon, K., Nasir, J., et al. (1999) Neuron 23, 181–192. [DOI] [PubMed] [Google Scholar]
- 24.Görlich, D. & Mattaj, I. W. (1996) Science 271, 1513–1518. [DOI] [PubMed] [Google Scholar]
- 25.DiFiglia, M., Sapp, E., Chase, K. O., Davies, S. W., Bates, G. P., Vonsattel, J. P. & Aronin, N. (1997) Science 277, 1990–1993. [DOI] [PubMed] [Google Scholar]
- 26.Wheeler, V. C., White, J. K., Gutekunst, C.-A., Vrbanac, V., Weaver, M., Li, X.-J., Li, S.-H., Yi, H., Vonsattel, J.-P., Gusella, J. F., et al. (2000) Hum. Mol. Genet. 9, 503–513. [DOI] [PubMed] [Google Scholar]
- 27.Hoffner, G., Kahlem, P. & Djian, P. (2002) J. Cell Sci. 115, 941–948. [DOI] [PubMed] [Google Scholar]
- 28.Tukamoto, T., Nukina, N., Ide, K. & Kanazawa, I. (1997) Mol. Brain Res. 51, 8–14. [DOI] [PubMed] [Google Scholar]
- 29.Wilson, L., Miller, H. P., Farrell, K. W., Snyder, K. B., Thompson, W. C. & Purich, D. L. (1985) Biochemistry 24, 5254–5262. [DOI] [PubMed] [Google Scholar]
- 30.He, Y., Yu, W. & Baas, P. W. (2002) J. Neurosci. 22, 5982–5991. [DOI] [PMC free article] [PubMed] [Google Scholar]
- 31.Albin, R. L., Young, A. B., Penney, J. B., Handelin, B., Balfour, R., Anderson, K. D., Markel, D. S., Tourtellotte, W. W. & Reiner, A. (1990) N. Engl. J. Med. 322, 1293–1298. [DOI] [PubMed] [Google Scholar]
- 32.Li, H., Li, S.-H., Yu, Z.-X., Shelbourne, P. & Li, X.-J. (2001) J. Neurosci. 21, 8473–8481. [DOI] [PMC free article] [PubMed] [Google Scholar]
- 33.Wellington, C. L., Singaraja, R, Ellerby, L., Savill, J., Roy, S, Leavitt, B., Cattaneo, E., Hackam, A., Sharp, A., Thornberry, N., et al. (2000) J. Biol. Chem. 275, 19831–19838. [DOI] [PubMed] [Google Scholar]
- 34.Peters, M. F., Nucifora, F. C., Jr., Kushi, J., Seaman, H. C., Cooper, J. K., Herring, W. J., Dawson, V. L., Dawson, T. M. & Ross, C. A. (1999) Mol. Cell. Neurosci. 14, 121–128. [DOI] [PubMed] [Google Scholar]
- 35.Roos, R. A., Bots, G. T. & Hermans, J. (1986) Acta Neurol. Scand. 73, 131–135. [DOI] [PubMed] [Google Scholar]
Associated Data
This section collects any data citations, data availability statements, or supplementary materials included in this article.


