Abstract
The palmitoyl protein thioesterase-2 (PPT2) gene encodes a lysosomal thioesterase homologous to PPT1, which is the enzyme defective in the human disorder called infantile neuronal ceroid lipofuscinosis. In this article, we report that PPT2 deficiency in mice causes an unusual form of neuronal ceroid lipofuscinosis with striking visceral manifestations. All PPT2-deficient mice displayed a neurodegenerative phenotype with spasticity and ataxia by 15 mo. The bone marrow was infiltrated by brightly autofluorescent macrophages and multinucleated giant cells, but interestingly, the macrophages did not have the typical appearance of foam cells commonly associated with other lysosomal storage diseases. Marked splenomegaly caused by extramedullary hematopoiesis was observed. The pancreas was grossly orange to brown as a result of massive storage of lipofuscin pigments in the exocrine (but not islet) cells. Electron microscopy showed that the storage material consisted of multilamellar membrane profiles (“zebra bodies”). In summary, PPT2 deficiency in mice manifests as a neurodegenerative disorder with visceral features. Although PPT2 deficiency has not been described in humans, manifestations would be predicted to include neurodegeneration with bone marrow histiocytosis, visceromegaly, brown pancreas, and linkage to chromosome 6p21.3 in affected families.
Palmitoyl protein thioesterase (PPT) 2 is a lysosomal thioesterase that is 27% identical to PPT1, a lysosomal enzyme defective in a neurodegenerative disorder called infantile neuronal ceroid lipofuscinosis, or infantile Batten disease (1). The neuronal ceroid lipofuscinosis (NCLs) are a group of neurodegenerative disorders of children characterized by the accumulation of autofluorescent storage material in the brain and other tissues, cognitive and motor deterioration, visual failure, and seizures. Notable is the absence of functionally significant manifestations outside the central nervous system (2, 3). The NCLs are caused by defects in at least eight genes (of which six have been identified), and different forms of the disease have a distinct storage ultrastructure (2). The PPT1 or CLN1 gene underlies the most severe form of the disease, and it encodes a thioesterase enzyme that removes palmitate or other fatty acids from cysteine residues in proteins (4–6). The enzyme encoded by PPT2 is a second lysosomal thioesterase with a substrate specificity that overlaps that of PPT1 (7–9).
Recently, we disrupted both PPT1 and PPT2 genes in mice and showed that homozygous PPT1 knockout mice have a neurodegenerative disorder that closely parallels infantile Batten disease (10). Most PPT1 knockout mice are terminal by 10 mo of age. Preliminary analysis of homozygous PPT2 knockout mice at 10 mo had shown the development of scant autofluorescent storage material in the brain and a neurological phenotype in a proportion of the animals. In the current article, we have extended the observation of these PPT2 knockout mice throughout their natural lifespan and analyzed their behavioral and histopathological features. We find that, rather than a typical form of NCL, the mice exhibit an unusual NCL with extraneuronal features.
Materials and Methods
Behavioral Studies. Details concerning the construction of the PPT2 knockout mouse strain have been reported (10). All studies were performed by using PPT2 homozygous knockout (or WT control) mice on a mixed C57BL/6J × 129S6/SvEvTac background. A tail suspension test was performed by grasping the tail and holding the mouse ≈1 foot from a solid surface for 30 sec (11). The test was considered positive if all four limbs came to the midline and remained in place for several seconds. No phenotypic abnormalities were seen in heterozygous mice. Controls in behavioral studies included both WT and heterozygous littermates, and the observer was blinded as to the genotypes of the animal.
Histological Studies. Age-matched WT and PPT2 knockout mice were killed by pentobarbital overdose and perfused transcardially with cold, heparinized physiological saline followed by 4% formaldehyde, freshly prepared from paraformaldehyde, in PBS, pH 7.4. Tissues were harvested, dehydrated and paraffinembedded, and sectioned according to standard protocols. Serial sections (5 μM) were deparaffinized and stained with routine hematoxylin/eosin or Sevier–Munger stain (12) for pathological evaluation, or left unstained and coverslipped with Vectashield (Vector Laboratories) for evaluation of autofluorescent pigment (excitation 470 ± 20 nm, emission 525 ± 25 nm). Femurs were decalcified in 15% EDTA for 1 wk before processing for paraffin embedding. Bone marrow was counterstained with Hoechst 33342 dye (Molecular Probes) to visualize cell nuclei.
Immunohistochemistry. Immunohistochemistry was performed as indicated in the figure legends by using polyclonal chicken anti-rat PPT2 at a dilution of 1:100 or polyclonal goat anti-cathepsin D (Santa Cruz Biotechnology) according to the directions supplied by the manufacturer. Biotinylated anti-CD45R/B220 and anti-mac3 (Pharmingen) were used to visualize B cells and macrophages in spleen and bone marrow, respectively, by using species-specific secondary Abs and avidin/biotin/peroxidase reagents (Ventana BioTek Solutions, Tucson, AZ). Fixation, permeabilization, and staining runs were carried out in exact parallel to ensure comparative significance between groups (13).
Electron Microscopy. Electron microscopy was performed on brain and pancreas from 15-mo-old mice perfused with PBS and fixed in 2% glutaraldehyde in 100 mM sodium cacodylate buffer, pH 7.4, as described (14).
Results
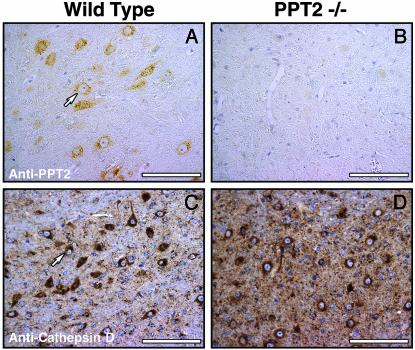
PPT2 in Brain Tissues and Neurological Phenotype in Knockout Mice. Immunohistochemical analysis demonstrated the absence of PPT2 from the brains of PPT2 knockout mice (Fig. 1). PPT2 immunoreactivity was distributed uniformly throughout the brain in WT mice, primarily in neurons, with relatively low expression in glial cells (data not shown). The punctate perinuclear localization for PPT2 is typical of that seen for other lysosomal enzymes in neurons, such as cathepsin D (Fig. 1, compare A and C).
Fig. 1.
PPT2 immunoreactivity in WT and PPT2 knockout mouse brain. WT (A and C) and PPT2 knockout (B and D) mouse brain tissue was incubated with Abs directed against rat PPT2 (A and B) or cathepsin D (C and D). The punctate perinuclear staining pattern in cell bodies of neurons stained with anti-PPT2 Abs is similar to that of the lysosomal marker, cathepsin D. (Bar = 100 μm).
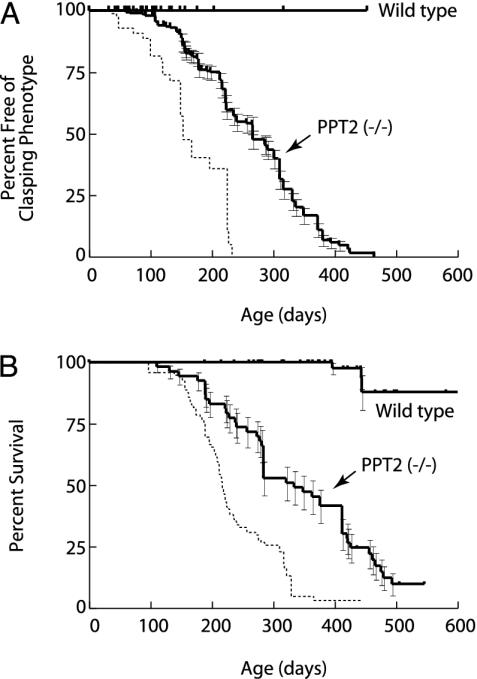
We had previously observed that PPT2 knockout mice begin to develop a neurological phenotype by 10 mo of age (10). We have now carried out observations of a large cohort of these animals for 24 mo. As shown in Fig. 2A, 50% of mice displayed a positive result in the tail suspension test (“clasping” phenotype) by 9 mo and nearly 100% showed this phenotype by 13 mo. The development of this abnormality is somewhat retarded as compared to PPT1 knockout mice (dotted line in Fig. 2 A shown for comparison). Other abnormalities in PPT2-deficient mice were a side-to-side ataxic gait that developed after the appearance of the clasping abnormality and frequent myoclonic jerks without spontaneous seizures. Mortality of the PPT2-deficient mice was increased as compared to WT, reaching 50% at 11 mo and 90% at 17 mo (Fig. 2B). The only other clinically evident abnormality in the PPT2 knockout mice was increased abdominal girth (see below).
Fig. 2.
Appearance of neurological abnormalities and decreased survival in PPT2 knockout mice. (A) Kaplan–Meier analysis of clasping phenotype in the tail suspension test in WT and PPT2 knockout mice (n = 58 and 319, respectively). (B) Kaplan–Meier survival curve for WT and PPT2 knockout mice (n = 120 and 53, respectively). Curves shown are significantly different from each other at a level of P < 0.001 (two-tailed Mantel–Haenszel log rank test). Median time to appearance of clasping phenotype was 152 and 266 days, and median survivals were 216 days and 334 days, for PPT1 and PPT2 knockout mice, respectively. Dotted lines indicate similar data for PPT1 knockout mice shown for comparison (n = 99, data for PPT1 knockout mice updated from ref. 10).
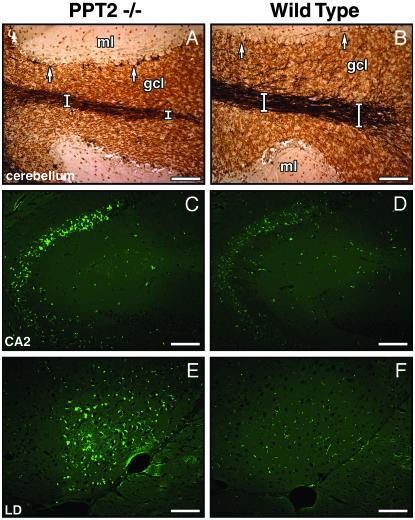
Brain Histopathology. Brains of PPT2 knockout mice up to 15 mo of age were grossly normal on visual inspection, but the average brain weight was decreased by 10% as compared to controls (data not shown). Hematoxylin/eosin-stained sections of PPT2 knockout brains revealed cerebral cortical atrophy. Widely scattered apopototic bodies were detected by terminal deoxynucleotidyltransferase-mediated dUTP nick end labeling staining not only in the cortex but also in the thalamus and the pyramidal neurons of the CA2/CA3 regions of the hippocampus. Mildly increased fibrillary astrocytosis was confirmed by immunohistochemical staining with antiglial fibrillary acidic protein Abs (data not shown). The granule cell layer of the cerebellar cortex was compact, and silver staining (Fig. 3 A and B) showed atrophy of the white tracts in the core of the cerebellar folia and a moderate decrease in the dendritic arborization within the granule cell layer. These observations are consistent with the previously reported relatively high expression of PPT2 mRNA in the granule cell layer (10). The Purkinje cell layer was intact.
Fig. 3.
Neuropathology in PPT2 knockout mice. Light microscopic overview of silver-stained cerebellar folium in PPT2 knockout (A) and WT (B) mice. Atrophy of the granule cell layer and white tracts (white bars) and loss of dendritic arborization in the granule cell layer in the PPT2 knockout mice are shown. gcl, granular cell layer; ml, molecular layer. Arrows denote Purkinje neurons, which are well preserved. (C–F) Autofluorescent images of brain regions of 15-mo-old PPT2 knockout and WT mice. Regions shown are CA2 region of hippocampus (C and D) and lateral dorsothalamic (LD) nucleus (E and F). (Bar = 100 μm.)
Autofluorescent bodies typical of the NCLs were readily observed throughout the brains of PPT2 knockout mice that were at least 15 mo of age (Fig. 3 C and E). The autofluorescence appeared as punctate yellow-green droplets with concentration in the CA2/CA3 region of the hippocampus, the pons, and the lateral dorsal nucleus of the thalamus. Autofluorescence in Purkinje cells was nearly absent (data not shown).
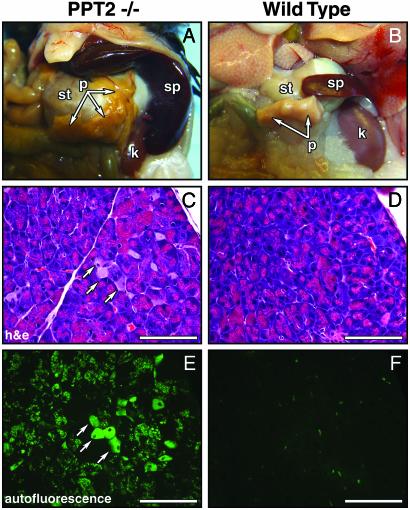
Visceral Histopathology. On gross inspection of the viscera of older (10–17 mo) PPT2 knockout mice, there were two striking findings. First, in virtually every PPT2 mouse examined, the pancreas was noted to be enlarged, gelatinous, and deeply pigmented, appearing orange in some animals to deeply brown in others (Fig. 4A). Examination of hematoxylin/eosin-stained sections revealed that normal zymogen granules had been largely replaced with large pigment granules in many of the exocrine cells (Fig. 4, compare C and D). An increase in the number of interstitial macrophages (Fig. 4C, arrows) in the PPT2 knockout pancreas was also noted. Unstained sections examined under fluorescence microscopy showed massive and unprecedented autofluorescence in the exocrine cells of the pancreas (Fig. 4E), whereas the pancreatic islets were completely devoid of autofluorescence (data not shown). Despite the striking gross and histological findings, there was no clinical or biochemical evidence of exocrine pancreatic dysfunction. Values for serum amylase and lipase levels in the mice were normal (amylase 2,640 ± 260 vs. 2,200 ± 190, and lipase 1,210 ± 79 and 1,420 ± 105, mean ± SE, n = 6, for PPT2 knockouts and controls, respectively) and the stools of PPT2 knockout mice were normal.
Fig. 4.
Visceral pathology in PPT2 knockout mice. (A and B) Viscera of PPT2 knockout and WT mice are shown in situ. Note the orange discoloration of the pancreas and the massive splenic enlargement in the knockout mouse. (C and D) Hematoxylin/eosin-stained sections of pancreas. Interstitial macrophages are increased (arrows) and cytoplasmic inclusions are seen intermixed with zymogen granules in exocrine cells. (E and F) Corresponding autofluorescent images. st, stomach; p, pancreas; sp, spleen; k, kidney. (Bar = 100 μm.)
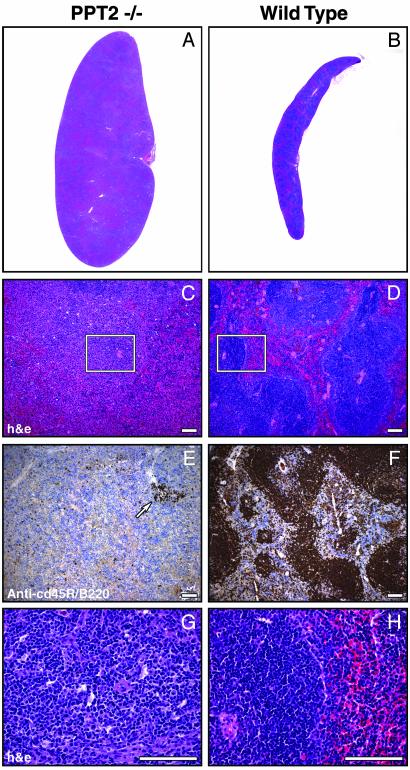
The second major finding on gross examination of the viscera was massive splenomegaly in the PPT2 knockout mice (Fig. 4 A and B). Spleen weights were determined in a large number of age-matched mice from 7 to 17 mo of age; the values were 0.111 ± 0.007 g (mean ± SE, n = 39, range 0.060–0.25) for the WT mice vs. 0.462 ± 0.076 g (mean ± SE, n = 52, range 0.068–2.67) in the PPT2 knockout mice. (Note that care was taken to exclude mice with lymphoma demonstrated by histopathology because lymphoma occurs at high frequency in the C57BL/6J background strain.) Hematoxylin/eosin-stained sections of spleens revealed loss of the normal splenic architecture (Fig. 5 A–D) with loss of follicles containing B cells, as revealed by staining with a B cell marker, CD45R/B220 (Fig. 5 E and F). At high magnification, the spleens were found to be replaced by extramedullary hematopoiesis, with abundant neutrophilic and erythrocytic precursors and megakaryoctyes (Fig. 5 G and H). Examination of selected liver samples from mice showed occasional hepatomegaly with extramedullary hematopoiesis as well.
Fig. 5.
Extramedullary hematopoiesis in spleens of PPT2 knockout and WT mice. Low-power (A and B) and high-power (C and D) photomicrographs of hematoxylin/eosin-stained spleen sections are shown. Note that the well demarcated areas of normal white and red pulp (D) are lost in the PPT2 knockout (C). (E and F) Sections adjacent to C and D above were stained with a B lymphocyte marker (anti-CD45R/B220) to highlight the depletion of the B cell population. A residual lymphocyte follicle is indicated by an arrow in E. Images are representative of 15 of 19 PPT2 knockout spleens and 11 of 11 normal spleens. Four of the 19 PPT2 knockout spleens had a much lower level of extramedullary hematopoiesis similar to that of normal mice. (G and H) Magnified views of boxed portions of C and D, respectively. Note the presence of megakaryocytes and other hematopoietic elements in PPT2 knockout spleen (G). (Bar = 100 μm.)
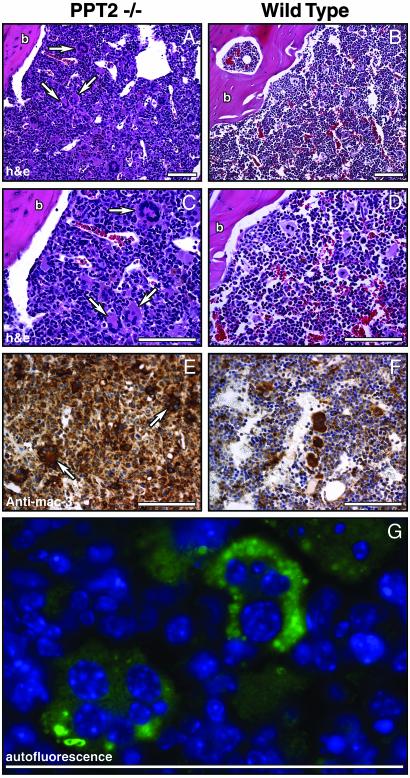
The finding of splenic and hepatic extramedullary hematopoiesis prompted a close examination of the bone marrow in the PPT2 knockout mice. A total of 12 PPT2 knockout and 12 WT bone marrow specimens were examined, and representative results are shown in Fig. 6. Interestingly, the bone marrow in PPT2 knockout animals was replaced by a diffuse infiltration of macrophages (Fig. 6 A–D), which stained with a macrophage marker, mac3 (Fig. 6 E and F). The macrophages did not have the typical appearance of “foam” cells seen in other lysosomal storage disorders, but moderate amounts of autofluorescent material could be demonstrated under UV illumination. Also striking in the PPT2 knockout bone marrow was the presence of large numbers of multinucleated giant cells (indicated by arrows) that were not present in control animals. The multinucleated giant cells were found to contain brightly autofluorescent storage material (Fig. 6G). Despite the heavy macrophage and giant cell infiltrate in the bone marrow, peripheral blood counts in the PPT2 knockouts were not significantly different from normal, suggesting that extramedullary hematopoiesis was sufficient to compensate for the bone marrow pathology. Note that routine bone radiographs of three knockout and three normal mice were normal (data not shown).
Fig. 6.
Bone marrow infiltration by macrophages and multinucleated giant cells in PPT2 knockout mice. (A–D) Hematoxylin/eosin-stained longitudinal sections of bone marrow from age-matched PPT2 knockout and WT mice. Arrows denote multinucleated giant cells. (C and D) High-magnification images corresponding to images in A and B.(E and F) Anti-mac3 immunostaining of macrophages in PPT2 knockout and WT mice. Multinucleated giant cells, seen only in the PPT2 knockout mice, are indicated by arrows. The few large stained cells in the WT marrow (F) are normal megakaryocytes, which also stain with the anti-mac3 Ab but are negative for F4/80, a macrophage-specific marker (data not shown). (G) Autofluorescent storage material (green) in multinucleated giant cells in PPT2 knockout bone marrow. Cell nuclei are stained with Hoechst dye (blue). No significant autofluorescence was seen in control mouse bone marrow (data not shown). b, bone. (Bar = 100 μm.)
Examination of other organs of PPT2 knockout mice revealed modestly increased autofluorescent storage material in many tissues without associated pathology. Cells of the retinal pigment epithelium showed bright autofluorescence. The interstitial cells of Leydig in the testes in the knockout mice were distended and inclusions in the cytoplasm were visible as brown pigment that was brightly autofluorescent. The pyloric and fundic glands of the stomach contained abundant autofluorescent storage material. In the liver, moderate autofluorescence was detected in the interstitial macrophages but not in the parenchymal cells. A very fine dust-like autofluorescence was seen in transitional cells of the urinary bladder epithelium. Autofluorescence in kidney, lungs, heart and skeletal muscle, intestine, skin, and adrenal was not notably different from that seen in control tissues. Routine serum chemistries were normal.
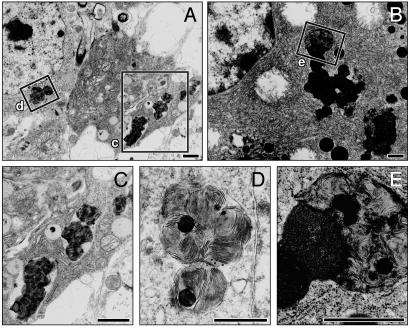
Ultrastructure of Storage Material. Repeated attempts to visualize the ultrastructure of the autofluorescent storage material in brain tissue from PPT2 knockout mice were unsuccessful until the age of 15 mo. However, after 15 mo, clear inclusions were adequately demonstrated in cells of the cerebral cortex, cerebellum, and brainstem. The inclusions appeared as multilamellar membranous whorls, which in most cases appeared within membranous vacuolar structures (Fig. 7D). The ultrastructure did not resemble the granular osmiophilic, curvilinear, fingerprint, or rectilinear profiles commonly associated with the major forms of NCL (3). They were most similar to so-called “zebra bodies” described in sporadic cases of neurodegenerative disorders or in late-onset forms of mucopolysaccharidosis (15). The storage bodies in the exocrine cells of the pancreas were quite distinct from zymogen granules and consisted of large, irregular blocks that were somewhat more dense than the material in the brain but also consisted of a multilamellar pattern surrounding occasional lipid-like droplets (Fig. 7E).
Fig. 7.
Electron micrographs of storage deposits in neurons (A) and pancreatic exocrine cells (B) of PPT2 knockout mice. (C–E) Enlarged images of the corresponding boxes indicated in A and B. Electron dense and multilamellar bodies in membrane-bound vacuoles are shown. (Bar = 100 μm.)
Discussion
The current study shows that deletion of the lysosomal thioesterase encoded by the gene PPT2 in the mouse leads to a syndrome of neurological deterioration, infiltration of bone marrow by (nonfoamy) macrophages and multinucleated giant cells, and impressive splenomegaly caused by extramedullary hematopoiesis. In addition, the pancreas is grossly abnormal, appearing orange to brown because of massive accumulation of storage pigment in the acinar cells, but pancreatic function is normal. Autofluorescent storage material is present in many cell types, particularly reticuloendothelial cells and neurons. Taken together, these findings suggest a NCL that is less severe than PPT1 deficiency (infantile Batten disease), but one with extraneuronal features common to other lysosomal storage diseases. The pigmentary pancreatic pathology, however, is entirely unique.
Mammalian tissues contain two related thioesterases, PPT1 and PPT2, and we have shown that the deficiency in one enzyme causes a more purely neurodegenerative disorder (10), whereas deficiency in the second combines both neurodegenerative and visceral features. This is an interesting finding but not one without precedent. In addition to the two thioesterases, mammalian tissues contain two genetically distinct β-galactosidases (galactocerebroside β-galactosidase and GM1 ganglioside β-galactosidase) (16). Deficiencies of the respective β-galactosidases result in entirely different disorders: one, more purely neurodegenerative (Krabbe disease) and the second neurovisceral (GM1 gangliosidosis). In the case of the related β-galactosidases, the unique characteristics of the corresponding diseases have been related to the different natural substrates involved: psychosine in Krabbe disease (16) and GM1 ganglioside in GM1 gangliosidosis (17). Both β-galactosidases share lactosylceramide as a substrate, and accumulation of this substrate does not occur in either disorder. Like the two β-galactosidases, the two lysosomal thioesterases (PPT1 and PPT2) also have overlapping substrate specificities (9). Both enzymes share palmitoyl CoA as a substrate, whereas palmitoylcysteine is a substrate unique to PPT1, and substrates unique to PPT2 remain to be defined. Presumably, palmitoyl CoA would not accumulate in either of the thioesterase deficiencies. Presumably, the neurological phenotype of the PPT1-deficient mouse may be attributed to the accumulation of palmitoyl peptides or palmitoylcysteine, and the complex phenotype in the PPT2 knockout mouse is caused by substrates unique to PPT2. The massive accumulation of storage material in the pancreas will provide a source of material for defining these substrates.
How would one identify a PPT2-deficient human? It is important to note that the location of the PPT2 gene on human chromosome 6p21.3 (8) does not correspond to any previously described human disease gene locus. Mouse models of the lysosomal storage diseases have tended to reproduce many features of the corresponding human disorders (18, 19), with some exceptions (20). It may be especially important to consider only the positive findings as a minimum phenotype that might be present in the human deficiency.
The clinical and pathological findings in the PPT2-deficient mouse would suggest any of several lysosomal storage disorders characterized by neurodegeneration (neuronal loss/gray matter disease) and macrophage involvement in bone marrow and spleen. This differential diagnosis includes the neuronopathic forms of Gaucher disease, GM1 gangliosidosis, Niemann–Pick disorders, and mucopolysaccharidosis III (Sanfilippo syndrome). Extramedullary hematopoiesis in the spleen and liver is a prominent feature of Gaucher disease, where displacement of normal marrow by storage filled macrophages is seen. Multinucleated giant cells (which, like the cells in PPT2 knockout mice, fluoresce under UV light) are easily identified in Niemann–Pick types A and B (acidic sphingomyelinase deficiency) (21). However, in PPT2 deficiency the affected individual would probably exhibit neither the characteristic foam cell nor the known enzymatic defect associated with the above disorders. The ultrastructure of the storage material in the PPT2-deficient mouse, although somewhat distinctive, resembles zebra bodies that have been described in the neurons in late onset Tay–Sachs variants, Niemann–Pick type C, and the mucopolysaccharidoses (15).
It is also possible that a PPT2-deficient human would not be recognized as suffering from a lysosomal storage disorder at all. The neuronal ceroid lipofuscinoses were not clearly recognized as lysosomal storage disorders until rather recently, when the underlying gene products were shown to be lysosomal enzymes or proteins. Rather, they were classified as childhood neurodegenerative diseases with blindness as a prominent component (3). This is because the storage material in the NCLs is nearly invisible by routine staining methods and the profound autofluorescence is easily overlooked. [Multiple attempts were necessary to demonstrate the neuronal inclusions by electron microscopy in our mice, just as in many cases of NCL in humans (22).] The macrophage infiltrate seen in the PPT2-deficient mouse does not appear as a foam cell as it does in typical lysosomal storage, but rather as a normal macrophage containing storage material that is apparent only under UV illumination. It is likely that these cells die before they become distended by storage material. The distinctive pancreatic pathology would probably not be a consideration in clinical diagnosis as there was no chemical or clinical evidence of pancreatitis or pancreatic insufficiency.
In conclusion, we have shown that PPT2 deficiency in mice manifests as a unique neurodegenerative disease with visceral features. PPT2 deficiency could be considered as a possibility in human patients with a progressive neurodegenerative disorder and increased macrophages in the bone marrow with multinucleated giant cells and splenomegaly in whom known lysosomal storage disorders have been ruled out.
Acknowledgments
We thank Jeffrey Stark and Chris Pomajzl for assistance with histology and Dr. Michael J. Bennett for automated blood and serum analyses. This work was supported by grants from the National Institutes of Health (NS36867) and the Perot Family Foundation.
This paper was submitted directly (Track II) to the PNAS office.
Abbreviations: NCL, neuronal ceroid lipofuscinosis; PPT, palmitoyl protein thioesterase.
References
- 1.Vesa, J., Hellsten, E., Verkruyse, L. A., Camp, L. A., Rapola, J., Santavuori, P., Hofmann, S. L. & Peltonen, L. (1995) Nature 376, 584–587. [DOI] [PubMed] [Google Scholar]
- 2.Mitchison, H. M. & Mole, S. E. (2001) Curr. Opin. Neurol. 14, 795–803. [DOI] [PubMed] [Google Scholar]
- 3.Goebel, H. H., Mole, S. E. & Lake, B. D. (1999) The Neuronal Ceroid Lipofuscinoses (Batten Disease) (IOS Press, Burke, VA).
- 4.Camp, L. A. & Hofmann, S. L. (1993) J. Biol. Chem. 268, 22566–22574. [PubMed] [Google Scholar]
- 5.Camp, L. A., Verkruyse, L. A., Afendis, S. J., Slaughter, C. A. & Hofmann, S. L. (1994) J. Biol. Chem. 269, 23212–23219. [PubMed] [Google Scholar]
- 6.Lu, J. Y., Verkruyse, L. A. & Hofmann, S. L. (1996) Proc. Natl. Acad. Sci. USA 93, 10046–10050. [DOI] [PMC free article] [PubMed] [Google Scholar]
- 7.Soyombo, A. A. & Hofmann, S. L. (1997) J. Biol. Chem. 272, 27456–27463. [DOI] [PubMed] [Google Scholar]
- 8.Soyombo, A. A., Yi, W. & Hofmann, S. L. (1999) Genomics 56, 208–216. [DOI] [PubMed] [Google Scholar]
- 9.Calero, G. A., Gupta, P., Nonato, M. C., Tandel, S., Biehl, E. R., Hofmann, S. L. & Clardy, J. (2003) J. Biol. Chem. 278, 37957–37964. [DOI] [PubMed] [Google Scholar]
- 10.Gupta, P., Soyombo, A. A., Atashband, A., Wisniewski, K. E., Shelton, J. M., Richardson, J. A., Hammer, R. E. & Hofmann, S. L. (2001) Proc. Natl. Acad. Sci. USA 98, 13566–13571. [DOI] [PMC free article] [PubMed] [Google Scholar]
- 11.Martin, J. E. & Shaw, G. (1998) Neuropathol. Appl. Neurobiol. 24, 83–87. [DOI] [PubMed] [Google Scholar]
- 12.Carson, F. (1980) in Theory and Practice of Histotechnology, eds. Sheehan, D. C. & Hrapchak, B. B. (Battelle Press, Columbus, OH), pp. 252–266.
- 13.Labat-Moleur, F., Guillermet, C., Lorimier, P., Robert, C., Lantuejoul, S., Brambilla, E. & Negoescu, A. (1998) J. Histochem. Cytochem. 46, 327–334. [DOI] [PubMed] [Google Scholar]
- 14.Das, A. K., Becerra, C. H. R., Yi, W., Lu, J.-Y., Siakotos, A. N., Wisniewski, K. E. & Hofmann, S. L. (1998) J. Clin. Invest. 102, 361–370. [DOI] [PMC free article] [PubMed] [Google Scholar]
- 15.Dolman, C. L. (1984) Semin. Diagn. Pathol. 1, 82–97. [PubMed] [Google Scholar]
- 16.Wenger, D. A., Suzuki, K., Suzuki, Y. & Suzuki, K. (2001) in The Metabolic and Molecular Bases of Inherited Disease, eds. Scriver, C. R., Beaudet, A. L., Sly, W. S. & Valle, D. (McGraw–Hill, New York), Vol. 3, pp. 3669–3694. [Google Scholar]
- 17.Suzuki, Y., Oshima, A. & Nanba, E. (2001) in The Metabolic and Molecular Bases of Inherited Disease, eds. Scriver, C. R., Beaudet, A. L., Sly, W. S. & Valle, D. (McGraw–Hill, New York), Vol. 3, pp. 3775–3809. [Google Scholar]
- 18.Suzuki, K. & Mansson, J. E. (1998) J. Inherit. Metab. Dis. 21, 540–547. [DOI] [PubMed] [Google Scholar]
- 19.Suzuki, K. & Proia, R. L. (1998) Brain Pathol. 8, 195–215. [DOI] [PMC free article] [PubMed] [Google Scholar]
- 20.Elsea, S. H. & Lucas, R. E. (2002) ILAR J. 43, 66–79. [DOI] [PubMed] [Google Scholar]
- 21.Schuchman, E. H. & Desnick, R. J. (2001) in The Metabolic and Molecular Bases of Inherited Disease, eds. Scriver, C. R., Beaudet, A. L., Sly, W. S. & Valle, D. (McGraw–Hill, New York), Vol. 3, pp. 3589–3610. [Google Scholar]
- 22.Wisniewski, K. E., Kida, E., Patxot, O. F. & Connell, F. (1992) Am. J. Med. Genet. 42, 525–532. [DOI] [PubMed] [Google Scholar]


