Abstract
Active proton transfer through membrane proteins is accomplished by shifts in the acidity of internal amino acids, prosthetic groups, and water molecules. The recently introduced step-scan attenuated total reflection Fourier-transform infrared (ATR/FT-IR) spectroscopy was employed to determine transient pKa changes of single amino acid side chains of the proton pump bacteriorhodopsin. The high pKa of D96 (>12 in the ground state) drops to 7.1 ± 0.2 (in 1 M KCl) during the lifetime of the N intermediate, quantitating the role of D96 as the internal proton donor of the retinal Schiff base. We conclude from experiments on the pH dependence of the proton release reaction and on point mutants where each of the glutamates on the extracellular surface has been exchanged that besides D85 no other carboxylic group changes its protonation state during proton release. However, E194 and E204 interact with D85, the primary proton acceptor of the Schiff base proton. The C⩵O stretching vibration of D85 undergoes a characteristic pH-dependent shift in frequency during the M state of wild-type bacteriorhodopsin with a pKa of 5.2 (±0.3) which is abolished in the single-site mutants E194Q and E204Q and the quadruple mutant E9Q/E74Q/E194Q/E204Q. The double mutation E9Q/E74Q does not affect the lifetime of the intermediates, ruling out any participation of these residues in the proton transfer chain of bacteriorhodopsin. This study demonstrates that transient changes in acidity of single amino acid residues can be quantified in situ with infrared spectroscopy.
Keywords: proton transfer, photocycle, retinal, membrane protein, proton pump
A proton translocating pathway comprises a chain of donors and acceptors. The acidity of these groups is influenced by their local environment. The heterogeneous matrix of a protein is able to modulate the acidity of protonatable amino acid side chains over a large range. Nearby charges, hydrogen bonding, and solvation determine the apparent pKa¶ in a complex manner. Not surprisingly, the (apparent) acidity of a particular residue within a protein covers several orders of magnitude. Changes in the immediate vicinity of these residues will lead to shifts in pKa and, consequently, proton transfer can occur. If a particular residue is part of a hydrogen-bonded system, even long-range proton transfer is feasible. Functionally relevant conformational changes of membrane proteins can be triggered by ion gradients [e.g., in ATP-synthases (1), in lactose permease (2), or in the phosphate transport protein (3)], by electron transfer [as in photosynthetic reaction centers (4) or cytochrome c oxidase (5)], or by light [as in rhodopsin (6) and bacteriorhodopsin (7)]. In all of these proteins, proton transfer reactions play a dominant role and glutamates or aspartates are the major players. Cycling between high and low pKa values of these residues was often referred to conceive proton pumping in membrane proteins.
It is obvious that the determination of pKa values in the resting as well as in intermediate states is the basis of a detailed understanding of proton transfer within proteins. Theoretical calculations on membrane proteins (8–10) can give only a qualitative picture of the acidity of internal amino acids. Quantitative results mostly suffer from the uncertainty in the protein dielectric constant (11). Evidently, an experimental method is required that is sensitive to the protonation state of single amino acid side chains. Infrared difference spectroscopy, in which single group vibrations are observable, has proven to deliver major contributions to the understanding of proton transfer in several membrane proteins (for reviews see refs. 12 and 13). With the extension of attenuated total reflection (ATR), infrared spectroscopy in excess water is feasible, allowing precise control of external parameters such as ionic strength, pH, and temperature. In this way, pKa values of the ground state of a protein can be determined. Recently, we have demonstrated that the combination of ATR with the step-scan technique provides Fourier-transform infrared (FT-IR) spectra with microsecond time resolution and high signal-to-noise ratio (14, 15). By these means, it is possible to determine in situ changes in pKa of relevant amino acid side chains during protein action.
We used the membrane protein bacteriorhodopsin (BR) (7) as a model system for light-driven proton transport. The first proton transfer process takes place in about 50 μs, when the retinal Schiff base donates its proton to D85 (16). In the terminology derived from visible spectroscopy this reaction corresponds to the L–M transition. D85 stays protonated and another proton is released to the extracellular membrane surface (17). The close temporal coupling between the deprotonation reaction of the Schiff base and the proton release to the membrane surface already suggests a long-distance interaction between D85 and the group releasing the proton. Initially, E204 was proposed to be the proton release group (9, 18), which transiently lowers its pKa from higher than 9 down to 5.8 (19). The role of E204 was challenged (20), and recent findings favor E194 to represent the last member of the proton release chain (21, 22). From the spatial orientation E9 was also suggested to play a role in proton translocation (23). Contrary to this, we conclude from the present studies on the pH dependence of the wild-type M-BR difference spectra and on point mutants of BR that none of the glutamates along the extracellular surface (E9, E74, E194, and E204) change protonation state during the proton-release reaction in an observable way.
During the following transition from the M to the N intermediate the Schiff base is reprotonated by D96 (24, 25). The molecular details of the subsequent proton transfer from the cytoplasmic surface to D96 in the N-to-O step are still obscure, although D38 was shown to be involved (26). The capture of protons from the cell interior is facilitated by a cluster of acidic residues along the cytoplasmic surface (26–28). Finally, deprotonation of D85 during O decay (15, 25) completes the proton cycle of BR.
Acid/base equilibria affect a variety of molecular reactions of BR. For example, the L–M transition is accelerated at alkaline pH (15, 29). At low pH the O intermediate is accumulated, whereas the lifetime of the N intermediate is prolonged at high pH (15, 30–32). The sequence of proton release and uptake is reversed at a pH lower than 6 [late proton release (33, 34)]. This effect was ascribed to the downshift of the pKa of the proton release group from 9.5 in the unphotolyzed state (35, 36) to 5.8 in M (19). It was also suggested that the subsequent proton transfer from D96 to the Schiff base is driven by a decrease in the pKa of D96 (37). Up to now, direct evidence for pKa changes on the single-residue level was missing. In this report, we determined the pKa of D96 to be 7.1 (±0.2) in the N state. The transient drop in acidity from pKa > 12 in the ground state of BR (C.Z. and J.H., unpublished data) down to 7.1 fully accounts for the function of D96 as internal proton donor of the Schiff base. The same value within experimental error is calculated for the pH dependency of the transient accumulation of N and O. This suggests that the protonation state of D96 controls the N–O equilibrium.
MATERIALS AND METHODS
Purple membrane (PM) from Halobacterium salinarum strain S9 (38) and the single-site mutants E194Q and E204Q were prepared as described (26). To obtain the double mutant E9Q/E74Q and the quadruple mutant E9Q/E74Q/E194Q/E204Q, oligonucleotide-directed mutagenesis was performed by PCR. The mutant bacterioopsin gene was introduced into H. salinarum strain L33 by using the shuttle vector pXL NovR, which contains a sequence resulting in resistance to novobiocin.
Sample preparation and technical details of time-resolved ATR/FT-IR difference spectroscopy (time resolution 5 μs) have been reported previously (14, 15). Purple membrane suspension was slowly dried on either a ZnSe or a ZnS internal reflection element (IRE). After the IRE had been mounted into an appropriate holder the sample was covered with 2 ml of aqueous solution containing 1 M KCl and 25 mM buffer (citrate, phosphate, or carbonate for the respective pH). All experiments were done at 20°C but the M-BR difference spectrum of the quadruple mutant was obtained at −18°C under continuous illumination with yellow light (λ > 515 nm). FT-IR measurements were performed on a Bruker IFS 66v spectrometer (spectral resolution 4.5 cm−1) equipped with the step-scan option and an “out-of-compartment” ATR accessory. The sample was flashed by a Nd:YAG laser (neodymium yttrium aluminum garnet; frequency-doubled output at 532 nm, pulse duration 8 ns, excitation energy 3 mJ/cm2). A three-dimensional data set is obtained with the temporal evolution of the difference spectra in the range from 1950 to 1000 cm−1.
RESULTS
pKa of D96 in N.
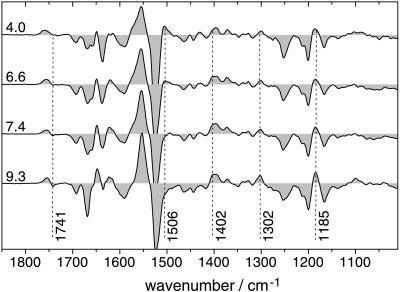
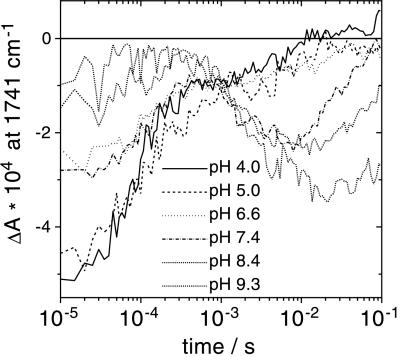
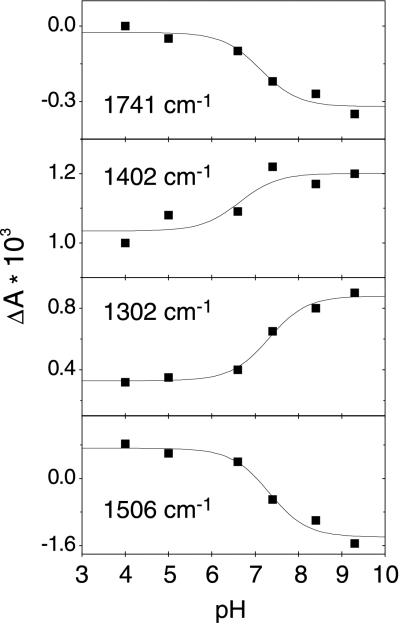
The reprotonation of the retinal Schiff base of BR is accomplished by the aspartic acid at position 96 (D96) (24, 25). This proton transfer reaction, which takes place during the M–N transition, is detectable by a negative band at 1741 cm−1 caused by the depleted C⩵O stretching vibration of the protonated D96 in the BR ground state (39). However, this band develops only at elevated pH, as can be deduced from N/O-BR difference spectra at various external pH values (Fig. 1). This is more evident when kinetic traces at 1741 cm−1 at different pH values are displayed (Fig. 2). Negative absorbance changes at the end of the photoreaction (millisecond time range) arise from the deprotonation of D96. Plotting the maximum amplitude against the pH and fitting with a function derived from the Henderson–Hasselbalch equation results in a pKa of 7.1 ± 0.2 (Fig. 3). This procedure of extracting the dissociation degree of a single amino acid side chain from time-resolved experiments yields in situ the pKa of D96 in the N intermediate. The increase in acidity renders D96 to be the suitable proton donor for the Schiff base. Absorbance changes at 1741 cm−1 in the microsecond time domain (Fig. 2) have been attributed to a frequency shift caused by environmental changes in the vicinity of D96 and of D115, respectively, during the lifetime of the L intermediate (39). The pH dependence of the amplitude directly reflects the pH-dependent L–M equilibrium. At alkaline pH, M formation is accelerated, leading to a lower transient accumulation of the L intermediate (15, 29).
Figure 1.
N/O-BR difference spectra extracted from the three-dimensional step-scan data. Experiments have been carried out at different pH values between 4.0 and 9.3. Representative difference spectra at pH 4.0, 6.0, 7.4, and 9.3 are depicted. Difference spectra are taken and averaged 7 ms (±3 ms) after the exciting laser flash. For the experiments at pH 8.4 and 9.3, difference spectra are extracted 20 ms (±10 ms) after the flash. Broken vertical lines indicate vibrational bands discussed in the text. Spectra are scaled to identical absorbancies at 1200 cm−1.
Figure 2.
Time traces of absorbance changes at 1741 cm−1. Data are from step-scan experiments at different pH values. The negative signal at late times is attributed to deprotonation of D96 during the lifetime of the N intermediate. It is a measure of the transient concentration of deprotonated D96.
Figure 3.
pH dependence of maximum amplitudes at selected wavenumbers of the N/O intermediate (compare with Fig. 1). Continuous lines are fits to the Henderson–Hasselbalch equation. Fitting the data at 1741 cm−1 (C⩵O stretch of D96) results in the transient pKa of D96 of 7.1 (±0.2), which is close to the value obtained for 1402 cm−1 (symmetric COO− stretching vibration of D96, pKa = 6.7 ± 0.4). Amplitudes of vibrational bands that are characteristic for the isomerization state of retinal are depicted in the two lower panels. Bands at 1302 and at 1506 cm−1 represent the transient accumulation of the N and O intermediates, respectively. A pKa of 7.3 (±0.1) is calculated for both of the data sets.
Concomitantly with depletion of the C⩵O stretch of D96 in N, positive bands caused by the symmetric and asymmetric COO− stretching vibration are expected. However, assignment of these carboxylate stretches is hampered by the fact that overlap with other bands is strong at the frequencies of these vibrations. Fig. 1 shows that the band feature around 1400 cm−1 is composed of (at least) two bands. It is known that the coupled vibration of the C15—H and N—H in-plane bending modes of the 13-cis chromophore has absorption at 1395 cm−1 (40). The only band that exhibits pH-dependent behavior in this spectral region is the shoulder at 1402 cm−1 when scaled with the band at 1395 cm−1 which is present in N as well as in O. A titration curve with a pKa of 6.7 ± 0.4 was fitted to the pH-induced change in absorbance at 1402 cm−1 (Fig. 3). Considering the small amplitude, this value is close to the result derived for the band at 1741 cm−1. Therefore, we favor the assignment of the symmetric carboxylic vibration of D96 to the shoulder at 1402 cm−1. This result confirms the assignment obtained by 13C labeling of BR (41).
Transient absorbance changes at typical wavenumbers for the N and O intermediates, respectively, can be analogously evaluated. Fig. 3 presents the pH dependence of the amplitudes at 1302 cm−1 [coupled C15—H and N—H in-plane vibration of retinal in N (40)] and 1506 cm−1 [C⩵C of retinal in O (15, 42)], respectively. In this way, a pKa of 7.3 ± 0.1 is calculated for the N–O equilibrium. This number agrees well with the pKa of D96 in N and is confirmed by visible spectroscopy on the pH dependence of the O intermediate (31).
pH Dependence of the M State.
Early proton release from BR occurs during the transition from the L to the M intermediate. Because D85, the primary acceptor of the Schiff base proton, stays protonated until the latest stage of the photocycle, the proton must be released from another site. This group is expected to transiently lower its pKa from 9 down to 5.8 (19). This scenario of pKa shuffling is supposed to be similar to the reprotonation reaction of the Schiff base by D96. However, the terminal proton release group has not been unambiguously identified yet. Because the amplitude of the band might be small we used the variation of external pH as an additional criterion. The rationale is that a difference band from the proton release group is expected to appear at pH > pKa. Below this pH no such band should be detectable in the M intermediate.
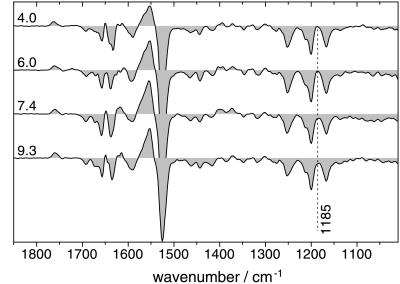
Time-resolved ATR/FT-IR experiments have been performed at seven different pH values between 4.0 and 9.3. Fig. 4 displays representative M-BR difference spectra obtained at pH 4.0, 6.0, 7.4, and 9.3 (from top to bottom). Overall, spectra look quite similar, demonstrating that the identical photoproduct is observed. However, small but distinct differences are discernible. At 1185 cm−1 (broken line in Fig. 4) the absorption is less of the M intermediate than of the unphotolyzed state, whereas the L, N, and O intermediates exhibit positive absorption at this position. The minimum at 1185 cm−1 in the high-pH difference spectrum demonstrates that there are only few if any contributions of other intermediates to the M-BR difference (15). In the spectrum at pH 4, the absorbance difference around 1185 cm−1 is close to zero, indicating that small amounts of a 13-cis intermediate with protonated Schiff base are present, most probably from the L intermediate.
Figure 4.
Representative M-BR difference spectra from time-resolved measurements at various pH values. Spectra have been extracted from step-scan data at a mean time of 400 μs (±100 μs) after the laser flash—i.e., at a time where the transient M concentration is at maximum. The time of maximum M concentration is almost invariant to the pH within the pH range under study (see figure 1 in ref. 15). The absorption difference at 1185 cm−1 indicates the purity of the M state (see text). Spectra have been scaled to equal intensity at 1525 cm−1 and 1200 cm−1 (C⩵C and C—C stretch of ground-state retinal).
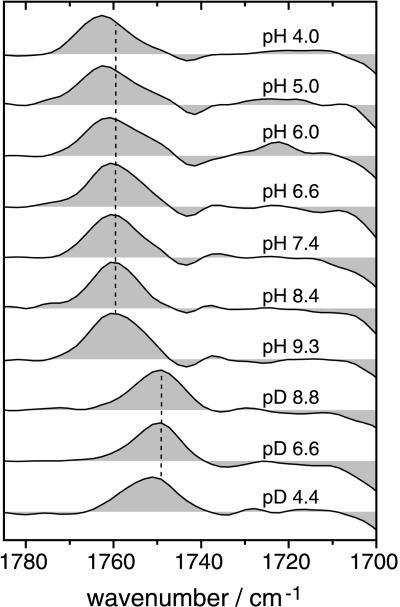
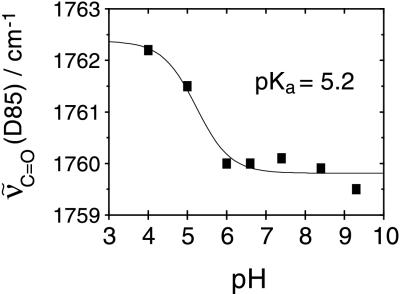
A close-up of the frequency range where the C⩵O stretching vibration of aspartic and glutamic acids absorbs (upper spectra in Fig. 5) exhibits a band pattern due to the protonation of D85 in M [large positive band around 1762 cm−1 (+)] and due to an environmental change in the vicinity of D115 [1743 cm−1 (−) and 1737 cm−1 (+)]. On increasing the external pH from 4 to 9.3 the C⩵O stretching vibration of D85 is shifted from 1762 cm−1 to 1760 cm−1 (broken line). In D2O, the frequency of the C⩵O stretch of D85 is 12 cm−1 lower than in H2O (lower spectra in Fig. 5). Yet the difference in band position of about 2 cm−1 between acidic and alkaline pD is preserved upon H/D exchange. The midpoint of the pH-induced frequency shift of the C⩵O stretch of D85 is at 5.2 ± 0.3 in H2O (Fig. 6). Since the frequency of the C⩵O stretching vibration is a relative measure for the acidity of the respective group (43), the pKa of D85 in M is lowered by raising the external pH above 5.2 (in 1 M KCl). This drop in pKa is a direct consequence of the titration of a yet-unidentified group that interacts with D85 in M. It might reflect the deprotonation of the proton-release group. If the proton-release group is an acidic amino acid side chain, then the C⩵O stretching vibration of the presumed aspartic or glutamic acid should appear as a negative band in the M-BR difference spectra. However, at pH > 5.2 no such additional band is detectable (Fig. 5). This is particularly obvious when comparing with spectra at pH < 5.2. It is straightforward to conclude from these experiments that there are no detectable protonation changes of other carboxylic residues during the lifetime of the M intermediate besides D85. Although difference bands might be small and masked by other bands, the applied change in external pH should reveal bands from groups that are shifted in pKa during the photocycle.
Figure 5.
M-BR difference spectra in the carbonyl region. Experiments were performed in H2O (upper seven spectra) and in 2H2O (D2O; lower three spectra) at the indicated pH and pD, respectively. The dotted vertical line indicates that the C⩵O stretching vibration of D85 is shifted to higher wavenumbers at acidic pH as compared with neutral and alkaline pH. The corresponding band at pD 4.4 is analogously shifted.
Figure 6.
Dependence of the frequency of the C=O stretch of D85 in the M state on external pH. The midpoint of the frequency shift is at 5.2 (±0.3). Frequencies of band maxima have been calculated by fitting a Gaussian to the bands at the respective pH (cf. Fig. 5). The full width at half maximum of the band (12 ± 0.6 cm−1) is invariant to the external pH.
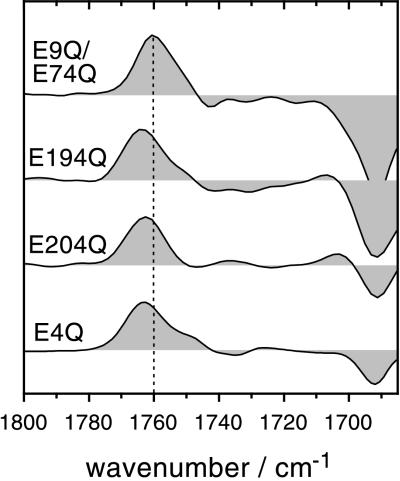
To further support this finding, each of the glutamates at the extracellular side of BR has been conservatively changed to the nonprotonatable glutamine. There are no aspartates at the extracellular surface of BR. Fig. 7 depicts time-resolved M-BR difference spectra of the carbonyl region of the single-site mutants E194Q and E204Q, the double mutant E9Q/E74Q, and the quadruple mutant E9Q/E74Q/E194Q/E204Q (E4Q). It is obvious that none of the mutants exhibit significant deviation from the wild-type difference spectra (compare with Fig. 5). The broad negative absorption in the range of 1745–1710 cm−1 in the spectrum of the E194Q mutant is within noise and will not be discussed. The only significant difference among the displayed spectra is the negative band at 1692 cm−1 that is less pronounced in the E204Q and the quadruple mutant. We concluded in a previous study that the deviation from the wild type can be ascribed to an interaction of the side chain of E204 with the protein backbone (15). Detailed inspection of Fig. 7 reveals that in the E204Q as well as in the E194Q mutant the C⩵O stretch of D85 absorbs at 1762 cm−1 (pH 7.4). The frequency corresponds to the wild-type protein if the pH is below 5.2–i.e., when late proton release occurs. This confirms the above finding that late proton release is always accompanied by an elevated pKa of D85. As a matter of fact, replacing E194 or E204 with Q alters the frequency of the C⩵O stretch of D85, pointing toward a long-range interaction of these residues during the M state. In the M-BR spectrum of the double mutant E9Q/E74Q, however, the C⩵O stretch peaks at 1760 cm−1–i.e., identical to the wild type. This corroborates the finding that the kinetics of the photocycle, as determined both in the infrared and in the visible wavelength range (data not shown), are identical to those in the wild type. Proton release into the surrounding bulk water phase as detected with the pH indicator pyranine (17), is also indistinguishable from the wild-type BR (not shown). All of these experiments provide sufficient evidence to rule out any participation of E9 as well as of E74 in the proton transfer reactions of BR. The difference spectrum of the quadruple mutant E9Q/E74Q/E194Q/E204Q (E4Q in Fig. 7) was recorded under continuous illumination at low temperature. Step-scan experiments are impractical because of the very long photocycle observed with this mutant. The quadruple mutant exhibits spectral features very similar to those of the single-site mutant E204Q—i.e., besides the frequency shift of the C⩵O stretch of D85 and the smaller amide I difference band at 1692 cm−1, there are no other significant changes observable.
Figure 7.
Carbonyl region of M-BR difference spectra at pH 7.4 of the double mutant E9Q/E74Q and the single-site mutants E194Q and E204Q. As in the wild-type experiments (Fig. 4), M-BR difference spectra have been extracted from time-resolved experiments at 400 μs after the flash. The bottom spectrum is a steady-state M-BR difference spectrum of the quadruple mutant E9Q/E74Q/E194Q/E204Q (E4Q) taken at −18°C, pH 7, under continuous illumination with yellow light and the dark state as reference.
DISCUSSION
Infrared spectroscopy is a very sensitive tool to detect changes in the protonation state of amino acid side chains. Determination of the pKa of a particular residue in the resting state of a protein can be accomplished by steady-state pH titration with the ATR technique (44). Moreover, protonation changes of single amino acids can be monitored by IR spectroscopy even on fast time scales. In the present study we have integrated these two advantages to quantify the change in acidity of a single residue of a proton pump.
Change of the pKa of D96.
Time-resolved ATR/FT-IR experiments at different pH values allowed in situ determination of the change in pKa of an essential amino acid of the proton transfer cascade of BR. The pKa of D96, the internal proton donor of the retinal Schiff base, appears to be at 7.1 ± 0.2 during the lifetime of the N intermediate. However, since the existence of a protonation equilibrium between D96 and the cytoplasmic bulk solution has not been fully established on a 7-ms time scale, it is quite possible that the true pKa is somewhat higher than 7.1 because of rate-limiting reprotonation. In the unphotolyzed state the pKa of D96 is at 11.4 (44) or >12 (C.Z. and J.H., unpublished results). Hence, the apparent decrease in proton affinity of D96 by about 4 pH units corresponds to an energy of more than 23 kJ/mol.
All of the available structural models of the ground state of BR (23, 28, 45–47) suggest that the reason for the exceptionally high pKa is the very hydrophobic vicinity of D96. It is surrounded by a leucine barrel (L95, L97, L100, and L223) with two phenylalanines (F42 and F219) covering the barrel. The limited solvent accessibility is probably caused by F42, which shields D96 from the cytoplasmic surface. Structural changes, such as slight kinking or tilting of one or more helices during protein activity (48–50), may allow water to diffuse into this part of the protein. In agreement, the largest changes in the amide bands are observed during the N state (15, 40). The penetrating water molecules might hydrate the COOH group and thereby lower the pKa of D96. The transient movement of charges or potential hydrogen-binding partners into the vicinity of D96 evoked by the aforementioned structural changes of the protein backbone can also account for the large drop in pKa. A substantial influence of the Schiff base on the deprotonation reaction of D96 in wild-type BR can be excluded by considering experiments on the D212N mutant (37). There, deprotonation of D96 takes place despite the fact that the Schiff base is protonated throughout the photoreaction.‖ Nevertheless, in the N intermediate of the wild type the pKa of the Schiff base has to be higher than that of D96 to represent an efficient proton acceptor.
The coincidence of the pKa of D96 in N and the pH dependence of the N–O equilibrium (Fig. 3) suggests that the protonation state of D96 controls the N-to-O transition. The decay of the N state is fast as long as the pH is lower than the pKa of D96 in N because reprotonation of D96 from the bulk aqueous medium is not hampered. At higher pH values the reprotonation kinetics of D96 depend on the proton concentration. If the reprotonation reaction of D96 limits N decay, the lifetime of N should increase with increasing pH, which is indeed observed. Assuming that the time constant of the O decay is about the same at neutral and high pH, the lifetime of N exceeds that of the O intermediate at alkaline pH and hence only the N state is observed (15). There is no evidence for an increase of the lifetime of O with increasing pH. In contrast, it is plausible that O decay is slow at low pH because the proton-release group is protonated at pH < 5.2—i.e., the acceptor site of the proton from D85 is occupied. Nevertheless, this is not expected to block proton transfer from D85 to the extracellular medium. However, this effect may be less temperature dependent than the events occurring in the N-to-O reaction (reprotonation of D96, reset of the change of the protein tertiary structure, reisomerization of retinal to all-trans). Therefore, at elevated temperatures decay of N is stronger accelerated than the O-to-BR reaction and the transient concentration of O is higher at elevated temperatures as observed by time-resolved ATR/FT-IR spectroscopy (15).
Proton Release.
Proton release to the extracellular membrane surface is initiated by proton transfer from the Schiff base to D85. This acid/base reaction occurs during the L-to-M transition. Protonation of D85 is observable by the appearance of the C⩵O stretching vibration absorbing at 1760 cm−1. The concomitant depletion of the COO− vibration of D85 is not detectable at low and medium pH because of strong spectral overlap with mainly in-plane vibrations of intermediates with protonated 13-cis-retinal—i.e., the L and the N intermediate. At high pH values, however, a pure M state transiently accumulates (15) and the kinetics of the depletion of the symmetric carboxylate stretch can be determined. Only at 1385 cm−1 does the time constant for the protonation tally with that at 1760 cm−1 (data not shown). By these means, we are able to confirm the assignment by Fahmy et al. (51) that the symmetric COO− stretch of D85 absorbs at 1385 cm−1.
According to the model of Govindjee et al. (35) the proton release group has a high pKa in the ground-state BR that drops to 5.8 when the M state is established. Comparison of the time-resolved M-BR spectra at various pH values revealed, however, that the only apparent difference is a shift of the frequency of the C⩵O stretch of D85. It is at 1762 cm−1 at acidic pH and at 1760 cm−1 at neutral and alkaline pH. The pKa of this 2-cm−1 shift is calculated to be at 5.2 ± 0.3. This shift is smaller than the downshift to 1755 cm−1 during the subsequent transition to the intermediates N and O, respectively. Nevertheless, it is well reproducible, and spectral contributions from other intermediates can be ruled out because bands above 1755 cm−1 do not appear in L, N, or O (15).
The up-shifted frequency is indicative for a slight decrease in the dielectric constant of the environment of D85 at low pH (43). Obviously, a group is titrated that interacts with D85 either directly or indirectly via an induced change in protein conformation. Good candidates for this group are E194 and E204, which were proposed to be members of the proton-release chain (18, 22). In fact, in M-BR difference spectra of the E194Q and E204Q mutants, the C⩵O stretch of D85 peaks at 1762 cm−1 at pH 7—i.e., at the same frequency as wild-type BR at pH < 5.2. This corroborates with late proton release in these mutants as well as in the wild type at low pH. The transition from early to late proton release was determined to be 5.8 at an ionic strength of 0.15 M (19). This finding is in accord with the transition of the frequency shift of the C⩵O stretch of D85 because we have used a much higher salt concentration (1 M KCl) that compensates for surface charge effects. In other words, the frequency of the C⩵O stretch of D85 is an indicator for early and late proton release, respectively. The frequency shift of the C⩵O stretching vibration is evidence for a long-range interaction of D85 with E194 as well as with E204. Both of the glutamates are located close to the extracellular membrane surface. According to the structural models (23, 45–47), the distance from D85 to E194 and E204 is in the order of 13–16 Å. Such a long-range interaction is not uncommon in energy-transducing proteins. For example, it was also observed in the photosynthetic reaction center, where QA− and E212 interact electrostatically over a distance of 17 Å (4).
Deprotonation of the proton release group of BR in the L-to-M transition will result in vibrational bands due to this group in the M-BR difference spectrum. At pH values below 5, proton release is delayed to the latest stages of the photocycle and the temporal sequence of proton release and uptake is reversed (33, 34). Therefore, comparison of M-BR differences at pH values below and above 6 should lead to identification of the bands of the proton-release group. However, no changes in the carbonyl region are observed (Fig. 5). Brown et al. (18) suggested that a small negative band in the M-BR difference spectrum at 1700 cm−1 in H2O (which is shifted to 1690 cm−1 in D2O) is caused by the deprotonation of E204. Although our data provide sufficient signal-to-noise ratio, a difference band at 1700 cm−1 is not detectable even though spectra below and above the pKa of the proton release group are compared.
Comparing wild-type M-BR difference spectra with those of the point mutants E194Q and E204Q also did not show any changes in the band pattern of the carbonyl region (Fig. 7). We conclude that either none of these residues represent the terminal proton-release group or the terminal proton-release group is very rapidly reprotonated from another site. This can be accomplished by a dyad comprising E194 and E204, where the proton to be released is shared between these residues (47). Water molecules, which have been included into the structural models (23, 46), are also good candidates for the terminal proton-release group. Nevertheless, both E194 and E204 do play an important role in the proton-release cascade, which is exemplified by the delayed proton release in the E194Q mutant as well as in E204Q (21, 22). We agree with Rammelsberg et al. (20) that the time-resolved FT-IR difference spectra give no evidence for a change in the carboxylic vibrations of E204 during the L-to-M reaction. With the presented data we can now extend this argument to E194. Besides E194 and E204, the only acidic amino acids along the extracellular surface of BR are E9 and E74. The double mutant E9Q/E74Q exhibits an M-BR difference spectrum that is identical to the wild type (Fig. 7). Since the kinetics of photo- and proton-cycle are also not altered, these two residues are definitely excluded from representing the terminal proton-release site.
Although a definite conclusion has not been reached, we favor the interpretation of Rammelsberg et al. (20) that proton release occurs from a hydrogen-bonded network. Our results point to the participation of both E194 and E204 in the extracellular hydrogen-bonded network but exclude E9 and E74.
Acknowledgments
C.Z., R.S., and J.H. are indebted to Dr. G. Büldt for his continuous support and interest in this work. R.S. appreciates the generous gift of the shuttle vector pXL NovR from Dr. R. Needleman (Wayne State University, Detroit). This work was supported by the Deutsche Forschungsgemeinschaft (SFB 189/C6 to J.H.).
ABBREVIATIONS
- BR
bacteriorhodopsin
- FT-IR
Fourier-transform infrared, ATR, attenuated total reflection
- pKa
negative log10 of the acidity constant
Footnotes
This paper was submitted directly (Track II) to the Proceedings Office.
The term “apparent pKa” accounts for the influence of the protein on the intrinsic pKa of a protonatable group. This thermodynamic parameter refers to that pH in the external solution where 50% of the respective molecules are ionized. The apparent pKa might differ widely from the intrinsic pKa, which is usually defined for an aqueous solution. For the sake of simplicity, we will omit the term “apparent” in the following.
Contrary to the wild type, the proton of D96 is released into the cytoplasm in the D212N mutant (37).
References
- 1.Fillingame R H. J Exp Biol. 1997;200:217–224. doi: 10.1242/jeb.200.2.217. [DOI] [PubMed] [Google Scholar]
- 2.Kaback H R. Proc Natl Acad Sci USA. 1997;94:5539–5543. doi: 10.1073/pnas.94.11.5539. [DOI] [PMC free article] [PubMed] [Google Scholar]
- 3.Phelps A, Briggs C, Mincone L, Wohlrab H. Biochemistry. 1996;35:10757–10762. doi: 10.1021/bi961052x. [DOI] [PubMed] [Google Scholar]
- 4.Maróti P, Hanson D K, Schiffer M, Sebban P. Nat Struct Biol. 1995;12:1057–1059. doi: 10.1038/nsb1295-1057. [DOI] [PubMed] [Google Scholar]
- 5.Hallén S, Brzezinski P, Malmström B G. Biochemistry. 1994;33:1467–1472. doi: 10.1021/bi00172a024. [DOI] [PubMed] [Google Scholar]
- 6.Sakmar T, Fahmy K. Israel J Chem. 1995;35:325–337. [Google Scholar]
- 7.Lanyi J K. J Biol Chem. 1997;272:31209–31212. doi: 10.1074/jbc.272.50.31209. [DOI] [PubMed] [Google Scholar]
- 8.Bashford D, Gerwert K. J Mol Biol. 1992;223:473–486. doi: 10.1016/0022-2836(92)91009-e. [DOI] [PubMed] [Google Scholar]
- 9.Scharnagl C, Hettenkofer J, Fischer S F. J Phys Chem. 1995;99:7787–7800. [Google Scholar]
- 10.Lancaster C R D, Michel H, Honig B, Gunner M R. Biophys J. 1996;70:2469–2492. doi: 10.1016/S0006-3495(96)79820-X. [DOI] [PMC free article] [PubMed] [Google Scholar]
- 11.Sandberg L, Edholm O. Biophys Chem. 1997;65:189–204. doi: 10.1016/s0301-4622(96)02262-4. [DOI] [PubMed] [Google Scholar]
- 12.Siebert F. Methods Enzymol. 1995;246:501–526. doi: 10.1016/0076-6879(95)46022-5. [DOI] [PubMed] [Google Scholar]
- 13.Maeda A. Israel J Chem. 1995;35:387–400. [Google Scholar]
- 14.Heberle J, Zscherp C. Appl Spectrosc. 1996;50:588–596. [Google Scholar]
- 15.Zscherp C, Heberle J. J Phys Chem B. 1997;101:10542–10547. [Google Scholar]
- 16.Braiman M S, Mogi T, Marti T, Stern L J, Khorana H G, Rothschild K J. Biochemistry. 1988;27:8516–8520. doi: 10.1021/bi00423a002. [DOI] [PubMed] [Google Scholar]
- 17.Heberle J, Dencher N A. Proc Natl Acad Sci USA. 1992;89:5996–6000. doi: 10.1073/pnas.89.13.5996. [DOI] [PMC free article] [PubMed] [Google Scholar]
- 18.Brown L S, Maeda A, Kandori H, Needleman R, Lanyi J K. J Biol Chem. 1995;270:27122–27126. doi: 10.1074/jbc.270.45.27122. [DOI] [PubMed] [Google Scholar]
- 19.Zimányi L, Váró G, Chang M, Ni B, Needleman R, Lanyi J K. Biochemistry. 1992;31:8535–8543. doi: 10.1021/bi00151a022. [DOI] [PubMed] [Google Scholar]
- 20.Rammelsberg R, Huhn G, Lübben M, Gerwert K. Biochemistry. 1998;37:5001–5009. doi: 10.1021/bi971701k. [DOI] [PubMed] [Google Scholar]
- 21.Balashov S P, Imasheva E S, Ebrey T G, Chen N, Menick D R, Crouch R K. Biochemistry. 1997;36:8671–8676. doi: 10.1021/bi970744y. [DOI] [PubMed] [Google Scholar]
- 22.Dioumaev A K, Richter H-T, Brown L S, Tanio M, Tuzi S, Saitô H, Kimura Y, Needleman R, Lanyi J K. Biochemistry. 1998;37:2496–2506. doi: 10.1021/bi971842m. [DOI] [PubMed] [Google Scholar]
- 23.Pebay-Peyroula E, Rummel G, Rosenbusch J P, Landau E M. Science. 1997;277:1676–1681. doi: 10.1126/science.277.5332.1676. [DOI] [PubMed] [Google Scholar]
- 24.Butt H J, Fendler K, Bamberg E, Tittor J, Oesterhelt D. EMBO J. 1989;8:1657–1663. doi: 10.1002/j.1460-2075.1989.tb03556.x. [DOI] [PMC free article] [PubMed] [Google Scholar]
- 25.Gerwert K, Souvignier G, Hess B. Proc Natl Acad Sci USA. 1990;87:9774–9778. doi: 10.1073/pnas.87.24.9774. [DOI] [PMC free article] [PubMed] [Google Scholar]
- 26.Riesle J, Oesterhelt D, Dencher N A, Heberle J. Biochemistry. 1996;35:6635–6643. doi: 10.1021/bi9600456. [DOI] [PubMed] [Google Scholar]
- 27.Nachliel E, Gutman M, Kiryati S, Dencher N A. Proc Natl Acad Sci USA. 1996;93:10747–10752. doi: 10.1073/pnas.93.20.10747. [DOI] [PMC free article] [PubMed] [Google Scholar]
- 28.Kimura Y, Vassylyev D G, Miyazawa A, Kidera A, Matsushima M, Mitsuoka K, Murata K, Hirai T, Fujiyoshi Y. Nature (London) 1997;389:206–211. doi: 10.1038/38323. [DOI] [PubMed] [Google Scholar]
- 29.Balashov S P, Govindjee R, Ebrey T G. Biophys J. 1991;60:475–490. doi: 10.1016/S0006-3495(91)82074-4. [DOI] [PMC free article] [PubMed] [Google Scholar]
- 30.Ames J B, Mathies R A. Biochemistry. 1990;29:7181–7190. doi: 10.1021/bi00483a005. [DOI] [PubMed] [Google Scholar]
- 31.Eisfeld W, Pusch C, Diller R, Lohrmann R, Stockburger M. Biochemistry. 1993;32:7196–7215. doi: 10.1021/bi00079a017. [DOI] [PubMed] [Google Scholar]
- 32.Fukuda K, Kouyama T. Biochemistry. 1992;31:11740–11747. doi: 10.1021/bi00162a010. [DOI] [PubMed] [Google Scholar]
- 33.Dencher N A, Wilms M. Biophys Struct Mech. 1975;1:259–271. doi: 10.1007/BF00535760. [DOI] [PubMed] [Google Scholar]
- 34.Cao Y, Brown L S, Needleman R, Lanyi J K. Biochemistry. 1993;32:10239–10248. doi: 10.1021/bi00089a046. [DOI] [PubMed] [Google Scholar]
- 35.Govindjee R, Misra S, Balashov S P, Ebrey T G, Crouch R K, Menick D R. Biophys J. 1996;71:1011–1023. doi: 10.1016/S0006-3495(96)79302-5. [DOI] [PMC free article] [PubMed] [Google Scholar]
- 36.Richter H-T, Brown L S, Needleman R, Lanyi J K. Biochemistry. 1996;35:4054–4062. doi: 10.1021/bi952883q. [DOI] [PubMed] [Google Scholar]
- 37.Cao Y, Váró G, Klinger A L, Czajkowsky D M, Braiman M S, Needleman R, Lanyi J K. Biochemistry. 1993;32:1981–1990. doi: 10.1021/bi00059a015. [DOI] [PubMed] [Google Scholar]
- 38.Oesterhelt D, Stoeckenius W. Methods Enzymol. 1974;31:667–686. doi: 10.1016/0076-6879(74)31072-5. [DOI] [PubMed] [Google Scholar]
- 39.Gerwert K, Hess B, Soppa J, Oesterhelt D. Proc Natl Acad Sci USA. 1989;86:4943–4947. doi: 10.1073/pnas.86.13.4943. [DOI] [PMC free article] [PubMed] [Google Scholar]
- 40.Pfefferlé J M, Maeda A, Sasaki J, Yoshizawa T. Biochemistry. 1991;30:6548–6556. doi: 10.1021/bi00240a027. [DOI] [PubMed] [Google Scholar]
- 41.Maeda A, Sasaki J, Shichida Y, Yoshizawa T, Chang M, Ni B, Needleman R, Lanyi J K. Biochemistry. 1992;31:4684–4690. doi: 10.1021/bi00134a022. [DOI] [PubMed] [Google Scholar]
- 42.Smith S O, Pardoen J A, Mulder P P, Curry B, Lugtenburg J, Mathies R A. Biochemistry. 1983;22:6141–6148. [Google Scholar]
- 43.Braiman M S, Dioumaev A K, Lewis J R. Biophys J. 1996;70:939–947. doi: 10.1016/S0006-3495(96)79637-6. [DOI] [PMC free article] [PubMed] [Google Scholar]
- 44.Száraz S, Oesterhelt D, Ormos P. Biophys J. 1994;67:1706–1712. doi: 10.1016/S0006-3495(94)80644-7. [DOI] [PMC free article] [PubMed] [Google Scholar]
- 45.Grigorieff N, Ceska T A, Downing K H, Baldwin J M, Henderson R. J Mol Biol. 1996;259:393–421. doi: 10.1006/jmbi.1996.0328. [DOI] [PubMed] [Google Scholar]
- 46.Luecke H, Richter H-T, Lanyi J K. Science. 1998;280:1934–1937. doi: 10.1126/science.280.5371.1934. [DOI] [PubMed] [Google Scholar]
- 47.Essen L-O, Siegert R, Lehmann W D, Oesterhelt D. Proc Natl Acad Sci USA. 1998;95:11673–11678. doi: 10.1073/pnas.95.20.11673. [DOI] [PMC free article] [PubMed] [Google Scholar]
- 48.Dencher N A, Dresselhaus D, Zaccai G, Büldt G. Proc Natl Acad Sci USA. 1989;86:7876–7879. doi: 10.1073/pnas.86.20.7876. [DOI] [PMC free article] [PubMed] [Google Scholar]
- 49.Koch M H J, Dencher N A, Oesterhelt D, Plöhn H-J, Rapp G, Büldt G. EMBO J. 1991;10:521–526. doi: 10.1002/j.1460-2075.1991.tb07978.x. [DOI] [PMC free article] [PubMed] [Google Scholar]
- 50.Subramaniam S, Gerstein M, Oesterhelt D, Henderson R. EMBO J. 1993;12:1–8. doi: 10.1002/j.1460-2075.1993.tb05625.x. [DOI] [PMC free article] [PubMed] [Google Scholar]
- 51.Fahmy K, Weidlich O, Engelhard M, Sigrist H, Siebert F. Biochemistry. 1993;32:5862–5869. doi: 10.1021/bi00073a020. [DOI] [PubMed] [Google Scholar]


