

Abstract
Trace amines such as tyramine, octopamine and β-phenylethylamine bind with high affinity to the mammalian trace amine-associated receptor 1 (Taar1), potentially activating G-proteins in the synaptic membranes of target neurons. Recently there has been significant interest in Taar1, since this receptor can bind certain psychoactive drugs of abuse such as Ecstasy (3,4-methylenedioxymethamphetamine). Surprisingly, Ecstasy has been shown to alter responses of immune cells, and we questioned whether Taar receptors might be responsible for this effect. Using sensitive and quantitative RT-PCR assays, we found no detectable expression of Taar mRNA in bone marrow, or in primary cultures of mouse macrophages and dendritic cells whether quiscent or activated by exposure to lipopolysaccharide or the mouse gammaherpesvirus-68 (γHV-68). Mouse B cells and NK cells isolated from spleen, however, showed expression of several Taar mRNA species. Taar mRNA expression was also upregulated in human peripheral blood lymphocytes following in vitro stimulation with PHA. These studies represent the first to define expression of the mRNAs encoding these trace amine receptors in leukocytes.
Keywords: trace amine-associated receptor; 3,4-methylenedioxymethamphetamine; Ecstasy; mouse bone marrow; mouse macrophage; mouse dendritic cell; mouse B cell; human peripheral blood lymphocyte
1. Introduction
Trace amines such as tyramine, octopamine and β-phenylethylamine are present at low concentrations in the mammalian central nervous system (Berry, 2004; Branchek and Blackburn, 2003; Burchett and Hicks, 2006; Lindemann and Hoener, 2005; Premont et al., 2001) and in peripheral tissues (Zucchi et al., 2006), and bind with high affinity to Taar1 (Borowsky et al., 2001; Bunzow et al., 2001), a member of the trace amine-associated receptor (Taar) family of genes and proteins (Lindemann et al., 2005; Lindemann and Hoener, 2005). Binding to the receptor is thought to activate G-proteins in the synaptic membranes of target neurons, and when expressed in HEK293 cells, a variety of drugs, including Ecstasy (3,4-methylenedioxymethamphetamine), stimulate the production of cAMP. Ecstasy’s EC50 of 1.7 μM (Bunzow et al., 2001) suggests that the typical micromolar serum levels reached by drug abusers could activate cells expressing the Taar1 protein, providing a mechanism for the direct action of Ecstasy on cells and tissues.
While Ecstasy abuse has been shown to affect immune responses (Connor, 2004), the exact mechanisms responsible for such effects are not altogether clear. This lack of understanding has limited our ability to define targets of immunomodulation for this drug of abuse. Teenagers and young adults are the age group most likely to abuse Ecstasy (Landry, 2002), as this drug leads to elevated moods, extroversion, and enhancement of sensual experiences (Downing, 1986; Freese et al., 2002). Thus the use of Ecstasy at parties and “raves” appears to promote close-contact behaviors between individuals (Freese et al., 2002; Gahlinger, 2004; Ropero-Miller and Goldberger, 1998; Smith et al., 2002). Such behaviors, by themselves, would appear to increase transmission of a variety of infectious diseases. However if Ecstasy abuse also limits a protective immune response, then such infections might be more numerous or more severe in these teenagers and young adults. It is difficult to make such inferences without a more defined understanding of the mechanisms by which Ecstasy can alter immunity to microbial infections.
The high affinity of Ecstasy for binding to Taar1 (Bunzow et al., 2001) makes this receptor an attractive candidate for mediating the immunomodulatory effects of this drug of abuse. In fact, Taar1 mRNA has been reported to be expressed in a variety of peripheral tissues including liver, kidney, spleen, pancreas, heart and the gastrointestinal tract (Bunzow et al., 2001). Unfortunately, there have been no studies to determine whether Taar1, or any Taar proteins, are expressed within leukocyte subpopulations. We initiated this study to clearly define Taar mRNA expression in cultured macrophages and dendritic cells, prior to, and during pathogen activation. Although we were unable to detect Taar mRNA expression in macrophages or dendritic cells, an extension of this study demonstrated that mouse B lymphocytes and NK cells express Taar mRNAs. Taar mRNA expression was also upregulated in human peripheral blood lymphocytes following in vitro stimulation with PHA. These studies represent the first to define expression of the mRNAs encoding these trace amine receptors in leukocytes.
2. Materials and methods
2.1 Mice
Six to eight week old female C57BL/6 mice (18–22 g) were purchased from Jackson Laboratories (Bar Harbor, ME) and housed in filter top cages containing sterile bedding. Mice were fed chow and water ad libitum and housed for at least five days after arrival before being used.
2.2 Isolation of bone marrow cells
Mice were anesthetized with isoflurane and sacrificed by cervical dislocation. Bone marrow cells were isolated by flushing femurs with RPMI 1640 tissue culture medium supplemented with 10% heat-inactivated and filtered FBS, 25 mM HEPES, 4.5 g/L glucose, 1 mM Na pyruvate, 2 g/l NaHCO3, 50 μM 2-mercaptoethanol, 25 μg/ml gentamycin, with the addition of either G-CSF or GM-CSF. After suspension of BM cells by pipetting, bone matrix was allowed to settle to the bottom of a 50 ml conical tube and the pellet discarded. 10 ml aliquots of bone marrow cells were plated into T-25 flasks and incubated in a 5% CO2 incubator at 37° C. Bone marrow cells from one mouse were typically plated into 8 T-25 flasks.
2.3 Generation of bone marrow-derived macrophages
Bone marrow-derived macrophages were matured in M-CSF containing medium as previously described (Bowman and Bost, 2004; Elsawa and Bost, 2004). Cell culture medium was supplemented with 25% LADMAC cell-conditioned medium as a source of M-CSF (Sklar et al., 1985). After 2 days in culture additional supplemented medium was added and differentiation and proliferation continued for 3 more days. After 5 days, medium and nonadherent cells were discarded and fresh, supplemented medium added to the adherent macrophages. Virtually all cells were CD11b+ (Nelson et al., 2004) and ready for experiments after culturing for 7 days.
2.4 Generation of bone marrow-derived dendritic cells
Bone marrow-derived dendritic cells were generated as previously described (Bowman and Bost, 2004; Inaba et al., 1992; Scheicher et al., 1992). Briefly, medium was supplemented with 5 ng/ml murine rGM-CSF (BD Pharmingen, San Diego, CA) and after 3 days incubation, an additional 10 ml of medium was added per T-25 flask and the incubation continued for 3 more days. After 6 days, nonadherent GM-CSF-stimulated cells were pelleted at 1000 x g for 5 min and resuspended in fresh medium containing GM-CSF. Cells were plated at a density of ~1 x 10⁶ cells per well, or T-flask, and experiments initiated after 24 hr. As described previously, the bulk of the cells at day 7 appear phenotypically as dendritic cells, and are ~75 % CD11c positive (Nelson et al., 2004).
2.5 Macrophage and dendritic cell activation
Cells were incubated with either 300 ng/ml Salmonella typhimurium lipopolysaccharide (LPS; Sigma Chemical Co., St. Louis MO), or with a 1:1 ratio (virion to cell) of mouse γ-herpes virus-68 (γHV-68) as described in previous publications (Bowman and Bost, 2004; Elsawa and Bost, 2004; Gasper-Smith et al., 2006a; Gasper-Smith et al., 2006b).
2.6 MACS separation of mouse leukocyte subpopulations
Single cell suspensions of mouse spleen cells were prepared by pressing spleen through a 30-gauge wire mesh, followed by lysis of of the red blood cells (Red Blood Cell Lysing Buffer; Sigma-Aldrich, St. Louis, MO). T, B and NK cells were isolated by positive selection using anti-CD4+/CD8a+, anti-B220 and anti-CD49b MicroBeads, respectively, as described previously (Elsawa and Bost, 2004; Marriott et al., 1999). Briefly, cells were incubated at 4 °C for 30 min with the appropriate antibody conjugated MicroBead (Miltenyi Biotech, Auburn, CA), followed by passage over a column positioned in a Vario MACS magnet (Miltenyi Biotech). Columns were washed with RPMI medium and cells retained on the column were removed by flushing with media once the column had been removed from the magnetic field. These cells were then pelleted by centrifugation at 1000 x g for 5 min for RNA extraction. Cell types were confirmed to be greater than 95 % positive for the appropriate cell surface marker as determined by FACS analyses (data not shown).
2.7 Preparation of human peripheral blood lymphocytes
Human peripheral blood lymphocytes were prepared from heparinized whole blood using Lymphoprep (Axis-Shield, Oslo, Norway) as described by the manufacturer. Lymphocytes were washed one time with RPMI plus 1% FBS and incubated in medium plus 10% FBS for 24 hr in the presence and absence of 10 μg/ml phytohemagglutinin (PHA; Sigma-Aldrich).
2.8 Isolation of genomic DNA
Cell culture medium was removed from bone-marrow derived macrophages and replaced with 0.5 ml of phosphate-buffered saline (PBS) containing 1% SDS and 50 μg/ml Proteinase K (Sigma Chemical Co.). Lysed cells were incubated for 1 hr at 60° C, extracted 2X with saturated phenol/chloroform/isoamyl alcohol (25:24:1), the nucleic acid precipitated with 2 volumes of EtOH, and resuspended in PBS with 25 μg/ml RNase A (Sigma-Aldrich). After incubation for 30 min at 37° C, DNA was extracted 1X with phenol:chloroform:isoamyl alcohol, precipitated with 2 volumes EtOH, microfuged for 10 min at 13,000 rpm and washed with 75% EtOH. The DNA pellet was air dried and resuspended in 10 mM Tris, pH 8.0. DNA concentration was determined by absorbance at 260 nm.
The DNA wizard kit (Promega; Madison, WI) was used to isolate DNA from whole human blood.
2.9 Isolation of RNA, pancreatic DNase digestion and preparation of cDNA
Cell culture medium was removed from the adherent macrophages and replaced with 1 ml of Trizol (Invitrogen, Carlsbad, CA). After lysis, Trizol samples were stored at −80° C. For dendritic cells, suspended cells were centrifuged at 1000 x g for 5 min and the cell pellet combined with the Trizol lysed adherent dendritic cells and stored at −80° C. In addition, mouse T-, B- and NK cells, as well as milligram quantities of mouse tissues, were homogenized in 1 ml Trizol and also stored at −80° C. Samples were thawed and total RNA prepared as per the manufacturer’s instructions.
For the results shown in figure 3, mRNA was prepared using a μMACS mRNA isolation kit (Miltenyi Biotec, Auburn, CA), precipitated with EtOH and resuspended in 50μl H2O.
Figure 3. Panel A - mRNA expression of dendritic cell Taar1 in the presence and absence of DNase incubation.

RT-PCR was performed on poly A(+) RNA isolated from total dendritic cell RNA using the μMACS column kit with and without, in column, DNase digestion as recommended by the manufacturer. Taar1 expression is shown in the presence and absence of the DNase incubation. The PCR products for GAPDH are shown at the bottom of the panel. Panel B – Detection of Taar1 PCR products from low copy number genomic DNA. To illustrate the ease with which false PCR products can be obtained, the cDNA samples from the DNase treated mRNA used for the results in panel A were spiked with 8, 4, 2 and 1 copies of genomic DNA. 16 and 0 mouse genome copies are used as positive and negative controls, respectively. Results are shown as amplified products electrophoresed on ethidium bromide stained agarose gels. DNA sizes in base pairs are shown to the left of the DNA ladder. Panel C - Quantitative real time PCR and mRNA copy number in mouse macrophages and dendritic cells. Expression of Taar1 mRNA was assayed by real time PCR using the same macrophage and dendritic cell cDNA from the DNase-treated total RNA as was used to obtain the results shown in figures 2. Samples include macrophages and dendritic cells that were activated for 6 hr with LPS or γHV-68. PCR was also performed with 104 copies of mouse genomic DNA as a positive control. The results suggest that there is less than 1 copy of Taar1 mRNA per 4x10³ macrophages, or dendritic cells. The stained gel insert shows the DNA products after 45 cycles of real time PCR electrophoresed on a 4% agarose gel.
For DNase treatment, total RNA was incubated with RNase-free pancreatic DNase (RQ1 DNase, Promega, Madison, WI) as per the manufacturer’s instructions, the RNA precipitated with EtOH and resuspended in 50 μl nuclease-free H2O. mRNA was treated with DNase directly in theμMACS column as per the manufacturer’s instructions. RNA concentrations were determined with a Gene Spec III spectrophotometer (Naka Instruments, Japan) using a 10 μl cuvette. For cDNA synthesis, one μg of RNA was reverse-transcribed in the presence of random hexamers (50 ng/μl), 10 mM dNTPs, 2.5 mM MgCl2 using ImProm-II reverse transcriptase (Promega) in the buffer supplied by the manufacturer. cDNA was precipitated with one-tenth volume of 3 M sodium acetate (pH 5.2) and 3 volumes of EtOH, and resuspended in 50 μl of nuclease-free H2O.
2.10 Semiquantitative PCR and DNA product analysis
PCR was performed on cDNA to detect Taar, IL-6, ERM (Etv5) and GAPDH mRNA expression. The presence of GAPDH (high abundance mRNA) and ERM (constitutive Ets transcription factor (Monte et al., 1994); low abundance mRNA) PCR products serve as positive controls for cDNA quality. Similarly, the IL-6 PCR product serves to demonstrate macrophage, or dendritic cell activation. For the Taar genes, genomic DNA was also subjected to PCR as a positive control. Typically, 100 ng (10%) of the cDNA, or 100 ng of genomic DNA was combined with 2.5 U of Taq polymerase (Promega), 0.2 mM each dNTP, 25 pmol of each primer and PCR buffer containing 2.5 mM MgCl2 as provided by the manufacturer. Samples were cycled using 95° denaturation for 35 seconds, 60°C annealing for 75 seconds and 72°C extension for 90 seconds, with the first three cycles using extended denaturation, annealing and extension times. PCR was for 35 cycles except for glyceraldehyde 3-phosphate dehydrogenase (G3PDH, 22 cycles) and interleukin-6 (IL-6, 30 cycles). The extension time of the last cycle was for 5 min at 72°C. Forty percent of each amplified PCR product was electrophoresed on an ethidium bromide-stained 2% agarose gel and photographed under UV illumination.
PCR primer sets were designed by using either Oligo 6 primer analysis software (Molecular Biology Insights, Cascade, CO) or SciTools from IDT (Integrated DNA Technologies, Coralville, IA). Primer sets used for amplification are as follows:
Mouse primer sets
G3PDH (accession no. NM_001001303; 346 bp - spans exons 5 to 7):
Forward: 5′ - CCA TCA CCA TCT TCC AGG AGC GAG - 3′
Reverse: 5′ - ATC ACT GCC ACC CAG AAG ACT GTG - 3′
Il-6 (accession no. NM_031168; 268 bp – spans exons 3 to 5):
Forward: 5′ - GAT GCT ACC AAA CTG GAT ATA ATC - 3′
Reverse: 5′ - GGT CCT TAG CCA CTC CTT CTG TG - 3′
ERM (Etv5) (accession no. NM_023794; 351 bp – spans exons 2 to 7):
Forward: 5′ – ATG GTC CCA GGG AAA TCT CGA TCA - 3′
Reverse: 5′ – GGG AGG CTT CCT ATC GTA GGC ACA - 3′
Taar1 (accession no. NM_053205; 257 bp):
Forward: 5′ - GCT TTC ATT TCC ATT GAC CGC TAC - 3′
Reverse: 5′ - ATA GAA GGA AGT CAT GAA CGC CAG - 3′
Taar2 (accession no. NM_001007266; 386 bp):
Forward: 5′ - AAT GAA AGA TCT CTC GGC GTC C – 3′
Reverse: 5′ - AGC AGC CGC CTA ACG ACC – 3′
Taar3 (accession no. NM_001008429; 274 bp):
Forward: 5′ - CAA ATT CCA CGC GAG CTT C – 3′
Reverse: 5′ - CTT GTT GAA CGT AAG CGC ACA G – 3′
Taar4 (accession no. NM_001008499; 355 bp):
Forward: 5′ - CGT TGT CTG TGC CAT GTA CCT C – 3′
Reverse: 5′ - CAC CCG GGT CGT GAT TTG – 3′
Taar5 (accession no. NM_001009574; 377 bp):
Forward: 5′ - GAG AGC AGC CTA CAG CGT TCT G – 3′
Reverse: 5′ - GGC ACA ATG ACG GTC AAT GG – 3′
Taar6 (accession no. NM_001010828; 363 bp):
Forward: 5′ - ATG AGA ATG TGA CCG GGT CTT G – 3′
Reverse: 5′ - CCG TGA CAG CGA TGT ACC TG - 3′
Taar7a,b,d,e,f (accession nos. NM_001010829, NM_001010827, NM_001010838, NM_001010835, NM_001010839; 446 bp):
Forward: 5′ - TGT GTG GAA ACC TCC TGG TGA TGA – 3′
Reverse: 5′ - ATT CAC TGC (A/G)A(T/G) TTG ACA (C/G)CC ACC – 3′
Taar8a,b,c (accession nos. NM_001010830, NM_001010837, NM_001010840; 412 bp):
Forward: 5′ - TGC AGC TCT GCT ATG AGA ACA CGA – 3′
Reverse: 5′ - ACA GAC ACT GTG AAC TTG GTG GGA – 3′
Taar9 (accession no. NM_001010831; 192 bp):
Forward: 5′ - GCC CAT GGA GCT CTG CTA TGA G – 3′
Reverse: 5′ - GAG GCC ACC AGG AAG TTC GTA G – 3′
Human primer sets
G3PDH (accession no. NM_002046; 244 bp - spans exons 6 to 8)
Forward: 5′ - CCC ATG TTC GTC ATG GGT GTG AAC – 3′
Reverse: 5′ - AGG CAG GGA TGA TGT TCT GGA GAG – 3′
Taar1 (accession no. NM_138327; 269 bp):
Forward: 5′ - GGT CAA ATG ATG TCC GTG CTT CCC – 3′
Reverse: 5′ - GCT CAG CAT AAT GTC GGT GCT TGT G – 3′
Taar2 (accession no. NM_001033080; 252 bp):
Forward: 5′ - ATC AGA TCG GTG GAG AAC TGC TGG – 3′
Reverse: 5′ - TGC ATA GGC CTC TGA GAA GAC CAC – 3′
Taar5 (accession no. NM_003967; 326 bp):
Forward: 5′ - GCA TTC TGC TAC CAG GTG AAT GGG – 3′
Reverse: 5′ - AAG ATG GAG GTG AGG CAG AAG AGG – 3′
2.11 Absolute quantification by real time PCR
Taar1 mRNA copy number was determined by real time PCR using a Roche LightCycler for amplification and SYBR Green I for double-stranded DNA detection. Amplifications were performed in a total volume of 20 μl containing QuantiTect SYBR Green PCR Master Mix (Qiagen), primer pairs (0.5 μM), template cDNA (40 ng) and nuclease-free water. Samples were cycled 45 times, starting with an initial activation step of 15 min at 95°C, followed by denaturation for 10 sec at 95°C, annealing for 10 sec at 60°C and extension for 5 sec at 72°C. Data was acquired at 80°C for 2 sec after extension, and mouse genomic DNA was used as a standard and positive control .(3.4 x 10⁵ copies of the Taar1 gene per μg genomic DNA). The mouse primer set used for quantification is as follows:
Taar1 (159 bp):
Forward: 5′-ACT TCA TAC ACC CAC CAA CTG GCT -3′
Reverse: 5′-AGC ATG ATA TCG GTG CTG GTG TGA-3′
3. Results
3.1 No detectable Taar1 mRNA expression in mouse macrophages and dendritic cells
To assess the ability of immune cells to express Taar1 mRNA, we initially followed our standard procedures for preparing total RNA and cDNA from macrophages and dendritic cells. Figure 1 shows representative results following PCR amplification of cDNA samples using primers specific for Taar1, IL-6, and GADPH. In un-stimulated and LPS stimulated macrophage and dendritic cell cultures, Taar1 gene amplification was observed (figure 1). Control PCR reactions demonstrated the LPS-induced activation of IL-6 mRNA expression, indicating that these cultured cells responded to this stimulus as expected. In addition, similar quantities of cDNA were present in each sample as indicated by the amplification for the housekeeping gene, GAPDH.
Figure 1. Semiquantitative RT-PCR analysis of Taar1 mRNA expression in mouse macrophages and dendritic cells (no DNase).
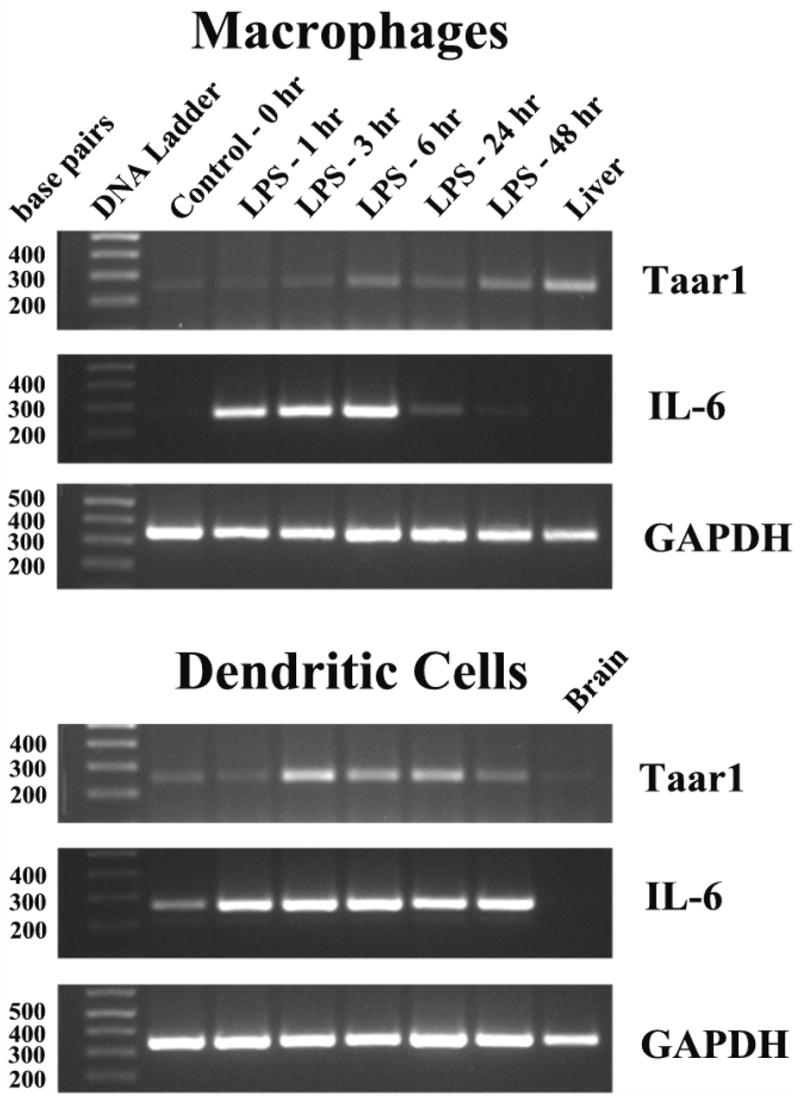
Apparent mRNA expression of Taar1 in mouse macrophages and dendritic cells during LPS activation, in the absence of DNase treatment of the total RNA. The mRNA expression of the housekeeping gene, GAPDH, is used as a positive control to indicate that similar amounts of cDNA are present in each sample. IL-6 mRNA expression is used to demonstrate cell activation. RT-PCR was performed using total RNA and the results presented as amplified products electrophoresed on ethidium bromide stained agarose gels. DNA sizes in base pairs are shown to the left of the DNA standard. Putative Taar1 expression in the absence of DNase digestion is also shown for liver and brain.
Despite the fact that the results in figure 1 indicated the expression of Taar1 mRNA, we were compelled to perform additional studies to demonstrate the reproducibility of this observation. Such studies were necessary at this point since the DNA encoding Taar receptors does not contain introns (Lindemann et al., 2005). This fact does not allow PCR primers to be derived from different Taar1 exon sequences, as was the case for the IL-6 and GAPDH genes. Therefore if even trace amounts of genomic DNA were present in the RNA preparations, this contaminating DNA would provide a template for the PCR reaction, yielding an apparent Taar1 product. To address this possibility, aliquots of the same total RNA samples used for figure 1 were treated with RNase-free DNase, and new cDNA was then synthesized. Surprisingly, PCR amplification of these cDNA samples demonstrated no detectable expression of Taar1 mRNA (figure 2 – left-hand panels). This result in figure 2 could not be due to the absence of cDNA, since PCR to detect the presence of IL-6 mRNA in LPS stimulated samples, or the amplification of the housekeeping gene, GAPDH, were not different from the results observed in figure 1. To demonstrate the ease of amplification of this Taar1 gene segment from contaminating DNA, mouse genomic DNA was purified and used in PCR (figure 2 – right lanes of Taar1 PCR). Our conclusion from these studies is that trace amounts of genomic DNA contamination in RNA samples (figure 1) was sufficient to provide a template for PCR amplification of Taar1. When contaminating DNA was removed, no Taar1 amplification using RT-PCR was observed in cultured macrophages or dendritic cells (figure 2 – left hand panels).
Figure 2. Semiquantitative RT-PCR analysis of Taar1 mRNA expression in mouse macrophages and dendritic cells (plus DNase). Left Panels.

Total RNA samples as shown in figure 1 were treated with DNase, the DNase inactivated, and cDNA synthesized and analyzed as described in the legend to figure 1. As a positive control, the PCR for Taar1 was also performed using mouse genomic DNA since we were unable to obtain Taar1 PCR product from DNase-treated mouse liver or brain RNA. Right panels– Mouse macrophages and dendritic cells were also activated with mouse γ herpes virus-68 and the total RNA incubated with DNase, the DNase inactivated, and cDNA synthesized and analyzed. The results demonstrate that the “Taar1 expression” as shown in figure 1 is an artifact of the presence of traces of genomic DNA in the total RNA, and that neither LPS or γHV-68 induce expression of this gene.
A similar experiment using viral infection to activate cells confirmed the absence of Taar1 expression in macrophages and dendritic cells. The cells were cultured in the presence of the murine gammaherpesvirus, γHV-68. At varying times post-infection, RNA was isolated, treated with DNase, and cDNA reactions were performed. Figure 2 (right-hand panels) show the lack of expression of Taar1 mRNA following in vitro viral infection of macrophages and dendritic cells. The ability of γHV-68 to induce low level expression of IL-6 mRNA in these cell populations was consistent with previous observations (Gasper-Smith et al., 2006b). In addition, the amplification of the GAPDH gene indicated the presence of similar amounts of cDNA in each sample.
The conclusion that Taar1 expression was below the level of detection in mouse macrophages and dendritic cells was somewhat surprising since our initial studies using μMACS isolated mRNA preparations had also indicated expression of the Taar1 gene. The isolation procedure enriches poly A+ RNA from total RNA samples, while eliminating other RNA species and contaminating DNA. However, the manufacturer, Miltenyi Biotec, recommended the use of RNase-free DNase treatment to remove any trace contamination of genomic DNA that might still remain following the μMACS isolation procedure. Therefore we performed one additional study where RNA samples were subjected to μMACS poly A+ RNA enrichment with or without DNase treatment. Figure 3A clearly shows that in the absence of DNase treatment, PCR amplified Taar1 products could be observed, and that this contamination was eliminated with DNase treatment. As illustrated in figure 3B, the contamination need be no more than a few genomic DNA sequences in each PCR reaction. Spiking cDNA samples with 1–8 genomic DNA sequences typically yielded a Taar1 PCR fragment after 35 cycles, demonstrating the need for DNase incubation of the mRNA to obtain valid expression results.
To quantify the lack of Taar1 mRNA expression by mouse macrophages and dendritic cells, real time PCR was performed. Figure 3C shows a representative amplification curve, demonstrating no detectable fluorescent signal from a PCR product even after 45 cycles of amplification of cDNA from macrophages or dendritic cells. As a positive control, 40 ng, or 104 copies of mouse genomic DNA produced an expected fluorescent product. Electrophoresis of the samples from the light cycler on a 4% agarose gel confirmed that the genomic DNA template had the expected 159 base pair PCR fragment, and that this product was absent from the macrophage and dendritic cell cDNA samples (figure 3C, insert). The amount of cDNA (40 ng) used for each real time PCR sample was derived from approximately 4x10³ macrophages or dendritic cells, and since the sensitivity of this assay is in the range of a few copies per sample, it is possible to conclude that there was less than one copy of Taar1 mRNA per 4x10³ macrophages or dendritic cells.
3.2 Taar1 expression is below the levels of detection in mouse bone marrow and during macrophage and dendritic cell maturation
Although the mRNA for the trace amine receptors appears to be absent in mature or activated macrophages or dendritic cells, we had not ruled out that these mRNAs were expressed in primary bone marrow cells or during colony factor-stimulated cellular differentiation and proliferation of bone marrow-derived macrophages and dendritic cells. To test for the possibility that Taar1 mRNA might be expressed at an earlier stage of cell maturation, total RNA was isolated directly from bone marrow cells, as well as the appropriate adherent or nonadherent cell fractions during the colony factor-stimulated maturation process. Using standard semiquantitative PCR, we did not detect Taar1 mRNA expression in freshly isolated bone marrow cells (day 0), or in maturing bone marrow-derived macrophages and dendritic cells (days 1–7; data not shown). These results further suggest that Taar1 protein is absent from these cell types, and is unlikely to play a role in direct immune regulation of these cells.
3.3 Expression of Taar genes in mouse tissues and immune cells isolated from spleen
When we treated mouse spleen, thymus, brain, kidney and liver total RNA with DNase, prepared cDNA and assayed for Taar1 gene expression, our results were negative (data not shown), as found for macrophages and dendritic cells. To investigate whether Taar mRNA expression could be observed in lymphocyte populations, we isolated a number of immune cell types from mouse spleen. Although whole splenic tissue and CD4+ and CD8+ T lymphocytes had no detectable level of Taar mRNA expression, B220+ B lymphocytes and CD49b+ NK cells expressed several Taar mRNA species (figure 4). The PCR for ERM indicates that the cDNA is of sufficient quality to detect low abundance cDNAs, and genomic DNA was again used to as a positive control for the PCR reaction.
Figure 4. Semiquantitative RT-PCR analysis of Taar mRNA expression in mouse spleen cells.
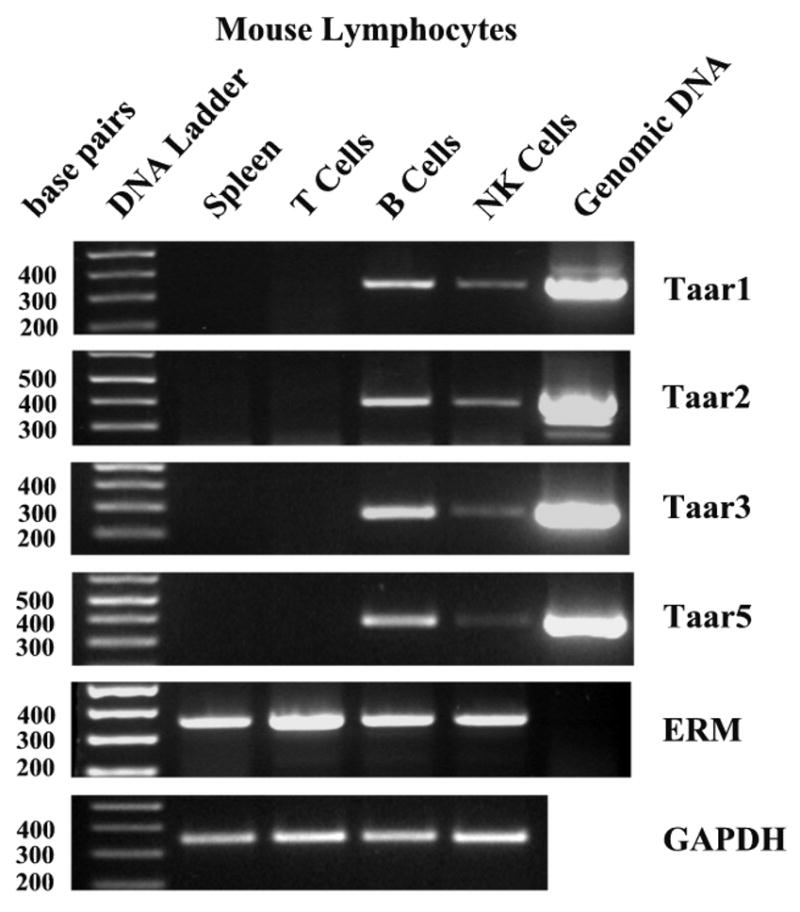
Total RNA was isolated from whole spleen, and from splenic T, B and NK cells, and treated with DNase prior to cDNA synthesis. PCR of both ERM (a low abundance, constitutively expressed transcription factor) and GAPDH are included as positive controls for the presence of cDNA, and the PCR of genomic DNA included as a positive control for the PCR reaction. The results suggest low levels of expression of Taar1, 2, 3 and 5 in B and NK cells.
3.4 Analysis of the expression of all Taar genes in mouse B cells, macrophages and dendritic cells
Because of the potential for differential regulation of the Taar genes, we have assayed all of the mouse Taar genes for transcription in B cells, macrophages and dendritic cells. The mouse genome contains 15 potentially expressed Taar genes and one pseudogene (Gloriam et al., 2005; Lewin, 2006; Lindemann et al., 2005). Primer pairs were designed to assess the expression of each Taar gene. For Taar7, five highly homologous genes are capable of being expressed, so a primer pair slightly degenerate in the forward primer was designed to assess Taar 7a,b,d,e,f expression. For Taar8, a unique primer pair was chosen capable of hybridizing to all three members of the group (Taar8a,b,c). The results are presented in figure 5, and although we were unable to detect Taar mRNA expression in dendritic cells, or macrophages, expression appear to be present for most of the Taar genes in mouse B cells. As shown in previous figures, the same quantity of mouse genomic DNA (100 ng) was used as a positive control for the PCR reactions using the same primer sets, producing an easily visible, appropriately sized DNA product. We conclude that dendritic cells and macrophages are unlikely to have Taar receptors, but B lymphocytes may express a number of these receptor subtypes.
Figure 5. Semiquantitative RT-PCR analysis of expression of all Taar genes in mouse B cells, macrophages and dendritic cells.
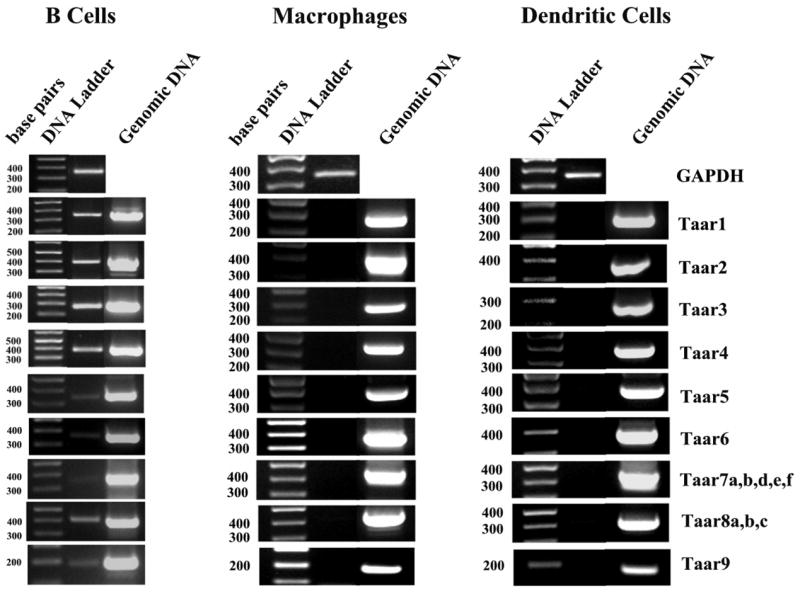
Total RNA was isolated and incubated with DNase prior to cDNA synthesis. The PCR product for GAPDH from these samples is included to indicate the presence of cDNA. PCR of genomic DNA is included as a positive control for the PCR reaction. Although there is no evidence of expression of any of the mouse Taar genes in mouse macrophages, or dendritic cells, low levels of expression are apparent for most Taar genes in B cells.
3.5 Expression of Taar genes in human lymphocytes
Since our interest is ultimately to ascertain whether human Taar receptors may bind Ecstasy and alter immune responses, we assayed for the expression of Taar genes in human lymphocytes. Similar to the mouse B cell results, we found Taar1 and Taar2 expression in human lymphocytes, with an apparent induction of expression following PHA stimulation (figure 6).
Figure 6. Semiquantitative RT-PCR analysis of Taar mRNA expression in human peripheral blood lymphocytes.
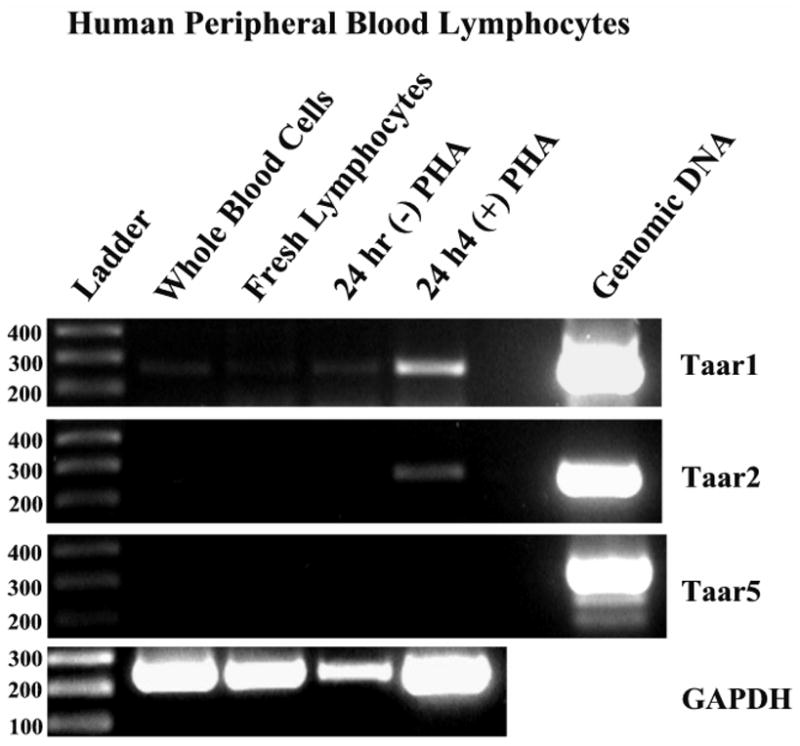
Lymphocytes were isolated from whole human blood and incubated for 24 hr in the presence and absence of PHA. Total RNA was prepared from whole blood cells, freshly prepared lymphocytes and lymphocytes incubated in the presence and absence of PHA for 24 hours. Each sample was treated with DNase, the DNase inactivated and cDNA synthesized. PCR for GAPDH is presented as a positive control for the presence of cDNA. The results suggest low levels of expression of Taar1 and Taar2 in human lymphocytes.
4. Discussion
A survey of Ecstasy abusers suggested that there might be a correlation between abuse of this drug and increased numbers of infections (Parrott et al., 2002). Surveying novice, moderate, and heavy users of Ecstasy, Parrott et al. (Parrott et al., 2002) found that the perceived number of infections reported by these individuals increased with increasing usage of the drug. Specifically, 35% of heavy Ecstasy users and approximately 10% of moderate users reported increased problems with infections. Despite this realization of increased infections by abusers of Ecstasy, no studies have been done to establish a deleterious cause and effect relationship between this drug of abuse and microbial infections. The lack of such studies is somewhat surprising since Ecstasy is one of the most commonly abused drugs by teenagers and young adults (Landry, 2002), and since this club drug contributes to the very social behaviors that would increase the likelihood of exposure to a variety of transmissible infectious diseases.
Studies in humans and animal models support the notion that exposure to Ecstasy can modulate the immune response (Connor, 2004; Pacifici et al., 2000). In vivo treatment of rats with Ecstasy (Connor et al., 2001; Connor et al., 2005; Connor et al., 2000a; Connor et al., 2000b) resulted in decreased IL-1, TNF-alpha, and increased IL-10 production in sera. Macrophage-like microglia cells in rat brain were shown to become activated following exposure of these rodents to Ecstasy (Pubill et al., 2003; Thomas et al., 2004). In vivo studies using human subjects who were exposed to Ecstasy (Pacifici et al., 2004; Pacifici et al., 2000; Pacifici et al., 2001a; Pacifici et al., 2002; Pacifici et al., 2001b) also showed immunomodulatory effects, including decreased IL-1, TNF-α, IL-10, and increased TGF-beta secretion. Despite numerous studies showing the immunomodulatory effects of this drug of abuse, it remains unclear whether such effects are mediated by direct binding of Ecstasy to receptors on leukocytes or by some other, indirect mechanisms.
Ecstasy is structurally similar to both the amphetamines and to some hallucinogenic compounds such as mescaline (Kalant, 2001), providing an apparent explanation for both its physically energizing, as well as euphoric properties. Ecstasy increases body temperature, muscle tension and activity, may produce hyperactivity, headaches and nausea, as well as having potentially neurotoxic effects due to increased serotonin levels (Kalant, 2001). These effects on the central nervous system may be mediated by Ecstasy binding to monoamine receptors (Battaglia et al., 1988; Kramer et al., 1997; Nash et al., 1994), through monoamine transporters (Battaglia et al., 1988; Han and Gu, 2006; Pacifici et al., 2004; Partilla et al., 2006; Rudnick and Wall, 1992; Verrico et al., 2007), or through cholinergic or histamine receptors (Battaglia et al., 1988). More recently, the trace amine-associated receptor family has been suggested as possible targets for Ecstasy binding. Specifically, Taar1 binding of Ecstasy elicits a cAMP response with an EC50 of 1.7 μM (Bunzow et al., 2001). This makes the receptor a rationale site for modulation of cell activity, and would be highly relevant to in vivo drug effects since Ecstasy ingestion results in serum levels in the low micromolar range. While low level Taar1 mRNA expression was originally described in peripheral tissues (Bunzow et al., 2001), no studies have been performed to specifically demonstrate expression of this receptor in immune cells. The present study was undertaken to define the mRNA expression pattern for the Taar family of receptors in macrophages, dendritic cells and spleen cells/lymphocytes.
We were surprised to find that we were unable to detect any Taar1 mRNA expression from macrophages and dendritic cells when RNA samples were carefully prepared to eliminate traces of contaminating genomic DNA (figures 2 and 3). The fact that the Taar1 gene does not contain introns (Lindemann et al., 2005), necessitates the treatment of RNA samples with DNase to remove even trace amounts of genomic DNA which might serve as a template for PCR amplification (figure 1). Based on real time PCR data, we estimate that there was less than 1 copy of Taar1 mRNA per 10,000 macrophages or dendritic cells. Furthermore, we could detect no mRNA expression for any of the Taar family of receptors (Taar 1–9) in cultured macrophages or dendritic cells with or without exposure to LPS or murine gammaherpesvirus 68. Having eliminated the Taar receptor family of proteins as potential Ecstasy binding sites on cultured macrophages and dendritic cells, it should be noted that there are other possible candidate receptors (Kramer et al., 1997; Nash et al., 1994; Partilla et al., 2006; Rudnick and Wall, 1992; Verrico et al., 2007). For example, serotonin receptor (5-hydroxytryptamine receptor; 5-HT receptor) mRNA has been reported in rat spleen, thymus and peripheral blood lymphocytes (Stefulj et al., 2000), human peripheral blood mononuclear cells (Cloez-Tayarani et al., 2004; Cloez-Tayarani et al., 2003; Durk et al., 2005) and dendritic cells (Idzko et al., 2004), and may be relevant to neuroimmune communication (Mossner and Lesch, 1998). Battaglia et al. (Battaglia et al., 1988), reported Ecstasy displaced radioligands for H-1 histamine, M-1 and M-2 muscarinic, serotonin, dopamine and adreno- receptors, as well as serotonin, norepinephrine and dopamine transporters in the low micromolar range. Additionally, we cannot rule out indirect effects of Ecstasy on macrophages and dendritic cells which have yet to be defined.
When we isolated a number of immune cell types from mouse spleen and assayed for Taar mRNA, we found that although spleen and T cells were negative for expression of Taar genes, B cells and NK cells showed expression of several Taar mRNAs. Furthermore, we observed Taar1 and Taar2 expression in PHA activated human lymphocytes (figure 6). These results are the first to demonstrate expression of the mRNAs encoding these trace amine receptors in mouse and human leukocytes. The human Taar1 protein binds with highest affinity to β-phenylethylamine (Ki = 8 nM; Borowsky et al., 2001), suggesting that the expression of numerous Taar genes may be important in monitoring the levels of a number of trace amines, or similar compounds in vivo. Taken together, these studies suggest that a previously unrecognized set of ligands could regulate the immune response by signaling through G-protein coupled Taar receptors. Future studies will be needed to define the functionality of these receptors on immune cells, and to determine whether the drug of abuse, Ecstasy, can modulate immune function via leukocyte expressed Taar1.
Acknowledgments
This work was supported by National Institute of Drug Abuse (NIDA) grant DA021833.
Footnotes
Publisher's Disclaimer: This is a PDF file of an unedited manuscript that has been accepted for publication. As a service to our customers we are providing this early version of the manuscript. The manuscript will undergo copyediting, typesetting, and review of the resulting proof before it is published in its final citable form. Please note that during the production process errors may be discovered which could affect the content, and all legal disclaimers that apply to the journal pertain.
References
- Battaglia G, Brooks BP, Kulsakdinun C, De Souza EB. Pharmacologic profile of MDMA (3,4-methylenedioxymethamphetamine) at various brain recognition sites. Eur J Pharmacol. 1988;149:159–163. doi: 10.1016/0014-2999(88)90056-8. [DOI] [PubMed] [Google Scholar]
- Berry MD. Mammalian central nervous system trace amines. Pharmacologic amphetamines, physiologic neuromodulators. J Neurochem. 2004;90:257–271. doi: 10.1111/j.1471-4159.2004.02501.x. [DOI] [PubMed] [Google Scholar]
- Borowsky B, Adham N, Jones KA, Raddatz R, Artymyshyn R, Ogozalek KL, Durkin MM, Lakhlani PP, Bonini JA, Pathirana S, Boyle N, Pu X, Kouranova E, Lichtblau H, Ochoa FY, Branchek TA, Gerald C. Trace amines: identification of a family of mammalian G protein-coupled receptors. Proc Natl Acad Sci U S A. 2001;98:8966–8971. doi: 10.1073/pnas.151105198. [DOI] [PMC free article] [PubMed] [Google Scholar]
- Bowman CC, Bost KL. Cyclooxygenase-2-mediated prostaglandin E2 production in mesenteric lymph nodes and in cultured macrophages and dendritic cells after infection with Salmonella. J Immunol. 2004;172:2469–2475. doi: 10.4049/jimmunol.172.4.2469. [DOI] [PubMed] [Google Scholar]
- Branchek TA, Blackburn TP. Trace amine receptors as targets for novel therapeutics: legend, myth and fact. Curr Opin Pharmacol. 2003;3:90–97. doi: 10.1016/s1471-4892(02)00028-0. [DOI] [PubMed] [Google Scholar]
- Bunzow JR, Sonders MS, Arttamangkul S, Harrison LM, Zhang G, Quigley DI, Darland T, Suchland KL, Pasumamula S, Kennedy JL, Olson SB, Magenis RE, Amara SG, Grandy DK. Amphetamine, 3,4-methylenedioxymethamphetamine, lysergic acid diethylamide, and metabolites of the catecholamine neurotransmitters are agonists of a rat trace amine receptor. Mol Pharmacol. 2001;60:1181–1188. doi: 10.1124/mol.60.6.1181. [DOI] [PubMed] [Google Scholar]
- Burchett SA, Hicks TP. The mysterious trace amines: protean neuromodulators of synaptic transmission in mammalian brain. Prog Neurobiol. 2006;79:223–246. doi: 10.1016/j.pneurobio.2006.07.003. [DOI] [PubMed] [Google Scholar]
- Cloez-Tayarani I, Kayyali US, Fanburg BL, Cavaillon JM. 5-HT activates ERK MAP kinase in cultured-human peripheral blood mononuclear cells via 5-HT1A receptors. Life Sci. 2004;76:429–443. doi: 10.1016/j.lfs.2004.09.006. [DOI] [PubMed] [Google Scholar]
- Cloez-Tayarani I, Petit-Bertron AF, Venters HD, Cavaillon JM. Differential effect of serotonin on cytokine production in lipopolysaccharide-stimulated human peripheral blood mononuclear cells: involvement of 5-hydroxytryptamine2A receptors. Int Immunol. 2003;15:233–240. doi: 10.1093/intimm/dxg027. [DOI] [PubMed] [Google Scholar]
- Connor TJ. Methylenedioxymethamphetamine (MDMA, ‘Ecstasy’): a stressor on the immune system. Immunology. 2004;111:357–367. doi: 10.1111/j.0019-2805.2004.01847.x. [DOI] [PMC free article] [PubMed] [Google Scholar]
- Connor TJ, Connelly DB, Kelly JP. Methylenedioxymethamphetamine (MDMA; ‘Ecstasy’) suppresses antigen specific IgG2a and IFN-gamma production. Immunol Lett. 2001;78:67–73. doi: 10.1016/s0165-2478(01)00231-0. [DOI] [PubMed] [Google Scholar]
- Connor TJ, Harkin A, Kelly JP. Methylenedioxymethamphetamine suppresses production of the proinflammatory cytokine tumor necrosis factor-alpha independent of a beta-adrenoceptor-mediated increase in interleukin-10. J Pharmacol Exp Ther. 2005;312:134–143. doi: 10.1124/jpet.104.073023. [DOI] [PubMed] [Google Scholar]
- Connor TJ, Kelly JP, Leonard BE. An assessment of the acute effects of the serotonin releasers methylenedioxymethamphetamine, methylenedioxyamphetamine and fenfluramine on immunity in rats. Immunopharmacology. 2000a;46:223–235. doi: 10.1016/s0162-3109(99)00180-0. [DOI] [PubMed] [Google Scholar]
- Connor TJ, Kelly JP, McGee M, Leonard BE. Methylenedioxymethamphetamine (MDMA; Ecstasy) suppresses IL-1beta and TNF-alpha secretion following an in vivo lipopolysaccharide challenge. Life Sci. 2000b;67:1601–1612. doi: 10.1016/s0024-3205(00)00743-8. [DOI] [PubMed] [Google Scholar]
- Downing J. The psychological and physiological effects of MDMA on normal volunteers. J Psychoactive Drugs. 1986;18:335–340. doi: 10.1080/02791072.1986.10472366. [DOI] [PubMed] [Google Scholar]
- Durk T, Panther E, Muller T, Sorichter S, Ferrari D, Pizzirani C, Di Virgilio F, Myrtek D, Norgauer J, Idzko M. 5-Hydroxytryptamine modulates cytokine and chemokine production in LPS-primed human monocytes via stimulation of different 5-HTR subtypes. Int Immunol. 2005;17:599–606. doi: 10.1093/intimm/dxh242. [DOI] [PubMed] [Google Scholar]
- Elsawa SF, Bost KL. Murine gamma-herpesvirus-68-induced IL-12 contributes to the control of latent viral burden, but also contributes to viral-mediated leukocytosis. J Immunol. 2004;172:516–524. doi: 10.4049/jimmunol.172.1.516. [DOI] [PubMed] [Google Scholar]
- Freese TE, Miotto K, Reback CJ. The effects and consequences of selected club drugs. J Subst Abuse Treat. 2002;23:151–156. doi: 10.1016/s0740-5472(02)00267-2. [DOI] [PubMed] [Google Scholar]
- Gahlinger PM. Club drugs: MDMA, gamma-hydroxybutyrate (GHB), Rohypnol, and ketamine. Am Fam Physician. 2004;69:2619–2626. [PubMed] [Google Scholar]
- Gasper-Smith N, Marriott I, Bost KL. Murine {gamma}-Herpesvirus 68 Limits Naturally Occurring CD4+CD25+ T Regulatory Cell Activity following Infection. J Immunol. 2006a;177:4670–4678. doi: 10.4049/jimmunol.177.7.4670. [DOI] [PubMed] [Google Scholar]
- Gasper-Smith N, Singh S, Bost KL. Limited IL-6 production following infection with murine gammaherpesvirus 68. Arch Virol. 2006b;151:1423–1429. doi: 10.1007/s00705-006-0725-z. [DOI] [PubMed] [Google Scholar]
- Gloriam DE, Bjarnadottir TK, Yan YL, Postlethwait JH, Schioth HB, Fredriksson R. The repertoire of trace amine G-protein-coupled receptors: large expansion in zebrafish. Mol Phylogenet Evol. 2005;35:470–482. doi: 10.1016/j.ympev.2004.12.003. [DOI] [PubMed] [Google Scholar]
- Han DD, Gu HH. Comparison of the monoamine transporters from human and mouse in their sensitivities to psychostimulant drugs. BMC Pharmacol. 2006;6:6. doi: 10.1186/1471-2210-6-6. [DOI] [PMC free article] [PubMed] [Google Scholar]
- Idzko M, Panther E, Stratz C, Muller T, Bayer H, Zissel G, Durk T, Sorichter S, Di Virgilio F, Geissler M, Fiebich B, Herouy Y, Elsner P, Norgauer J, Ferrari D. The serotoninergic receptors of human dendritic cells: identification and coupling to cytokine release. J Immunol. 2004;172:6011–6019. doi: 10.4049/jimmunol.172.10.6011. [DOI] [PubMed] [Google Scholar]
- Inaba K, Inaba M, Romani N, Aya H, Deguchi M, Ikehara S, Muramatsu S, Steinman RM. Generation of large numbers of dendritic cells from mouse bone marrow cultures supplemented with granulocyte/macrophage colony-stimulating factor. J Exp Med. 1992;176:1693–1702. doi: 10.1084/jem.176.6.1693. [DOI] [PMC free article] [PubMed] [Google Scholar]
- Kalant H. The pharmacology and toxicology of “ecstasy” (MDMA) and related drugs. Cmaj. 2001;165:917–928. [PMC free article] [PubMed] [Google Scholar]
- Kramer HK, Poblete JC, Azmitia EC. Activation of protein kinase C (PKC) by 3,4-methylenedioxymethamphetamine (MDMA) occurs through the stimulation of serotonin receptors and transporter. Neuropsychopharmacology. 1997;17:117–129. doi: 10.1016/S0893-133X(97)00026-2. [DOI] [PubMed] [Google Scholar]
- Landry MJ. MDMA: a review of epidemiologic data. J Psychoactive Drugs. 2002;34:163–169. doi: 10.1080/02791072.2002.10399950. [DOI] [PubMed] [Google Scholar]
- Lewin AH. Receptors of mammalian trace amines. Aaps J. 2006;8:E138–145. doi: 10.1208/aapsj080116. [DOI] [PMC free article] [PubMed] [Google Scholar]
- Lindemann L, Ebeling M, Kratochwil NA, Bunzow JR, Grandy DK, Hoener MC. Trace amine-associated receptors form structurally and functionally distinct subfamilies of novel G protein-coupled receptors. Genomics. 2005;85:372–385. doi: 10.1016/j.ygeno.2004.11.010. [DOI] [PubMed] [Google Scholar]
- Lindemann L, Hoener MC. A renaissance in trace amines inspired by a novel GPCR family. Trends Pharmacol Sci. 2005;26:274–281. doi: 10.1016/j.tips.2005.03.007. [DOI] [PubMed] [Google Scholar]
- Marriott I, Hammond TG, Thomas EK, Bost KL. Salmonella efficiently enter and survive within cultured CD11c+ dendritic cells initiating cytokine expression. Eur J Immunol. 1999;29:1107–1115. doi: 10.1002/(SICI)1521-4141(199904)29:04<1107::AID-IMMU1107>3.0.CO;2-0. [DOI] [PubMed] [Google Scholar]
- Monte D, Baert JL, Defossez PA, de Launoit Y, Stehelin D. Molecular cloning and characterization of human ERM, a new member of the Ets family closely related to mouse PEA3 and ER81 transcription factors. Oncogene. 1994;9:1397–1406. [PubMed] [Google Scholar]
- Mossner R, Lesch KP. Role of serotonin in the immune system and in neuroimmune interactions. Brain Behav Immun. 1998;12:249–271. doi: 10.1006/brbi.1998.0532. [DOI] [PubMed] [Google Scholar]
- Nash JF, Roth BL, Brodkin JD, Nichols DE, Gudelsky GA. Effect of the R(−) and S(+) isomers of MDA and MDMA on phosphatidyl inositol turnover in cultured cells expressing 5-HT2A or 5-HT2C receptors. Neurosci Lett. 1994;177:111–115. doi: 10.1016/0304-3940(94)90057-4. [DOI] [PubMed] [Google Scholar]
- Nelson DA, Marriott I, Bost KL. Expression of hemokinin 1 mRNA by murine dendritic cells. J Neuroimmunol. 2004;155:94–102. doi: 10.1016/j.jneuroim.2004.06.005. [DOI] [PubMed] [Google Scholar]
- Pacifici R, Pichini S, Zuccaro P, Farre M, Segura M, Ortuno J, Di Carlo S, Bacosi A, Roset PN, Segura J, de la Torre R. Paroxetine inhibits acute effects of 3,4-methylenedioxymethamphetamine on the immune system in humans. J Pharmacol Exp Ther. 2004;309:285–292. doi: 10.1124/jpet.103.061374. [DOI] [PubMed] [Google Scholar]
- Pacifici R, Zuccaro P, Farre M, Pichini S, Di Carlo S, Roset PN, Lopez CH, Ortuno J, Segura J, Cami J, de la Torre R. Immunomodulating activity of MDMA. Ann N Y Acad Sci. 2000;914:215–224. doi: 10.1111/j.1749-6632.2000.tb05198.x. [DOI] [PubMed] [Google Scholar]
- Pacifici R, Zuccaro P, Farre M, Pichini S, Di Carlo S, Roset PN, Ortuno J, Pujadas M, Bacosi A, Menoyo E, Segura J, de la Torre R. Effects of repeated doses of MDMA (“ecstasy”) on cell-mediated immune response in humans. Life Sci. 2001a;69:2931–2941. doi: 10.1016/s0024-3205(01)01373-x. [DOI] [PubMed] [Google Scholar]
- Pacifici R, Zuccaro P, Farre M, Pichini S, Di Carlo S, Roset PN, Palmi I, Ortuno J, Menoyo E, Segura J, de la Torre R. Cell-mediated immune response in MDMA users after repeated dose administration: studies in controlled versus noncontrolled settings. Ann N Y Acad Sci. 2002;965:421–433. doi: 10.1111/j.1749-6632.2002.tb04183.x. [DOI] [PubMed] [Google Scholar]
- Pacifici R, Zuccaro P, Hernandez Lopez C, Pichini S, Di Carlo S, Farre M, Roset PN, Ortuno J, Segura J, Torre RL. Acute effects of 3,4-methylenedioxymethamphetamine alone and in combination with ethanol on the immune system in humans. J Pharmacol Exp Ther. 2001b;296:207–215. [PubMed] [Google Scholar]
- Parrott AC, Buchanan T, Scholey AB, Heffernan T, Ling J, Rodgers J. Ecstasy/MDMA attributed problems reported by novice, moderate and heavy recreational users. Hum Psychopharmacol. 2002;17:309–312. doi: 10.1002/hup.415. [DOI] [PubMed] [Google Scholar]
- Partilla JS, Dempsey AG, Nagpal AS, Blough BE, Baumann MH, Rothman RB. Interaction of amphetamines and related compounds at the vesicular monoamine transporter. J Pharmacol Exp Ther. 2006;319:237–246. doi: 10.1124/jpet.106.103622. [DOI] [PubMed] [Google Scholar]
- Premont RT, Gainetdinov RR, Caron MG. Following the trace of elusive amines. Proc Natl Acad Sci U S A. 2001;98:9474–9475. doi: 10.1073/pnas.181356198. [DOI] [PMC free article] [PubMed] [Google Scholar]
- Pubill D, Canudas AM, Pallas M, Camins A, Camarasa J, Escubedo E. Different glial response to methamphetamine- and methylenedioxymethamphetamine-induced neurotoxicity. Naunyn Schmiedebergs Arch Pharmacol. 2003;367:490–499. doi: 10.1007/s00210-003-0747-y. [DOI] [PubMed] [Google Scholar]
- Ropero-Miller JD, Goldberger BA. Recreational drugs. Current trends in the 90s. Clin Lab Med. 1998;18:727–746. [PubMed] [Google Scholar]
- Rudnick G, Wall SC. The molecular mechanism of “ecstasy” [3,4-methylenedioxy-methamphetamine (MDMA)]: serotonin transporters are targets for MDMA-induced serotonin release. Proc Natl Acad Sci U S A. 1992;89:1817–1821. doi: 10.1073/pnas.89.5.1817. [DOI] [PMC free article] [PubMed] [Google Scholar]
- Scheicher C, Mehlig M, Zecher R, Reske K. Dendritic cells from mouse bone marrow: in vitro differentiation using low doses of recombinant granulocyte-macrophage colony-stimulating factor. J Immunol Methods. 1992;154:253–264. doi: 10.1016/0022-1759(92)90199-4. [DOI] [PubMed] [Google Scholar]
- Sklar MD, Tereba A, Chen BD, Walker WS. Transformation of mouse bone marrow cells by transfection with a human oncogene related to c-myc is associated with the endogenous production of macrophage colony stimulating factor 1. J Cell Physiol. 1985;125:403–412. doi: 10.1002/jcp.1041250307. [DOI] [PubMed] [Google Scholar]
- Smith KM, Larive LL, Romanelli F. Club drugs: methylenedioxymethamphetamine, flunitrazepam, ketamine hydrochloride, and gamma-hydroxybutyrate. Am J Health Syst Pharm. 2002;59:1067–1076. doi: 10.1093/ajhp/59.11.1067. [DOI] [PubMed] [Google Scholar]
- Stefulj J, Jernej B, Cicin-Sain L, Rinner I, Schauenstein K. mRNA expression of serotonin receptors in cells of the immune tissues of the rat. Brain Behav Immun. 2000;14:219–224. doi: 10.1006/brbi.1999.0579. [DOI] [PubMed] [Google Scholar]
- Thomas DM, Dowgiert J, Geddes TJ, Francescutti-Verbeem D, Liu X, Kuhn DM. Microglial activation is a pharmacologically specific marker for the neurotoxic amphetamines. Neurosci Lett. 2004;367:349–354. doi: 10.1016/j.neulet.2004.06.065. [DOI] [PubMed] [Google Scholar]
- Verrico CD, Miller GM, Madras BK. MDMA (Ecstasy) and human dopamine, norepinephrine, and serotonin transporters: implications for MDMA-induced neurotoxicity and treatment. Psychopharmacology (Berl) 2007;189:489–503. doi: 10.1007/s00213-005-0174-5. [DOI] [PubMed] [Google Scholar]
- Zucchi R, Chiellini G, Scanlan TS, Grandy DK. Trace amine-associated receptors and their ligands. Br J Pharmacol. 2006;149:967–978. doi: 10.1038/sj.bjp.0706948. [DOI] [PMC free article] [PubMed] [Google Scholar]