Abstract
Background and purpose:
The human organic cation transporter-1 (hOCT1) is a polyspecific transporter that plays a role in drug distribution, metabolism and excretion. Previous studies have demonstrated that hOCT1 binding can be stereoselective, but the mechanism for stereochemical recognition has not been described. The purpose of this study was to develop a pharmacophore model to describe stereoselective binding to hOCT1.
Experimental approach:
A set of 22 compounds including 8 pairs of enantiomers and five pairs of diastereomers was used to develop a pharmacophore model. The pharmacophore modeling was carried out using Catalyst version 4.11 and HypoGen and was based upon the correlation of the structures and activities (Ki values) of the compounds used in the study.
Key results:
The resulting model contained a positive ion, hydrophobic and two hydrogen-bond acceptor interaction sites. The relative enantioselectivity of 8/8 enantiomeric pairs and diastereoselectivity of 5/5 diastereomers was described by mapping to a combination of at least 3 of the 4 functional feature sites of the model.
Conclusions and implications:
The pharmacophore model describes stereoselective interactions with hOCT1 at one of the binding sites on the molecule.
Keywords: organic cation transporter, stereoselective binding, pharmacophore model, affinity chromatography, chiral recognition mechanism
Introduction
Transport proteins are found in the liver, kidney and intestines and play an essential role in the metabolism and excretion of endogenous and exogenous compounds (Dresser et al., 2001; Koepsell et al., 2003). One of the key transporters is the organic cation transporter (OCT), which is thought to play a role in drug distribution, metabolism and excretion (Dresser et al., 2001; Koepsell et al., 2003). Five distinct OCT isoforms have been identified, OCT1–3 and OCTN1,2 (Koepsell et al., 1999; Dresser et al., 2001) and the human OCT1 (hOCT1) is one of the best characterized.
The hOCT1 has been functionally expressed in MDCK (Shu et al., 2003), HeLa (Zhang et al., 1998; Bednarczyk et al., 2003) and HEK293 (Kimura et al., 2005) cell lines and Xenopus laevis oocytes (Zhang et al., 1997; Bourdet et al., 2005). Transport studies with these cell lines have established that hOCT1 mediates the bidirectional transport of small organic cations (50–350 a.m.u.) such as tetraethylammonium (TEA) and 1-methyl-4-phenylpyridinium (MPP+) (Zhang et al., 1999; Dresser et al., 2001; Koepsell et al., 2003). These studies have also demonstrated that hOCT1 transport can be inhibited by a diverse group of commonly administered drugs including verapamil, quinidine, quinine and disopyramide (Dresser et al., 2001; Koepsell et al., 2003).
The identification and characterization of interactions with the hOCT1 has been primarily accomplished using cellular uptake and trans-stimulation studies (Zhang et al., 1999; Bednarczyk et al., 2003). The resulting data are then reported as IC50 values or transformed into Ki values using the Cheng–Prusoff relationship (Cheng and Prusoff, 1973). We have recently reported an alternative approach to the determination of hOCT1 binding interactions based upon cellular membrane-affinity chromatography (CMAC) (Moaddel et al., 2005b). This technique utilizes a liquid chromatographic stationary phase containing immobilized cellular membrane fragments obtained from a stably transfected MDCK cell line that expresses hOCT1 (Shu et al., 2003), the hOCT1(+)-immobilized artificial membrane (IAM) stationary phase. The Ki values obtained using the hOCT(+)-IAM stationary phase correlated with previously reported Ki values obtained using cellular uptake techniques (r2=0.9363; P=0.0016) (Moaddel et al., 2005b).
During the initial chromatographic studies, it was determined that (R)-verapamil had an 86-fold lower Ki than (S)-verapamil (Moaddel et al., 2005b). The observed enantioselectivity was consistent with a previous study in which the IC50 value associated with (R)-disopyramide inhibition of hOCT1-mediated uptake of TEA was twofold lower than that of (S)-disopyramide (Zhang et al., 1998). Subsequently, we expanded our study to determine the enantioselectivity of the hOCT1 transporter for the enantiomers of verapamil, atenolol, propranolol and pseudoephedrine (Moaddel et al., 2005a). The data from the second study demonstrated that the chromatographically determined enantioselectivity reflected an enantioselectivity in the functional inhibition of hOCT1 transport.
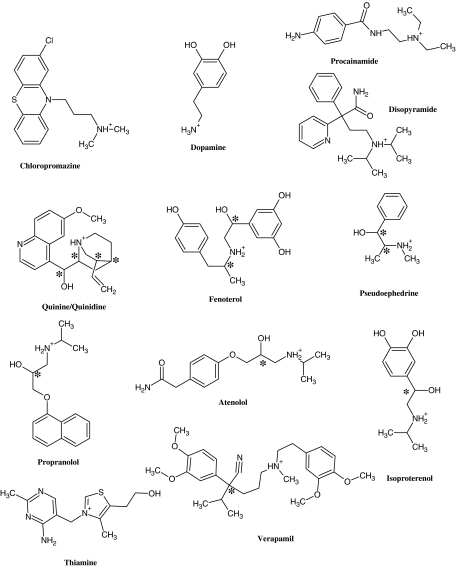
In this study, a set of 22 compounds including 8 pairs of enantiomers and 5 pairs of diastereomers (Figure 1) were used to develop a pharmacophore model to describe the observed stereoselective binding to the hOCT1. The pharmacophore modelling was carried out using Catalyst version 4.11 and HypoGen and was based upon the correlation of the structures and activities (Ki values) of the compounds used in the study. The resulting pharmacophore contained a positive ion interaction site, a hydrophobic interaction site and two hydrogen-bond acceptor (HBA) sites. The data indicate that the mapping of compounds to three or more of these sites is related to stereoselective binding to the hOCT1 and that the model reflected the relative Ki values and stereoselectivities.
Figure 1.
Representative chemical structures of the training set. Chiral centres are marked by * symbols. Different stereoisomers are not shown separately. See Table 1 for a complete list of training set compounds. Chemical structures of the compounds were generated on ChemSketch (v10.0, ACD Inc., Toronto, ON, Canada) software using the SMILES strings obtained from PubChem database (http://pubchem.ncbi.nlm.nih.gov/help.html).
Materials and methods
Cell lines
The hOCT1-MDCK cell line has been described previously (Shu et al., 2003) and was provided by K Giacomini (Department of Biopharmaceutical Sciences, University of California San Francisco, San Francisco, CA, USA). The cell line was maintained and harvested as described previously (Moaddel et al., 2005b).
Chromatographic studies
The hOCT1(+)-IAM column was prepared as described previously (Moaddel et al., 2005b) and connected to a LC-10AD isocratic HPLC pump (Shimadzu, Columbia, MD, USA) equipped with an online scintillation detector (IN/US system, β-ram Model 3, Tampa, FL, USA) with a dwell time of 2 s using Laura lite 3. The mobile phase consisted of Tris-HCl (10 mM, pH 7.4) containing 1 mM CaCl2, 0.5 mM MgCl2 delivered at 0.2 ml min−1 at room temperature.
The marker ligand was [3H]-MPP+ (20 pM) and a 50-ml sample Superloop (Amersham Pharmacia Biotech, Uppsala, Sweden) was used to apply the marker ligand and the displacer ligands to the hOCT1-IAM column in the following concentrations:
(R)-(−)-isoproterenol: 5, 10, 20, 50, 100, 200 μM; (S)-(+)-isoproterenol: 1, 5, 20, 50, 100, 200 μM; (S,S)-fenoterol: 5.0, 10.0, 15.0, 20.0 μM; (R,R)-fenoterol: 5.0, 10.0, 15.0, 20.0, 25.0, 40 μM; (R,S)-fenoterol: 1.5, 3.0, 4.5, 6.0, 10.0, 25.0 μM; (S,R)-fenoterol: 5.0, 7.0, 12.5, 15.0, 20.0, 40.0 μM.
Data analysis
In this study, the Ki values for the displacer ligands were calculated using a previously described approach (Moaddel et al., 2005b). The experimental approach is based upon the effect of escalating concentrations of the competitive binding ligand on the retention volume of [3H]-MPP+. For example, if unlabelled MPP+ is used as the displacer ligand, the dissociation constants of MPP+, KMPP as well as the number of the active binding sites of the immobilized hOCT1 receptor, P, can be calculated using equation (1):
where, V is retention volume of MPP+; Vmin, the retention volume of MPP+ when the specific interaction is completely suppressed (this value can be determined by running [3H]-MPP+ at a high concentration). The Ki for MPP+ is obtained from the plot of [MPP+] (V−Vmin) vs [MPP+]. The same can be performed for any other displacer. The data were analysed by nonlinear regression with a one site binding (hyperbola) using Prism 4 software (Graph Pad Software Inc., San Diego, CA, USA) running on a personal computer.
Molecular modelling
Generation of compounds
The compounds used in this study were sketched in Catalyst ‘View Compound workbench' (Accelrys Software Inc., San Diego, CA, USA). Upon importing the compounds into Catalyst, the stereochemistry of the chiral compounds was set using the Cahn–Ingold–Prelog convention (Cahn et al., 1966), and refined using 3D Minimize module. CHARMm (Brooks et al., 1983) force field as implemented in Catalyst was used for energy minimization and conformational analysis. Conformational models were built using poling method (Smellie et al., 1995a, 1995b, 1995c) using the best quality option for ensuring conformational diversity. The energy threshold was set at 20 kcal mol−1 during conformational search.
Pharmacophore modelling
Pharmacophore modelling was carried out using Catalyst version 4.11 (Accelrys Software Inc.). All the modelling and the analysis were carried out on a SGI workstation (Octane) running IRIX 6.5.28m operating system and having a 400 MHz processor with CPU MIPS R12K.
HypoGen (Li et al., 2000; Kurogi and Güner, 2001), a pharmacophore generation algorithm, was used to construct models of the hOCT1 inhibitor binding mode by creating hypotheses. The pharmacophore models produced in this study were constructed using Catalyst prebuilt dictionary chemical features such as hydrophobe, positive ion and hydrogen-bond acceptor, which in Catalyst are represented by a solid sphere surrounded by a mesh-like larger sphere. The solid sphere represents the centre of the chemical feature while the mesh sphere denotes the extent of the location constraint for the matching feature to be present in order to map the feature. Features like HBAs or hydrogen bond donors are denoted by a vector with spheres occupying the head (heavy atom location) and tail positions (pointing in the direction of complementary group receptor).
HypoGen models are generated by identifying the group of chemical features with definite relative 3D arrangements that are common among the active compounds but absent in the inactive ones and correlates with the training set activity data. HypoGen algorithm is made up of three phases: the constructive phase, the subtractive phase and the optimization phase (Li et al., 2000; Kurogi and Güner, 2001). The constructive phase identifies the common pharmacophore models for the most active molecules, and the subtractive phase removes those pharmacophore models that map the inactive ones. The optimization phase optimizes the remaining hypotheses by making random perturbations to the features that make up these models. During the final phase, addition or removal of features were usually attempted. At the end of the HypoGen run, the user required number of models will be reported.
Statistical significance of the HypoGen models are measured by cost parameters required for their creation (Sutter et al., 2000). Fixed and null costs represent the costs of creating an ideal and worst model, respectively. Statistically meaningful models are expected to have costs that lie between these two extremes. Another important parameter, configuration cost (or entropy) is computed during the optimization phase and offers a hint on the available search space for hypothesis search. Training set compounds with entropy parameter greater than 17 (131 072 possible hypotheses) are unlikely to result in meaningful models. Cost value of a hypothesis is a sum of the following three different parameter values: error, weight and configuration (Sutter et al., 2000). For a given training set, error term increases as the root mean squared (RMS) deviation of the predicted activity from the experimental activity values and the weight is a Gaussian form of function relating deviation from the ideal value of 2 (Sutter et al., 2000). In a HypoGen run, the greater the difference between the fixed and the null costs, and the closer the cost values of the hypotheses to the fixed or ideal cost will indicate the presence of statistically significant model(s) (Li et al., 2000).
Materials
MPP+ iodide, (R)-(−)-isoproterenol, (S)-(+)-isoproterenol, labetolol, rac-metoprolol, the inorganic salts, Tris-HCl buffer, CHAPS and phosphate-buffered saline were purchased from Sigma Chemical Company (St Louis, MO, USA). [3H]-MPP+ acetate was purchased from American Radiolabeled Chemicals Inc. (St Louis, MO, USA). IAM stationary phase (IAM-PC, 12 μm particle size, 300 Å pore size) was purchased from Regis Technologies Inc. (Morton Grove, IL, USA). HR 5/2 glass columns were purchased from Amersham Pharmacia Biotech. (R,R)-Fenoterol, (S,S)-fenoterol, (R,S)-fenoterol, (S,R)-fenoterol were obtained from the stores of the Laboratory for Clinical Investigation at the National Institute on Aging, NIH.
Results
Chromatographically determined binding affinities
The structures of the compounds used in this study are presented in Figure 1. The experimentally determined binding affinities (Ki values) of 17 of the 22 compounds used in the training set were obtained using the hOCT1(+)-IAM column; 6 of which were determined in this study while the other 11 had been previously reported (Moaddel et al., 2005a, 2005b) and the remaining data were obtained from the literature (Table 1). The enantioselectivity (α) of the binding of the eight pairs of enantiomers was defined as Ki of the (S)-enantiomer divided by the Ki of the (R)-enantiomer, Ki(S)/Ki(R) (Table 2). The diastereoselectivity (α) of the five sets of diastereomers were also calculated using the ratios of the experimentally determined and estimated Ki values (Table 2).
Table 1.
The experimentally determined Ki value {Ki (Exp)} for the compounds used in this study calculated in this study or previously reported in the literature
| Compound | Ki (Exp) (μM) | Ki (Est) (μM) |
|---|---|---|
| (R)-verapamil | 0.05a | 0.02 |
| (S)-verapamil | 3.46a | 3.00 |
| (S)-atenolol | 0.46b | 1.60 |
| (R)-atenolol | 0.98b | 1.90 |
| (S)-propranolol | 2.85b | 2.40 |
| (R)-propranolol | 0.95b | 1.70 |
| (1R,2R)-pseudoephedrine | 1.12b | 13.0 |
| (1S,2S)-pseudoephedrine | 1.71b | 24.0 |
| Quinidine | 6.33a | 3.70 |
| Quinine | 10.18a | 5.70 |
| (S,S)-fenoterol | 3.73 | 4.00 |
| (R,R)-fenoterol | 12.6 | 9.00 |
| (S,R)-fenoterol | 6.18 | 8.20 |
| (R,S)-fenoterol | 13.2 | 11.0 |
| (S)-isoproterenol | 180 | 30.0 |
| (R)-isoproterenol | 120 | 21.0 |
| Dopamine | 198a | 290 |
| Chlorpromazine | 4.30c | 8.20 |
| Procainamide | 14.0c | 4.00 |
| (R)-disopyramide | 15.0d | 5.40 |
| (S)-disopyramide | 30.0d | 6.40 |
| Thiamine | 430c | 220 |
The estimated Ki value {Ki (Est)} for the compounds used in this study was calculated by fitting the compounds into the pharmacophore constructed using hypothesis-1.
Table 2.
The experimentally determined and estimated stereoselectivities (α) for the chiral compounds used in this study
| Compound | α (Exp) | α (Est) |
|---|---|---|
| (R,S)-verapamil | 77 | 150 |
| (R,S)-atenolol | 0.5 | 0.8 |
| (R,S)-propranolol | 3.0 | 1.4 |
| (RR,SS)-pseudoephedrine | 1.5 | 1.8 |
| (RR,SS)-fenoterol | 0.3 | 0.4 |
| (RS,SR)-fenoterol | 0.5 | 0.7 |
| (R,S)-isoproterenol | 1.5 | 1.4 |
| (R,S)-disopyramide | 2.0 | 1.2 |
| Quinine/quinidine | 1.6 | 1.5 |
| (R,S)/(R,R)-fenoterol | 1.1 | 1.2 |
| (S,R)/(R,R)-fenoterol | 0.5 | 0.9 |
| (R,S)/(S,S)-fenoterol | 3.5 | 2.8 |
| (S,R)/(S,S)-fenoterol | 1.7 | 2.1 |
For the enantiomeric pairs, the α value is defined as Ki(S)/Ki(R), and for the diastereomeric pairs, the ratios are as presented in the table.
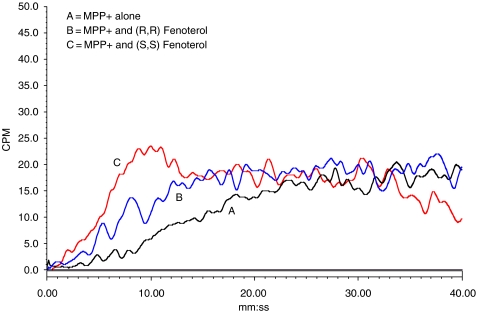
In the frontal displacement chromatography experiments conducted in this study, the expected front and plateau regions were observed in the chromatographic traces, where the frontal region is the relatively flat initial portion of the chromatographic trace that reflects the binding of the marker to the target up to saturation, and in which saturation is represented by a vertical breakthrough and attainment of a plateau region (Figure 2). The retention volume of [3H]-MPP+, the marker in these experiments, was measured at the midpoint of the breakthrough curve. Previous studies have demonstrated that the observed retention volumes are reproducible with an average variation of ∼5% (Moaddel et al., 2006).
Figure 2.
The chromatographic traces from the frontal competitive displacement chromatography of 10 pM [3H]-N-methyl 4-phenyl pyridinium ([3H]-MPP+), where: trace A (MPP+) was obtained with [3H]-MPP+ alone; trace B (MPP+ and (R,R)-fenoterol) was obtained after the addition of 10 μM (R,R)-fenoterol to the mobile phase; trace C (MPP+ and (S,S)-fenoterol) was obtained after the addition of 10 μM (S,S)-fenoterol to the mobile phase. The experiments were carried out using a stationary phase containing immobilized membranes obtained from the hOCT1-MDCK cell line, the hOCT(+)-IAM column, see text for experimental details. hOCT1, human organic cation transporter-1; IAM, immobilized artificial membrane.
The effect on [3H]-MPP+ retention produced by the addition to the mobile phase of increasing concentrations of the studied compounds was used to determine the Ki values, which were calculated using equation (1). Previous studies have demonstrated that the Ki values determined using the hOCT1(+)-IAM stationary phase directly correlated with Ki values determined using membrane binding and functional studies (Moaddel et al., 2005a, 2005b).
Pharmacophore modelling
The compounds utilized in the modelling included 17 chromatographically determined Ki values from seven pairs of enantiomers (14 compounds) and the diastereomers quinidine and quinine (Table 1). However, in order to comply with the general guidelines of HypoGen (Li et al., 2000), it was necessary to add six additional compounds, which included one pair of enantiomers, (R)- and (S)-disopyramide, and four achiral compounds. The Ki value for dopamine was determined using the hOCT1(+)-IAM stationary phase and the other values were used as reported in the literature (Table 1).
The Ki values for the five compounds obtained from the literature had been calculated using hOCT1-mediated 14C-TEA transport in transfected HeLa cells (Zhang et al., 1998; Bednarczyk et al., 2003). This is in contrast to the other experimentally determined Ki values, which were calculated using chromatographic competitive displacement of [3H]-MPP+ from immobilized membrane fragments obtained from a stably transfected hOCT1-MDCK cell line (this paper; Moaddel et al., 2005a, 2005b). While it is possible that inconsistencies may arise from the use of data obtained using different cell lines, experimental techniques and substrate, previous studies have demonstrated that Ki values obtained using the hOCT(+)-IAM column correlated with previously reported Ki values obtained using 14C-TEA transport in transfected HeLa cells, r2=0.9987 (P<0.001) (Moaddel et al., 2005b).
Common functional groups among the compounds utilized in the pharmacophore modelling were identified using the standard functional mapping tools available in Catalyst. The selected input features for HypoGen were hydrophobic and positive ion features, which have been previously identified (Bednarczyk et al., 2003), and an added HBA. All the function features used in this study were the default ones from the standard Catalyst dictionary.
The HypoGen runs were carried out using these features and were monitored by following the RMS, correlation and cost values. This approach produced 10 hypotheses, of which hypothesis-1 had the highest correlation (0.855245) with the lowest RMS (1.00417). The results of these studies and the HypoGen parameters used to generate the hypothesis can be found in the Supplementary material. To further validate hypotheses-1, cross-validation Fisher randomization tests were carried out using the cat Scramble module in Catalyst. The test was carried out to validate the strong correlation between the structures and the activity values. A confidence level of 95% was used for this test. This generated 19 new scrambled data sets, which were further used in HypoGen with identical conditions as the initial run to generate 190 pharmacophore models. Based on the cost values, correlation, RMSD of all the resulting models, an 85% significance was assigned to the model corresponding to hypothesis-1.
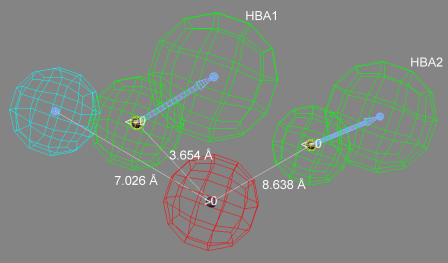
The pharmacophore corresponding to hypothesis-1 contained a positive ion interaction site (red), a hydrophobic interaction site (blue) and two HBA sites (green) (Figure 3). Using the centre of the positive ion interaction site as the origin, the distances to the centre the HBA sites are ∼3.7 Å (HBA1) and ∼8.6 Å (HBA2). Using the same approach, the distance to the centre of the hydrophobic site is ∼7 Å. HBA1 can be viewed as lying in between the positive interaction site and hydrophobic site, and is ∼4 Å from the latter site. These results are similar to the previously hypothesized enantioselective pharmacophore (Moaddel et al., 2005b) where the calculated distance between the positive ion site and the hydrophobic site was ∼5 Å and the HBA site was located 2.2 Å from the ionic interaction site and 4.3 Å from the hydrophobic site.
Figure 3.
The pharmacophore model generated by hypothesis-1 in which the red sphere represents a positive ion interaction site, the blue sphere represents a hydrophobic interaction site and the green spheres represent two hydrogen-bond acceptor sites, HBA1 and HBA2.
To determine if differences in cell line and experimental techniques affected the pharmacophore model reported in this paper, we removed from the experimental set the five compounds whose Ki values were obtained from the literature, that is the values obtained using hOCT1-mediated 14C-TEA transport in transfected HeLa cells (Zhang et al., 1998; Bednarczyk et al., 2003). The pharmacophore models developed using the 17 chromatographically determined Ki values had the same features as the pharmacophore presented in Figure 3, but the statistical significances of the models were lower (data not shown). The reduced statistical significance was due to the fact that the number of compounds in the experimental set was below the optimum number required by the general guidelines of HypoGen. Thus, it appears that the pharmacophore model was not affected by source of the Ki values.
Enantioselective and diastereoselective binding
The compounds used in the study were fit to the pharmacophore derived from hypothesis-1 in order to determine the estimated Ki values (Table 1). The enantioselectivities were calculated using the ratio of estimated Ki values using the relationship α=Ki(S)/Ki(R). The experimentally determined and estimated α values were consistent for all of enantiomers and reflected the same relative strength of binding of the enantiomers, that is, R>S or S>R (Table 2).
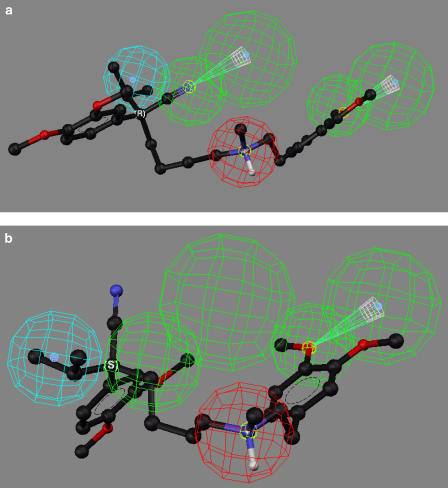
The greatest difference in enantioselectivity was observed with (R)-verapamil and (S)-verapamil, where the experimentally determined and estimated α values were 77 and 150, respectively (Table 2). When (R)-verapamil was fitted to the proposed pharmacophore, all the relevant functional groups of the molecule matched the hypothesis (Figure 4a), while (S)-verapamil could be mapped to only three of the model feature sites (Figure 4b). The difference, and therefore the source of the enantioselectivity, was the mapping of the nitrile moiety present on the chiral carbon, where the R-configuration permitted this interaction with HBA1, while the S-configuration did not.
Figure 4.
The fit of verapamil enantiomers in the proposed pharmacophore, where: (a) the mapping of (R)-verapamil; (b) the mapping of (S)-verapamil. Nonpolar hydrogen atoms have been omitted for clarity.
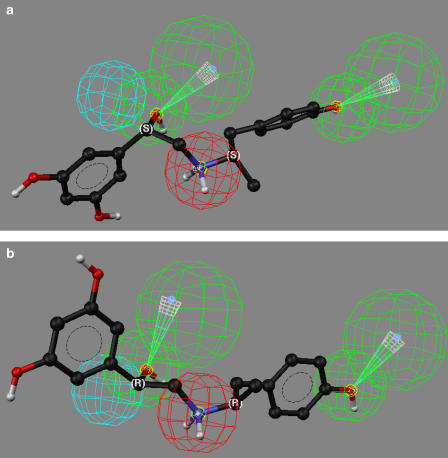
The experimentally observed and calculated Ki values for (S,S)-fenoterol was greater than the corresponding (R,R)-enantiomer, and there was no difference between the estimated and experimentally determined enantioselectivity (Table 2). Mapping of (S,S)-fenoterol and (R,R)-fenoterol with the pharmacophore model indicated that for these compounds, only three of the four functional features, the positive interaction site, HBA1 and HBA2, were essential for binding (see Figure 5). Both enantiomers mapped to these feature sites and the difference in the estimated Ki values was a function of the calculated fits, which were 6.08 for (S,S)-fenoterol and 5.73 for (R,R)-fenoterol.
Figure 5.
The fit of fenoterol enantiomers in the proposed pharmacophore, where: (a) the mapping of (S,S)-fenoterol; (b) the mapping of (R,R)-fenoterol. Nonpolar hydrogen atoms have been omitted for clarity.
In the same manner, both (R)- and (S)-propranolol mapped to three of the four sites on the pharmacophore. Two of the sites, the positive interaction site and HBA1, were the same as the ones identified for the fenoterol enantiomers, while the third site was different, hydrophobic site (propranolol), HBA2 (fenoterol). Although the mapping differed, the source of the enantioselectivity, the relative fit, was the same for both compounds. For propranolol, the relative fits were 6.45 for (R)-propranolol and 6.31 for (S)-propranolol.
When the experimentally determined and estimated stereoselectivities of the 13 sets of enantiomers/diastereomers were compared using linear regression analysis, a significant relationship was observed, r2=0.9992 (P<0.0001). When verapamil was removed from the data set, a weaker, but still significant relationship was observed, r2=0.6623 (P=0.0013).
The ability of the proposed pharmacophore to identify differences in the relative fit between enantiomeric and diastereomeric pairs, suggests that the three-dimensional relationship between the identified interaction sites reflects the spatial distribution of similar binding sites within hOCT1. The fact that these differences in relative fit produced the experimentally observed stereoselectivities is also consistent with previously identified chiral recognition mechanisms (Booth and Wainer, 1996). In these mechanisms, each enantiomer of a chiral compound interacts with the same sites on the chiral selector and the differential stabilities of the resulting diastereomeric complexes is a function of the relative conformational energies required to create the complexes.
Discussion and conclusions
Bednarczyk et al. (2003) have previously reported a hOCT1 pharmacophore generated using Catalyst 3.1 or 3.4 and IC50 values obtained using a training set composed of structurally diverse organic cations. We reanalysed the previously reported data using Catalyst 4.11 and we were able to reproduce the published pharmacophore (hereafter ‘Bednarczyk pharmacophore'), which contained three hydrophobic sites and a positive ionizable site. However, when the compounds used in study were mapped to the Bednarczyk pharmacophore, no stereoselectivity was observed. For example, previous studies of the inhibition of hOCT1-mediated transport of TEA demonstrated enantioselective inhibition by propranolol {IC50(R-propranolol)/IC50(S-propranolol)=2.75} (Moaddel et al., 2005b) and a diastereoselective inhibition by quinine and quinidine {Ki(quinine)/Ki(quinidine)=1.3} (Koepsell et al., 1999). Using the Bednarczyk pharmacophore, the predicted IC50 ratios for (R)-/(S)-propranolol and quinine/quinidine were 1.00 and 1.05, respectively.
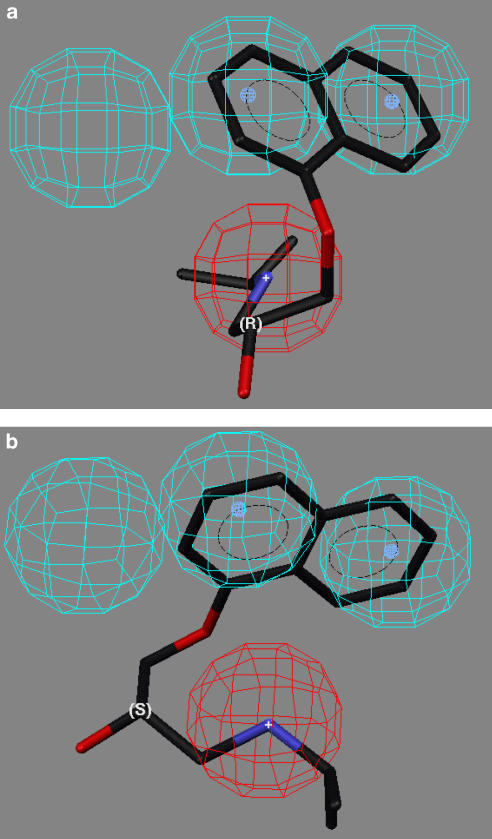
The inability of the Bednarczyk pharmacophore to reflect stereoselective interactions with the hOCT1 is not surprising as the authors did not consider this possibility even though their test set contained chiral molecules such as pindolol, nicotine and quinidine and stereoselective inhibition of hOCT1 transport had been previously reported with (R)-/(S)-disopyramide (Zhang et al., 1998) and quinine/quinidine (Koepsell et al., 1999). The result of the lack of stereochemical input into the modelling is illustrated by the mapping of (R)-propranolol and (S)-propranolol to the Bednarczyk pharmacophore (Figures 6a and b). Both enantiomers map to two of the three hydrophobic sites and to the positive ionizable site, but these interactions involve only two of the four bonds to the chiral centre. What is lacking is an additional interaction, which would provide the molecular recognition of the configuration about the chiral centre. The limitations of this pharmacophore made it necessary for us to develop the new pharmacophore model.
Figure 6.
The fit of propranolol enantiomers in the pharmacophore described by Bednarczyk et al. (2003), where: (a) the mapping of (R)-propranolol; (b) mapping of (S)-propranolol.
The resulting pharmacophore contained a positive ion interaction site, a hydrophobic site and two HBA sites (Figure 3). Using the centre of the positive ion interaction site as the origin, the distances to the centre the HBA sites are ∼3.7 Å (HBA1) and ∼8.6 Å (HBA2). Using the same approach, the distance to the centre of the hydrophobic site is ∼7 Å.
It is of interest to note that the model developed in this study is similar to the previously reported pharmacophore that contained three hydrophobic sites and a positive ionizable site where the calculated distances between the positive ion site and the three hydrophobic sites were 4.2, 5.1 and 5.3 Å (Bednarczyk et al., 2003). If the three hydrophobic sites postulated in the earlier work are considered to be a single hydrophobic area, then the major differences between the two models are the added hydrogen bonding areas.
In this study, 20 of the 22 compounds mapped to the positive ion feature and various combinations of at least two of the remaining three identified functional features of the pharmacophore. The data indicate that the proposed pharmacophore model is able to identify a common binding mode for a wide variety of structures by using varying combinations of the four identified functional features.
The only exceptions were dopamine and thiamine. These compounds only had two binding interactions with the proposed pharmacophore, the positive ion site and the HBA2 (dopamine) or hydrophobic site (thiamine). The difference in the number of binding interactions also produced differences in the estimated Ki which were <30 μM for the compounds with three interactions and >200 μM for dopamine and thiamine (Table 1). However, for dopamine and thiamine, the estimated Ki values were consistent with the experimentally determined Ki values.
The existence of multiple interaction sites and binding combinations in the hOCT1 pharmacophore is consistent with, and may explain the broad selectivity of, this transporter, which has been described as a polyspecific transporter (Dresser et al., 2001; Koepsell et al., 2003). It is also consistent with the results from studies with the rOCT2 (Volk et al., 2003), which suggested that the substrate binding site of rOCT2 is a pocket containing overlapping binding domains, and from studies of the substrate binding region of the rOCT1 (Popp et al., 2005) that implied that transport requires simultaneous or successive binding to two or more sites.
The data from this study demonstrate that the pharmacophore model can be used to describe the stereoselective binding of compounds at one of the sites on the hOCT1 molecule. Thus, the results suggest that the model is a potential in silico screen of new drug candidates that contain chiral centres. This is consistent with previous studies in this laboratory that have applied a CMAC – computational modelling approach to the description and prediction of the binding of non-competitive inhibitors to neuronal nicotinic acetylcholine receptors (Jozwiak et al., 2004).
External data objects
Acknowledgments
We acknowledge Dr JR Collins at ABCC and Dr K Jozwiak at the University of Lublin for interesting discussions during this work. SR would like to acknowledge Drs Adrea Trope Mehl and Luke S Fisher, Accelrys Inc. for helpful discussion during the HypoGen modelling calculations. This work was supported in part by funds from the Intramural Research Program of the National Institute on Aging, NIH.
Abbreviations
- α
stereoselectivity
- CMAC
cellular membrane-affinity chromatography
- HBA
hydrogen bond acceptor
- IAM
immobilized artificial membrane
- MPP+
1-methyl-4-phenylpyridinium
- OCT
organic cation transporter
- TEA
tetraethylammonium
Conflict of interest
The authors state no conflict of interest.
Supplementary Information accompanies the paper on British Journal of Pharmacology website (http://www.nature.com/bjp)
References
- Bednarczyk D, Ekins S, Wikel JH, Wright SH. Influence of molecular structure on substrate binding to the human organic cation transporter, hOCT1. Mol Pharmacol. 2003;63:489–498. doi: 10.1124/mol.63.3.489. [DOI] [PubMed] [Google Scholar]
- Booth TD, Wainer IW. Investigation of the enantioselective separations of α-arylcarboxylic acids on an amylose tris(3,5-dimethylphenylcarbamate) chiral stationary phase using quantitative structure-enantioselective retention relationships: Identification of a conformationally driven chiral recognition mechanism. J Chromatogr A. 1996;737:157–169. [Google Scholar]
- Bourdet DL, Pritchard JB, Thakker DR. Differential substrate and inhibitory activities of ranitidine and famotidine toward human organic cation transporter 1 (hOCT1; SLC22A1), hOCT2 (SLC22A2), and hOCT3 (SLC22A3) J Pharmacol Exp Ther. 2005;315:1288–1297. doi: 10.1124/jpet.105.091223. [DOI] [PubMed] [Google Scholar]
- Brooks BR, Bruccoleri RE, Olafson BD, States DJ, Swaminathan S, Karplus M. CHARMm: a program for macromolecular energy, minimization, and dynamics calculations. J Comp Chem. 1983;4:187–217. [Google Scholar]
- Cahn RS, Ingold CK, Prelog V. Specification of molecular chirality. Angew Chem Int Ed Engl. 1966;5:385–414. [Google Scholar]
- Cheng YC, Prusoff WH. Relationship between the inhibition constant (Ki) and the concentration of inhibitor which causes 50 percent inhibition (I50) of an enzymatic reaction. Biochem Pharmacol. 1973;22:3099–3108. doi: 10.1016/0006-2952(73)90196-2. [DOI] [PubMed] [Google Scholar]
- Dresser MJ, Leabman MK, Giacomini KM. Transporters involved in the Elimination of drugs in the kidney: organic anion transporters and organic cation transporters. J Pharm Sci. 2001;90:397–420. doi: 10.1002/1520-6017(200104)90:4<397::aid-jps1000>3.0.co;2-d. [DOI] [PubMed] [Google Scholar]
- Jozwiak J, Ravichandran R, Collins JR, Wainer IW. The interaction of non-competitive inhibitors alpha3 beta4 nicotinic acetylcholine receptor investigated by affinity chromatography, QSAR and molecular docking. J Med Chem. 2004;47:4008–4021. doi: 10.1021/jm0400707. [DOI] [PubMed] [Google Scholar]
- Kimura N, Masuda S, Tanihara Y, Ueo H, Okuda M, Katsura T, et al. Metformin is a superior substrate for renal organic cation transporter OCT2 rather than hepatic OCT1. Drug Metab Pharmacokinet. 2005;20:379–386. doi: 10.2133/dmpk.20.379. [DOI] [PubMed] [Google Scholar]
- Koepsell H, Gorboulev V, Arndt P. Molecular pharmacology of organic cation transporters in the kidney. J Membrane Biol. 1999;167:103–117. doi: 10.1007/s002329900475. [DOI] [PubMed] [Google Scholar]
- Koepsell H, Schmitt BM, Gorboulev V. Organic cation transporters. Rev Physiol Biochem Pharmacol. 2003;150:36–90. doi: 10.1007/s10254-003-0017-x. [DOI] [PubMed] [Google Scholar]
- Kurogi Y, Güner OF. Pharmacophore modeling and three dimensional database searching for drug design using Catalyst. Current Med Chem. 2001;8:1035–1055. doi: 10.2174/0929867013372481. [DOI] [PubMed] [Google Scholar]
- Li H, Sutter J, Hoffmann R.HypoGen: an automated system of generating 3D predictive pharmacophore models Pharmacophore Perception, Development and Use in Drug Design, Iul Biotechnology Series 2 2000International University Line: La Jolla, CA; 171–189.In: Guner OF (ed). [Google Scholar]
- Moaddel R, Hamid R, Patel S, Bullock P, Wainer IW. Identification of P-glycoprotein substrates using open tubular chromatography on an immobilized P-glycoprotein column: comparison of chromatographic results with Caco-2 permeability. Anal Chem Acta. 2006;578:25–30. doi: 10.1016/j.aca.2006.03.007. [DOI] [PubMed] [Google Scholar]
- Moaddel R, Patel S, Jozwiak K, Yamaguchi R, Ho PC, Wainer IW. Enantioselective binding to the human organic cation transporter-1 (hOCT1) determined using an immobilized hOCT1 liquid chromatographic stationary phase. Chirality. 2005a;17:501–506. doi: 10.1002/chir.20195. [DOI] [PubMed] [Google Scholar]
- Moaddel R, Yamaguchi R, Ho PC, Patel S, Hsu CP, Subrahmanyam V, et al. Development and characterization of an immobilized human organic cation transporter based liquid chromatographic stationary phase. J Chromatogr B. 2005b;818:263–268. doi: 10.1016/j.jchromb.2005.01.015. [DOI] [PubMed] [Google Scholar]
- Popp C, Gorboulev V, Muller TD, Gorbunov D, Shatskaya N, Koepsell H. Amino acids critical for substrate affinity of rat organic cation transporter 1 line the substrate binding region in a model derived for the tertiary structure of lactose permease. Mol Pharmacol. 2005;67:1600–1611. doi: 10.1124/mol.104.008839. [DOI] [PubMed] [Google Scholar]
- Shu Y, Leabman MK, Feng B, Mangravite LM, Huang CC, Stryke D, Pharmacognetics of Membrane Transporters Investigators et al. Evolutionary conversation predicts function of variants of the human organic cation transporter, OCT1. Proc Natl Acad Sci USA. 2003;100:5902–5907. doi: 10.1073/pnas.0730858100. [DOI] [PMC free article] [PubMed] [Google Scholar]
- Smellie A, Kahn SD, Teig S. An analysis of conformational coverage 1. Validation and estimation of coverage. J Chem Inf Comput Sci. 1995a;35:285–294. [Google Scholar]
- Smellie A, Kahn SD, Teig S. An analysis of conformational coverage 2. Applications of conformational models. J Chem Inf Comput Sci. 1995b;35:295–304. [Google Scholar]
- Smellie A, Teig SL, Towbin P. Poling: promoting conformational coverage. J Comp Chem. 1995c;16:171–187. [Google Scholar]
- Sutter J, Güner O, Hoffmann R, Li H, Waldman M.Effect of variable weights and tolerances on predictive model generation Pharmacophore Perception, Development and Use in Drug Design, Iul Biotechnology Series 2 2000International University Line: La Jolla, CA; 499–511.In: Guner OF (ed). [Google Scholar]
- Volk C, Gorboulev V, Budiman T, Nagel G, Koepsell H. Different affinities of inhibitors to the outwardly and inwardly directed substrate binding site of organic cation transporter 2. Mol Pharmacol. 2003;64:1037–1047. doi: 10.1124/mol.64.5.1037. [DOI] [PubMed] [Google Scholar]
- Zhang L, Dresser MJ, Gray AT, Yost SC, Terashita S, Giacomini KM. Cloning and functional expression of human organic cation transporter. Mol Pharmacol. 1997;51:913–921. doi: 10.1124/mol.51.6.913. [DOI] [PubMed] [Google Scholar]
- Zhang L, Gorset W, Dresser MJ, Giacomini KM. The interaction of n-tetraalkylammonium compounds with a human organic cation transporter, hOCT1. J Pharmacol Exp Ther. 1999;288:1192–1198. [PubMed] [Google Scholar]
- Zhang L, Schaner ME, Giacomini KM. Functional characterization of an organic cation transporter (hOCT1) in a transiently transfected human cell line (HeLa)1. J Pharmacol Exp Ther. 1998;286:354–361. [PubMed] [Google Scholar]
Associated Data
This section collects any data citations, data availability statements, or supplementary materials included in this article.


