Abstract
Different lines of evidence suggest that specific events during the cell cycle may be mediated by a heterotrimeric G-protein activated by a cognate G-protein coupled receptor. However, coupling between the only known Gα-subunit of the heterotrimeric G-protein (GPA1) and the only putative G-protein coupled receptor (GCR1) of plants has never been shown. Using a variety of approaches, we show here that GCR1-enhanced thymidine incorporation into DNA depends on an increase in phosphatidylinositol-specific phospholipase C activity and an elevation of inositol 1,4,5-trisphosphate levels in the cells. Tobacco (Nicotiana tabacum) cells that overexpress either Arabidopsis GCR1 or GPA1 display this phenomenon. We suggest on the basis of these results that GCR1-controlled events during the cell cycle involve phosphatidylinositol-specific phospholipase C as an effector of GCR1 and inositol 1,4,5-trisphosphate as a second messenger, and that GCR1 and GPA1 are both involved in this particular signaling pathway.
In animals, G-protein coupled receptors (GPCRs) are the largest family of cell-surface proteins involved in transmitting signals (e.g. 1% of total genes in fruitfly [Drosophila melanogaster], 5% of all genes in Caenorhabditis elegans, and more then 1% of the human genome). These receptors are activated by a wide variety of ligands (Marinissen and Gutkind, 2001). Ligand-mediated activation of GPCRs leads to their interaction with heterotrimeric G-proteins (composed of an α-, β-, and γ-subunit), which undergo conformational changes accompanied by the exchange of GDP bound to the α-subunit for GTP. Subsequently, the Gα-subunit and the Gβγ-dimer can enhance or inhibit the activity of downstream effector molecules, such as adenylate and guanylate cyclases, phosphodiesterases, phospholipases, phosphoinositide kinases, and ion transporters, thereby activating or inhibiting the production of second messengers.
In yeast, only two GPCR systems are known: the pheromone response pathway, and the Glc-sensing system (Versele et al., 2001). In Arabidopsis, a single gene, GCR1 (Plakidou-Dymock et al., 1998), encoding a putative GPCR, has been identified. GCR1 is an “orphan” receptor because no ligand has been found. Furthermore, no direct evidence has been found to date for the coupling of GCR1 to the only prototypical Gα-subunit of heterotrimeric G-protein (GPA1; Ma et al., 1990) or for the activation of downstream effector(s).
Pharmacological studies, based on the use of G-protein activators and inhibitors in plants, have indicated the possible involvement of heterotrimeric G-proteins in a variety of processes, including light-mediated responses, hormone signaling, ion channel regulation, pathogen resistance, and cell growth (for review, see Assmann, 2002). Cell cycle regulation may also be a downstream response of GCR1 or GPA1 activation. Ullah et al. (2001) examined the role of GPA1 in cell division in Arabidopsis and tobacco (Nicotiana tabacum cv Bright Yellow 2 [BY2]) cells. They isolated two independent T-DNA insertions in the Arabidopsis GPA1 gene that are null mutations. Whereas the GPA1-overexpressors have increased ectopic cell divisions, the gpa1 mutants have reduced cell division activity during hypocotyl and leaf formation. Moreover, when GPA1 was overexpressed in tobacco BY2 cells, the progression through the cell cycle was more rapid. Colucci et al. (2002) obtained parallel results using synchronized BY2 cells that overexpressed GCR1, suggesting that both GCR1 and GPA1 may regulate the same cell cycle events.
In many cellular systems, the role of type C phospholipases has been well established in regulating cell growth, cell proliferation, cell differentiation, and metabolism through the synthesis of inositol 1,4,5-trisphosphate (IP3) and diacylglycerol (DAG; D'Santos et al., 1998; Yang et al., 2002). IP3 acts as soluble second messenger to mediate the release of Ca2+ from intracellular stores (Alexandre et al., 1990; Shears, 1998), whereas DAG remains in the plasma membrane and transduces signals via the activation of protein kinase C (PKC; for review, see Hodgkin et al., 1998) or is immediately converted into phosphatidic acid (PA), another important second messenger (Munnik, 2001). In plants, several lines of evidence indicate that phosphatidylinositol-specific phospholipase C (PI-PLC) is involved in a number of cellular and developmental processes, including stomatal closure (Staxen et al., 1999), cytoskeleton organization (Kovar et al., 2000), and pollen tube growth (Kost et al., 1999). There is also evidence that PI-PLC may be implicated in other signaling pathways, such as those mediated by light, hormones, and stress (Ettlinger and Lehle, 1988; Hirayama et al., 1995; Pical et al., 1999; Coursol et al., 2000). The activity of PI-PLC in plant cells increases in cells treated with mastoparan and Mas7, two peptides that have a stimulatory effect on most of the heterotrimeric G-proteins in animal systems (Drobak and Watkins, 1994; Munnik et al., 1998), but it is not clear whether this is a direct or indirect effect mediated by Ca2+. Information regarding the molecular components that regulate PI-PLC in all of these processes remains obscure.
In this study, we demonstrate that the activation of Arabidopsis-GCR1 through its overexpression in BY2 cells leads to an increase of PI-PLC activity and to an increase of the second messenger IP3. Using PI-PLC specific inhibitors, we observed that the DNA synthesis rate, as measured by thymidine incorporation, which is increased by GCR1 overexpression, was dependent on PI-PLC activity both in control and GCR1-overexpressing cells. We also observed that an increased total kinase activity was present in GCR1-overexpressing cells compared with wild type (wt). Furthermore, we found that PI-PLC activity and IP3 content are higher in BY2 cells overexpressing Arabidopsis-GPA1 and comparable with those of GCR1-overexpressing lines. On the basis of these data, we suggest that GCR1 and GPA1 can both affect a signal transduction pathway that leads to enhanced DNA synthesis and that this pathway is mediated by PI-PLC, an effector of GCR1.
RESULTS AND DISCUSSION
PI-PLC Inhibitor Affects the Rate of DNA Synthesis
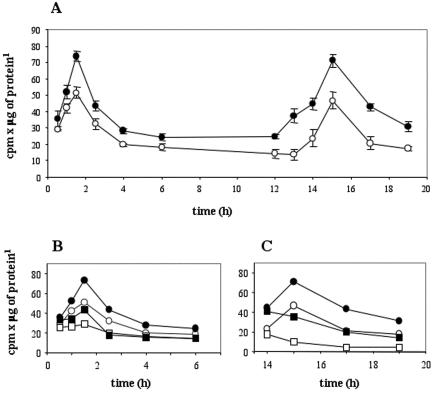
To acquire insights into the signal transduction pathway activated by GCR1 in plant cells, we analyzed the role of PI-PLC during cell cycle progression in synchronized BY2 cells, because it is known that in other systems PLC plays an important role in regulating cell growth and proliferation (Noh et al., 1995; Yang et al., 2002). Cell cycle progression can be measured by determining [3H]thymidine incorporation into nuclear DNA during 30 min at different times after release of aphidicolin inhibition. Under these conditions, these cells experience two peaks of DNA synthesis, at 1 to 2 h and at 14 to 16 h, and we confirmed our earlier observation (Colucci et al., 2002) that the peaks of DNA synthesis were more pronounced in the GCR1-overexpressing cells (Fig. 1A). To look at the role of PI-PLC, we examined the effect of the PI-PLC inhibitor U73122 on DNA synthesis, because it is known that U73122 inhibits PI-PLC activity of different types of plant cells, both in vivo and in vitro (Coursol et al., 2000; Zhang et al., 2002). U73122 was added to the cells at concentration of 100 μM, as in other studies with plant cells (Perera et al., 2001; Takahashi et al., 2001). When the PI-PLC inhibitor U73122 was added immediately after the cells were released from the aphidicolin block, the rate of DNA synthesis during the first peak was dramatically decreased both in the control and the GCR1-overexpressing line (Fig. 1B). To measure the effect of the inhibitor on the second peak of DNA synthesis, the inhibitor was added 14 h after aphidicolin removal. For the second peak, the results (Fig. 1C) show an immediate decay in DNA synthesis after addition of the inhibitor. The inactive analog of the inhibitor U73343, used as control, had no effect on DNA synthesis in the same cells either for the first or the second peak (data not shown). Therefore, we conclude from these data that PI-PLC is an important element in the regulation of DNA synthesis.
Figure 1.
Rates of [3H]thymidine incorporation by synchronized wt and GCR1-overexpressing BY2 cells during the cell cycle and effect of the PI-PLC inhibitor, U73122. A, Thymidine incorporation of wt (white circles) and GCR1-overexpressing (black circles) cells. B and C, Thymidine incorporation of wt cells, not treated (white circles) or in the presence of 100 μm U73122 (white squares), and GCR1-overexpressing cells, also not treated (black circles) or in the presence of 100 μm U73122 in dimethyl sulfoxide (DMSO; black squares). The values ± sd are means of two independent measurements from a representative experiment.
These results differ from those reported by Yang et al. (2002) who found that U73122 completely inhibited stimulated DNA synthesis in human tracheal smooth muscle cells, but not in control cells. However, in that system, the control cells were growth-arrested and confluent with minimal DNA synthesis, whereas the control BY2 cells used in our study resumed DNA synthesis because they were re-fed after aphidicolin removal.
PI-PLC Activity and IP3 Levels Are Higher in GCR1-Overexpressing Cells
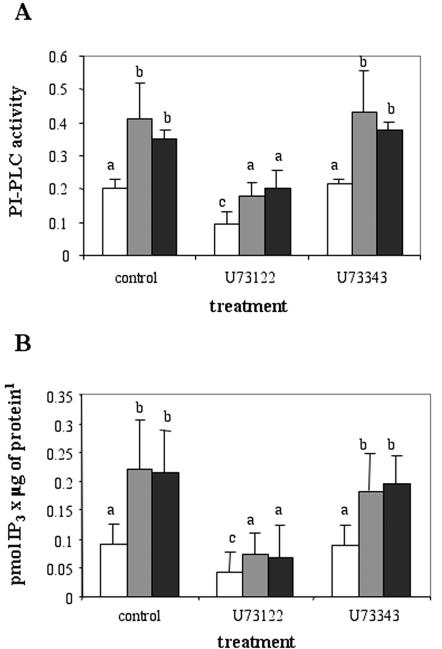
From the analysis of this first experiment, we postulated that PI-PLC may have a key role in DNA synthesis modulation and may be involved as a downstream effector in the GCR1-activated pathway. To test this hypothesis, we compared the activity of PI-PLC measured in microsomal membrane fractions derived from wt cells with that measured in analogous preparations derived from two independent GCR1-overexpressing lines. As shown in Figure 2A, the enzyme activity was significantly higher in the GCR1-overexpressing lines compared with wt. To confirm that the hydrolysis of the substrate phosphatidylinositol 4,5-biphosphate was due to the activity of a PI-PLC enzyme, samples were also incubated in the presence of U73122 or in the presence of the inactive analog U73343. The inhibitory effect of U73122 on PI-PLC activity was evident in all the cell lines (more pronounced in the two GCR1 lines), whereas the treatment of the samples with the inactive analog did not affect PI-PLC activity. The partial inhibition of PLC activity produced by U73122 can be explained considering that multiple PI-PLC isoforms have been found in plants (Hartweck et al., 1997), and they may have different sensitivities to U73122 because they are subject to different mechanisms of regulation. In fact, in animal cells, U73122 inhibits specifically only the β-type PI-PLC that are activated by GPCR/G-protein pathways (Thompson et al., 1991; Yule and Williams, 1992). Nevertheless, although in plant cells only δ-type isoforms have been found, we cannot exclude that they could be regulated by GPCR-activated pathways, as was shown for yeast and Dictyostelium discoideum where homologous δ-type isoforms have been found (Drayer and Van Haastert, 1992; Ansari et al., 1999).
Figure 2.
PI-PLC activity and IP3 content in wt and GCR1-overexpressing BY2 cells. A, PI-PLC activity of microsomes. Microsomes containing 10 μg of protein from wt (white bars) and two different GCR1-overexpressing lines (dark bars) were incubated as indicated. The activity of the enzyme is expressed as picomoles of IP3 produced per microgram of protein per minute. The inhibitor U73122 was used at 100 μm. The values ± sd are means of two independent measurements from five different experiments. Bars with different letters are significantly different with P values calculated through the ANOVA test less than 0.05. B, IP3 content of the cells. Cell samples (1 mL) of wt (white bars) and two GCR1-overexpressing lines (dark bars) were treated as indicated and IP3 measured with RIA according to the protocol described in “Materials and Methods.” The values ± sd are means of two independent measurements from eight different experiments. Bars with different letters are significantly different with P values calculated through the ANOVA test less than 0.05.
Higher activity of PI-PLC may correspond to higher levels of the reaction products IP3 and DAG in the cells. We measured the IP3 content with the radioimmunoassay (RIA) method in extracts of cells derived from 4-d-old cultures (one wt and two GCR1 lines) previously treated with the inhibitor for 30 min. As shown in Figure 2B, the amount of IP3 extracted from the GCR1-overexpressing cells was significantly higher than that extracted from wt cells. This indicates that GCR1-overexpressing cells have a higher concentration of IP3 in the cytoplasm, due to an increased activity of the phosphatidylinositol 4,5-biphosphate2-hydrolyzing enzyme PI-PLC. Using the ANOVA single factor test with all the measurements, we found that the differences between the wt and the GCR1-overexpressing lines were significant, as well as the effect produced by the inhibitor U73122 on PI-PLC activity and IP3 content (see figure legend for details).
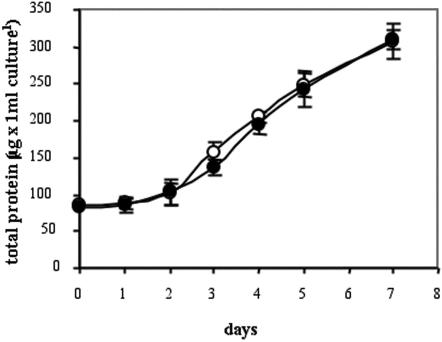
To be sure that the differences of PI-PLC activity and IP3 content between wt and GCR1-overexpressing lines were truly caused by the overexpression of GCR1 and not due to a different stage of growth of the cultures, we compared the growth rates of unsynchronized cells by measuring protein accumulation of a wt culture and a GCR1-overexpressing line during 7 d of growth. As shown in Figure 3, the rate of protein accumulation doubled twice during this period, and the rates of accumulation were similar in the two cultures, suggesting that the cells were growing at the same rate. Thus the differences in PI-PLC activity and IP3 content of the wt and GCR1 lines described above are not due to a differential rate of growth. Previously, we showed (Colucci et al., 2002) that GCR1 overexpression substantially increases the number of mitotic figures after 6 to 7 h and 17 to 19 h after the release from aphidicolin block. Because the control and the GCR1-overexpressing cells appear to be growing at the same rate (Fig. 3), we conclude that in these non-synchronized free-growing cells, other factors that limit cell multiplication may override the stimulation by GCR1.
Figure 3.
Growth rate of wt and one GCR1-overexpressing culture. At the indicated times, 1 mL of cells from wt (white circles) and GCR1-overexpressing line (black circles) was taken from each culture, and the protein content was measured. The values ± sd are means of six independent measurements from one representative experiment.
IP3 Levels Are Regulated by GCR1 during the Cell Cycle
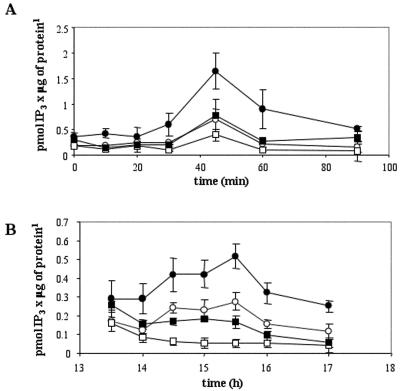
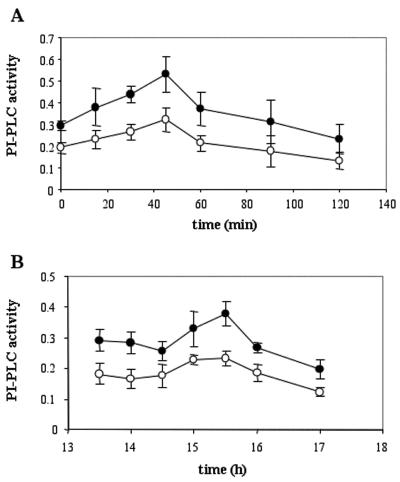
We also investigated the changes in PI-PLC activity and IP3 content during the cell cycle. Wt and GCR1-overexpressing cultures were synchronized in aphidicolin for 24 h, washed, and resuspended in fresh medium, and each one was divided into two subcultures, of which, one was used as control and the other was treated with the PI-PLC inhibitor U73122. At different times during the first 1.5 h and from 13.5 to 17 h (periods of time corresponding to the two peaks of DNA synthesis after the release from aphidicolin), IP3 was extracted and measured by RIA. As shown in Figure 4A, the IP3 level significantly increased from 30 to 60 min after release from the aphidicolin block in both cell lines, and it reached a peak at 45 min, about 4-fold higher than the level at time zero. Moreover, the amounts of IP3 extracted from the GCR1 samples were significantly higher than those collected in the wt samples (ANOVA test). Similar results, obtained from the analysis of the IP3 content associated with the second peak of DNA synthesis, showed that the maximum increase of IP3 was at 15.5 h, and that the values calculated for the GCR1-overexpressing line were significantly higher than those calculated for wt cells (Fig. 4B). Moreover, the treatment with the inhibitor U73122 reduced significantly the IP3 levels in both the wt and the GCR1 samples. These results, taken together with those on thymidine incorporation, indicate that the levels of IP3 are regulated during the cell cycle and that higher levels of IP3 are associated with higher rates of DNA synthesis.
Figure 4.
IP3 content variations in synchronized BY2 cells during the cell cycle. At the times indicated after the removal of aphidicolin, corresponding to the first peak (A) and second peak (B) of DNA synthesis, IP3 content was measured by RIA in samples of cells derived from wt (white circles), wt treated with 100 μm U73122 (white squares), GCR1-overexpressing cells (black circles), and GCR1-overexpressing cells treated with 100 μm U73122 (black squares). The values ± sd are means of two independent measurements from three different experiments. The differences between wt and GCR1-overexpressing line and the decreases caused by the inhibitor were statistically significant (P value calculated by ANOVA single factor less than 0.05).
To confirm these results, we also measured PI-PLC activity during the first and second peak of DNA synthesis. The results, shown in Figure 5, A and B, indicate that the PI-PLC activity is modulated during the cell cycle and that in the GCR1-overexpressing line the enzyme is significantly more active, suggesting that the higher levels of IP3 measured are due to up-regulation of PI-PLC activity produced by GCR1.
Figure 5.
PI-PLC activity variations in synchronized BY2 cells during the cell cycle. At the times indicated after the removal of aphidicolin, corresponding to the first peak (A) and second peak (B) of DNA synthesis, PI-PLC activity was measured in microsomal preparations of cells derived from wt (white circles) and GCR1-overexpressing samples (black circles). The values ± sd are means of two independent measurements from three different experiments. The differences of activity measured in the wt and in the GCR1 samples were statistically significant, because the P values calculated by ANOVA single factor for the mean at 45 min and that at 15.5 h were less than 0.05.
Kinase Activity Is Higher in GCR1-Overexpressing Cells
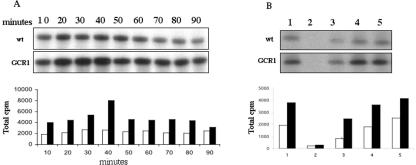
Because it is known from other studies that PI-PLC leads to the activation of transcription factors through the regulation of the activity of PKC or other Ca2+-dependent protein kinases (CDPKs; D'Santos et al., 1998; Shears, 1998), we investigated whether any kinase activity would be involved in cell cycle regulation in the GCR1-signaling pathway. For this purpose, we measured the total kinase activity in BY2 cell extracts derived from wt and GCR1-overexpressing cells, at different times during the cell cycle, using in vitro [32P]ATP labeling and histone H1 as substrate. As shown in Figure 6A, the kinase activity increased after the aphidicolin removal, and it was significantly higher in GCR1-overexpressing cells than in wt ones. These results indicate that kinase activity is upregulated during the cell cycle by GCR1.
Figure 6.
Kinase activity on histone H1 in BY2 cells. A, At the times indicated after the removal of aphidicolin, samples of synchronized cells were taken from wt and GCR1-overexpressing cultures, and kinase activity was assayed in cell extracts containing 15 μg of total protein. Samples were run on a polyacrylamide gel (top panel) or precipitated with trichloroacetic acid (TCA), and the radioactivity was measured (bottom panel). Wt, White bars; GCR1, dark bars. B, Kinase activity was measured in cell extracts, containing 15 μg of total protein, incubated with no treatment (1), 1 μm staurosporin (2), 1 mm EGTA (3), and 1 mm and 1.1 mm CaCl2 in presence of 1 mm EGTA (4 and 5, respectively). Samples were run on a gel (top panel) or precipitated with TCA, and the radioactivity was measured (bottom panel). Wt, White bars; GCR1, dark bars.
To study the increased kinase activity observed in the GCR1 line more closely, we measured the activity in presence of staurosporin, a broad spectrum kinase inhibitor, in the presence of the calcium-chelator, EGTA, and two different concentrations of calcium (Fig. 6B). Although the staurosporin and EGTA significantly inhibited the kinase activity, in the presence of 1 mm EGTA, calcium restored the activity of the kinase when added in equal amount to that of EGTA and further increased this activity when added in excess (1.1 mm). Although the inhibitory effect of staurosporin confirmed that protein kinase activity was responsible of histone phosphorylation, the inhibitory effect of EGTA and the stimulatory effect produced by Ca2+ on the kinase activity suggest that Ca2+-dependent kinases are also involved in the GCR1-activated pathway that leads to DNA synthesis.
Analyses of the Arabidopsis genome showed the presence of 34 CDPK genes that have been implicated in a number of cellular processes, including metabolism, growth, development, and the stress response (for review, see Cheng et al., 2002). Although little information is available regarding their upstream regulation and their targets, one or more CDPKs may be involved in cell cycle progression induced by GCR1. Recently, it was found that in tobacco plants, CDPK1, which is mainly expressed in meristems, interacts with a regulatory subunit of the 26S proteasome and regulates cell division and differentiation (Hyun-Sook et al., 2002).
Other kinases may also contribute to the increased activity observed in GCR1-overexpressing cells, because the reduction caused by EGTA is only partial. Many different kinases may be up-regulated in the cells as a result of calcium increase or DAG formation. DAG is rapidly converted to PA by a DAG kinase, and PA can activate several different intracellular responses through the activity of protein kinases (for review, see Munnik, 2001).
We also observed that the kinase activity measured on histone H1 was substantially inhibited by two different protein kinase A (PKA) inhibitors, cyano-3-methyllisoquinoline and protein kinase A inhibitor 14–22 amide (data not shown). The significance of this finding is unknown because no PKA homologs have been found in plants (Tchieu et al., 2003), and there is no information on the identity of the tobacco protein kinases inhibited by these compounds.
GPA1 Induces PI-PLC Activation
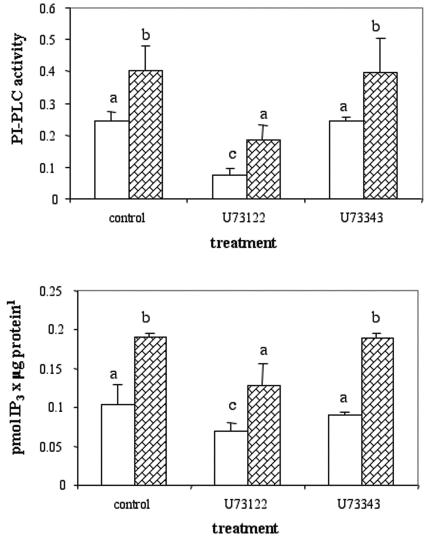
Previous studies demonstrated that the overexpression of either the Arabidopsis-GPA1 gene (Ullah et al., 2001) or the Arabidopsis-GCR1 gene (Colucci et al., 2002) in BY2 cells resulted in an increase in [3H]thymidine incorporation, suggesting that for this downstream event GCR1 and GPA1 may be involved in the same pathway. We therefore determined whether overexpression of GPA1 had the same effect as the overexpression of GCR1 on PI-PLC activity and IP3 levels. The results (Fig. 7, A and B) indicate that the GPA-overexpressing cells have a greater PI-PLC activity associated with the microsomal fraction and a higher IP3 content compared with the wt cells, effects similar to those observed in the cells overexpressing GCR1 (Fig. 2). Also in this case, we compared the growth rate of a wt cell culture with that of a GPA1-overexpressing culture, and we found that, during the 7 d examined, the values were comparable (data not shown). Therefore, we can exclude that the differences of PI-PLC activity and IP3 content measured in the wt and GPA1-overexpressing cells were due to different stages of growth.
Figure 7.
PI-PLC activity and IP3 content in wt and GPA-overexpressing BY2 cells. A, Microsomes containing 10 μg of protein from wt (white bars) or GPA-overexpressing cells (striped bars) were incubated as indicated. The activity of the enzyme is expressed as picomoles of IP3 produced per microgram of protein per minute. The values ± sd are means of two independent measurements from three different experiments. Bars with different letters are significantly different with P values calculated through the ANOVA test less than 0.05. B, One-milliliter samples of wt cells (white bars) and GPA-overexpressing cells (striped bars) were treated with the reagents indicated and IP3 measured according to the protocol described in “Materials and Methods.” The values ± sd are means of two independent measurements from four different experiments. Bars with different letters are significantly different with P values calculated through the ANOVA test less than 0.05.
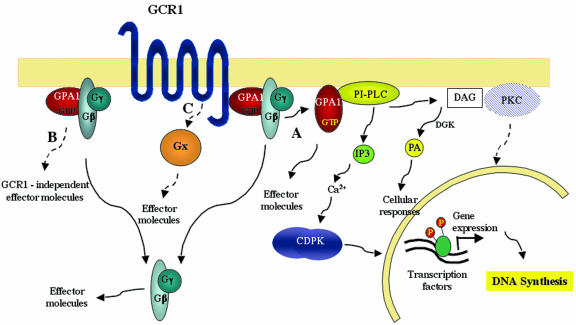
On this basis, we suggest that GCR1 and GPA1 stimulate the same signal transduction pathway that can lead to DNA synthesis and entry into the cell cycle through PI-PLC activation (Fig. 8, pathway A). This does not imply that both proteins are involved together in other GCR1- or GPA1-mediated responses, such as seed dormancy, flowering, or stomata regulation (Fig. 8, pathways B and C). In fact, it was reported that GCR1 and GPA do not appear to be implicated in the response of stomata to ABA (stomatal closure), because the Arabidopsis gcr1 null mutant did not share any of the phenotypes related to the ABA response that characterized the gpa mutants (Pandey and Assmann, 2002). Other G-proteins have been identified in plants, small G-proteins (Yang, 2002; Vernoud et al., 2003) and “extra large” G-proteins (Lee and Assmann, 1999; Assmann, 2002), and they represent potential candidates that could mediate other GCR1-activated pathways. It is known from studies with animal systems that a single receptor is able to activate more than one G-protein, depending on its conformational state and pattern of expression (Behan and Chalmers, 2001; Kenakin, 2001).
Figure 8.
Speculative model showing how GCR1 signaling may lead to DNA synthesis. Three different signaling pathways are shown. A, GCR1 stimulates PI-PLC activity through the activation of GPA1. Upon GCR1/GPA1 activation, PI-PLC produces IP3 and DAG. The scheme shows direct activation of PI-PLC by GPA1, but such activation could also be indirect. In addition, GPA1 may have other effectors not shown here. Whereas IP3 mediates the activation of CDPK, through Ca2+ level increases, DAG is immediately converted by a DAG kinase (DGK) into PA, which can in turn mediate other cellular responses. Once activated by Ca2+, CDPK regulates DNA synthesis through phosphorylation processes. PKC, activated by DAG, may also play a role in the regulation of DNA synthesis. B, Independent of GCR1, GPA1 may initiate other signaling pathways, as has been found in animal cells. C, GCR1, interacting with other GTP-binding proteins, may activate different effector molecules (these may also include PI-PLC) and therefore trigger different cellular responses. The dashed arrows represent putative pathways that have not been demonstrated to date in plants.
CONCLUSIONS
On the basis of our results, we propose a speculative model where GCR1 is responsible for the regulation of DNA synthesis through the activation of PI-PLC, IP3, and CDPK (Fig. 8, pathway A). However, we cannot rule out that the overexpression of GCR1 brings about the activation of PI-PLC in an indirect way and that there is no direct coupling between G-proteins and PI-PLC. In addition, other pathways activated by both GPA1 (pathway B) or GCR1 (pathway C) may involve other effectors and trigger different downstream responses.
Further work is needed to find out whether other GTP-binding proteins may be coupled to GCR1, what proteins are involved in mediating other GCR1-regulated processes, whether PI-PLC is a primary effector, and which CDPKs are regulated by GCR1. Having found that IP3 is one of the second messengers of GCR1 signal transduction, it will be now possible to use high throughput screening methods to find ligands and antagonists that modulate GCR1 activity.
MATERIALS AND METHODS
Cell Cultures and Transformation
Tobacco (Nicotiana tabacum cv Bright Yellow 2) cells were provided by N. Raikhel (Michigan State University, East Lansing, MI). The cloning and transformation of BY2 cells with Arabidopsis GCR1 was previously described (Colucci et al., 2002). The Arabidopsis GPA1 open reading frame was PCR-amplified from the full-length cDNA clone by using the following primers: 5′-GTTTCTAGAATGGGCTTACTCTGCAGTTAG-3′ and 5′-GAGGCTGGCCTTTTATGAGAGCTCTTTG-3′.
Primers were designed to generate an XbaI restriction site at the 5′ end and an SstI site at the 3′ end of the GPA1 open reading frame. The amplified fragment was sequenced to assure fidelity and cloned into the binary vector pCambia3300 (Krysan et al., 2002). Competent Agrobacterium tumefaciens C58 cells (Lazo et al., 1991) were transformed with the pCambia-GPA1 plasmid and used to produce transgenic BY2 cell lines. BY2 cells were transformed as described by An (1985). The selected transgenic calli were grown in the dark on selective medium containing 10 μg mL–1 phosphotricin and 500 μg mL–1 carbenicillin at 28°C and transferred to fresh medium every 4 weeks. For all the experiments, liquid cultures were obtained from calli of the different transgenic lines.
PI-PLC and Kinase Inhibitors
The PI-PLC inhibitor, U73122, its inactive analog U73343, and staurosporin were purchased from Calbiochem (La Jolla, CA). U73122 and U73343 were dissolved in DMSO and used at a final concentration of 100 μm by adding 1 μL from a 100 mm stock to 1 mL of cell suspension. Staurosporin was dissolved in DMSO and was used at a final concentration of 1 μm.
Cell Synchronization and Thymidine Incorporation
The synchronization protocol was based on the method described by Combettes et al. (1999). Ten milliliters of a 7-d-old culture was transferred in 50 mL of fresh medium supplemented with 5 μg mL–1 aphidicolin. After 24 h, the cells were washed extensively with fresh medium and resuspended in appropriate volumes, according to the experimental needs.
DNA synthesis was measured by incubating 1-mL samples of synchronized cell suspension with 1 μCi (37 KBq) of [3H]thymidine (Amersham Biosciences, Uppsala) for 30 min at room temperature in Eppendorf microtubes with gentle shaking. Cells were then collected and frozen in dry ice. The pellet was resuspended in cold 10% (w/v) TCA, containing 10 mm thymidine (Sigma-Aldrich, St. Louis). The pellet obtained by centrifugation was washed with 5% (w/v) TCA, with 70% (v/v) ethanol, and finally with acetone. The pellet was air dried and resuspended with 0.2 m NaOH, and the incorporated radioactivity was measured by scintillation counting.
PLC Assay
PLC activity was measured on microsomal membrane preparations, according to the method described by Zhang et al. (2002) with a few modifications. Membrane protein (10 μg) was incubated with 5 μL of substrate micelles in a 50-μL final volume of PLC assay buffer for 30 min at 37°C. The reaction was stopped by adding 3 volumes of 1 m HCl containing 0.5% (w/v) CaCl2, followed by 7.5 volumes of ice-cold chloroform:methanol (2:1, v/v). The two phases were separated by centrifugation, and the radioactivity in the upper phase was measured with a scintillation counter.
To prepare microsomes, cells (2–3 g) were homogenized in 10 mL of cold buffer containing 20 mm Tris-HCl (pH 7.5), 1 mm EDTA, 50 mm NaCl, 10% (w/v) glycerol, 8.5% (w/v) Suc, in presence of protease inhibitors (Sigma-Aldrich). The resulting homogenate was centrifuged for 15 min at 8,000 rpm at 4°C. The supernatant was collected, filtered through Miracloth, loaded on a cushion of 12.5% (w/v) Suc, and centrifuged at 26,000 rpm for 2 h at 4°C. The sedimented microsomes were resuspended in PLC assay buffer containing 20 mm Bis-Tris (pH 6.5), 1.5% (w/v) glycerol, 50 mm NaCl, and 100 μm CaCl2.
Substrate micelles were prepared by vortexing and sonicating 4 mm phosphatidylethanolamine, 4 mm phosphatidyl-Ser, 0.5 mm phosphatidylinositol 4,5-bisphosphate, and 2 μm [3H]phosphatidylinositol 4,5-bisphosphate (10 μCi mL–1 = 370 KBq mL–1; PerkinElmer Life Sciences, Boston) in 50 mm BisTris (pH 6.5) and 0.6% (w/v) Triton X-100.
Extraction and Quantification of IP3 Content
Samples of cells (1 mL) were centrifuged in Eppendorf microtubes for 2 min, and the pellet was resuspended in 100 μL of 20% (w/v) perchloric acid. The cells were ground with a pestle, and the insoluble material was removed by centrifugation at 15,000 rpm for 10 min at 4°C. The supernatant was collected, transferred to a new tube, and adjusted to pH 7.5 with ice-cold 1.5 m KOH in 60 mm HEPES. After removal of the sediment, the neutralized samples were used for the measurement of IP3 content with an IP3 [3H] Radioreceptor Assay kit (NEN Life Science Products, Boston) according to the manufacturer's instructions.
Kinase Assay
Cell samples (1 mL) were pelleted and resuspended in 50 μL of lysis buffer, containing 20 mm Tris-HCl (pH 8.0), 100 mm NaCl, 12 mm MgCl2, and protease inhibitors (Sigma-Aldrich). Cells were ground with a pestle in Eppendorf microtubes and centrifuged at 14,000 rpm, at 4°C for 10 min. The supernatant was collected, and the total protein present was estimated with a Bradford (1976) assay. Fifteen micrograms of total protein was used for each assay and incubated with 5 μg of histone H1 (Calbiochem) in the presence of 12.5 μm of [γ-32P]ATP (0.75 μCi = 27.7 KBq per sample; Amersham Biosciences). After 30 min of incubation at 22°C, the reaction was stopped by adding loading buffer containing 1% (w/v) SDS and boiling the tubes. The samples were fractionated by SDS-PAGE (14% [w/v] acrylamide), and the gel was dried and exposed for autoradiography for 1 h. When the radioactivity was measured, the reaction was stopped with 100 μL of 20% (w/v) TCA, and the tubes were left in ice for 1 h and centrifuged at 14,000 rpm for 15 min. The protein pellet was washed with cold 70% (v/v) ethanol twice and then resuspended in Tris buffer containing 1% (w/v) SDS. The samples were mixed with 5 mL of scintillation fluid in vials, and the radioactivity was determined.
Acknowledgments
We thank Dr. Dominic Behan for helpful discussions and useful suggestions.
Article, publication date, and citation information can be found at www.plantphysiol.org/cgi/doi/10.1104/pp.103.026005.
References
- Alexandre J, Lassalles JP, Kado RT (1990) Opening of Ca2+ channels in isolated red beet root vacuole membrane by inositol 1,4,5 trisphosphate. Nature 343: 567–570 [Google Scholar]
- An G (1985) High efficiency transformation of tobacco cells. Plant Physiol 79: 568–570 [DOI] [PMC free article] [PubMed] [Google Scholar]
- Ansari K, Martin S, Farkasovsky M, Ehbrecht I, Kuntzel H (1999) PLC binds to the receptor like GPR1 protein and controls pseudohyphal differentiation in Saccharomyces cerevisiae. J Biol Chem 274: 30052–30058 [DOI] [PubMed] [Google Scholar]
- Assmann SM (2002) Heterotrimeric and unconventional GTP binding proteins in plant cell signaling. Plant Cell 14: S355–S373 [DOI] [PMC free article] [PubMed] [Google Scholar]
- Behan DP, Chalmers DT (2001) The use of constitutively active receptors for drug discovery at the G protein-coupled receptor gene pool. Curr Opin Drug Discov Dev 4: 548–560 [PubMed] [Google Scholar]
- Bradford JM (1976) A rapid and sensitive method for the quantitation of microgram quantities of protein utilizing the principle of protein-dye binding. Annal Biochem 72: 248–254 [DOI] [PubMed] [Google Scholar]
- Cheng S-H, Willmann MR, Chen H-C, Sheen J (2002) Calcium signaling through protein kinases: the Arabidopsis calcium-dependent protein kinase gene family. Plant Physiol 129: 469–485 [DOI] [PMC free article] [PubMed] [Google Scholar]
- Colucci G, Apone F, Alyeshmerni N, Chalmers D, Chrispeels MJ (2002) GCR1, the putative Arabidopsis G protein-coupled receptor gene is cell cycle-regulated, and its overexpression abolishes seed dormancy and shortens time to flowering. Proc Natl Acad Sci USA 99: 4736–4741 [DOI] [PMC free article] [PubMed] [Google Scholar]
- Combettes B, Reichheld JP, Chabouté ME, Philipps G, Shen WH, Chaubet-Gigot N (1999) Study of phase-specific gene expression in synchronized tobacco cells. Methods Cell Sci 21: 109–121 [DOI] [PubMed] [Google Scholar]
- Coursol S, Giglioli-Guivarc'h N, Vidal J, Pierre J-N (2000) An increase in phosphoinositide-specific phospholipase C activity precedes induction of C4 phosphoenolpyruvate carboxylase phosphorylation in illuminated and NH4Cl-treated protoplasts from Digitaria sanguinalis. Plant J 23: 497–506 [DOI] [PubMed] [Google Scholar]
- Drayer AL, Van Haastert PJ (1992) Molecular cloning and expression of a phosphoinositide-specific phospholipase C of Dictyostelium discoideum. J Biol Chem 267: 18387–18392 [PubMed] [Google Scholar]
- Drobak BK, Watkins PA (1994) Inositol (1,4,5)trisphosphate production in plant cells: stimulation by the venom peptides, melittin and mastoparan. Biochem Biophys Res Commun 205: 739–745 [DOI] [PubMed] [Google Scholar]
- D'Santos CS, Clarke JH, Divecha N (1998) Phospholipid signaling in the nucleus. Biochim Biophys Acta 1436: 201–232 [DOI] [PubMed] [Google Scholar]
- Ettlinger C, Lehle L (1988) Auxin induces rapid changes in phosphatidylinositol metabolites. Nature 331: 176–178 [DOI] [PubMed] [Google Scholar]
- Hartweck LM, Llewellyn DJ, Dennis ES (1997) The Arabidopsis thaliana genome has multiple divergent forms of phosphoinositol-specific phospholipase C. Gene 202: 151–156 [DOI] [PubMed] [Google Scholar]
- Hirayama T, Ohto C, Mizoguchi T, Shinosaki K (1995) A gene encoding a phosphatidylinositol-specific phospholipase C is induced by dehydration and salt stress in Arabidopsis thaliana. Proc Natl Acad Sci USA 92: 3903–3907 [DOI] [PMC free article] [PubMed] [Google Scholar]
- Hodgkin MN, Pettitt TR, Martin A, Michell RH, Pemberton AJ, Wakelam MJO (1998) Diacylglycerols and phophatidates: Which molecular species are intracellular messengers? Trends Biochem Sci 23: 200–204 [DOI] [PubMed] [Google Scholar]
- Hyun-Sook P, Lee SS, Cho HS, An JW (2002) NtCDPK1 calcium-dependent protein kinase interacts with NtRpn3 regulatory subunit of the 26S proteasome to control cell division and differentiation in Nicotiana tabacum. American Society of Plant Biologists Plant Biology Meeting, August 3–7, Denver, CO, abstract no. 27003
- Kenakin T (2001) Inverse, protean, and ligand-selective agonism: matters of receptor conformation. FASEB J 15: 598–611 [DOI] [PubMed] [Google Scholar]
- Kost B, Lemichez E, Spielhofer P, Hong Y, Tolias K, Carpenter C, Chua NH (1999) Rac homologues and compartmentalized phosphatidylinositol 4,5-bisphosphate act in a common pathway to regulate polar pollen tube growth. J Cell Biol 145: 317–330 [DOI] [PMC free article] [PubMed] [Google Scholar]
- Kovar DR, Drobak BK, Staiger CJ (2000) Maize profiling isoforms are functionally distinct. Plant Cell 12: 583–598 [DOI] [PMC free article] [PubMed] [Google Scholar]
- Krysan PJ, Jester PJ, Gottwald JR, Sussman MR (2002) An Arabidopsis mitogen-activated protein kinase kinase kinase gene family encodes essential positive regulators of cytokinesis. Plant Cell 14: 1109–1120 [DOI] [PMC free article] [PubMed] [Google Scholar]
- Lazo GR, Stein PA, Ludwig RA (1991) A DNA transformation-competent Arabidopsis genomic library in Agrobacterium. Biotechnology 10: 963–967 [DOI] [PubMed] [Google Scholar]
- Lee Y-RJ, Assmann SM (1999) Arabidopsis thaliana `extra-large GTP-binding protein' (AtXLG1): a new class of G-protein. Plant Mol Biol 40: 55–64 [DOI] [PubMed] [Google Scholar]
- Ma H, Yanofsky MF, Meyerowitz EM (1990) Molecular cloning and characterization of GPA1, a G protein alpha subunit gene from Arabidopsis thaliana. Proc Natl Acad Sci USA 87: 3821–3825 [DOI] [PMC free article] [PubMed] [Google Scholar]
- Marinissen MJ, Gutkind JS (2001) G-protein-coupled receptors and signaling networks: emerging paradigms. Trends Pharmacol Sci 22: 368–376 [DOI] [PubMed] [Google Scholar]
- Munnik T (2001) Phosphatidic acid: an emerging plant lipid second messenger. Trends Plant Sci 6: 227–233 [DOI] [PubMed] [Google Scholar]
- Munnik T, van Himbergen JAJ, ter Riet B, Braun F-J, Irvine RF, van den Ende H, Musgrave A (1998) Detailed analysis of the turnover of polyphosphoinositides and phosphatidic acid upon activation of phospholipases C and D in Chlamydomonas cells treated with non-permeabilizing concentrations of mastoparan. Planta 207: 133–145 [Google Scholar]
- Noh DY, Shin SH, Rhee SG (1995) Phosphoinositide-specific phospholipase C and mitogenic signaling. Biochim Biophys Acta 1242: 99–113 [DOI] [PubMed] [Google Scholar]
- Pandey S, Assmann SM (2002) Functional analysis of GCR1 in Arabidopsis thaliana. XIII International Conference on Arabidopsis Research, Sevilla, Spain, June 28-July 2, abstract no. 4-71
- Perera IY, Heilmann I, Chang SC, Boss WF, Kaufman PB (2001) A role for inositol 1,4,5-trisphosphate in gravitropic signaling and the retention of cold-perceived gravistimulation of oat shoot pulvini. Plant Physiol 125: 1499–1507 [DOI] [PMC free article] [PubMed] [Google Scholar]
- Pical C, Westergren T, Dove SK, Larsson C, Sommarin M (1999) Salinity and hyperosmotic stress induce rapid increases in phosphatidylinositol 4,5-bisphosphate, diacylglycerol pyrophosphate, and phosphatidylcholine in Arabidopsis thaliana cells. J Biol Chem 274: 38232–38240 [DOI] [PubMed] [Google Scholar]
- Plakidou-Dymock S, Dymock D, Hooley R (1998) A higher plant seven-transmembrane receptor that influences sensitivity to cytokinins. Curr Biol 8: 315–324 [DOI] [PubMed] [Google Scholar]
- Shears SB (1998) The versatility of inositol phosphates as cellular signals. Biochim Biophys Acta 1436: 49–67 [DOI] [PubMed] [Google Scholar]
- Staxen II, Pical C, Montgomery LT, Gray JE, Hetherington AM, McAinsh MR (1999) Abscisic acid induces oscillations in guard-cell cytosolic free calcium that involve phosphoinositide-specific phospholipase C. Proc Natl Acad Sci USA 96: 1779–1784 [DOI] [PMC free article] [PubMed] [Google Scholar]
- Takahashi S, Katagiri T, Hirayama T, Yamaguchi-Shinozaki K, Shinozaki K (2001) Hyperosmotic stress induces a rapid and transient increase in inositol 1,4,5-trisphosphate independent of abscisic acid in Arabidopsis cell culture. Plant Cell Physiol 42: 214–222 [DOI] [PubMed] [Google Scholar]
- Tchieu JH, Fana F, Fink JL, Harper J, Nair TM, Niedner RH, Smith DW, Steube K, Tam TM, Veretnik S et al. (2003) The plantsP and plantsT functional genomics databases. Nucleic Acids Res 31: 342–344 [DOI] [PMC free article] [PubMed] [Google Scholar]
- Thompson AK, Mostafapour SP, Denlinger LC, Bleasdale JE, Fisher SK (1991) The aminosteroid U-73122 inhibits muscarinic receptor sequestration and phosphoinositide hydrolysis in SK-N-SH neuroblastoma cells: a role for Gp in receptor compartmentation. J Biol Chem 266: 23856–23862 [PubMed] [Google Scholar]
- Ullah H, Chen J-G, Young JC, Im K-H, Sussman MR, Jones AM (2001) Modulation of cell proliferation by heterotrimeric G protein in Arabidopsis. Science 292: 2066–2069 [DOI] [PubMed] [Google Scholar]
- Vernoud V, Horton AC, Yang Z, Nielsen E (2003) Analysis of the small GTPases gene superfamily of Arabidopsis. Plant Physiol 131: 1191–1208 [DOI] [PMC free article] [PubMed] [Google Scholar]
- Versele M, Lemaire K, Thevelein JM (2001) Sex and sugar in yeast: two distinct GPCR systems. EMBO Rep 2: 574–579 [DOI] [PMC free article] [PubMed] [Google Scholar]
- Yang CM, Hsiao LD, Chien CS, Lin CC, Luo SF, Wang CC (2002) Substance P-induced activation of p42/44 mitogen-activated protein kinase associated with cell proliferation in human tracheal smooth muscle cells. Cell Signal 14: 913–923 [PubMed] [Google Scholar]
- Yang Z (2002) Small GTPases: versatile signaling switches in plants. Plant Cell 14: S375–S388 [DOI] [PMC free article] [PubMed] [Google Scholar]
- Yule DI, Williams JA (1992) U73122 inhibits Ca2+ oscillations in response to cholecystokinin and carbachol but not to JMV-180 in rat pancreatic acinar cells. J Biol Chem 267: 13830–13835 [PubMed] [Google Scholar]
- Zhang XG, Coté GG, Crain RC (2002) Involvement of phosphoinositide turnover in tracheary element differentiation in Zinnia elegans L. cells. Planta 215: 312–318 [DOI] [PubMed] [Google Scholar]


