

Abstract
The translocation of fluorescently tagged PLCγ and requirements for this process in cells stimulated with EGF were analyzed using real time fluorescence microscopy applied for the first time to monitor growth factor receptor–effector interactions. The translocation of PLCγ to the plasma membrane required the functional Src homology 2 domains and was not affected by mutations in the pleckstrin homology domain or inhibition of phosphatidylinositol (PI) 3-kinase. An array of domains specific for PLCγ isoforms was sufficient for this translocation. The dynamics of translocation to the plasma membrane and redistribution of PLCγ, relative to localization of the EGF receptor and PI 4,5-biphosphate (PI 4,5-P2), were shown. Colocalization with the receptor was observed in the plasma membrane and in membrane ruffles where PI 4,5-P2 substrate could also be visualized. At later times, internalization of PLCγ, which could lead to separation from the substrate, was observed. The data support a direct binding of PLCγ to the receptor as the main site of the plasma membrane recruitment. The presence of PLCγ in membrane structures and its access to the substrate appear to be transient and are followed by a rapid incorporation into intracellular vesicles, leading to downregulation of the PLC activity.
Keywords: PLC, EGF receptor, translocation, real time imaging, SH2 and PH domains
Introduction
The hydrolysis of phosphatidylinositol 4,5-bisphosphate (PI 4,5-P2) occurs in response to a large number of extracellular signals to generate two second messengers: inositol 1,4,5-trisphosphate (I 1,4,5-P3) and diacylglycerol. In addition, this hydrolysis may also contribute to the control of cellular PI 4,5-P2 levels and in this way, regulate function of proteins that bind this lipid directly (Lee and Rhee 1995; Czech 2000). Three families of mammalian phosphoinositide-specific PLC (PI-PLC), PLCβ (β1–β4), PLCγ (γ1, γ2), and PLCδ (δ1–δ4), have been extensively studied and characterized (Katan 1998; Rebecchi and Pentyala 2000). Very recently, a new mammalian PI-PLC sequence has been reported that represents a distinct family of these enzymes; this PI-PLC has been designated as PLCε (Lopez et al. 2000; Song et al. 2000). Each family is characterized by the distinct domain organization and, at least in the case of PLCβ and PLCγ families, the type of signaling pathway that regulates enzyme activity.
PLCγ is mainly regulated through receptors with intrinsic tyrosine kinase activity (for example, growth factor receptors) or receptors (such as B and T cell antigen receptors) that are linked to the activation of nonreceptor tyrosine kinases through a complex signaling network (Lee and Rhee 1995; Katan 1998; Rebecchi and Pentyala 2000). The two isoforms of PLCγ have distinct tissue distributions. Although PLCγ1 is expressed ubiquitously, the pattern of expression of PLCγ2 is characterized by high levels in cells of hematopoetic origin. Transgenic studies suggested that the biological function of these isoforms is reflected in their cellular distribution. Thus, the mice deficient in PLCγ1 developed normally up to embryonic day 9 when a cessation of growth occurred in all parts of the embryo (Ji et al. 1997); whereas, homozygous disruption of PLCγ2 allowed normal development but resulted in functional and signaling disorders in a subset of cell types, including B cells, platelets, and mast cells (Wang et al. 2000). The expression pattern together with other factors is also likely to determine the signaling pathway to which a specific isoform is integrated in its physiological setting. However, in heterologous systems, PLCγ1 and PLCγ2 could equally fulfill the same signaling function. This has been demonstrated in both signaling via receptor (Sultzman et al. 1991) and nonreceptor (DeBell et al. 1999; Ishiai et al. 1999) tyrosine kinases. The two isoforms share high levels of sequence similarity, in particular in the region specific for the PLCγ family, which includes the pleckstrin homology (PH) domain, two Src homology (SH)2, and one SH3 domain (see Fig. 1).
Figure 1.
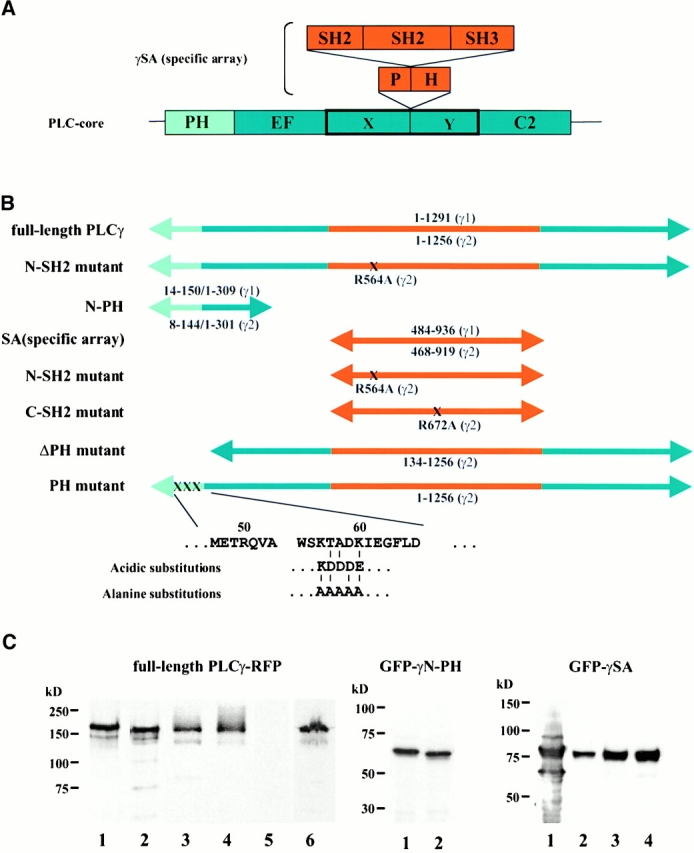
Constructs of PLCγ and their expression as fluorescent-tagged proteins. (A) The domain organization of PLCγ shows two parts: PLC core which includes the NH2-terminal PH domain (light blue), EF hands, catalytic (X and Y regions) and C2 domains (dark blue), and PLCγ-specific domain array (γSA) (orange) incorporating the “split” PH domain, two SH2 domains (N-SH2 and C-SH2), and the SH3 domain. (B) Schematic representation of the full length, deletion, and point mutations of PLCγ1 and γ2. The regions are color-coded as described in A. The amino acid residues encompassing each construct of are shown, and positions of point mutations are indicated (X). (C) The expression of different constructs have been analyzed by Western blotting of the high speed supernatant fraction prepared from transfected COS-7 cells. (Left) RFP fusion proteins of the full-length PLCγ1 (lane 1), PLCγ2 (lane 2), PLCγ2 with acidic substitutions (lane 3), or alanine substitutions (lane 4) in the PH domain, the deletion of the PH domain in PLCγ2 (lane 5), and R564A mutant in the context of the full-length PLCγ2 (lane 6). The RFP is present at the COOH terminus of these constructs. (Middle) GFP fusion proteins of the N-PH from PLCγ1 (lane 1) and PLCγ2 (lane 2). The GFP tag is present at the NH2 terminus. (Right) GFP fusion proteins of γSA region from PLCγ1 (lane 1) and PLCγ2 (lane 2) and γ2SA constructs incorporation mutations R564A (lane 3) or R672A (lane 4). The GFP fusion protein constructs have the GFP tag at the NH2 terminus. Similar results were obtained from analysis of transfected A431 cells; however, expression levels were lower.
Molecular interactions that are required for the activation of PLCγ have been best characterized in responses via growth factor receptors (including receptors for EGF, platelet-derived growth factor [PDGF], and nerve growth factor [NGF]), where the receptor directly interacts with PLCγ and phosphorylates the enzyme by the intrinsic tyrosine kinase activity of these receptors (Lee and Rhee 1995; Katan 1998; Rebecchi and Pentyala 2000; Schlessinger 2000). It has been established that the subcellular localization of PLCγ is involved in the regulation of the enzyme activity and that translocation to membrane structures is required for the subsequent increase in PI 4,5-P2–hydrolysis. The data have also suggested that in addition to the PLCγ interactions with the phosphorylated tyrosines in the cytoplasmic part of the receptors via the SH2 domains, other interactions with lipid membrane components, such as phosphatidylinositol 3,4,5-trisphosphate (PI 3,4,5-P3) and/or components of the cytoskeleton, could have an important role (Yang et al. 1994; Bae et al. 1998; Falasca et al. 1998; Rameh et al. 1998). However, due to the fast translocation and limitations of biochemical approaches and immunocytochemical analysis used in previous studies, many aspects of translocation and subcellular localization of PLCγ have not been clarified. In particular, questions related to the type of subcellular structures where interactions with the receptor or other targeting molecules are taking place at different points after the addition of a growth factor and the effects of these interactions on the access to its substrate and PLC activity remain unanswered.
In this study, PLCγ containing a fluorescent tag was analyzed in real time after stimulation of the cell with EGF. This approach, applied for the first time in studies of PLCγ, circumvented many problems encountered when using other methods. Here, we show dynamic changes in the subcellular localization of PLCγ relative to the presence of EGF receptor (EGFR) and the substrate and describe possible effects of cellular localization on stimulation and downregulation of the PLC activity.
Materials and Methods
Construction of Expression Plasmids
The construct of the PLCδ1 PH domain and catalytically inactive PLCδ1 with green fluorescent protein (GFP) were described previously (Takeuchi et al. 2000). Clones of the full-length bovine PLCγ1 and human PLCγ2 in the pMT2 vector have been described previously (Sultzman et al. 1991) and were used to make several more constructs. The DNA fragments of PLCγ1 and PLCγ2 corresponding to the NH2-terminal PH domains (encoding residues 14–150 for PLCγ1 and 8–144 for PLCγ2 and extended constructs encoding residues 1–309 for PLCγ1 and 1–301 for PLCγ2) and γSA regions (encoding residues 484–936 for PLCγ1 and 468–919 for PLCγ2) were amplified by PCR. Each fragment was subcloned into the GFP fusion protein expression vector pEGFP-C1 (CLONTECH Laboratories, Inc.) using the BglII and EcoRI restriction sites. Specific domain array (SA) region of PLCγ2 was also subcloned into pDsRed-C1 vector (CLONTECH Laboratories, Inc.), which produces a red fluorescent protein (RFP) using the BglII and EcoRI sites. Mutated γSA regions with the Arg 564 to Ala (R564A) replacement within the N-SH2 domain or Arg 672 to Ala (R672A) replacement within the C-SH2 domain in PLCγ2 were generated using two-stage PCR-based overlap extension method. Forward mutagenesis primers were: 5′-CTGGTTGCGGAGAGCGAGAC for R564A and 5′-TCCTGATCGCGAAGCGAGAGG for R672A. The PCR products were subcloned into pEGFP-C1 vector using the BglII and EcoRI sites and the sequences verified. The full-length cDNAs of PLCγ1 and PLCγ2 were subcloned into pDsRed-N1 vector (CLONTECH Laboratories, Inc.) using Eco47III and BamHI sites (pDsRed vector), NotI (filled in by mungbean nuclease [New England Biolabs, Inc.]), and BamHI. The constructs of R564A replacement in the context of the full-length was made by replacing a part of the wild-type γSA region with mutated fragments of the same region using XmnI and SacII restriction sites. For the expression in DT40 cells, the full-length cDNA of PLCγ2 was also inserted into pApuro vector (Takata et al. 1994) using EcoRI and KpnI sites. The acidic or alanine mutants of the NH2-terminal PH domain (residues 56KTADK60 to either KDDDE or AAAAA) in PLCγ2–pDsRed and –pApuro constructs were made by replacing the wild-type PH domain region with the mutated fragments generated by the PCR-based mutagenesis described above, using EcoRI sites. The forward mutagenesis primers were: 5′-TGGAGCAAGGACGACGACGAGATCGAG for acidic substitutions and 5′-TGGAGCGCGGCCGCCGCCGCGATCGAG for alanine substitutions. The deletion mutant of the PH domain in the full-length PLCγ2 construct was made by exchanging the PH and EF hand regions with only the EF hand region, which was amplified by PCR and subcloned using EcoRI sites, thus generating construct encoding amino acid residues 134–1256 of PLCγ2. The EGFR–GFP construct was described previously (Wouters and Bastiaens 1999) and used to generate another EGFR construct by replacing the GFP coding region (NotI restriction site was generated by filling in the cleaved PvuI site) with the RFP coding region from pDsRed vector (NotI restriction site was generated by filling in the cleaved BamHI site). Sequences of all fragments generated by PCR were verified by dideoxynucleotide sequencing.
Cell Culture and Transfection
A431 and COS-7 cells were cultured in DME supplemented with 10% FBS. The transfection of GFP or RFP fusion protein constructs were made using cells in a 60-mm dish (Nunc), a glass-bottomed 50-mm dish (MatTek Corporation), or on 22-mm-diameter coverslips (British Drug House) using 2.0, 0.4, or 0.8 mg of plasmid DNA, respectively, and LipofectAMINE Plus reagent (GIBCO BRL) according to the manufacturer's instructions. 0.2 mg of each DNA was used in cotransfection of EGFR and PLCγ constructs on a 60-mm dish with a coverslip at the bottom. After 24 h, cells were serum starved overnight in DME with 1% FBS before EGF stimulation. PC-12 cells were cultured and stimulated with NGF as described previously (Takeuchi et al. 2000).
DT40 cells (chicken B–lymphoma cell lines), the wild-type and PLCγ2-deficient (Takata et al. 1995), were maintained in RPMI 1640 medium supplemented with 10% FBS and 1% chicken serum at 40°C. Stable transfectants of those DT40 cells were generated as described (Takata et al. 1995). In brief, the linearized wild-type or mutant constructs of PLCγ2 were introduced into DT40 PLCγ-deficient cells by electroporation (950 V, 25 μF, ∞ Ω, Gene Pulser; Bio-Rad Laboratories). After 1 d, puromycin (0.35 μg/ml) (Sigma-Aldrich) was added to the medium. 10–12 d after the selection, colonies were picked, and the puromycin (0.2 μg/ml) selection was repeated for 5–8 d. Subsequently, the puromycin-resistant colonies were grown in normal medium for a further 5 d or until cells were growing normally.
Confocal Microscopy
To visualize responses to EGF, the transfected cells were serum-starved overnight in the presence of 1% FBS. The medium of cells cultured in glass-bottomed 50-mm dishes (MatTek Corporation) was subsequently changed to HBSS without phenol-red (GIBCO BRL). EGF (Becton Dickinson) was added at a concentration of 100 ng/ml. For the treatment with LY294002, the cells were incubated with 2–50 μM LY294002 (Calbiochem) for 40 min at 37°C before the addition of EGF.
Intracellular localization of fluorescent fusion proteins in living cells was performed on a Bio-Rad Laboratories MRC1024 confocal imaging system in conjunction with a Nikon Eclipse 600 microscope and LazerSharp software. Detection of GFP and RFP was carried out using a krypton-argon laser together with standard FITC and Texas red filter sets. The cells were imaged using a 60× plan-apo oil immersion objective. The images were recorded in 5-s intervals. The cells were analyzed at room temperature immediately after being taken out from the 37°C incubator. The white bars in the figures indicate 10 μm.
For further analysis of images, we used several programs in the LaserPix (version 4.0) package (Bio-Rad Laboratories) including intensity/optical density analysis, relative quantitation, and timecourse analysis. For single cells, cross section areas have been selected; whereas, for the fields of cells all areas of the cytoplasm and plasma membrane (corrected for the fluorescence contributed by the cytoplasm) have been used to calculate average intensities at different timepoints.
The cell staining using antibody to PI 4,5-P2 (Fukami et al. 1988) (shown not to cross react with phosphatic acid, cardiolipin, phosphatidylserine, phosphatidylethanolamine, phosphatidylcholine, PI, or PI-monophosphate [Fukami et al. 1988] and had only ∼10–20-fold lower binding to much less abundant PI P3) was as follows: after stimulation with EGF, the cells were fixed in 0.4% formaldehyde for 10 min; the cells were permeabilized for 10 min with 100 mM glycine, 0.1% Triton X-100 after which nonspecific binding was blocked by incubating for 5 min in 0.1% BSA in PBS; anti–PI 4,5-P2 antibody (1:100) was added for 1 h at room temperature; after washing, the Texas red or FITC-conjugated antibody was added for 30 min at room temperature; and the cells were then washed, mounted, and viewed by confocal microscopy.
Measurement of Intracellular Calcium Concentration
The method used to measure intracellular calcium concentrations was according to Lawrence et al. 1998. In brief, serum-starved, transfected, or nontransfected COS-7 or A431 cells on coverslips were washed with PBS and incubated with 25 mM Hepes-buffered (pH 7.0) DME, 4 μM Fura-2AM or Fura-red AM (Molecular Probes), and 5 × 10⁻⁴% Pluronic F-127 (Molecular Probes) for 30 min at room temperature and another 30 min at 37°C. After a wash with PBS, the cells on coverslips were placed onto the microscope chamber, which was kept at 37°C, and covered with 25 mM Hepes-buffered (pH 7.0) DME. The fluorescence was measured using epifluorescence optics on a Nikon Diaphot inverted microscope fitted with a CCD camera. Intracellular calcium level is expressed as the ratio of fluorescence at 340:380 nm (Fura-2AM) or 440:490 nm (Fura-red).
For measurements of intracellular calcium concentrations in DT40 cells, a cell suspension containing 5 × 10⁶ cells was loaded with 2 μM Fluo-3AM (Molecular Probes) for 1 h at room temperature. After the cells were washed with PBS, their calcium mobilization was measured at 40°C after stimulation with 10 μg/ml goat anti–chicken IgM, using a stirred suspension of cells in a LS-50B fluorimeter (PerkinElmer). The excitation was at 490 nm, and the emission was monitored at 535 nm.
Analysis of the Protein Expression and Phosphorylation by Western Blotting and/or Immunoprecipitation
Transfected COS-7 or A431 cells were harvested and resuspended in PBS buffer containing a protease inhibitor cocktail (Boehringer), sonicated, and subjected to centrifugation at 35,000 g. Aliquots of the supernatants were separated by SDS-PAGE, transferred to polyvinyldifluoride membranes, and the membrane incubated with the appropriate primary and secondary antibodies. The anti-PLCγ1 antibody (1:3,000; Upstate Biotechnology) and anti-PLCγ2 antibody (1:4,000; Santa Cruz Biotechnology, Inc.) were used to analyze the expression of all full-length PLCγ constructs. The anti-GFP antibody (1:2,500; CLONTECH Laboratories, Inc.) was used to analyze the expression of the GFP–N-PH or γSA fusion proteins. The detection of PLCγ1 phosphorylation was performed with anti-PLCγ1(pY783) phosphospecific antibody (1:2,000; BioSource International), whereas phosphorylation of PLCγ2 was monitored after immunoprecipitation (incubation with protein G–agarose-conjugated anti-PLCγ2 antibody for 1.5 h at 4°C) using antiphosphotyrosine antibody (1:1,000; Transduction Laboratories). In both cases, cellular extracts were prepared in the presence of 0.5% NP-40. The blots were visualized using ECL system (Amersham Pharmacia Biotech).
The detection of phosphorylated EGFR and protein kinase B (PKB) proteins in A431 cells was performed before and after EGF stimulation of cells preincubated in the presence or absence of LY294002 as described above. The stimulation was terminated by washing with ice-cold PBS. Cell lysates were prepared using a lysis buffer (10 mM Tris-HCl, pH 7.4, 150 mM NaCl, 1 mM EDTA, 1 mM EGTA, 1% Triton X-100, 0.2 mM PMSF, 0.5% NP-40, protease inhibitor cocktail, and phosphatase inhibitor cocktail) (Sigma-Aldrich) and the clarified lysates separated by SDS-PAGE and analyzed by Western blotting. The antiphosphotyrosine antibody (1:1,000; Transduction Laboratories) or antiphospho–PKB/Akt (Serine 473) antibody (1:1,000; New England Biolabs, Inc.) were used, followed by the incubation with an appropriate secondary antibody (anti–rabbit Ig HRP-linked whole antibody or anti–mouse Ig HRP-linked whole antibody, diluted 1:3,000) (Amersham Pharmacia Biotech).
Results
Translocation of PLCγ to the Plasma Membrane: An Essential Role of the SH2 Domains
To analyze the cellular localization of PLCγ1 and PLCγ2 in real time, molecules incorporating green (GFP) or red (RFP) fluorescence tags (placed either at the COOH or NH2 terminus of PLC) were constructed. The expression of all constructs in COS-7 or A431 cells resulted in the appearance of proteins of expected size (∼170 kD). The constructs used in most of the experiments described here, which have an RFP tag at the COOH terminus of PLCγ (PLCγ1-RFP and PLCγ2-RFP), are shown in Fig. 1. Measurements of in vitro PLC activity in the extracts of transfected cells confirmed that the constructs encoded enzymatically active PLCγ1 and PLCγ2. The cell line that has been chosen to monitor cellular localization was A431-epidermoid carcinoma cell line, where the number of receptors responding to EGF is increased. Using biochemical methods, it has been shown previously that endogenous PLCγ1 in this cell line redistributes from the cytosolic fraction to membrane fractions within minutes of EGF stimulation (Todderud et al. 1990). As shown in Fig. 2, in the absence of EGF, PLCγ1 and PLCγ2 were distributed throughout the cytoplasm and excluded from the nucleus and plasma membrane. After addition of EGF, the translocation to the plasma membrane was largely completed within 2–3 min for both PLCγ1 and PLCγ2 and was accompanied by a reduction of fluorescence in the cytoplasm (Fig. 2). This similarity between PLCγ1 and PLCγ2 translocation is consistent with previous comparisons of the two isoforms in growth factor signaling (Sultzman et al. 1991). These studies have shown that the hydrolysis of PI 4,5-P2 in response to PDGF mediated by PLCγ1 in fibroblasts, was enhanced in cells overexpressing either PLCγ1 or PLCγ2; both enzymes could undergo phosphorylation by and interaction with the receptor. Further analysis of recordings shown in Fig. 2 taken in 5-s intervals, revealed some differences between individual cells. However, in most cells the appearance of PLCγ in some parts of the membrane could be detected after 10–30 s. The area of the membrane where PLCγ was present increased with time to cover most of the membrane surface. In the majority of cells, some further increases in the membrane recruitment could be seen between 2 and 3 min. This is illustrated in Fig. 2 C and also by the kinetic analysis in Fig. 2 D, using PLCγ2 construct. The kinetic studies of translocation performed on fields of cells were consistent with the main conclusions described above, without significant differences observed between the two isoforms.
Figure 2.
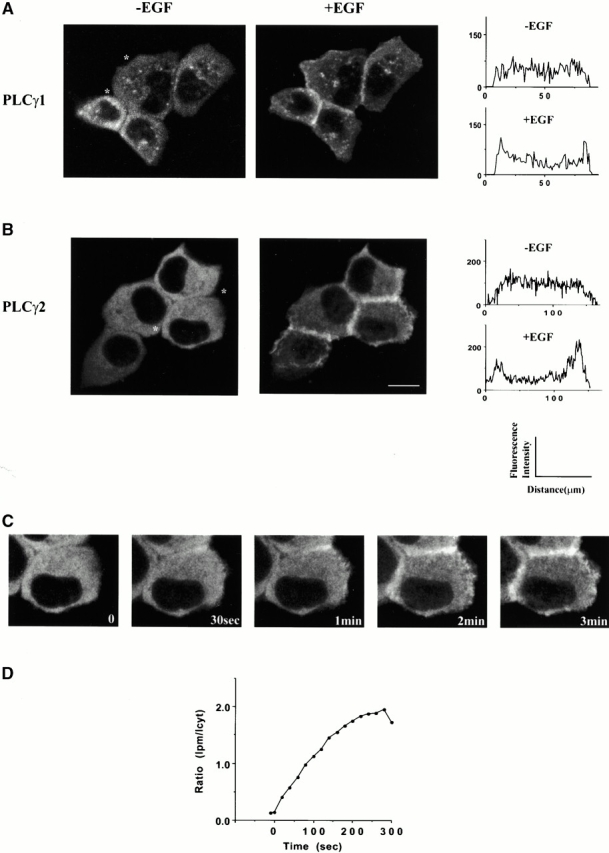
Translocation of the full-length PLCγ1- and PLCγ2-RFP proteins after EGF stimulation of A431 cells. A431 cells were transiently transfected with PLCγ1-RFP or PLCγ2-RFP fusion construct. The images of PLCγ1-RFP (A) and PLCγ2-RFP (B) were taken from a real time recording before (left) and 3 min after stimulation with 100 ng/ml of EGF (right). The relative fluorescence intensity shown in A and B has been obtained from the LaserPix analysis of cross sections of single cells (before and after stimulation); for clarity, the site used for analysis is indicated (*) in fields of unstimulated cells. Vesicular structures observed in some cells (visible in A) were not related to the expression of a particular construct or EGF stimulation. (C) Images from different timepoints of translocation of PLCγ2-RFP. (D) The kinetic analysis of translocation has been performed using 5–10 cells from the same dish and an average ratio of intensity in the areas of the plasma membrane (Ipm) and cytoplasm (Icyt) shown for every fourth frame of the recordings. The graph illustrates translocation of PLCγ2-RFP with the points within an error of ±20%. The data for PLCγ1-RFP fit a similar curve. Several cells that significantly differ from this average have not been analyzed. Typically, 50–70% of the protein translocated. Bar, 10 μm.
Several domains, including the PH domain at the NH2 terminus (N-PH), two SH2 domains (N-SH2 and C-SH2), and the SH3 domain, have been implicated in subcellular targeting of PLCγ isozymes. The importance of the SH2 domains has been best documented and related to interactions with the receptor or adapter proteins (Lee and Rhee 1995; Katan 1998; Rebecchi and Pentyala 2000). The region specific for the PLCγ family (“γ-specific array,” [γSA]) incorporates most of the domains that could play a role in translocation. The constructs of PLCγ1 and PLCγ2 containing only this region with the GFP tag placed at the NH2 terminus (GFP-γ1SA and GFP-γ2SA) have been made and found to express proteins of the predicted size (Fig. 1). These constructs, in most cells, completed translocation to the plasma membrane within 2–3 min (Fig. 3A and Fig. B); these similar timecourses were further supported by kinetic studies, when giving an average translocation for a field of cells (Fig. 3 D). However, as observed with the full-length constructs not all cells responded uniformly. In Fig. 3 C, two cells from the same field were selected to illustrate these differences. In one cell, the interaction that spread all over the membrane surface could be seen after 3 min; whereas, in the other it was completed after ∼1 min, followed by extensive membrane ruffling (see 2 and 3 min timepoints). The extensive membrane ruffling could be seen in some but not all cells responding to EGF and was usually prominent at later timepoints.
Figure 3.
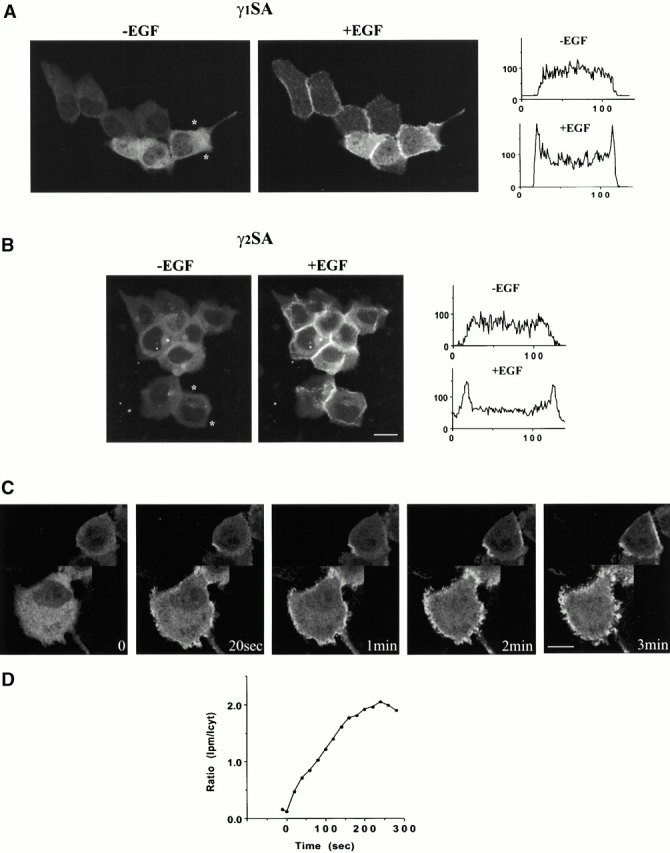
Translocation of γ-specific domain array from PLCγ1 and PLCγ2 in A431 cells after EGF stimulation. A431 cells were transfected with constructs containing γ-specific array of domains and analyzed before and after stimulation with EGF (100 ng/ml). The images show cells transfected with GFP-γ1SA (A) and GFP-γ2SA (B) constructs before (left panels) and 2 min after stimulation with EGF (right panels). The different timecourses of GFP-γ2SA translocation in two cells from the same field are shown in C. The relative fluorescence intensity of selected cross sections in A and B and the kinetic study of an average translocation illustrated by GFP-γ2SA (D) was analyzed as described in the legend to Fig. 2. Bars, 10 μm.
To further analyze which domains within the γSA region could be involved in translocation, point mutations were introduced into the N- and C-SH2 domains. Replacements of Arg586 (N-SH2) and Arg694 (C-SH2) in PLCγ1 and Arg564 (N-SH2) and Arg672 (C-SH2) in PLCγ2 have been shown previously to interfere with the function of these enzymes (Chattopadhyay et al. 1999; DeBell et al. 1999; Ishiai et al. 1999; Ji et al. 1999; Poulin et al. 2000). Both SH2 domains are highly conserved between the two isozymes (93% similarity). The mutation Arg564Ala or Arg672Ala, introduced in the context of GFP-γ2SA or PLCγ2-RFP (GFP-γ2SA R564A, GFP-γ2SA R672A, and PLCγ2 R564A-RFP), did not reduce protein expression (Fig. 1). As shown in Fig. 4, these mutations completely prevented translocation to the membrane after the addition of EGF.
Figure 4.

Mutations in the SH2 domains. The effects of mutations in N-SH2 or C-SH2 domain were analyzed using PLCγ2R564A-RFP, GFP-γ2SA R564A, and GFP-γ2SA R672A constructs 3 min after EGF stimulation. (A) The images show cellular localization of PLCγ2-RFP containing the wild-type sequences (left) compared with PLCγ2R564A-RFP (right). (B) Cellular localization of the wild-type GFP-γ2SA (left), GFP-γ2SA R564A (middle), and GFP-γ2SA R672A (right) constructs. Bars, 10 μm.
Analysis of Requirements for the NH2-terminal PH Domain
To assess the role of the PH domain in the translocation of PLCγ, this domain from both PLCγ1 and PLCγ2 was expressed in isolation as a GFP fusion protein (GFP-γ1N-PH and GFP-γ2N-PH) (Fig. 1). In addition, the deletion and point mutations within the NH2-terminal PH domain have been introduced in the context of the full-length PLCγ2 protein (Fig. 1). When analysis of the isolated PLCγ PH domains was performed, the PH domain from PLCδ1 was used for comparison. As shown previously in several cell types (Katan and Allen 1999), the PLCδ1 PH domain associated with the membrane of unstimulated cells (Fig. 5 A). In contrast, GFP-γ1N-PH and GFP-γ2N-PH were not present at the membrane of unstimulated cells and the staining observed in the cytoplasm and nucleus; the later was more prominent for the GFP-γ2N-PH. After EGF stimulation, the PH domain constructs could be seen associated with the membrane (Fig. 5 A) as observed previously for the PLCγ1 PH domain in PDGF-treated fibroblasts (Falasca et al. 1998). However, the membrane association could be seen in some but not all cells that express these constructs (Fig. 5 A, middle and bottom right panels). Furthermore, this membrane localization was most prominent after 8 min, later than observed for the full-length proteins or the γSA constructs.
Figure 5.
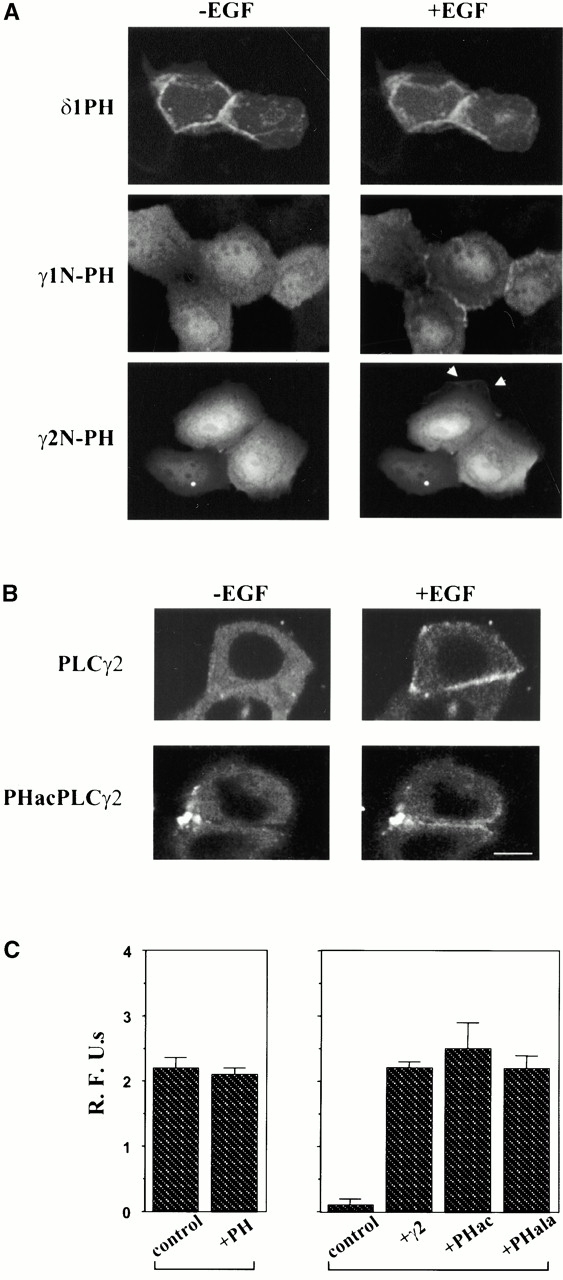
Analysis of the NH2-terminal PH domain of PLCγ. (A) Cells were transfected with GFP fusion constructs of isolated PH domains from PLCδ1 (top), PLCγ1 (middle), or PLCγ2 (bottom) and analyzed before (left) or 5–8 min after stimulation with EGF (right). (B) Effect of the acidic substitutions in the PLCγ2 PH domain on membrane localization was analyzed using the full-length PLCγ2 constructs. The images show a comparison of PLCγ2-RFP (top) and PHacPLCγ2-RFP (bottom) analyzed before (left) and 2 min after (right) addition of EGF. (C) Several DT40 cell lines were used to measure calcium responses after stimulation with M4 antibody (10 μg/ml). (Left) The wild-type DT40 cells (control) and the wild-type cells stably transfected with the γ2 N-PH-GFP (+PH) construct; (right) the PLCγ2-deficient cells (control) and the PLCγ2-deficient cells stably transfected with the full-length PLCγ2 (+γ2) or the full-length constructs with the acidic (+PHac) or alanine (+PHala) mutation in the PH domain. Bar, 10 μm.
For further analysis, we attempted to introduce deletion and point mutations of the PH domain in the context of the full-length protein. Attempts to delete the PH domain of PLCγ2 proved incompatible with the expression of the soluble functional protein (it was exclusively in the pellet and inactive), suggesting its essential structural role. Instead, mutations were introduced in the PH domain based on a previous study, restricted to the isolated PH domain of PLCγ1 (Falasca et al. 1998). It has been reported that the replacement of several residues within the β3–β4 loop (to create a region of negative charges) prevented PDGF-induced and wortmannin-sensitive association with the membrane in cells and the specific binding of the PI 3,4,5-P3 headgroup by the isolated PH domain in vitro (Falasca et al. 1998). Since PLCγ1 and PLCγ2 have similar sequences and identical positions of positively charged residues in this region, the same replacement has been introduced (57TADK60 replaced by 57DDDE60) into the full-length PLCγ2; in addition, the alanine substitutions have also been made (mutation of 56KTADK60 to 56AAAAA60). Unlike the deletion of the PH domain, the expression of these mutants (PHacPLCγ2-RFP and PHalaPLCγ2-RFP) was the same as for the wild-type PLCγ2 (Fig. 1). The translocation of PLCγ2 incorporating the substitutions in the N-PH was analyzed after stimulation of A431 cells with EGF. The membrane translocation of the wild type and the proteins incorporating the mutations could be clearly seen 3 min after stimulation. This is illustrated by the acidic substitution in Fig. 5 B. Further kinetic analysis did not show any substantial changes (not shown). Tyrosine phosphorylation of these mutants was also comparable with the wild-type construct (Fig. 6 B), and based on the analysis of PLCγ1 constructs where sequence specific antiphosphotyrosine antibody is available (Fig. 6 A), the phosphorylation is likely to occur at physiologically relevant sites.
Figure 6.
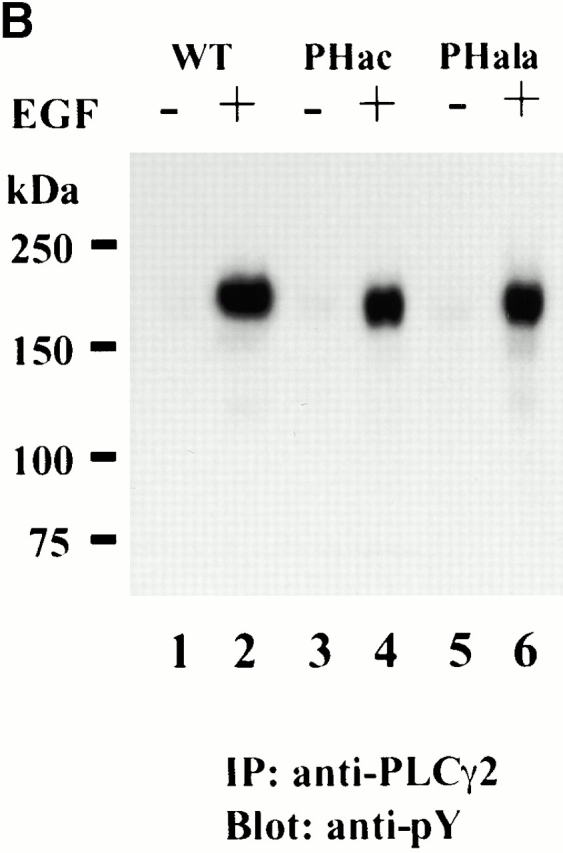
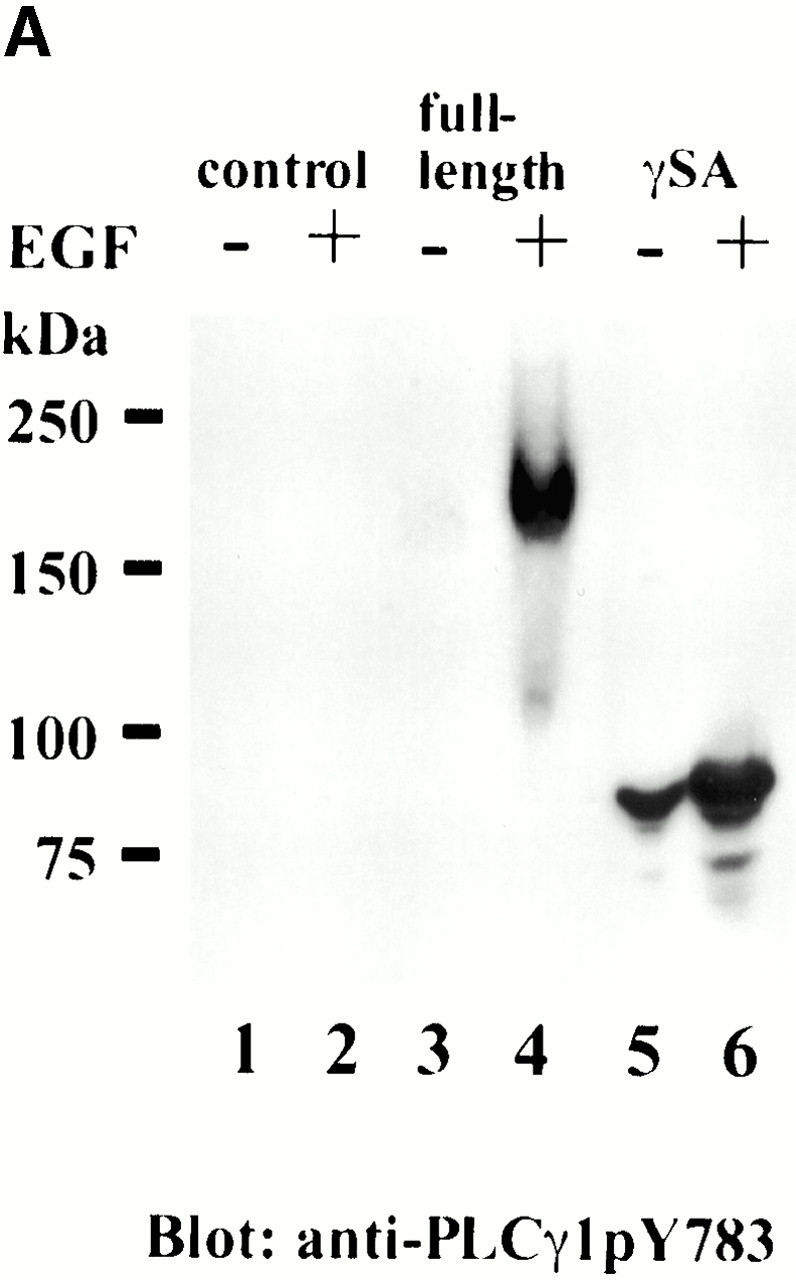
Phosphorylation of PLCγ1 and PLCγ2 constructs after EGF stimulation. Transfected COS-7 cells were incubated with or without EGF (100 ng/ml) for 5 min, and cell lysates were either analyzed by Western blotting with anti-PLCγ1(pY783) antibody when PLCγ1 constructs were used or subjected to immunoprecipitation with anti-PLCγ2 antibody followed by Western blotting with antiphosphotyrosine antibody for PLCγ2 constructs. (A) Nontransfected (lanes 1 and 2) and cells transfected with PLCγ1-RFP (lanes 3 and 4) or GFP-γ1SA (lanes 5 and 6) were analyzed before (lanes 1, 3, and 5) or after (lanes 2, 4, and 6) EGF stimulation. In the case of GFP-γ1SA, some phosphorylation could be seen before EGF stimulation but was clearly stimulated after the addition of the agonist. (B) RFP fusion proteins of the full-length PLCγ2, the wild-type (lanes 1 and 2), acidic mutant in the PH domain (lanes 3 and 4), and alanine mutant in the PH domain (lanes 5 and 6) were analyzed before (lanes 1, 3, and 5) and after (lanes 2, 4, and 6) EGF stimulation.
Finding that the N-PH domain may not play a role in the initial translocation to the membrane suggested that it could be important for some other steps involved in the stimulation of PLCγ. To test this, we used a PLCγ-deficient B cell line (PLCγ2−/DT40). After stimulation of B cell antigen receptor, an increase in intracellular free Ca2+ concentrations has been attributed to highly expressed PLCγ2 in normal B lymphocytes (Wang et al. 2000). This can be reconstituted by either PLCγ1 or PLCγ2 in the PLCγ2−/DT40 cells (DeBell et al. 1999; Ishiai et al. 1999). Furthermore, it has been shown that N- or C-SH2 mutants in either isozyme were not able to restore the function of PLCγ in these cells (DeBell et al. 1999; Ishiai et al. 1999). As expected, the wild-type PLCγ2 fully restored the calcium responses in PLCγ2−/DT40 cells stably transfected with this construct (Fig. 5 C, right). Analysis of the stable cell lines obtained with the full-length constructs incorporating mutations within the PH domain (PHacPLCγ2 and PHalaPLCγ2), demonstrated the same calcium responses as seen with the wild-type PLCγ2 (Fig. 5 C, right). The same experimental system, stimulation of DT40 cells with the M4 antibody, was used to test a possible dominant-negative function of the isolated PH domain, which has been suggested in previous studies using fibroblasts stimulated with PDGF (Falasca et al. 1998). As shown in Fig. 5 C (left), in DT40 cells stably expressing GFP-γ2N-PH (lane 2), the calcium responses were comparable with the responses in the wild-type DT40 cells (lane 1).
Colocalization of PLCγ with the EGFR Visualized Using Red and Green Fluorescent Tags
The GFP-tagged EGFR construct (EGFR-GFP) used in this study, has been analyzed previously and shown to encode a stable protein that undergoes phosphorylation and internalization after stimulation of transfected COS cells with EGF (Wouters and Bastiaens 1999). The red tag version (EGFR-RFP) was also made by replacing the GFP portion at the COOH terminus of the EGFR construct. These constructs were used to compare the localization of EGFR with that of the full- length or γ-specific domain array of PLCγ2, using a combination of red and green fluorescent tags expressed in the same cell.
Cells coexpressing the EGFR-RFP and the array of domains from PLCγ2 as a GFP fusion protein, γ2SA-GFP, were analyzed first (Fig. 7). Before stimulation, EGFR-RFP was present at the plasma membrane (Fig. 7 A, right, top and bottom). Although high levels of expression of the GFP-γ2SA construct could be seen throughout the cytoplasm of COS-7 cells, the plasma membrane association could not be detected before EGF stimulation (Fig. 7 A, left, top and bottom). The merge of the enlarged areas was red due to presence of only the EGFR fluorescent tag. After stimulation, the GFP-γ2SA construct first appeared in some parts of the membrane (similar to distribution in A431 cells in Fig. 2) and spread across the membrane surface within 1 min (Fig. 7B, left, top and bottom). As seen in the merge, the membrane color has become yellow, due to colocalization with the green fluorescence from γ2SA-GFP after EGF stimulation. Similar translocation and membrane colocalization after the EGF treatment have been observed in cells expressing red-tagged receptor and green full-length PLCγ2 or the EGFR-GFP and PLCγ2-RFP constructs. In the later case, the color of the merge was changed from green to yellow (data not shown).
Figure 7.


Analysis of PLCγ2 colocalization with the EGFR. Localization of γSA region and EGFR is shown for a timepoint before (A) and 1 min after (B) EGF stimulation. COS-7 cells were cotransfected with GFP-γ2SA and EGFR-RFP and analyzed for green (left) and red (right) fluorescence. A selected area (white rectangle) has been enlarged and in addition to images obtained by analyzing only green (left) and red (right) fluorescence includes a merge (middle) of the two. Bar, 10 μm.
In some cells and in particular at later timepoints after stimulation, extensive ruffling could be observed. In cells where ruffling was prominent, the EGFR distribution (followed by the green fluorescent tag) appeared to be uneven, with the majority of the receptor present in areas of membrane ruffles (Fig. 8 A). Distribution of the full-length PLCγ2 (with the red fluorescence tag) in the same cell demonstrated that PLCγ2 was localized in areas where EGFR was present. However, PLCγ2-RFP did not cover all areas of the membrane where EGFR-GFP could be detected, and as seen in Fig. 8 A some areas contained only EGFR. However, it is difficult to distinguish between different possibilities that could explain this distribution. The possibilities include complex formation in “preferred” areas of the membrane or a quick dissociation and separate internalization of PLCγ2.
Figure 8.


Internalization of PLCγ2 and EGFR after stimulation with the EGF. COS-7 cells were cotransfected with the full-length PLCγ2-RFP and EGFR-GFP constructs, and the same cells were analyzed for red (left) and green (right) fluorescence. Images taken from the real time recording correspond to 2 min (A) and 15 min (B) timepoints after addition of EGF. For the enlarged areas, the merge of red and green fluorescence is shown in the middle. It is estimated that a similar proportion (50–70%) of PLCγ that translocates to the membrane becomes associated with the vesicles. Bar, 10 μm.
The internalization of the EGFR and PLCγ2, coexpressed in a single cell, could also be studied after EGF stimulation. The appearance of small intracellular vesicles could be seen within minutes after stimulation (Fig. 8 A), which subsequently increased in size (Fig. 8 B); this was visualized for both EGFR-GFP (right, top and bottom) and PLCγ2-RFP (left, top and bottom). As shown in Fig. 8 B, ∼15 min after EGF stimulation, most of the EGFR was associated with the migrating intracellular vesicles shown previously to represent endosomes undergoing fusion and forming vesicular swellings (Carter and Sorkin 1998). Some receptor also localized at the membrane (Fig. 8 B, right, top and bottom). At the same time, PLCγ2 was entirely associated with the intracellular vesicles (Fig. 8 B, left, top and bottom). Further analysis of the areas containing the intracellular vesicles revealed colocalization of PLCγ2-RFP and EGFR-GFP constructs in many of these structures. However, some vesicles seem to contain only EGFR or only PLCγ2. These data suggest that the internalization paths of EGFR and PLCγ2 could be, at least in part, separate.
Localization of PI 4,5-P2
In addition to biochemical studies, the metabolism and localization of PI 4,5-P2 have been monitored using reagents that specifically bind to this inositol lipid. In particular, the PH domain of PLCδ1 has been shown to bind PI 4,5-P2 present in the plasma membrane (Katan and Allen 1999). Using GFP constructs of the isolated PLCδ1 PH domain (or the catalytically inactive full-length PLCδ1), the membrane localization could be seen before and after stimulation with EGF (Fig. 5 A). Antibody specific to PI 4,5-P2 was also used, and in this case the staining was more clearly seen in the membranes of stimulated cells. In addition, staining of perinuclear area and Golgi could be seen in some cells using the antibody and was not strictly dependent upon cell stimulation (Fig. 9a and Fig. b). As reported previously (Varnai and Balla 1998), these intracellular structures could also be visualized by the PLCδ1 PH domain, but its localization was less prominent in these structures than in the plasma membrane. This difference could be due to the different affinities or accessibility of the two probes. Nevertheless, in cells with membrane ruffles where the distribution of GFP-PLCδ1 was uneven it could be clearly seen that staining with the antibody to PI 4,5-P2 completely colocalized with the green fluorescence in these structures. As shown in Fig. 9 C, at the timepoints when some of the PLCγ remained on the membrane although the larger portion has been internalized into intracellular vesicles, PI 4,5-P2 and PLCγ colocalized only at the membrane. This can be concluded from direct comparisons of PLCγ distribution and staining with anti–PI 4,5-P2 antibody in the same cell (Fig. 9 C) and from observations that PLCδ1 (the full-length or the PH domain) or the antibody to PI 4,5-P2 did not show internalization into intracellular vesicles at times when PLCγ was present in this compartment. This suggests that after internalization, PI 4,5-P2 was not available to PLCγ, even if the enzyme could still be phosphorylated and/or present in a complex with the receptor.
Figure 9.


Visualization of PI 4,5-P2 in growth factor stimulated cells. (A) PC12 cells transfected with the isolated PH domain from PLCδ1 (GFP-δ1PH) construct were stimulated with NGF for 10 min and subsequently fixed and permeabilized. The cells were stained using anti–PI 4,5-P2 antibody and Texas red–conjugated secondary antibody (left) and were also analyzed for the green fluorescence of the δ1PH domain construct (right). (B) A431 cells were analyzed 10 min after EGF stimulation as described in A, except that the full-length catalytically inactive PLCδ1 was used instead of the isolated PH domain. (C) A431 cells transfected with PLCγ2-RFP were analyzed 10 min after EGF stimulation. Staining with the anti–PI 4,5-P2 antibody was visualized using FITC-conjugated secondary antibody (left), and the red fluorescence of the PLCγ2-RFP construct was analyzed (right). All enlarged areas also include a merge of red and green fluorescence in a middle. Bar, 10 μm.
In agreement with previous observations (Varnai and Balla 1998), our analysis of the localization of the PLCδ1 PH domain did not reveal detachment of this domain from the membrane at times (1–2 min) of I 1,4,5-P3 formation and calcium release triggered by growth factors (data not shown). This could be due to a smaller portion of PI 4,5-P2 hydrolyzed when compared with the system where the detachment could be seen (Varnai and Balla 1998) or, as suggested in HeLa cells stimulated by EGF, due to a rapid stimulation of PI 4,5-P2 resynthesis by growth factors (Honda et al. 1999).
Effects of the PI 3-Kinase Inhibitor LY294002
The effects of PI 3-kinase inhibitors, wortmannin, and a more specific LY294002 compound on I 1,4,5-P3 formation and calcium mobilization have been observed after PDGF stimulation, resulting in the reduction of these responses (Bae et al. 1998; Falasca et al. 1998; Rameh et al. 1998). Furthermore, it has been suggested that the products of PI 3-kinase could affect PLCγ1 activity and bind to the N-PH domain and/or C-SH2 domain (Bae et al. 1998; Rameh et al. 1998). However, the inhibition of PI 3-kinase had no effect on PLCγ1 phosphorylation and the receptor binding (Falasca et al. 1998; Rameh et al. 1998). To examine the effect of LY294002 compound on PLCγ translocation, we first analyzed inhibition of phosphorylation of PKB within the range commonly tested in cells (0–50 μM) and demonstrated that even higher concentrations (50 μM) did not inhibit EGFR phosphorylation nonspecifically, which would otherwise interfere with the translocation (Fig. 10 A). Even with higher concentrations of LY294002, translocation of PLCγ2-RFP to the membrane could be seen (Fig. 10 B, left) and was comparable to the timecourse of translocation in untreated cells. Similarly, no effect of LY294002 has been seen on the translocation of GFP-γ1 and -γ2SA or γ1- and γ2N-PH constructs (data not shown). Furthermore, the appearance of PI 4,5-P2 in membrane ruffles was also unaffected by LY294002 treatment (Fig. 10 B, right).
Figure 10.


Effects of PI 3-kinase inhibitor LY294002. (A) Effects of PI 3-kinase inhibition on phosphorylation of PKB and EGFR in A431 cells were followed after pretreatment with LY294002 for 40 min and subsequent stimulation with 100 ng/ml EGF for 15 min. The phosphorylation of PKB was detected by Western blotting using anti–phospho-PKB (Ser473) antibody at concentrations 0–50 μM LY294002 (left), whereas the effect of 50 μM LY294002 on phosphorylation of EGFR (resulting in some enhancement rather then inhibition) was monitored using antiphosphotyrosine antibody (right). (B) Effect of PI 3-kinase inhibition on translocation of PLCγ2 was followed in A431 cells expressing the full-length PLCγ2-RFP. The cells were treated with 50 μM LY294002 for 40 min before EGF stimulation for 3 min (left). EGF-stimulated A431 cells pretreated with LY294002 were analyzed using anti–PI 4,5-P2 antibody (right) as described in the legend to Fig. 9 B. (C) For intracellular Ca2+ measurements, Fura-red–labeled A431 cells were incubated without (control) or with 10 or 50 μM LY294002 (+LY) for 40 min at 37°C, followed by the stimulation with EGF (100 ng/ml) (arrows). The results shown are representative of average responses obtained by analyzing ∼20 individual cell for each condition. Bar, 10 μm.
The calcium responses to the stimulation by a growth factor (for example, PDGF) could usually be detected after 20–40 s with a duration of 2–3 min (Rameh et al. 1998; Poulin et al. 2000). Similar responses were detected using EGF stimulation of A431 (Fig. 10 C) or COS-7 cells (data not shown). Reduction in calcium responses to EGF stimulation could also be detected in these cells in the presence of 10 μM LY294002, but the effect was more pronounced at 50 μM LY294002 (that is, reduced further from ∼20 to 50%) (Fig. 10 C). Since inhibition of PI 3-kinase activity (shown by PKB phosphorylation, Fig. 10 A) seems to be complete at 10 μM LY294002, it is possible that the binding to other targets could be responsible for the effects on calcium responses using 50 μM LY294002.
Discussion
To follow the cellular localization of PLCγ in real time, cells expressing PLCγ containing a fluorescent tag were stimulated by EGF known to activate this enzyme after binding to EGFR (Schlessinger 2000). After stimulation, PLCγ, which is in unstimulated cell present in the cytoplasm, undergoes several stages of subcellular redistribution, including fast but progressive attachment to the plasma membrane, followed by concentration in areas of extensive membrane ruffling and incorporation into intracellular vesicular structures.
As shown in Results, the initial translocation first occurred in some parts of the plasma membrane and then spread to all areas where the receptor was present. This gradual appearance at different parts of the membrane is unlikely to be due to differences in the amounts of the receptor, since it could be observed in cells where the receptor molecules containing the fluorescent tag were evenly distributed around the membrane. Use of the deletion and point mutations demonstrated that all determinants for PLCγ translocation to the plasma membrane are within the region unique for the PLCγ family, which is well conserved between the two isoforms and is likely to involve the function of both SH2 domains (Fig. 3 and Fig. 4). A requirement for both SH2 domains of PLCγ is consistent with a previous in vitro binding study of isolated SH2 domains to phosphorylated peptides from EGFR, suggesting simultaneous binding to two different parts of the receptor (binding of N-SH2 to pY1173 in the EGFR and binding of C-SH2 to pY992 in the EGFR) (Chattopadhyay et al. 1999). Furthermore, mutations in the N- or C-SH2 domain abolished the interaction with the receptor and affected the rate of PLCγ phosphorylation in cells stimulated with EGF (Chattopadhyay et al. 1999). However, the involvement of only N-SH2 domain of PLCγ in binding to the receptor or adapter proteins has been shown for signaling via PDGF receptor (Ji et al. 1999; Poulin et al. 2000) and B cell antigen receptor (DeBell et al. 1999). It was also suggested that the functional C-SH2, although not required for the translocation, could be important for activation, leading to an increase in the rate of PI 4,5-P2 hydrolysis (DeBell et al. 1999; Ji et al. 1999). Evidence obtained from an in vitro study of PLCγ activity in the presence of the PDGF receptor peptide supported the possibility that binding to the receptor could cause allosteric changes and stimulate PLC activity (Koblan et al. 1995). Thus, the role of PLCγ binding to the receptor via its SH2 domains may not be restricted to translocation to the membrane and, together with PLCγ phosphorylation, could contribute to stimulation of PLCγ activity. The colocalization of PLCγ and the receptor observed at early timepoints at the plasma membrane, where the presence of the PI 4,5-P2 substrate can also be visualized, seem to coincide with the peak of calcium responses, thus suggesting that the enzyme is fully active (Fig. 5, Fig. 7, and Fig. 10).
The experiments using the isolated γSA demonstrated that it contains all of the determinants required for translocation. Together with the mutations in the N-PH domain, these data do not support the possibility that the PH domain–mediated translocation precedes the interaction with the receptor or contributes to the stability of the complex, as suggested in earlier studies (Falasca et al. 1998). Furthermore, possible interactions with PI 3,4,5-P3 by the PH domain or through the C-SH2 domain shown in vitro (Falasca et al. 1998) do not seem to be required for the translocation, since this process has not been affected in the presence of the PI 3-kinase inhibitor (Fig. 10 B). These observations are consistent with earlier findings that the PI 3-kinase inhibitors had no effect on PLCγ phosphorylation and the enzyme–receptor complex formation detected by coimmunoprecipitation (Falasca et al. 1998; Poulin et al. 2000). However, it has been documented previously (Bae et al. 1998; Falasca et al. 1998; Rameh et al. 1998) that wortmannin, LY294002, and dominant-negative PI 3-kinase could cause reduction of I 1,4,5-P3 and calcium responses to PDGF, suggesting that possible interactions between PI 3,4,5-P3 and PLCγ may be important for activation. However, understanding of molecular basis and specificity of this potential link would require further studies. Regarding the role of the N-PH domain, its contribution to this process could differ, depending on the specific signaling pathway or PLCγ isoform. In contrast to the suggested involvement of this domain in PLCγ1 signaling in response to PDGF (Falasca et al. 1998), in B cells the mutations in the PLCγ2 PH domain (shown to block PI 3,4,5-P3 binding to the PH domain of PLCγ1) did not interfere with the function of PLCγ2 (Fig. 5 C).
In cells characterized by extensive ruffling prominent after several minutes of stimulation, PLCγ, EGFR, and PI 4,5-P2 were all localized in the most dynamic areas at the cell periphery (Fig. 8 and Fig. 9). Previous studies have suggested that cytoskeletal proteins are included in these structures. For example, the PI 4,5-P2–bound PLCδ1 PH domain and F actin colocalize in membrane ruffles (Tall et al. 2000). Although there is no direct evidence, PLCγ could be bound to EGFR in these structures since PLCγ has not been detected in any parts of the membrane where the receptor was not present (Fig. 8). The presence of the substrate in the same structures (Fig. 9) suggests the possibility that it could be hydrolyzed by the enzyme. Furthermore, earlier studies have demonstrated that only phosphorylated PLCγ could hydrolyze PI 4,5-P2 bound to profilin (Goldschmit-Clermont et al. 1991). However, this potential hydrolysis of PI 4,5-P2 at later timepoints after EGF stimulation is unlikely to contribute to calcium mobilization and could be involved in PI 4,5-P2 functions related to the organization of the cytoskeleton. This PI 4,5-P2/cytoskeleton link has been demonstrated in several studies (Czech 2000); however, the nature and molecular aspects of this relationship have not been clarified.
Previous experiments using EGFR-GFP have enabled studies of EGFR endocytosis and visualized fragile endosomal structures (Carter and Sorkin 1998), circumventing problems of immunocytochemistry. It has also been documented that EGFR is in these structures in the EGF-bound form and highly phosphorylated (Carter and Sorkin 1998; Wouters and Bastiaens 1999). Furthermore, it has been suggested that interactions with and activation of several adapter and effector molecules (for example, components of the Ras pathway) could be taking place in endosomes (Baass et al. 1995; Bevan et al. 1996). Analysis of the internalization of PLCγ in the same cell-expressing EGFR, demonstrated a similar pattern of endosomal movements where swelling and fusion were taking place followed by the formation of larger perinuclear structures (Fig. 8). However, colocalization of PLCγ and the receptor may be only partial (Fig. 8), and PLCγ appeared to be completely separated from its substrate (Fig. 9). Therefore, in the case of PLCγ the incorporation into intracellular vesicles is likely to lead to downregulation of the enzyme activity. This is further supported by findings that growth factor stimulation results in an early and transient peak of calcium release (Fig. 10; Rameh et al. 1998; Poulin et al. 2000). Several other observations are also consistent with this possibility. For example, in cells defective in endocytosis some signaling molecules that could serve as a substrate in endosomes were underphosphorylated, whereas PLCγ was hyperphosphorylated, suggesting that the main site of interaction and phosphorylation with EGFR is in the plasma membrane (Vieira et al. 1996). In another biochemical study, the formation of I 1,4,5-P3 in response to growth factor stimulation was analyzed under conditions where the EGFR internalized either as a ligand–bound complex or largely free from the ligand (Haugh et al. 1999). By comparing the ratio of activated receptors at the cell surface and in the internalized compartment, it was concluded that only cell surface receptors effectively participated in PLCγ signaling.
In this study, the two PLCγ isoforms were compared (Fig. 1 Fig. 2 Fig. 3, Fig. 5, and Fig. 6) and found to be remarkably similar in all aspects of EGFR-triggered translocation. Although PLCγ1 has been more extensively studied in this context, it has been demonstrated that at least in transfected cells both PLCγ1 and PLCγ2 can bind to and be activated by growth factor receptors (Sultzman et al. 1991). Furthermore, studies of PLCγ2 have shown that in addition to high levels of expression in some hematopoietic cells, this isoform is present in many different cell types and tissues (Rebecchi and Pentyala 2000). Therefore, it is possible that both PLCγ1 and PLCγ2 could signal in pathways via growth factor receptor and nonreceptor tyrosine kinases. When isolated domains from PLCγ1 and PLCγ2 were compared, again the γSA regions and the PH domains demonstrated similarity between the isoforms (Fig. 3 and Fig. 5). In the case of the PH domains, as shown earlier for the PLCγ1 PH domain (Falasca et al. 1998), translocation can be seen; however, translocation of isolated γSA region from both isoforms followed kinetics of the full-length proteins and further mutagenesis (not performed in the study by Falasca et al. 1998) suggested that this part contains all determinants that drive translocation. Further comparative studies of the role for the PH domain in both membrane interactions and activation are, however, required to fully understand the function of this domain in each of the PLCγ isoforms.
In conclusion, the data presented here obtained from the real time fluorescence imaging have provided new insights into a sequence of changes in subcellular localization and function of PLCγ after stimulation with EGF. Together with experimental evidence obtained previously using different experimental approaches, the following model could be suggested. First, PLCγ undergoes rapid translocation to the plasma membrane. This step requires direct interaction with the activated receptor via the SH2 domains and leads to subsequent stimulation of PLC activity, resulting in an increase in the rate of PI 4,5-P2 hydrolysis present in the membrane. PLCγ, that still could be in a complex with the receptor and active, is in some cells localized in membrane ruffles that are prominent at later times after stimulation. The internalization of PLCγ into endosome-like structures is likely to result in the downregulation of PLC activity, which may no longer have access to its substrate.
Acknowledgments
We are grateful to Dr. Kyoko Fukami for the anti–PI 4,5-P2 antibody, Dr. Fred Wouters for the EGFR-GFP construct, Dr. Ron Kriz for the cDNAs of PLCγ1 and PLCγ2, Dr. Tomohiro Kurosaki for the expression vector pApuro, and Dr. Tim Howkin for help with stable DT40 cells.
This work was supported by grants from The Cancer Research Campaign.
Footnotes
Abbreviations used in this paper: EGFR, EGF receptor; γSA, PLCγ-SA; GFP, green fluorescent protein; I, inositol; I 1,4,5-P3, I 1,4,5-trisphosphate; NGF, nerve growth factor; PDGF, platelet-derived growth factor; PH, pleckstrin homology; PI, phosphatidylinositol; PI 4,5-P2, PI 4,5-bisphosphate; PI 3,4,5-P3, PI 3,4,5-trisphosphate; PI-PLC, phosphoinositide-specific PLC; RFP, red fluorescent protein; SA, specific domain array; SH, Src homology.
References
- Baass P.C., Di Guglielmo G.M., Authier F., Posner B.I., Bergeron J.J.M. Compartmentalized signal transduction by receptor tyrosine kinases. Trends Cell Biol. 1995;5:465–470. doi: 10.1016/s0962-8924(00)89116-3. [DOI] [PubMed] [Google Scholar]
- Bae Y.S., Cantley L.G., Chen C.S., Kim S.R., Kwon K.S., Rhee S.G. Activation of phospholipase C-γ by phosphatidylinositol 3,4,5-trisphosphate. J. Biol. Chem. 1998;273:4465–4469. doi: 10.1074/jbc.273.8.4465. [DOI] [PubMed] [Google Scholar]
- Bevan A., Paul D.P.G., Bergeron J.J.M., Posner B.I. Intracellular signal transductionthe role of endosomes. Trends Endocrinol. Metab. 1996;7:13–20. doi: 10.1016/1043-2760(95)00179-4. [DOI] [PubMed] [Google Scholar]
- Carter R.E., Sorkin A. Endocytosis of functional epidermal growth factor receptor-green fluorescent protein chimera. J. Biol. Chem. 1998;273:35000–35007. doi: 10.1074/jbc.273.52.35000. [DOI] [PubMed] [Google Scholar]
- Chattopadhyay A., Vecchi M., Ji Q.-S., Mernaugh R., Carpenter G. The role of individual SH2 domains in mediating association of phospholipase C-γ1 with the activated EGF receptor. J. Biol. Chem. 1999;274:26091–26097. doi: 10.1074/jbc.274.37.26091. [DOI] [PubMed] [Google Scholar]
- Czech M.P. PIP2 and PIP3complex roles at the cell surface. Cell. 2000;100:603–606. doi: 10.1016/s0092-8674(00)80696-0. [DOI] [PubMed] [Google Scholar]
- DeBell K.E., Atoica B.A., Veri M.-C., Baldassarre A.D., Miscia S., Graham L.J., Rellahan B.L., Ishiai M., Kurosaki T., Bonvini E. Functional independence and interdependence of the Src homology domains of phospholipase C-γ1 in B-cell receptor signal transduction. Mol. Cell. Biol. 1999;19:7388–7398. doi: 10.1128/mcb.19.11.7388. [DOI] [PMC free article] [PubMed] [Google Scholar]
- Falasca M., Logan S.K., Lehto V.P., Baccante G., Lemmon M.A., Schlessinger J. Activation of phospholipase Cγ by PI 3-kinase-induced PH domain-mediated membrane targeting. EMBO (Eur. Mol. Biol. Organ.) J. 1998;17:414–422. doi: 10.1093/emboj/17.2.414. [DOI] [PMC free article] [PubMed] [Google Scholar]
- Fukami K., Matsuoka K., Nakanishi O., Yamakawa A., Kawai S., Takenawa T. Antibody to phosphatidylinositol 4,5-bisphosphate inhibits oncogene-induced mitogenesis. Proc. Natl. Acad. Sci. USA. 1988;85:9067–9071. doi: 10.1073/pnas.85.23.9057. [DOI] [PMC free article] [PubMed] [Google Scholar]
- Goldschmit-Clermont P.J., Kim J.W., Machesky L.M., Rhee S.G., Pollard T.D. Regulation of phospholipase C-gamma1 by profilin and tyrosine phosphorylation. Science. 1991;251:1231–1233. doi: 10.1126/science.1848725. [DOI] [PubMed] [Google Scholar]
- Haugh J.M., Schooler K., Wells A., Wiley H.S., Lauffenburger D.A. Effect of epidermal growth factor receptor internalization on regulation of the phospholipase C-γ1 signaling pathway. J. Biol. Chem. 1999;274:8958–8965. doi: 10.1074/jbc.274.13.8958. [DOI] [PubMed] [Google Scholar]
- Honda A., Nogami M., Yokozeki T., Yamazaki M., Nakamura H., Watanabe H., Kawamoto K., Nakayama K., Morris A.J., Frohman M.A. Phosphatidylinositol 4-phosphate 5-kinase α is a downstream effector of the small G protein ARF6 in membrane ruffle formation. Cell. 1999;99:521–532. doi: 10.1016/s0092-8674(00)81540-8. [DOI] [PubMed] [Google Scholar]
- Ishiai M., Sugawara H., Kurosaki M., Kurosaki T. Association of phospholipase C-γ2 Src homology 2 domains with BLNK is critical for B cell antigen receptor signaling. J. Immunol. 1999;163:1746–1749. [PubMed] [Google Scholar]
- Ji Q.-S., Winnier G.E., Niswender K.D., Horstman D., Wisdom R., Magnuson M.A., Carpenter G. Essential role for the tyrosine kinase substrate phospholipase C-γ1 in mammalian growth and development. Proc. Natl. Acad. Sci. USA. 1997;94:2999–3003. doi: 10.1073/pnas.94.7.2999. [DOI] [PMC free article] [PubMed] [Google Scholar]
- Ji Q.-S., Chattopadhyay A., Vecchi M., Carpenter G. Physiological requirement for both SH2 domains for phospholipase C-γ1 function and interaction with platelet-derived growth factor receptors. Mol. Cell. Biol. 1999;19:4961–4970. doi: 10.1128/mcb.19.7.4961. [DOI] [PMC free article] [PubMed] [Google Scholar]
- Katan M. Families of phosphoinositide-specific phospholipase Cstructure and function. Biochem. Biophys. Acta. 1998;1436:5–17. doi: 10.1016/s0005-2760(98)00125-8. [DOI] [PubMed] [Google Scholar]
- Katan M., Allen V.L. Modular PH and C2 domains in membrane attachment and other functions. FEBS Lett. 1999;452:36–40. doi: 10.1016/s0014-5793(99)00531-1. [DOI] [PubMed] [Google Scholar]
- Koblan K.S., Schaber M.D., Edwards G., Gibbs J.B., Pompliano D.L. Src-homology 2 (SH2) domain ligation as an allosteric regulatormodulation of phosphoinositide-specific phospholipase C γ1 structure and activity. Biochem. J. 1995;305:745–751. doi: 10.1042/bj3050745. [DOI] [PMC free article] [PubMed] [Google Scholar]
- Lawrence Y., Ozil J.P., Swann K. The effect of a Ca2+ chelator and heavy-metal-ion chelators upon Ca2+ oscillations and activation at fertilization in mouse eggs suggest a role for repetitive Ca2+ increases. Biochem. J. 1998;335:335–342. doi: 10.1042/bj3350335. [DOI] [PMC free article] [PubMed] [Google Scholar]
- Lee S.B., Rhee S.G. Significance of PIP2 hydrolysis and regulation of phospholipase C isozymes. Curr. Opin. Cell Biol. 1995;7:183–189. doi: 10.1016/0955-0674(95)80026-3. [DOI] [PubMed] [Google Scholar]
- Lopez I., Mak E.C., Ding J., Hamm H.E., Lomasney J.W. A novel bifunctional phospholipase C that is regulated by Gα12 and stimulates the Ras/MAP kinase pathway. J. Biol. Chem. 2000;276:2758–2765. doi: 10.1074/jbc.M008119200. [DOI] [PubMed] [Google Scholar]
- Poulin B., Sekiya F., Rhee S.G. Differential roles of the Src homology 2 domains of phospholipase C-γ1 (PLC-γ1) in platelet-derived growth factor-induced activation of PLC-γ1 in intact cells. J. Biol. Chem. 2000;275:6411–6416. doi: 10.1074/jbc.275.9.6411. [DOI] [PubMed] [Google Scholar]
- Rameh L.E., Rhee S.G., Spokes K., Kazlauskas A., Cantley L.C., Cantley L.G. Phosphoinositide 3-kinase regulates phospholipase Cγ-mediated calcium signaling. J. Biol. Chem. 1998;273:23750–23757. doi: 10.1074/jbc.273.37.23750. [DOI] [PubMed] [Google Scholar]
- Rebecchi M.J., Pentyala S.N. Structure, function, and control of phosphoinositide-specific phospholipase C. Physiol. Rev. 2000;80:1291–1335. doi: 10.1152/physrev.2000.80.4.1291. [DOI] [PubMed] [Google Scholar]
- Schlessinger J. Cell signaling by receptor tyrosine kinases. Cell. 2000;103:211–225. doi: 10.1016/s0092-8674(00)00114-8. [DOI] [PubMed] [Google Scholar]
- Song C., Hu C.-D., Masago M., Kariya K., Yamawaki-Kataoka Y., Shibatohge M., Wu D., Satoh T., Kataoka T. Regulation of a novel human phospholipase C, PLCε, through membrane targeting by Ras. J. Biol. Chem. 2000;276:2752–2757. doi: 10.1074/jbc.M008324200. [DOI] [PubMed] [Google Scholar]
- Sultzman L., Ellis C., Lin L.-L., Pawson T., Knopf J. Platelet-derived growth factor increases the in vivo activity of phospholipase C-γ1 and phospholipase C-γ2. Mol. Cell. Biol. 1991;11:2018–2025. doi: 10.1128/mcb.11.4.2018. [DOI] [PMC free article] [PubMed] [Google Scholar]
- Takata M., Homma Y., Kurosaki T. Requirement of phospholipase C-γ activation in surface immunoglobulin M-induced B cell apoptosis. J. Exp. Med. 1995;182:907–914. doi: 10.1084/jem.182.4.907. [DOI] [PMC free article] [PubMed] [Google Scholar]
- Takata T., Sabe H., Hata A., Inazu T., Homma Y., Nukuda T., Yamamura H., Kurosaki T. Tyrosine kinases Lyn and Syk regulate B cell receptor coupled Ca2+ mobilization through distinct pathways. EMBO (Eur. Mol. Biol. Organ.) J. 1994;13:1341–1349. doi: 10.1002/j.1460-2075.1994.tb06387.x. [DOI] [PMC free article] [PubMed] [Google Scholar]
- Takeuchi H., Oike M., Paterson H.F., Allen V.L., Kanematsu T., Ito Y., Erneux C., Katan M., Hirata M. Inhibition of calcium signalling by p130, PLC-related catalytically inactive proteincritical role of the p130 PH domain. Biochem. J. 2000;349:357–368. doi: 10.1042/0264-6021:3490357. [DOI] [PMC free article] [PubMed] [Google Scholar]
- Tall E.G., Spector I., Pentyala S.N., Bitter I., Rebecchi M.J. Dynamics of phosphatidylinositol 4,5-bisphosphate in actin-rich structure. Curr. Biol. 2000;10:743–746. doi: 10.1016/s0960-9822(00)00541-8. [DOI] [PubMed] [Google Scholar]
- Todderud G., Wahl M.I., Rhee S.G., Carpenter G. Stimulation of phospholipase C-γ1 membrane association by epidermal growth factor. Science. 1990;249:296–298. doi: 10.1126/science.2374928. [DOI] [PubMed] [Google Scholar]
- Varnai P., Balla T. Visualization of phosphoinositides that bind pleckstrin homology domainscalcium- and agonist-induced dynamic changes and relationship to Myo-[3H]inositol–labeled phosphoinositide pools. J. Cell Biol. 1998;143:501–510. doi: 10.1083/jcb.143.2.501. [DOI] [PMC free article] [PubMed] [Google Scholar]
- Vieira A.V., Lamaze C., Schmid S.L. Control of EGF receptor signaling by clathrin-mediated endocytosis. Science. 1996;274:2086–2089. doi: 10.1126/science.274.5295.2086. [DOI] [PubMed] [Google Scholar]
- Wang D., Feng J., Wen R., Marine J.-C., Sangster M.Y., Parganas E., Hoffmeyer A., Jackson C.W., Cleveland J.L., Murray P.J. Phospholipase C-γ2 is essential in the functions of B cell and several Fc receptors. Immunity. 2000;13:25–35. doi: 10.1016/s1074-7613(00)00005-4. [DOI] [PubMed] [Google Scholar]
- Wouters F., Bastiaens P.H. Fluorescence lifetime imaging of receptor tyrosine kinase activity in cells. Curr. Biol. 1999;9:1127–1130. doi: 10.1016/s0960-9822(99)80484-9. [DOI] [PubMed] [Google Scholar]
- Yang L.J., Rhee S.G., Williamson J.R. Epidermal growth factor-induced activation and translocation of phospholipase C-γ1 to the cytoskeleton in rat hepatocytes. J. Biol. Chem. 1994;269:7156–7162. [PubMed] [Google Scholar]