

Abstract
Background
A number of studies have provided evidence for genetic modulation of brain structure in unaffected family members of schizophrenia patients (FM), using conventional region-of-interest volumetric analysis. High-dimensional pattern analysis and classification methods have been reported recently to have the capacity to determine subtle and spatially complex structural patterns that distinguish schizophrenia patients from healthy controls, using standard magnetic resonance imaging (MRI). This study investigates whether such endophenotypic patterns are found in FM via similar computer-based image analysis approaches.
Methods
A high-dimensional pattern classifier was constructed from a group of 69 patients and 79 healthy controls, via an analysis that identified a subtle, and spatially complex and distributed pattern of reduced brain volumes. Patients were distinguished from healthy controls with sensitivity of 92.9% and specificity 89.8%, using jackknife method. Then the constructed classifier was applied to examine brain structure of 30 FM.
Results
The classifier indicated that family members had structural profiles highly overlapping with those of patients. Moreover, an orbitofrontal region of relatively increased white matter was found to contribute significantly to the classification, indicating that white matter alterations, along with reductions of gray matter volumes, might be present in patients and unaffected family members.
Conclusions
These findings give evidence that high-dimensional pattern analysis and classification can identify complex and subtle structural endophenotypes that are shared by probands and their unaffected family members.
Keywords: Schizophrenia, unaffected family member, structural MRI, high dimensional pattern classification
1. Introduction
Magnetic resonance imaging (MRI) studies in unaffected family members (FM) of schizophrenia patients suggest that genetic factors affect brain structure (1-5), with FM generally showing characteristics of brain structure in-between patients and healthy controls (HC). Likewise, high risk individuals such as patient offsprings with no clinical history of psychosis, have similar structural abnormalities, most notably in hippocampus and amygdala, with some contradictory results (6-9) having being reported in the literature.
Although previous studies have provided evidence for genetic modulation of brain structure in FM, they have been limited in two ways. First, only measurements of a priori sets of selected brain regions of interest (ROI) were obtained, thereby potentially biasing the results toward a priori hypotheses. The ROI approach might also miss effects in brain regions where the pre-selected ROIs are not optimally defined to capture phenotypic characteristics of FM. Second, although most studies have reported group differences in some brain structures, there has been substantial overlap of brain volumes among FM, HC, and patients. This overlap prohibits identification of structural phenotypes in individuals. These features, in addition to the labor intensive processing, limit the use of structural MRI to generate robust endophenotypic markers for use in large-scale genetic studies.
The present study aims to overcome these limitations by employing an automated whole-brain morphometric analysis approach, using high-dimensional image warping methods. These methods have been increasingly applied in brain disorders to provide unbiased measures that probe the entire brain, instead of pre-defined ROIs (10-12). We added a high-dimensional pattern classification technique, which identifies subtle and spatially complex patterns of brain structure that are able to classify individuals with established specificity and sensitivity (10, 13-15).
These methodologies were applied in our earlier studies (10, 15) to a group of 69 schizophrenia patients, recruited from families without any other incidence of schizophrenia, and 79 HC. A pattern classifier was first trained to recognize distinct structural phenotypes of schizophrenia patients contrasted with HC. The classifier had sensitivity of 92.9% and specificity of 89.8% (15), determined via leave-one-out cross-validation. In the current study, the classifier derived previously from schizophrenia patients and HC is applied to 30 unaffected FM, probing the presence of the schizophrenia-specific structural phenotype in FM. We hypothesized that FM would partially display the subtle and spatially complex pattern of structural brain abnormality that was characteristic of the patients.
2. Materials and Methods
2.1. Participants
The sample of schizophrenia patients and healthy controls was previously described (10). Briefly, 69 (46 men, 23 women) patients with schizophrenia (SCZ) and 79 (41 men, 38 women) healthy controls (HC) participated in the study. All were right-handed and women were premenopausal. The groups did not differ sociodemographically in age, (Mean ± SD, SCZ 29.9 ± 8.4, HC 28.2 ±7.5 years) and parental education (SCZ 13.9 ± 3.8, HC 14.5 ± 3.5 years, both p-values > 0.17). Participants were recruited and assessed by the Schizophrenia Research Center and underwent medical, neurological, and psychiatric evaluations to exclude for history of illness affecting brain function such as substance abuse, hypertension, metabolic disorders, neurological disorders, and head trauma with loss of consciousness (16). Of the 69 SCZ patients, 32 were first-episode neuroleptic naïve and 37 were treated with antipsychotics: 13 patients were on first generation neuroleptics and 24 were taking second generation at the time of study (of whom 11 were previously treated with first generation agents).
Family members (FM) included 30 unaffected relatives (14 men, 16 women) of schizophrenia patients. Their average age was 36.8 ± 15.0 years and parental education was 15.1 ± 2.1 years. They consisted of 8 parents, 14 siblings and 8 uncles, aunts or cousins. FM were an entirely separate group from HC.
Healthy participants underwent the SCID-NP (17) and reported no first-degree relative with schizophrenia or affective illness. The sample overlaps with samples reported in earlier publications (18-20). The current dataset includes all SCZ patients, their family members, and demographically balanced HC who have been studied on the same scanner with the same protocol and who had suitable quality of scan for automated analysis of the entire supertentorial brain.
2.2. Imaging protocol
T1-weighted images were obtained on a GE Signa 1.5 Tesla scanner using SPGR pulse sequence (flip angle 35°, TR 35ms, TE 6ms, field of view 24cm, NEX 1, 1mm slice thickness and no inter-slice gaps). In-plane resolution was 0.9375×0.9375mm. No parenchymal lesions or skull abnormalities were evident neuroradiologically.
2.3. Image Analysis
Images were pre-processed using the methods described in (21), which resulted in segmentations into gray matter (GM), white matter (WM) and cerebrospinal fluid (CSF). To compare structural patterns across individuals, we spatially transformed each segmented image into a common coordinate system (stereotaxic space). A mass-preserving framework was adopted (22) to ensure that the volumes of brain tissue were preserved during the transformation and to provide tissue density maps of GM, WM and CSF for each individual that reflected the spatial distribution of these tissue volumes. For example, relatively lower GM tissue density in a brain region would indicate reduced tissue volume in that region.
2.4. Pattern analysis and classification of SCZ patients
In this section we summarize the methodology for constructing the SCZ-HC classifier, which was presented in detail in (15). We do this because this classifier yields a phenotypic “score” that reflects how similar an individual brain morphology is to either SCZ or HC, when applied to the FM of the current study. Patterns of the spatial distribution of GM, WM and CSF volumes derived in Section 2.3 were then examined with a pattern classification technique (14), and patterns specific to SCZ were determined. A feature extraction procedure (14) was first applied, which identified the minimal set of regional clusters that provided the best separation between SCZ and HC. A feature selection mechanism (14) was used to extract the most pertinent local clusters of GM, WM and CSF volumes contributing to the discrimination between SCZ and HC groups. These were used to train a nonlinear support vector machine classifier, using a Gaussian kernel (13, 23). The classifier produced an abnormality score: positive values indicated a structural pattern resembling SCZ, whereas negative values indicated brain structure in HC. A jackknife (leave-one-out) cross-validation was used to test the predictive power of this analysis on new datasets not involved in the selection of optimal brain clusters and training of the classifier. In this analysis, the scan of one participant was put aside, and the classifier was constructed from the scans of all other individuals. Thus, the individual being classified was not included in the training data set for development of the classifier. This classifier was then applied to the left-out individual.
In order to form an image of the brain regions that constitute a pattern of brain tissue distribution characteristic of SCZ, we created a spatial map of brain regions whose volumes change fastest as one follows the path of the abnormality score from positive (SCZ-like) to negative (HC-like). These regions jointly form a pattern that optimally characterizes the differences between SCZ and healthy controls, from the perspective of classification. A value from 0 to 1 is determined for each region, reflecting its relative importance in classification. The classifier integrates volumetric measurements from a number of brain regions in a multi-variate nonlinear statistical model that optimally separates SCZ from HC. Thus, it is possible to determine which brain regions contribute the most to the separation of the two groups, i.e. which dimensions in the high-dimensional space of regional volumetric measurements have the highest discriminatory power. These brain regions collectively form a structural pattern (13).
2.5. Testing the presence of SCZ-like phenotypes in FM
The classifiers that optimally separated SCZ and HC were applied to the MRI scans of FM, in order to test the hypothesis that SCZ-like structural phenotypes would be found in FM. Since we previously observed differences between the structural phenotypes of men and women (10), we performed this analysis separately for males and females, i.e. we constructed two classifiers, one for males and one for females, then applied these classifiers to the corresponding subgroups of FM. The image analysis and classification process is summarized in Figure 1.
Figure 1.

Flowchart of classification of SCZ patients and testing the presence of SCZ-like phenotypes in FM. The trained classifier for classification of SCZ patients is applied to test the SCZ-like phenotypes in FM.
2.6. Whole-brain voxel-based volumetric analysis
Regional volumetric differences between FM, HC, and SCZ were examined using voxel-based morphometric analysis (24), and after correction for multiple comparisons using the false discovery rate method in the SPM software (25). This approach is “mass univariate”, in that it tests GM and WM tissue volumes in many regions separately, in contrast to pattern classification, which forms a single multivariate nonlinear model out of the entire data set.
3. Results
Figure 2 shows the histograms of the scores obtained for the females and males, respectively, including the scores of SCZ and HC. Positive scores reflect presence of the SZC-specific structural pattern, and vice versa. Figure 2 indicates that the structural pattern that distinguishes SCZ from HC was found in most FM, especially males. The regions that were determined to jointly form the pattern that distinguished SCZ from HC included several clusters, which are summarized in Table 1. It is worth noting that one of the regions listed in Table 1, the right orbitofrontal WM, displayed relatively larger volumes in SCZ and FM, compared to HC (see Figure 3).
Figure 2.
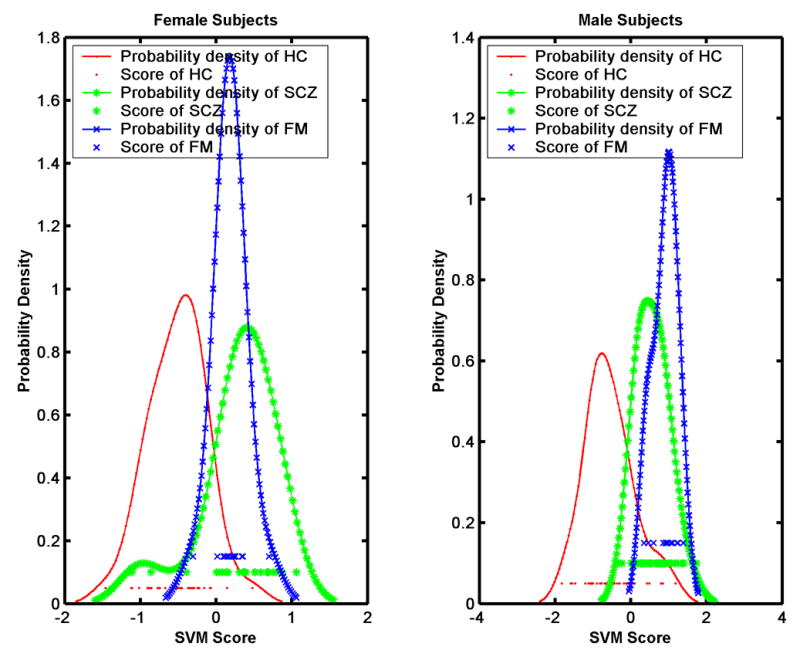
Histograms of the MRI-based classification scores for the normal controls, the SCZ patients, and the family members, for female and male participants separately. Family members display mostly positive scores, i.e. their MRI scans indicate that they possess the structural phenotype characteristic of schizophrenia.
Table 1.
List of brain regions/clusters whose volumes jointly comprised a spatial pattern of brain structure that was found to be highly specific to SCZ patients. The regions found in male subjects were roughly matched to respective anatomical structures found in the female subjects, except regions denoted by *, which were unique to the respective groups.
| FEMALES | MALES | |
|---|---|---|
| Gray Matter | Left lateral hippocampus* | Medial aspect of left amygdala* |
| Left posterior hippocampus* | Left anterior caudate* | |
| Right posterior occipital-temporal | Right posterior and inferior occipital | |
| Left superior, middle, and inferior temporal gyri | Left and right posterior part of inferior temporal gyrus | |
| Left insula | Left insula | |
| Left parietoccipital fissure | Left and right parietoccipital fissure | |
| Left parasagittal posterior cingulate | Right para-sagittal posterior cingulate | |
| White Matter | Lateral to the right hippocampus | Inferior to right hippocampus (parahippocampal gyrus ) |
| In the vicinity of the right amygdala and anterior hippocampus* | Right superior temporal gyrus, posterior part* | |
| Right orbitofrontal * | ||
| Left prefrontal | Right prefrontal | |
| Inferior aspect of the left occipital | Inferior aspect of right occipital | |
| Left post-central gyrus* | Lateral aspect of corpus callosum and adjacent left frontal * | |
| Left superior parietal gyrus* | Adjacent to left insula* |
Figure 3.
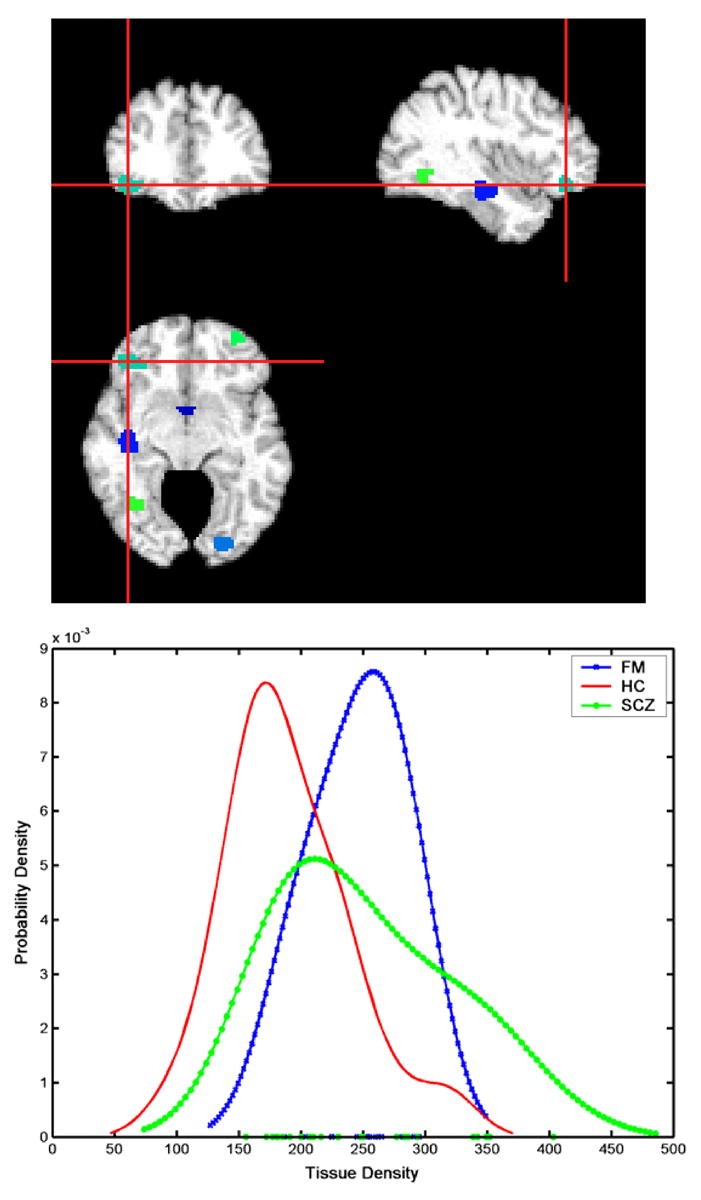
Histograms of the volume of the cluster indicated by the center of the cross-hair: orbitofrontal white matter was relatively increased in both female patients and family members, indicating that for this specific brain region, the SCZ-like structural phenotype involved increased brain volumes relative to HC. Images are in radiology convention.
Lilliefors tests at the 5% level confirmed the normality of the distribution of these scores. Two sample t-test on the abnormality scores of FM, SCZ, and HC yielded the p-values shown in Table 2. For the hypothesis testing of samples X vs. Y, three alternative hypotheses are specified as, A: mean (X) ≠mean (Y), B: mean (X)>mean (Y), and C: mean (X) <mean (Y). Significant differences were found between FM and HC, and SCZ and HC. A significant difference was found between SCZ and FM, which however becomes marginal after correction for multiple (6) comparisons at the p=0.05 level, and insignificant at the p=0.01 level.
Table 2.
T-tests applied to the abnormality scores obtained from male and female SCZ, FM, and HC. Significant differences were found between FM and HC, and SCZ and HC. Marginally significant difference was found between SCZ and FM, which however disappears after correction for multiple comparisons.
| Female subjects: | |||
| A | B | C | |
| FM vs. SCZ | 0.4477 | 0.77615 | 0.22385 |
| HC vs. FM | 8.4957e-009 | 1 | 4.2479e-009 |
| HC vs. SCZ | 3.7729e-009 | 1 | 1.8864e-009 |
| Male subjects: | |||
| A | B | C | |
| FM vs. SCZ | 0.013857 | 0.0069287 | 0.99307 |
| HC vs. FM | 3.1414e-010 | 1 | 1.5707e-010 |
| HC vs. SCZ | 2.1316e-014 | 1 | 1.0658e-014 |
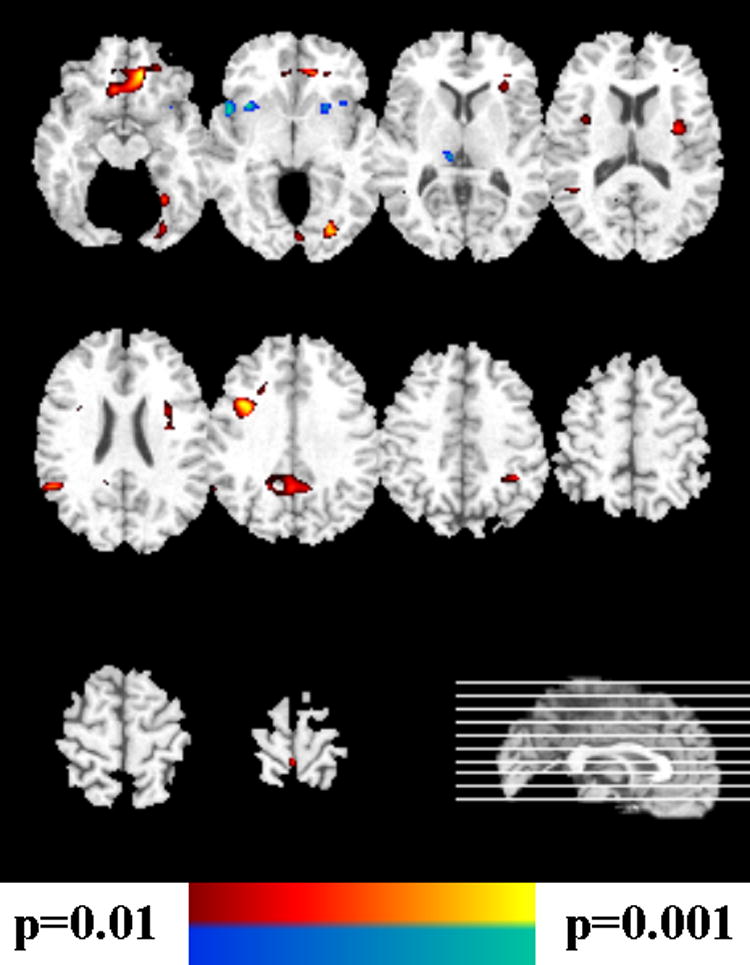
The results of the voxel-based evaluation of brain volumes is shown in Figures 4-6 and contrasted with the pattern classification results in Table 1. They indicated that the abnormal pattern detected by the classifier must have been subtle, because brain structure of FM appeared to have generally similar regional volumes as HC. In particular, Figure 4 shows the results of voxel-by-voxel evaluation of the tissue density GM and WM maps of male participants, without correction for multiple comparisons, and Figure 5 shows the FDR-corrected maps for males. Although some trends were seen in Figure 4 (top row), indicating that HC>FM, none of them was significant after FDR-correction. In contrast, several regions of significant differences, with FM>SCZ, survived FDR-correction for multiple comparisons, as Figure 5 shows. Figure 6 shows the results for female participants. Some trends were found, but none of them was significant after correction for multiple comparisons.
Figure 4.
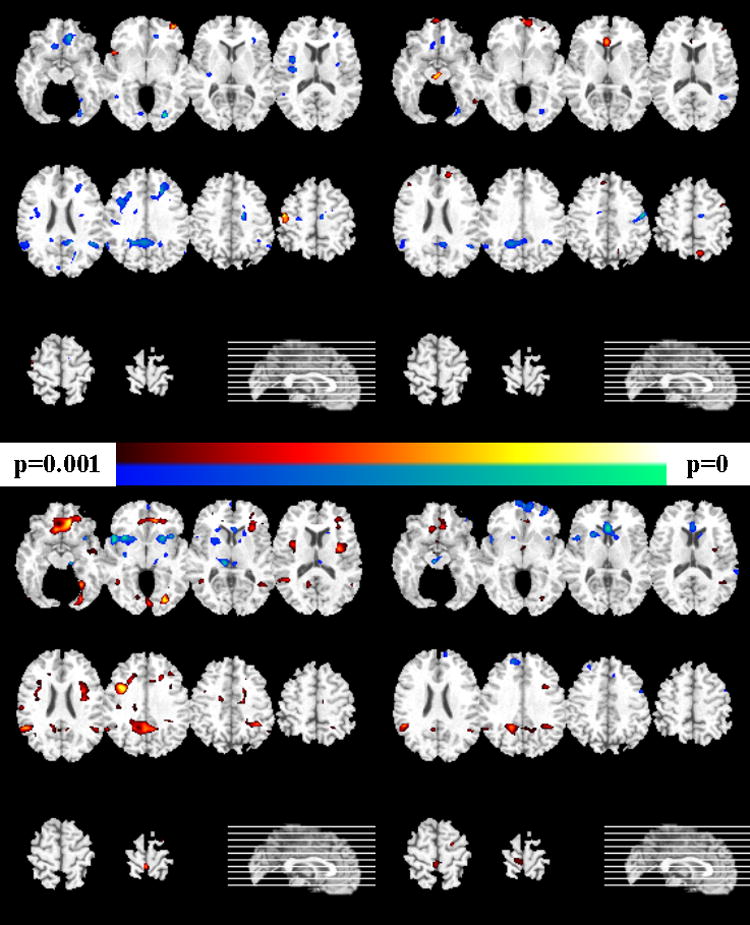
Voxel-based analysis of the tissue density maps for the male participants (left column show gray matter comparisons, and the right column shows white matter results). Uncorrected p-values are shown. Images are in radiology convention. Top row: group difference between HC and FM. The yellow-red scale indicates HC>FM, and the blue-green scale indicates HC<FM. Bottom row: The yellow-red scale indicates FM>SCZ, and the blue-green scale indicates FM<SCZ.
Figure 6.
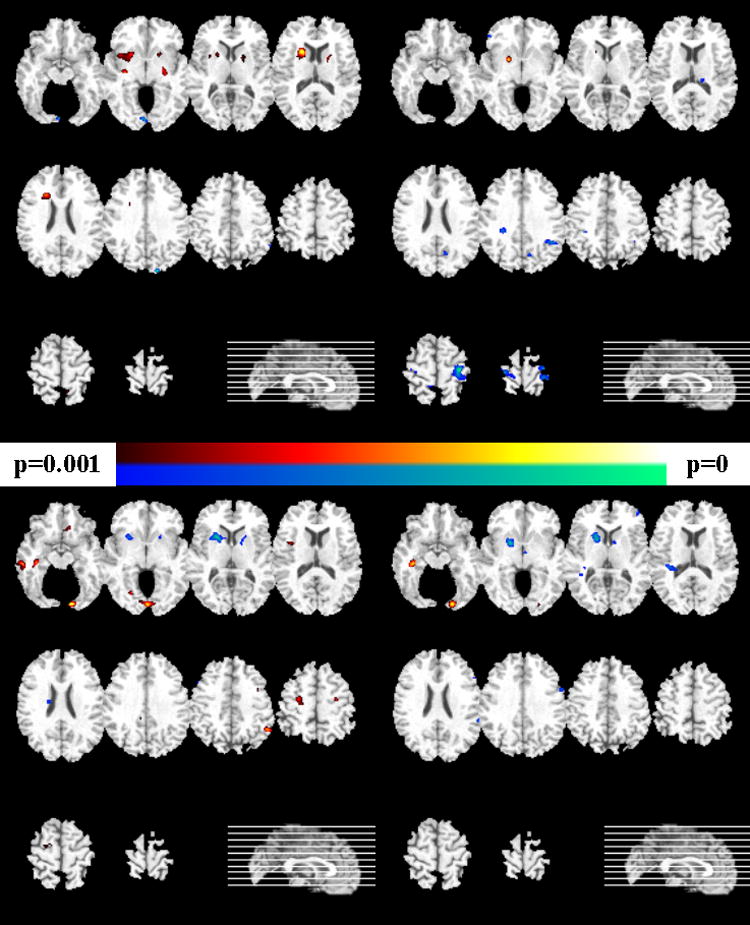
Voxel-based analysis of the tissue density maps for the female participants (left column show gray matter comparisons, and the right column shows white matter results). Uncorrected p-values are shown. Images are in radiology convention. Top row: group difference between HC and FM. The yellow-red scale indicates HC>FM, and the blue-green scale indicates HC<FM. Bottom row: The yellow-red scale indicates FM>SCZ, and the blue-green scale indicates FM<SCZ.
Figure 5.
Voxel-based analysis of the GM tissue density maps of Figure 4, bottom row, after correction for multiple comparisons. The yellow-red scale indicates FM>SCZ, and the blue-green scale indicates FM<SCZ.
4. Discussion
Family members displayed classification scores that were mostly in the patient range, thereby indicating that the structural phenotype that distinguishes between patients and controls was present in most family members. Male FM displayed relatively higher abnormality scores, which might indicate a sex-specific relationship between genotype and phenotype in schizophrenia. To the extent that brain structural phenotypes portend risk for SCZ, the results also indicate that male FM might be at higher risk for developing the disease. These results support evidence for moderating effects of gender in SCZ (19, 26). However, potential sex-specific patterns must be examined in greater depth using larger samples, in future studies.
The structural pattern characteristic of schizophrenia was subtle and spatially complex. It was distributed over several brain regions, as evaluated by the classifier (Table 1), had relatively small magnitude, and was identified by jointly considering volumetric measurements from all brain regions. Indeed, when evaluated by voxel-based analysis on a region-by-region basis, FM and HC had very similar brain structure while FM differed from SCZ patients. Thus, the overall structural phenotype of FM would seem to be much closer to that of HC than of SCZ. However, the SCZ-specific structural pattern identified with high-dimensional nonlinear pattern classification was highly prevalent among FM, especially males. This suggests that FM possess subtle structural characteristics of SCZ patients, however the patients have additional abnormalities, which were highlighted by regional volumetric analysis. Future prospective studies are needed to examine whether the more extended structural abnormalities of the patients are found in early years, especially prior to disease onset, or whether they are a secondary effect of disease progression.
Notably, although SCZ patients had lower orbitofrontal GM than HC (10), when evaluated via voxel-based analysis of the tissue density maps, patients and FM had larger orbitofrontal WM compared to HC (males showed only a trend in this direction, at the p=0.08 level). The orbitofrontal WM was the only brain region forming the SCZ-like structural pattern, in which increased volume was found in patients and FM, compared to HC. Because there is some evidence that brain connectivity might be affected in schizophrenia (27), this finding is novel and merits further investigation. However, the lack of diffusion tensor images for these participants did not allow us to localize the WM changes on any specific fiber pathway. Our study is also unable to determine whether this WM abnormality is developmental and genetically-determined, or whether it relates to a compensatory biological response of increased axonal formation triggered by the reduced GM in the same region. Studies of younger populations at risk are necessary to further elucidate this finding.
The brain regions identified by region-by-region analysis (Figures 4-6) were somewhat different from the regions that formed the structural pattern of SCZ patients (Table 1) because the underlying methods have fundamental differences (28). Specifically, pattern classification determines the collection of regions that jointly achieve the optimal separation between patients and HC, whereas voxel-based analysis examines each region individually and determines whether the region differs among groups of interest. Therefore, it is possible that a brain region with a relatively small difference between two groups is important for classification. Indeed, a brain region could display no group differences at all, and still be an important normalization factor and therefore valuable for classification and optimal group separation. Conversely, regions that might display significant group differences might not be important for classification, if they correlate strongly with other regions that are already included in the classifier. Therefore, from a number of correlated measurements, it might be sufficient to sample only a subset to achieve optimal classification accuracy. The results of these two types of analysis should be interpreted with these caveats in mind. Overall, these results indicate that brain structure of FM was generally much more similar to HC than to SCZ when evaluated according to conventional voxel-based analysis, i.e. region by region evaluation of brain volumes. However, with respect to the subtle and spatially distributed pattern that best and most consistently differentiated between HC and SCZ, FM resembled the patients rather than the HC. This has potentially important implications because it would argue in favor of the existence of subtle endophenotypic structural patterns in both SCZ and FM, which were identified by pattern classification. On the other hand, the relatively more extensive structural differences between SCZ and FM, and SCZ and HC, may reflect changes that relate to the course of the disease. Future longitudinal studies are necessary to elucidate whether this endophenotypic pattern is present before disease onset, whether it is different in people that eventually develop the disease, and to what extent it progresses throughout the course of illness.
Acknowledgments
This work was supported in part by NIH grants MH60722, MH64045 and AG14971. The authors thank Dr. Paul Hughett for his help with data handling.
Footnotes
Financial Disclosures: There are no conflicts of interest including any financial, personal or other relationships with people or organizations, by any of the co-authors, related to the work described in the paper.
Publisher's Disclaimer: This is a PDF file of an unedited manuscript that has been accepted for publication. As a service to our customers we are providing this early version of the manuscript. The manuscript will undergo copyediting, typesetting, and review of the resulting proof before it is published in its final citable form. Please note that during the production process errors may be discovered which could affect the content, and all legal disclaimers that apply to the journal pertain.
Contributor Information
Yong Fan, Section of Biomedical Image Analysis, Department of Radiology, University of Pennsylvania, School of Medicine.
Raquel E. Gur, Brain and Behavior Laboratory, Department of Psychiatry, University of Pennsylvania, School of Medicine
Ruben C. Gur, Brain and Behavior Laboratory, Department of Psychiatry, University of Pennsylvania, School of Medicine
Xiaoying Wu, Section of Biomedical Image Analysis, Department of Radiology, University of Pennsylvania, School of Medicine.
Dinggang Shen, Section of Biomedical Image Analysis, Department of Radiology, University of Pennsylvania, School of Medicine.
Monica E. Calkins, Brain and Behavior Laboratory, Department of Psychiatry, University of Pennsylvania, School of Medicine
Christos Davatzikos, Section of Biomedical Image Analysis, Department of Radiology, University of Pennsylvania, School of Medicine.
References
- 1.Cannon TD, van Erp TGM, Huttunen M, Lonnqvist J, Salonen O, Valanne L, et al. Regional Gray Matter, White Matter, and Cerebrospinal Fluid Distributions in Schizophrenic Patients, Their Siblings, and Controls. Archives of General Psychiatry. 1998;55:1084–1091. doi: 10.1001/archpsyc.55.12.1084. [DOI] [PubMed] [Google Scholar]
- 2.Chapple B, Grech A, Sham P, Toulopoulou T, Walshe M, Schulze K, et al. Normal cerebral asymmetry in familial and non-familial schizophrenic probands and their unaffected relatives. Schizophrenia Research. 2004;67:33–40. doi: 10.1016/s0920-9964(03)00095-1. [DOI] [PubMed] [Google Scholar]
- 3.O'Driscoll GA, Florencio PS, Gagnon D, Wolff ALV, Benkelfat C, Mikula L, et al. Amygdala-hippocampal volume and verbal memory in first-degree relatives of schizophrenic patients. Psychiatry Research: Neuroimaging. 2001;107:75–85. doi: 10.1016/s0925-4927(01)00095-6. [DOI] [PubMed] [Google Scholar]
- 4.Staal WG, Hulshoff Pol HE, Schnack HG, Hoogendoorn MLC, Jellema K, Kahn RS. Structural Brain Abnormalities in Patients With Schizophrenia and Their Healthy Siblings. American Journal of Psychiatry. 2000;157:416–421. doi: 10.1176/appi.ajp.157.3.416. [DOI] [PubMed] [Google Scholar]
- 5.van Erp TGM, Saleh PA, Huttunen M, Lonnqvist J, Kaprio J, Salonen O, et al. Hippocampal Volumes in Schizophrenic Twins. Archives of General Psychiatry. 2004;61:346–353. doi: 10.1001/archpsyc.61.4.346. [DOI] [PubMed] [Google Scholar]
- 6.Keshavan MS, Dick E, Mankowski I, Harenski K, Montrose DM, Diwadkar V, et al. Decreased left amygdala and hippocampal volumes in young offspring at risk for schizophrenia. Schizophrenia Research. 2002;58:173–183. doi: 10.1016/s0920-9964(01)00404-2. [DOI] [PubMed] [Google Scholar]
- 7.Keshavan MS, Montrose DM, Pierri JN, Dick EL, Rosenberg D, Talagala L, et al. Magnetic resonance imaging and spectroscopy in offspring at risk for schizophrenia: Preliminary studies. Progress in Neuro-Psychopharmacology and Biological Psychiatry. 1997;21:1285–1295. doi: 10.1016/s0278-5846(97)00164-4. [DOI] [PubMed] [Google Scholar]
- 8.Lawrie S, Abukmeil S. Brain abnormality in schizophrenia. A systematic and quantitative review of volumetric magnetic resonance imaging studies. The British Journal of Psychiatry. 1998;172:110–120. doi: 10.1192/bjp.172.2.110. [DOI] [PubMed] [Google Scholar]
- 9.Wood SJ, Yucel M, Velakoulis D, Phillips LJ, Yung AR, Brewer W, et al. Hippocampal and anterior cingulate morphology in subjects at ultra-high-risk for psychosis: the role of family history of psychotic illness. Schizophrenia Research. 2005;75:295–301. doi: 10.1016/j.schres.2004.10.008. [DOI] [PubMed] [Google Scholar]
- 10.Davatzikos C, Shen DG, Wu X, Lao Z, Hughett P, Turetsky BI, et al. Whole-brain morphometric study of schizophrenia reveals a spatially complex set of focal abnormalities. JAMA Archives of General Psychiatry. 2005;62:1218–1227. doi: 10.1001/archpsyc.62.11.1218. [DOI] [PubMed] [Google Scholar]
- 11.Resnick SM, Pham DL, Kraut MA, Zonderman AB, Davatzikos C. Longitudinal Magnetic Resonance Imaging Studies of Older Adults: A Shrinking Brain. The Journal of Neuroscience. 2003;23:3295–3301. doi: 10.1523/JNEUROSCI.23-08-03295.2003. [DOI] [PMC free article] [PubMed] [Google Scholar]
- 12.Thompson P, Vidal C, Giedd J, Gochman P, Blumenthal J, Nicolson R, et al. Mapping adolesent brain change reveals dynamic wave of accelerated gray matter loss in very early-onset schizophrenia. Proceedings of the National Academy of Sciences. 2001;98:11650–11655. doi: 10.1073/pnas.201243998. [DOI] [PMC free article] [PubMed] [Google Scholar]
- 13.Fan Y, Shen D, Davatzikos C. Classification of Structural Images via High-Dimensional Image Warping, Robust Feature Extraction, and SVM. In: Duncan JS, Gerig G, editors. MICCAI. Vol. 3749. Palm Springs, California, USA: Springer Berlin / Heidelberg; 2005. pp. 1–8. [DOI] [PubMed] [Google Scholar]
- 14.Fan Y, Shen D, Gur RC, Gur RE, Davatzikos C. COMPARE: Classification Of Morphological Patterns using Adaptive Regional Elements. IEEE Transactions on Medical Imaging. 2007;26:93–105. doi: 10.1109/TMI.2006.886812. [DOI] [PubMed] [Google Scholar]
- 15.Lao Z, Shen D, Xue Z, Karacali B, Resnick SM, Davatzikos C. Morphological classification of brains via high-dimensional shape transformations and machine learning methods. Neuroimage. 2004;21:46–57. doi: 10.1016/j.neuroimage.2003.09.027. [DOI] [PubMed] [Google Scholar]
- 16.Gur R, Mozley P, Resnick S, Levick S, Erwin R, Saykin A, et al. Relations among clinical scales in schizophrenia. American Journal of Psychiatry. 1991;148:472–478. doi: 10.1176/ajp.148.4.472. [DOI] [PubMed] [Google Scholar]
- 17.First M, Spitzer R, Gibbon M, Williams J. Structured Clinical Interview for DSM-IV Axis I Disorders, Non-Patient Edition (SCID-NP) 1995. [Google Scholar]
- 18.Gur R, Maany V, Mozley D, Swanson C, Bilker W, Gur R. Subcortical MRI volumes in neuroleptic-naive and treated patients with schizophrenia. American Journal of Psychiatry. 1998;155:1711–1717. doi: 10.1176/ajp.155.12.1711. [DOI] [PubMed] [Google Scholar]
- 19.Gur R, Turetsky B, Cowell P, Finkelman C, Maany V, Grossman R, et al. Temporolimbic volume reductions in schizophrenia. Archives of General Psychiatry. 2000;57:769–775. doi: 10.1001/archpsyc.57.8.769. [DOI] [PubMed] [Google Scholar]
- 20.Gur R, Cowell P, Latshaw A, Turetsky B, Grossman R, Arnold S, et al. Reduced dorsal and orbital prefrontal gray matter volumes in schizophrenia. Archives of General Psychiatry. 2000;57:761–768. doi: 10.1001/archpsyc.57.8.761. [DOI] [PubMed] [Google Scholar]
- 21.Goldszal AF, Davatzikos C, Pham D, Yan M, Bryan RN, Resnick SM. An image processing protocol for the analysis of MR images from an elderly population. Journal of Computer Assisted Tomography. 1998;22:827–837. doi: 10.1097/00004728-199809000-00030. [DOI] [PubMed] [Google Scholar]
- 22.Shen DG, Davatzikos C. Very high resolution morphometry using mass-preserving deformations and HAMMER elastic registration. Neuroimage. 2003;18:28–41. doi: 10.1006/nimg.2002.1301. [DOI] [PubMed] [Google Scholar]
- 23.Vapnik VN. Statistical Learning Theory. New York: Wiley; 1998. [Google Scholar]
- 24.Davatzikos C, Genc A, Xu D, Resnick SM. Voxel-Based Morphometry Using the RAVENS Maps: Methods and Validation Using Simulated Longitudinal Atrophy. Neuroimage. 2001;14:1361–1369. doi: 10.1006/nimg.2001.0937. [DOI] [PubMed] [Google Scholar]
- 25.Friston KJ, Holmes AP, Worsley K, Poline JB, Frith CD, Frackowiak RSJ. Statistical parametric maps in functional imaging: a general linear approach. Human Brain Mapping. 1995;2:189–210. [Google Scholar]
- 26.Goldstein JM, Seidman LJ, O'Brien LM, Horton NJ, Kennedy DN, Makris N, et al. Impact of Normal Sexual Dimorphisms on Sex Differences in Structural Brain Abnormalities in Schizophrenia Assessed by Magnetic Resonance Imaging. Archives of General Psychiatry. 2002;59:154–164. doi: 10.1001/archpsyc.59.2.154. [DOI] [PubMed] [Google Scholar]
- 27.Kubicki M, McCarley RW, Westin CF, Park HJ, Maier S, Kikinis R, et al. A review of diffusion tensor imaging studies in schizophrenia. Journal of Psychiatric Research. 2007;41:15–30. doi: 10.1016/j.jpsychires.2005.05.005. [DOI] [PMC free article] [PubMed] [Google Scholar]
- 28.Davatzikos C. Why Voxel-Based Morphometric Analysis Should be Used with Great Caution When Characterizing Group Differences. Neuroimage. 2004;23:17–20. doi: 10.1016/j.neuroimage.2004.05.010. [DOI] [PubMed] [Google Scholar]