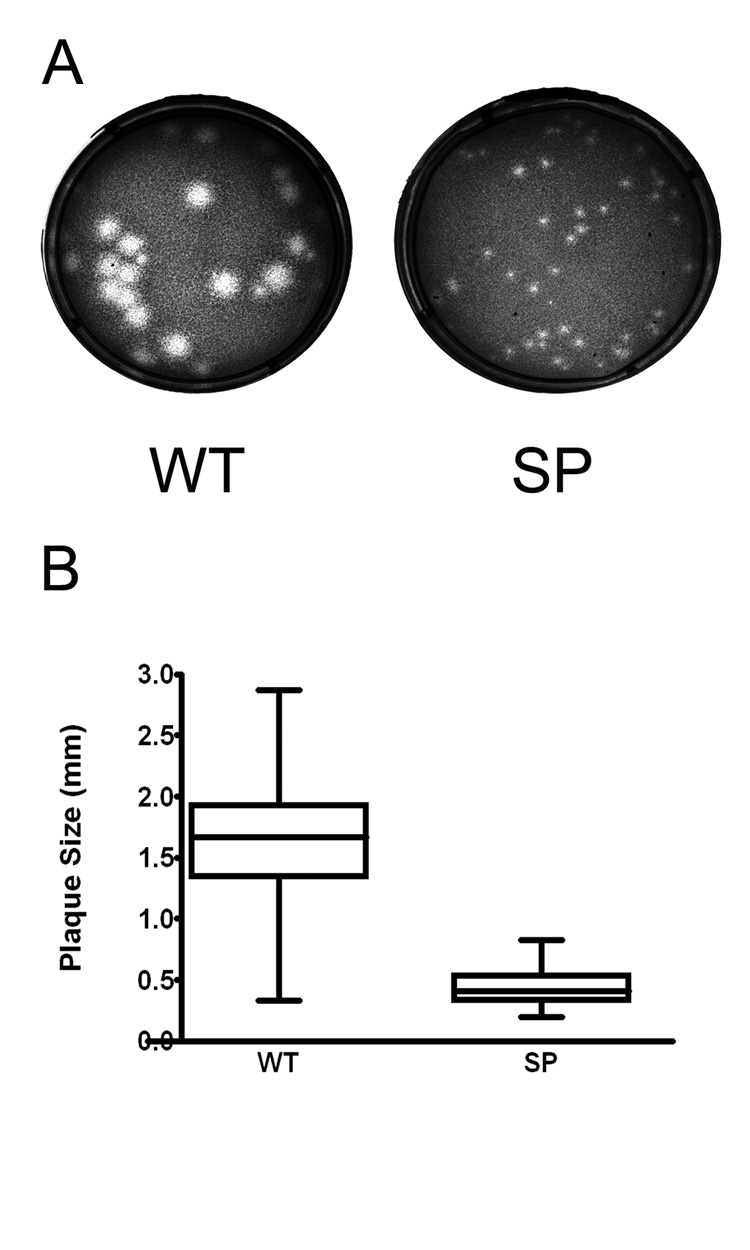
Figure 1.

Plaque morphology of wild type (WT) and a small plaque (SP) variant WNV. Vero cells in 6-well plates were infected with Vero cell amplified WT or SP stock virus, and plaques were visualized 3 days post-infection after staining with neutral red. (A) Plaques were examined with a Zeiss Stemi 2000-C stereo microscope, and images were captured with a Zeiss Axiocam MRC digital camera. (B) Plaque sizes were measured using AxioVision 3.0 software (Zeiss, Germany). For each virus, 200 individual plaques were measured and analyzed by Graph Pad Prism (v.4.0). Bar within the box represents the median value, boxes extend from 25th to 75th percentile, and error bars represent highest and lowest values. Statistical analysis by t-test, P<0.0001.
