

Abstract
α-Actinin is an actin bundling protein that regulates cell adhesion by directly linking actin filaments to integrin adhesion receptors. Phosphatidylinositol (4,5)-diphosphate (PtdIns (4,5)-P2) and phosphatidylinositol (3,4,5)-triphosphate (PtdIns (3,4,5)-P3) bind to the calponin homology 2 domain of α-actinin, regulating its interactions with actin filaments and integrin receptors. In this study, we examine the mechanism by which phosphoinositide binding regulates α-actinin function using mass spectrometry to monitor hydrogen–deuterium (H/D) exchange within the calponin homology 2 domain. The overall level of H/D exchange for the entire protein showed that PtdIns (3,4,5)-P3 binding alters the structure of the calponin homology 2 domain increasing deuterium incorporation, whereas PtdIns (4,5)-P2 induces changes in the structure decreasing deuterium incorporation. Analysis of peptic fragments from the calponin homology 2 domain showed decreased local H/D exchange within the loop region preceding helix F with both phosphoinositides. However, the binding of PtdIns (3,4,5)-P3 also induced increased exchange within helix E. This suggests that the phosphate groups on the fourth and fifth position of the inositol head group of the phosphoinositides constrict the calponin homology 2 domain, thereby altering the orientation of actin binding sequence 3 and decreasing the affinity of α-actinin for filamentous actin. In contrast, the phosphate group on the third position of the inositol head group of PtdIns (3,4,5)-P3 perturbs the calponin homology 2 domain, altering the interaction between the N and C terminus of the full-length α-actinin antiparallel homodimer, thereby disrupting bundling activity and interaction with integrin receptors.
Keywords: α-actinin, phosphoinositide, CH2 domain, hydrogen/deuterium exchange mass spectrometry
α-Actinin is a cytoskeletal and adhesion protein that provides a critical link between actin filaments and integrin adhesion receptors (Blanchard et al. 1989; Otey et al. 1990; Pavalko and Burridge 1991). α-Actinin exists as an antiparallel homodimer which orients the actin-binding regions at opposite ends (Fig. 1), allowing each dimer to bind two actin filaments leading to the formation of bundles (Tang et al. 2001). The actin-binding region is connected by a flexible linker to four spectrin repeats that mediate the interaction between the two α-actinin subunits of the dimer (Winkler et al. 1997). In addition, the cytoplasmic tail of integrin adhesion receptors bind to α-actinin between the first and second spectrin repeats (Kelly and Taylor 2005). The carboxy-terminal domain of α-actinin is also connected to the spectrin repeats by a flexible region which allows this domain to bind to the linker between the actin-binding region and the spectrin repeats of the adjacent molecule (Young and Gautel 2000).
Figure 1.

Structure of α-actinin antiparallel homodimer (top) and the sequence, secondary structure, and peptic fragments of the CH2 domain (bottom). The diagram identifies three functional regions: the actin-binding region, spectrin repeats, and EF hands domain. The actin-binding region consists of two calponin homology (CH) domains. The phosphoinositide binding site is identified by bold lettering. The positively charged residues important for interaction with phosphoinositides, K162, H170, and K174, are marked by a “+” symbol. ABS3 refers to actin-binding sequence 3.
The actin-binding region of α-actinin consists of two calponin homology (CH) domains, both of which interact directly with the actin filament (Keep et al. 1999; Norwood et al. 2000). Each CH domain consists of four main α-helices connected by long loops and two or three shorter helices (Banuelos et al. 1998). The CH1 domain is critical for α-actinin binding to actin filaments and can bind independently, whereas the CH2 domain enhances binding affinity but cannot bind alone (Banuelos et al. 1998; Keep et al. 1999; Norwood et al. 2000). Based on various experimental approaches, it appears that the actin-binding regions of this family of proteins contain three actin-binding sequences (ABS), each of which comes in direct contact with actin filaments (Keep et al. 1999; Norwood et al. 2000). ABS1 and ABS2 are composed of helix A and G, respectively, of the CH1 domain, and ABS3 consists of helix A of the CH2 domain (Fig. 1).
The interaction of α-actinin with filamentous actin and integrin adhesion receptors must be precisely regulated during cell adhesion, migration, and proliferation. The regulation of α-actinin function is not understood; however, there is evidence which indicates that the phosphoinositides, PtdIns (4,5)-P2 and PtdIns (3,4,5)-P3, play an important role in controlling its activity in cells (Greenwood et al. 2000; Fraley et al. 2003, 2005). Phosphoinositides bind to the CH2 domain, specifically to residues 158–174 of human nonmuscle α-actinin 1, adjacent to ABS3 (Fukami et al. 1996; Fraley et al. 2003). Although, both phosphoinositides bind to the same site, PtdIns (4,5)-P2 and PtdIns (3,4,5)-P3 differentially regulate the function of α-actinin in vitro (Fraley et al. 2003; Corgan et al. 2004). Both phosphoinositides inhibit α-actinin bundling activity by inhibiting α-actinin binding to actin filaments. However, only PtdIns (3,4,5)-P3 disrupts α-actinin bundling and the interaction of α-actinin with integrin adhesion receptors. How phosphoinositide binding regulates the interaction of α-actinin with actin filaments and integrin receptors is not currently known.
Hydrogen/deuterium (H/D) exchange mass spectrometry (MS) offers a new approach for examining the conformation and structural dynamics of proteins in solution (Engen and Smith 2001; Yan et al. 2004b). For example, H/D exchange MS has been used to determine the influence of ligand binding on proteins in vitro (Garcia et al. 2004). Using H/D exchange MS, Yan et al. (2004a) identified changes in the conformation and dynamics of the retinoid X receptor induced by retinoic acid that were not detected in the crystal structure. H/D exchange MS has also aided in the determination of protein flexibility (Wang et al. 1998), peptide–lipid interactions (de Planque et al. 2003), and antibody epitope mapping (Baerga-Ortiz et al. 2002; Lu et al. 2005). Furthermore, H/D exchange MS is being used to characterize protein–protein interaction interfaces (Mandell et al. 2005). In this study, we use H/D exchange MS to show that the conformation and dynamics of the α-actinin CH2 domain are altered differentially by PtdIns (4,5)-P2 and PtdIns (3,4,5)-P3.
Results
We had demonstrated previously that phosphoinositides regulate α-actinin function by binding to the CH2 domain (Fraley et al. 2003, 2005; Corgan et al. 2004). To understand how phosphoinositide binding regulates α-actinin function, mass spectrometry was used here to monitor H/D exchange within the CH2 domain. The CH2 domain was expressed with a his-tag and purified as previously described (Fraley et al. 2003). The protein was engineered so that the six amino-terminal histidine residues were distanced from the CH2 domain by 42 residues encoded by the expression vector pPROEX HTb (Invitrogen). The CH2 domain was further stabilized by including 13 carboxy-terminal residues encoded by the expression vector. Therefore, the his-CH2 protein contained a total of 175 amino acid residues with a nominal mass of 19,546 Da. The presence of the his-tag does not appear to influence the structure of the CH2 domain or its interaction with phosphoinositides (Fraley et al. 2003). Consistent with a nominal mass of 19,546 Da, three peaks, 19,570.9 Da, 19,655.3 Da, and 19,809.1 Da, were observed in the deconvoluted spectra of his-CH2 representing the protein complexed with different small molecule components from the buffer (Fig. 2). In addition, the amino acid sequence of his-CH2 was verified by mass analysis of the peptic peptides. Although his-CH2 contains 174 exchangeable amide hydrogens, we observed a maximum incorporation of only 86 deuteriums in the MS H/D exchange studies on the intact protein (Fig. 3). For unliganded his-CH2, 75% (63.9 deuteriums) of the exchange occurred within the first 15 sec and incorporation reached a plateau by 15 min. In the presence of PtdIns (3,4,5)-P3, the extent of global H/D exchange for his-CH2 was increased by 31% (26.9 additional deuteriums) compared to unliganded protein. In contrast, PtdIns (4,5)-P2 decreased global H/D exchange by 9% (7.3 fewer deuteriums). These results demonstrate that PtdIns (3,4,5)-P3 significantly increases and PtdIns (4,5)-P2 slightly decreases H/D exchange within the CH2 domain.
Figure 2.

ESI mass spectra (A), deconvoluted spectra (B), and Coomassie stained gel of his-CH2 (C). The three peaks observed in the deconvoluted spectra represent the his-CH2 + Na ion (19,570.9), the his-CH2 + Na ion + SO3H group from HEPES (19,655.3), and the his-CH2 + Na ion + HEPES (19,809.1).
Figure 3.

Phosphoinositide binding regulates hydrogen–deuterium exchange within the CH2 domain. His-CH2 (13.5 μM) bound to PtdIns (4,5)-P2 or PtdIns (3,4,5)-P3 (50 μM) were incubated in deuterium buffer at 4°C. At the indicated times, samples were quenched with formic acid (final pH 2.5) and frozen in liquid nitrogen. Deuterium incorporation was measured using ESI-MS. n = 5 ± SE.
To determine the specific regions within the CH2 domain, where H/D exchange was influenced by phosphoinositide binding, exchange was carried out for 15 min followed by proteolytic digestion. The protocol for measuring deuterium content focused on the peptides from the CH2 domain of his-CH2, and pepsin proteolysis consistently resulted in 16 overlapping peptides covering 93% of the CH2 domain protein sequence (Fig. 1). The deuterium content of peptides from his-CH2 that were encoded by the expression vector flanking the amino and carboxy terminus of the CH2 domain was the same in the absence or presence of phosphoinositides (data not shown). Although, back exchange for the 16 peptides averaged 43% (see Materials and Methods), deuterium incorporation observed for the peptic peptides was distributed throughout the CH2 domain, allowing comparative localization of phosphoinositide-induced changes to specific structural regions of the CH2 domain (Table 1). The deuterium contents of overlapping peptides were deconvoluted to refine the resolution of deuterium incorporation to more specific regions within the CH2 domain (Fig. 4). In this analysis, we first delineate regions within each peptide in a set of overlapping peptides according to overlapping regions (fi, where i is the fragment number). For each fragment i for that peptide, we define as a variable the number of deuteria/residue (Di). A set of linear equations are then setup such that the sum of Dixfi is set equal to the total number of deuterium observed for a particular peptide. As a trivial example, consider peptide fragments 8–11, which span residues 210–226. We can consider 210–226 as a single overlapping fragment (f1 = 13 residues) for this set. The next peptide in this set will contain f1 and a second fragment (f2 = 1 residue) representing just residue 223, and so forth. For the four peptides in this example, we can define the following four linear equations, with the size of each fragment assigned as their numerical values, and the total number of deuteria for each peptide as those observed for the unliganded protein (column 4 of Table 1):
Table 1.
Deuterium incorporation for the peptic fragments of the CH2 domain incubated in deuterium buffer for 15 min in the absence and presence of PtdIns (4,5)-P2 or PtdIns (3,4,5)-P3

Figure 4.

Solvent accessibility differs throughout the CH2 domain. The graph shows the relative deuterium incorporation per residue for each peptic peptide following 15 min of H/D exchange. The structural units of the CH2 domain are represented below the graph.
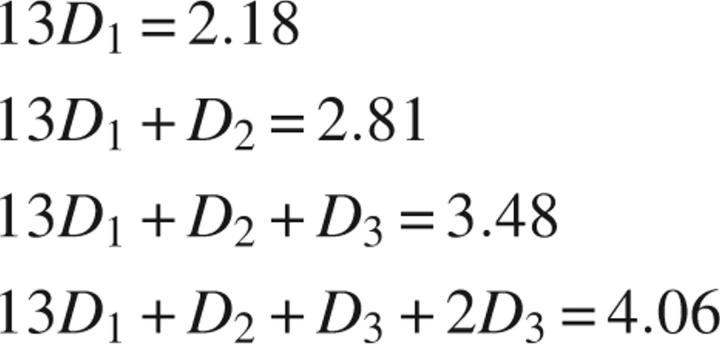 |
The trivial solutions to this set of equations are D 1 = 0.17 deuterium/residue, D 2 = 0.63 deuterium/residue, D 3 = 0.67 deuterium/residue, and D 4 = 0.29 deuterium/residue. The number of unknowns is exactly determined by the number of independent equations in this example; however, for the large 13 residue fragment, we can only specify the average number of deuterium/residue and cannot further delineate the distribution within this fragment. The reader should also notice that residues 211–226 are not represented by an isolated set of overlapping peptides. In fact, these four peptides also overlap with peptides 12–14, defining the overall region from 211 to 237 as a single set of overlapping peptides. The analysis of this full region is not as trivial, because there are six unknowns and seven equations; therefore, the best solutions were determined by linear least squares fitting, with the only stipulation being that no fragment can have less than zero deuterium/residue. These fitted values are those that are plotted in Figure 4. To interpret these results from the H/D exchange studies, we constructed a molecular model of the α-actinin 1-CH2 domain based on the crystal structure of the α-actinin 3-CH2 domain that was available at the time (Franzot et al. 2005). The two domains show very high amino acid sequence identity (87%) and, therefore, a reasonable homology model (Fig. 5) could be constructed using a standard threading algorithm. The model is color coded (blue, yellow, and red, representing low, intermediate, and high exchange, respectively) to represent the relative incorporation of deuterium after a 15 min exchange. The exchange data for the peptides from the unliganded protein were used to compare the solvent accessibility calculated from this CH2 structural model (Fig. 6). A correlation value of R = 0.75 suggests that the H/D exchange data is consistent with the model of the α-actinin 1-CH2 domain constructed.
Figure 5.

Phosphoinositide binding influences helices E and F. A ribbon plot of the α-actinin 1-CH2 domain based on the crystal structure of α-actinin 3 shows the relative deuterium incorporation following 15-min exchange (Table 1): blue < 0.2, yellow = 0.2–0.4, and red > 0.4 deuterium/residue. Gray represents undetected amino acid residues. The location of actin-binding sequence 3 (ABS3) and the side chains for K162, H170, and K174, which have been proposed to interact with the phosphate groups on the inositol head group of the phosphoinositides, are also shown. We propose that the phosphate groups on the fourth and fifth position influence helix F, whereas the phosphate group on the third position influences helix E. The structures of the phosphoinositides used in this study are also shown (www.matreya.com).
Figure 6.

Observed hydrogen–deuterium exchange within the CH2 domain was consistent with the model based on the crystal structure. Comparison of normalized peptide exposure versus number of deuteriums per residue observed in pepsin-digested CH2. A least-squares fit was performed with each data point weighted by 1/Σ2, resulting in a linear relationship of y = 1.0584x + 0.3096 (R = 0.75). The peptic fragments from the 15-min CH2 deuterium incorporation experiment (Table 1) were used for this analysis.
From the model, we see that the deuterium content varied across the CH2 domain, with the N-terminal region showing the highest level of exchange and, thus, being most accessible to solvent. This N-terminal region, which includes ABS3, has been proposed to require exposure on the surface of the CH2 domain to be functional and, therefore, was expected to have high solvent accessibility, as observed. In contrast, helix C was observed to have the lowest solvent accessibility consistent with this region being buried within the core of the CH2 domain.
The exchange data in Table 1 are highly redundant in that a majority of the peptides studied are overlapping in sequence. This affords us the opportunity to construct higher resolution maps for deuterium incorporation along the protein sequence, in some cases down to individual amino acid residues. In this analysis, we deconvolute the exchange data for peptides using a set of linear equations for groups of overlapping peptides. These equations are set up by first identifying for each group of overlapping peptides those regions that are in common and those that are unique to each sequence. We then set as variables the number of deuteriums incorporated for each region and solve the equations analytically. The only constraint imposed in this analysis is that no region will incorporate less than zero deuteriums to the respective peptides.
This deconvolution analysis of deuterium incorporation in the CH2 domain bound to the phosphoinositides identified two regions of interest that were significantly affected by these ligands (Fig. 7). Both PtdIns (4,5)-P2 and PtdIns (3,4,5)-P3 decreased deuterium incorporation in the loop region immediately preceding helix F. This is observed as near equivalent loss in incorporation (about –0.6 ΔD/residue relative to the unliganded protein) at residues 223–224 along the sequence. In addition, PtdIns (3,4,5)-P3 increased deuterium incorporation within helix E, seen as a +0.8 ΔD/residue at 210. We should note, however, that these results should not be interpreted as the loss or gain of deuteriums only at these particular amino acid residues, but are indicative of a significant change in incorporation, relative to the unliganded protein, in the immediate vicinity of these residues.
Figure 7.

Phosphoinositide binding differentially regulated local hydrogen–deuterium exchange within the CH2 domain. The change in deuterium incorporation resulting from PtdIns (4,5)-P2 or PtdIns (3,4,5)-P3 binding is shown for each peptic peptide following 15 min of H/D exchange. The structural units of the CH2 domain are represented between the graphs.
Discussion
Phosphoinositide binding regulates the activity, protein–protein interactions, and localization of various proteins involved in cellular signaling, organization, and structure. Many cytoskeletal phosphoinositide binding proteins, such as vinculin, talin, and the ERM family, exist in an inactive folded conformation which are unfolded to active states following binding of the phosphoinositide and the subsequent disruption of intramolecular interactions (Yin and Janmey 2003; Janmey and Lindberg 2004). Whereas these proteins are monomeric, α-actinin is a rather unusual phosphoinositide binding protein which functions as an antiparallel homodimer. Previously, we found that PtdIns (4,5)-P2 and PtdIns (3,4,5)-P3 bind to the CH2 domain, differentially regulating α-actinin interaction with actin filaments and integrin adhesion receptors (Greenwood et al. 2000; Fraley et al. 2003, 2005; Corgan et al. 2004). However, it was not known how PtdIns (4,5)-P2 and PtdIns (3,4,5)-P3 binding influences the structure of the CH2 domain of α-actinin. H/D exchange MS provides a novel approach to examine the regulation of protein structure by phosphoinositide binding. The large amount of exchange observed for the isolated CH2 domain after 15 sec, 75% of total exchange (Fig. 3), is one of the fastest reported, and is consistent with the large number of extended loop regions in the domain. Analysis of the H/D exchange in the peptic fragments indicated that deuterium incorporation was distributed throughout the CH2 domain, reflecting relative uniformity in solvent accessibility across the entire domain. The distribution of the observed amide H/D exchange was consistent with the solvent accessibility calculated from the molecular model of the CH2 domain model derived on the crystal structure of the α-actinin 3 CH2 domain (Fig. 6). This analysis validates the use of H/D exchange MS to examine the influence of phosphoinositide binding on the solvent accessibility of the CH2 domain, and allows direct comparison of deuterium incorporation in the absence and presence of PtdIns (4,5)-P2 or PtdIns (3,4,5)-P3. There were three major findings from these studies: (1) PtdIns (3,4,5)-P3 increased and PtdIns (4,5)-P2 decreased overall H/D exchange within the isolated CH2 domain, (2) both PtdIns (4,5)-P2 and PtdIns (3,4,5)-P3 binding decreased H/D exchange within the loop region preceding helix F of the CH2 domain, and (3) PtdIns (3,4,5)-P3 binding increased H/D exchange within helix E of the CH2 domain. These results help to understand the mechanism by which phosphoinositide binding regulates α-actinin structure and function.
Changes in the structural dynamics of a protein may be regulated by local fluctuations or perturbations in conformation. By examining peptic peptides following H/D exchange, we could analyze the degree of amide deuterium incorporation within local regions of the CH2 domain. From this analysis, we found that both PtdIns (4,5)-P2 and PtdIns (3,4,5)-P3 decreased amide deuterium incorporation into the loop region preceding helix F. Since this region of the CH2 domain is affected by both phosphoinositides, but is not known to be directly involved in binding either of the phosphoinositides, we suggest that the phosphates on the fourth and fifth position of the inositol head group were responsible for mediating perturbations to the protein conformation that lead to decreased incorporation within this region (Fig. 5). Previous reports (Fukami et al. 1996; Fraley et al. 2003) have demonstrated that phosphoinositides bind to residues 158–174 within the CH2 domain (Fig. 1). Interestingly, both PtdIns (4)-P and PtdIns (5)-P can bind to α-actinin, whereas PtdIns (3)-P does not (Fraley et al. 2003). In addition, PtdIns (4,5)-P2 and PtdIns (3,4,5)-P3 bind α-actinin with equal affinity, IC50 ∼ 5 μM. These results suggest that the 4- and 5-phosphates mediate the interaction of phosphoinositides with α-actinin. Furthermore, site-directed mutagenesis of K162, H170, and K174 in the CH2 domain significantly decreased α-actinin binding to phosphoinositides, suggesting that these positively charged residues may be interacting with the negatively charged 4- and 5-phosphates. Since both PtdIns (4,5)-P2 and PtdIns (3,4,5)-P3 inhibit F-actin binding and bundling, we propose that the 4- and 5-phosphates mediate α-actinin by constricting the CH2 domain and altering the orientation of ABS3 thereby decreasing the affinity for F-actin.
We also found that PtdIns (3,4,5)-P3 increased deuterium incorporation within helix E. Since only PtdIns (3,4,5)-P3 was observed to influence helix E, it is probable that the phosphate group in the third position of the inositol head group induces a conformational change leading to the increased incorporation of deuterium within this region. Since only PtdIns (3,4,5)-P3 can disrupt F-actin bundling (Corgan et al. 2004), we propose that the 3-phosphate acts to disorder the CH2 domain, therefore reducing the ability of α-actinin to bundle F-actin. Interestingly, PtdIns (3,4,5)-P3 does not disrupt the binding of the isolated actin-binding region to actin filaments, suggesting that the influence of the 3-phosphate depends, in part, on other regions of the α-actinin antiparallel homodimer. Cryoelectron microscopy (Tang et al. 2001) and biochemical assays with the individual domains (Young and Gautel 2000), provide strong evidence suggesting that the N- and C-terminal regions of α-actinin interact, although the precise interaction sites have not been determined. We propose that the phosphate group on the third position of the inositol head group influences interactions between the N- and C-terminal regions of α-actinin. This model is consistent with other findings showing that PtdIns (3,4,5)-P3 binding disrupts α-actinin interaction with integrin adhesion receptors to spectrin repeats 1 and 2 (Greenwood et al. 2000; Kelly and Taylor 2005) and increases the rate of α-actinin cleavage by thermolysin within spectrin repeats 1 and 4 (Corgan et al. 2004). Based on the distance from the phosphoinositide binding site to the spectrin repeats (Fig. 1), the most likely mechanism for PtdIns (3,4,5)-P3 to regulate these regions is by altering the orientation of the actin-binding region through regulation of the interaction between the N- and C-terminal regions of α-actinin. Future studies with full-length α-actinin will map the interface between the N- and C-terminal regions and determine how PtdIns (3,4,5)-P3 binding mediates this interaction.
Materials and Methods
Protein preparation
His-tagged CH2 domain (his-CH2) of human α-actinin 1 was expressed and purified as described previously (Fraley et al. 2003) and dialyzed against 10 mM HEPES, pH 7.0, 50 mM NaCl, 1 mM EDTA.
Global H/D exchange
His-CH2 (140 μM) was preincubated in the absence or presence of 500 μM PtdIns (4,5)-P2 or PtdIns (3,4,5)-P3 for 15 min at 25°C. Both PtdIns (4,5)-P2 or PtdIns (3,4,5)-P3 bind to the CH2 domain with an IC50 of ∼5 μM (Fraley et al. 2003). H/D exchange was carried out at 4°C by diluting the protein 10-fold in D2O and incubating for time increments of 0.25, 0.5, 1, 2, 5, and 15 min. Final concentrations for each component were as follows: his-CH2 (14 μM) and phosphoinositide (50 μM) in buffer containing 1 mM HEPES, pD 7.0, 5 mM NaCl, 0.1 mM EDTA. H/D exchange was quenched by removing 200 pmol of his-CH2 and adding to formic acid (5%) resulting in a pH of 2.5. Samples were then frozen in liquid nitrogen and stored at −80°C until MS analysis. Samples (64 pmol/injection) were analyzed by a Finnigan-Mat ESI-Quadrapole-Ion Trap mass spectrometer, with a mass accuracy of 1 Da, following separation on a reverse phase C4 column (0.32 mm × 100 mm, Jupiter, 5 μ, 300 Å) at 4°C. Data were gathered from global H/D experiments using the program Xcaliber and processed using the program Magtran. Xcaliber files were subjected to Magtran deconvolution resulting in a molecular weight corresponding to a mass:charge peak envelope for each time point (Kim et al. 2001).
Local H/D exchange
H/D exchange was carried out as described above with final concentrations of 17 μM his-CH2 and 34 μM phosphoinositide. Based on an IC50 ∼ 5 μM (Fraley et al. 2003), the ligand was ∼80% bound under these conditions. Following quenching with formic acid (final pH 2.5), immobilized pepsin (60 μL) was added to 500 pmol of his-CH2 and incubated for 2 min at 4°C. The pepsin beads were then pelleted by centrifugation, and the supernatant removed, frozen in liquid nitrogen, and stored at −80°C. Samples (34 pmol/injection) were analyzed by a Micromass Q-Tof Ultima ESI mass spectrometer following separation on a reverse phase C5 column (0.32mm × 50 mm, Jupiter, 5 μ, 300 Å) and C18 micron trap in series at 4°C. Peptide H/D exchange data were collected and processed using MassLynx. The deuterium level for each peptide was determined from the difference in centroided masses between the deuterated and nondeuterated peptide (Yan et al. 2004a).
Back exchange was estimated by measuring the deuterium content of the peptides from pepsin digested CH2 domain prepared using two different methods that promote full deuteration of the protein. (1) His-CH2 was incubated in D2O for 36 h at 37°C. (2) His-CH2 was incubated for 36 h at 37°C in D2O containing 8 M urea to denature the protein. Back exchange for the 16 peptides averaged 42.8% using method one and 43.0% using method two, ranging from 27.0%–63.5%. The deuterium content of the peptides was not adjusted for back exchange since the peptides from the unliganded and liganded CH2 domain were processed identically side by side. However, statistical analysis comparing deuterium content of the unliganded CH2 domain with that of the ligand bound form were carried out using a paired t-test.
Structural modeling
The atomic structure of the actin binding domain of human α-actinin 3 was obtained from the Protein Data Bank (PDB accession code 1TJT, chain A) and its sequence aligned with the actin binding domain of human α-actinin 1 using ClustalW with default parameters. The alignment was then submitted to SWISS-MODEL (Schwede et al. 2003) for automated homology modeling to derive a molecular model for the CH2 domain of human α-actinin 1.
Solvent accessible surfaces for the peptic peptides were calculated by the Connolly method (Connolly 1983) with the molecular modeling program Insight II (Accelrys). First, hydrogen atoms were added to the model structure using standard geometries. Solvent accessible surface areas were then calculated for each intact peptic peptide using a probe radius of 1.4 Å. The accessible surfaces of individual amino acid components from each peptic peptide were then calculated and used to normalize the surfaces of the intact models for the fragments.
Acknowledgments
This article was made possible in part by the Mass Spectrometry and Cell Imaging and Analysis Core Facilities of the Environmental Health Sciences Center, Oregon State University. Special thanks to Brian Arbogast and Xuguang Yan for assistance with mass spectrometry and Jeff Watson with computational analysis. This work was supported by NIH/NIGMS Research Project Grants GM63711 to J.A.G. and R1GM62957A to P.S.H. NIH/NIEHS Program Project Grant ES00040 to M.L.D., and NIH/NIEHS Center Grant ES00210.
Footnotes
Reprint requests to: Jeffrey A. Greenwood, Department of Biochemistry and Biophysics, ALS 2011, Oregon State University, Corvallis, OR 97331, USA; e-mail: jeffrey.greenwood@orst.edu; fax: (541) 737-0481.
Abbreviations: CH, calponin homology; ABS, actin-binding sequence; H/D, hydrogen/deuterium; MS, mass spectrometry; ESI, electrospray ionization; his-CH2, histidine-tagged CH2 domain; PtdIns (4,5)-P2, phosphatidylinositol-4,5-diphosphate, PtdIns (3,4,5)-P3, phosphatidylinositol-3,4,5-triphosphate.
Article published online ahead of print. Article and publication date are at http://www.proteinscience.org/cgi/doi/10.1110/ps.073146807.
References
- Baerga-Ortiz A., Hughes, C.A., Mandell, J.G., and Komives, E.A. 2002. Epitope mapping of a monoclonal antibody against human thrombin by H/D-exchange mass spectrometry reveals selection of a diverse sequence in a highly conserved protein. Protein Sci. 11: 1300–1308. [DOI] [PMC free article] [PubMed] [Google Scholar]
- Banuelos S., Saraste, M., and Carugo, K.D. 1998. Structural comparisons of calponin homology domains: Implications for actin binding. Structure 6: 1419–1431. [DOI] [PubMed] [Google Scholar]
- Blanchard A., Ohanian, V., and Critchley, D. 1989. The structure and function of α-actinin. J. Muscle Res. Cell Motil. 10: 280–289. [DOI] [PubMed] [Google Scholar]
- Connolly M.L. 1983. Solvent-accessible surfaces of proteins and nucleic acids. Science 221: 709–713. [DOI] [PubMed] [Google Scholar]
- Corgan A.M., Singleton, C., Santoso, C.B., and Greenwood, J.A. 2004. Phosphoinositides differentially regulate α-actinin flexibility and function. Biochem. J. 378: 1067–1072. [DOI] [PMC free article] [PubMed] [Google Scholar]
- de Planque M.R., Bonev, B.B., Demmers, J.A., Greathouse, D.V., Koeppe II, R.E., Separovic, F., Watts, A., and Killian, J.A. 2003. Interfacial anchor properties of tryptophan residues in transmembrane peptides can dominate over hydrophobic matching effects in peptide–lipid interactions. Biochemistry 42: 5341–5348. [DOI] [PubMed] [Google Scholar]
- Engen J.R. and Smith, D.L. 2001. Investigating protein structure and dynamics by hydrogen exchange MS. Anal. Chem. 73: 256A–265A. [DOI] [PubMed] [Google Scholar]
- Fraley T.S., Tran, T.C., Corgan, A.M., Nash, C.A., Hao, J., Critchley, D.R., and Greenwood, J.A. 2003. Phosphoinositide binding inhibits α-actinin bundling activity. J. Biol. Chem. 278: 24039–24045. [DOI] [PubMed] [Google Scholar]
- Fraley T.S., Pereira, C.B., Tran, T.C., Singleton, C., and Greenwood, J.A. 2005. Phosphoinositide binding regulates α-actinin dynamics: Mechanism for modulating cytoskeletal remodeling. J. Biol. Chem. 280: 15479–15482. [DOI] [PubMed] [Google Scholar]
- Franzot G., Sjoblom, B., Gautel, M., and Djinovic Carugo, K. 2005. The crystal structure of the actin-binding domain from α-actinin in its closed conformation: Structural insight into phospholipid regulation of α-actinin. J. Mol. Biol. 348: 151–165. [DOI] [PubMed] [Google Scholar]
- Fukami K., Sawada, N., Endo, T., and Takenawa, T. 1996. Identification of a phosphatidylinositol 4,5-bisphosphate-binding site in chicken skeletal muscleα-actinin. J. Biol. Chem. 271: 2646–2650. [DOI] [PubMed] [Google Scholar]
- Garcia R.A., Pantazatos, D., and Villarreal, F.J. 2004. Hydrogen/deuterium exchange mass spectrometry for investigating protein–ligand interactions. Assay Drug Dev Technol. 2: 81–91. [DOI] [PubMed] [Google Scholar]
- Greenwood J.A., Theibert, A.B., Prestwich, G.D., and Murphy-Ullrich, J.E. 2000. Restructuring of focal adhesion plaques by PI 3-kinase. Regulation by PtdIns (3,4,5)-p(3) binding to α-actinin. J. Cell Biol. 150: 627–642. [DOI] [PMC free article] [PubMed] [Google Scholar]
- Janmey P.A. and Lindberg, U. 2004. Cytoskeletal regulation: Rich in lipids. Nat. Rev. Mol. Cell Biol. 5: 658–666. [DOI] [PubMed] [Google Scholar]
- Keep N.H., Winder, S.J., Moores, C.A., Walke, S., Norwood, F.L., and Kendrick-Jones, J. 1999. Crystal structure of the actin-binding region of utrophin reveals a head-to-tail dimer. Struct. Fold. Des. 7: 1539–1546. [DOI] [PubMed] [Google Scholar]
- Kelly D.F. and Taylor, K.A. 2005. Identification of the β1-integrin binding site on α-actinin by cryoelectron microscopy. J. Struct. Biol. 149: 290–302. [DOI] [PubMed] [Google Scholar]
- Kim M.Y., Maier, C.S., Reed, D.J., and Deinzer, M.L. 2001. Site-specific amide hydrogen/deuterium exchange in E. coli thioredoxins measured by electrospray ionization mass spectrometry. J. Am. Chem. Soc. 123: 9860–9866. [DOI] [PubMed] [Google Scholar]
- Lu J., Witcher, D.R., White, M.A., Wang, X., Huang, L., Rathnachalam, R., Beals, J.M., and Kuhstoss, S. 2005. IL-1β epitope mapping using site-directed mutagenesis and hydrogen-deuterium exchange mass spectrometry analysis. Biochemistry 44: 11106–11114. [DOI] [PubMed] [Google Scholar]
- Mandell J.G., Baerga-Ortiz, A., Falick, A.M., and Komives, E.A. 2005. Measurement of solvent accessibility at protein–protein interfaces. Methods Mol. Biol. 305: 65–80. [DOI] [PubMed] [Google Scholar]
- Norwood F.L., Sutherland-Smith, A.J., Keep, N.H., and Kendrick-Jones, J. 2000. The structure of the N-terminal actin-binding domain of human dystrophin and how mutations in this domain may cause Duchenne or Becker muscular dystrophy. Struct. Fold. Des. 8: 481–491. [DOI] [PubMed] [Google Scholar]
- Otey C.A., Pavalko, F.M., and Burridge, K. 1990. An interaction between α-actinin and the β 1 integrin subunit in vitro. J. Cell Biol. 111: 721–729. [DOI] [PMC free article] [PubMed] [Google Scholar]
- Pavalko F.M. and Burridge, K. 1991. Disruption of the actin cytoskeleton after microinjection of proteolytic fragments of α-actinin. J. Cell Biol. 114: 481–491. [DOI] [PMC free article] [PubMed] [Google Scholar]
- Schwede T., Kopp, J., Guex, N., and Peitsch, M.C. 2003. SWISS-MODEL: An automated protein homology-modeling server. Nucleic Acids Res. 31: 3381–3385. [DOI] [PMC free article] [PubMed] [Google Scholar]
- Tang J., Taylor, D.W., and Taylor, K.A. 2001. The three-dimensional structure of α-actinin obtained by cryoelectron microscopy suggests a model for Ca(2+)-dependent actin binding. J. Mol. Biol. 310: 845–858. [DOI] [PubMed] [Google Scholar]
- Wang F., Li, W., Emmett, M.R., Hendrickson, C.L., Marshall, A.G., Zhang, Y.L., Wu, L., and Zhang, Z.Y. 1998. Conformational and dynamic changes of Yersinia protein tyrosine phosphatase induced by ligand binding and active site mutation and revealed by H/D exchange and electrospray ionization Fourier transform ion cyclotron resonance mass spectrometry. Biochemistry 37: 15289–15299. [DOI] [PubMed] [Google Scholar]
- Winkler J., Lunsdorf, H., and Jockusch, B.M. 1997. Flexibility and fine structure of smooth-muscle α-actinin. Eur. J. Biochem. 248: 193–199. [DOI] [PubMed] [Google Scholar]
- Yan X., Broderick, D., Leid, M.E., Schimerlik, M.I., and Deinzer, M.L. 2004a. Dynamics and ligand-induced solvent accessibility changes in human retinoid X receptor homodimer determined by hydrogen deuterium exchange and mass spectrometry. Biochemistry 43: 909–917. [DOI] [PubMed] [Google Scholar]
- Yan X., Watson, J., Ho, P.S., and Deinzer, M.L. 2004b. Mass spectrometric approaches using electrospray ionization charge states and hydrogen-deuterium exchange for determining protein structures and their conformational changes. Mol. Cell. Proteomics 3: 10–23. [DOI] [PubMed] [Google Scholar]
- Yin H.L. and Janmey, P.A. 2003. Phosphoinositide regulation of the actin cytoskeleton. Annu. Rev. Physiol. 65: 761–789. [DOI] [PubMed] [Google Scholar]
- Young P. and Gautel, M. 2000. The interaction of titin and α-actinin is controlled by a phospholipid-regulated intramolecular pseudoligand mechanism. EMBO J. 19: 6331–6340. [DOI] [PMC free article] [PubMed] [Google Scholar]