

Abstract
To determine the role of CD8+ T cells in controlling simian immunodeficiency virus (SIV) replication in vivo, we examined the effect of depleting this cell population using an anti-CD8 monoclonal antibody, OKT8F. There was on average a 99.9% reduction of CD8 cells in peripheral blood in six infected Macaca mulatta treated with OKT8F. The apparent CD8 depletion started 1 h after antibody administration, and low CD8 levels were maintained until day 8. An increase in plasma viremia of one to three orders of magnitude was observed in five of the six macaques. The injection of a control antibody to an infected macaque did not induce a sustained viral load increase, nor did it significantly reduce the number of CD8+ T cells. These results demonstrate that CD8 cells play a crucial role in suppressing SIV replication in vivo.
Keywords: simian immunodeficiency virus, macaque, OKT8, viremia, cytotoxic T lymphocyte
Since the original demonstration that attenuated simian immunodeficiency virus (SIV)1 could confer protection against a wild-type virus in rhesus macaques (1), a better understanding of the protective mechanism(s) has been sought. Although CTL (2), Th cell (3), and neutralizing antibody (1) responses have been found in these protected macaques, the correlates of protective immunity remain undetermined. Antibody responses to SIV gp130 and p24 antigens do not correlate with protection (4). The role of neutralizing antibodies in protection is questionable (4, 5). Although the protective role of Th cells has been implicated in humans by a correlative study (6), it has neither been shown in the macaque model, nor has its importance been documented in vivo. CD8+ CTLs have been shown to protect against a variety of viral infections in animals (7) and humans (8–11). Therefore, it is possible that such a response will afford protection against retroviral infections as well. Several lines of experimental evidence support this supposition. First, a strong CTL response has been implicated in suppressing HIV infection in humans (12–16) and SIV infection in macaques (17, 18). Second, there is an inverse correlation between viral load and virus-specific CTL precursor frequencies in HIV-infected patients (19, 20), and between the level of plasma viremia and the number of effector CTLs (21). Third, a selective reduction of HIV-specific CTL precursors occurs in the advanced stages of HIV infection (22, 23). The mechanisms of CD8+ T cell– mediated protection have been previously demonstrated, mostly in vitro. CD8+ T cells may be able to control HIV or SIV replication by either lysing the HIV-infected cell directly or by the production of β-chemokines or other as yet undefined viral inhibitory factors (24–27).
Several attempts have been made to examine the in vivo role of CD8+ T cells in SIV infection, but no consensus has been reached. To elucidate the mechanisms of protective immunity, Stebbings et al. (28) immunized macaques with an attenuated virus, SIVmac32H (pC8). They then partially depleted CD8+ T cells from these macaques, and challenged each with a wild-type pathogenic SIVmac32H (pJ5). The wild-type virus did not replicate in these vaccinated macaques even after their CD8+ T cells were largely eliminated. Thus, protection was not abrogated by a partial lowering of the CD8+ T cells. In another experiment performed by Matano et al. (29), naive macaques were first depleted of CD8+ T cells, then challenged with a chimeric SIV/HIV, also known as SHIV. Higher viral loads and a more profound depletion of CD4+ T cells were found in these macaques than in controls, suggesting that CD8+ T cells are important in the control of SIV replication during primary infection.
Viral load in plasma has been shown to be a major prognostic marker for disease progression in HIV-infected humans (30). We hypothesize that specific immune responses mediated by CD8+ T cells play a key role in suppressing virus replication. In the current study, we investigated the in vivo role of CD8+ T cells in SIV-infected rhesus macaques that have reached a steady state of viremia. CD8+ T cells were depleted by an anti-CD8 antibody, and the virologic and immunologic consequences were examined. We found that the depletion of CD8+ T cells in infected macaques resulted in large increases in plasma viremia, thereby demonstrating that CD8+ T cells must play a major role in the control of chronic SIV replication in vivo.
Materials and Methods
Animals Used in the Study.
Seven SIV-infected and one uninfected rhesus macaque (Macaca mulatta) were used (see Table I). Six infected and one uninfected animal were given OKT8F (gift from R. Knowles, R.W. Johnson Pharmaceutical Research Institute, Raritan, NJ). One other infected macaque received an isotype-matched (IgG2a) control antibody, P1.17 (TIB-10; American Type Culture Collection). All animal protocols were approved by the Institutional Animal Care and Use Committee at the Tulane Regional Primate Research Center.
Table I.
Characteristics of the Macaques
| Macaques | Pretreatment and posttreatment values | |||||||||||||||||||
|---|---|---|---|---|---|---|---|---|---|---|---|---|---|---|---|---|---|---|---|---|
| Antibody given | Plasma RNA | CD4/μl | CD8/μl | Inoculation | ||||||||||||||||
| Type | Dose | Pre- | Peak | Pre- | Day 3 | Pre- | Day 3 | Virus | Duration of infection | |||||||||||
| mg/kg | copies/ml | mo | ||||||||||||||||||
| Controls | ||||||||||||||||||||
| AT-03 | OKT8F | 2 | – | – | 1,698 | 856 | 1,086 | 0 | None | – | ||||||||||
| AT-48 | P1.17 | 2 | 1.3 × 10⁵ | 3.5 × 10⁵ | 251 | 186 | 213 | 210 | SIVmac251 | 16 | ||||||||||
| Tests | ||||||||||||||||||||
| AT-02 | OKT8F | 2 | 8 × 10⁴ | 2 × 10⁸ | 903 | 238 | 3,379 | 4 | SIVmac251 | 15 | ||||||||||
| AT-22 | OKT8F | 2 | 1 × 10⁵ | 2 × 10⁶ | 112 | 94 | 285 | 0 | SIVmac239 | 34 | ||||||||||
| AR-68 | OKT8F | 2 | <4 × 10² | 2 × 10⁵ | 513 | 378 | 944 | 0 | SIVmac251 | 23 | ||||||||||
| AR-71 | OKT8F | 2 | <4 × 10² | 1 × 10⁵ | 707 | 353 | 834 | 0 | SIVmac251 | 25 | ||||||||||
| AR-90 | OKT8F | 2 | <4 × 10² | <4 × 10² | 630 | 342 | 458 | 1 | SIVmac251 | 50 | ||||||||||
| AR-93 | OKT8F | 2 | 6 × 10⁴ | 1 × 10⁷ | 166 | 95 | 989 | 0 | SIVmac251 | 12 | ||||||||||
Depletion of CD8+ T Cells In Vivo.
Macaques were first anesthetized with 10 mg/kg ketamine-HCl, then given bolus injections of OKT8F or P1.17 at 2 mg/kg daily for three consecutive days. 5–6 ml of peripheral blood was obtained frequently before and at various time points after antibody injection from each monkey.
Phenotypic Analysis of the T Cell Subsets.
Four-color flow cytometric analyses of whole blood samples were performed to monitor changes in T cell populations. In brief, 100 μl aliquots of whole blood were incubated with respective antibodies for 30 min at 4°C, then washed twice with PBS containing 2% FCS. The red blood cells were first lysed with FACS Lysing Solution® (Becton Dickinson), and washed away. Ki67-FITC (Immunotech) or an FITC-conjugated control antibody was then added to respective tubes for intracellular staining for 30 min at 4°C, followed by further washes and resuspension in 2% formaldehyde (Tousimis Research Corp.) before analysis on a FACSCalibur™ flow cytometer (Becton Dickinson). The antibodies used in the study were RhCD3-FITC (Immunotech), CD3-PE (PharMingen), CD4-allophycocyanin (APC; Exlpha), CD8–peridinine chlorophyll protein (PerCP; Becton Dickinson), CD8β-PE (Immunotech), CD45RA-FITC (Becton Dickinson), CD69-PE (Becton Dickinson), and control antibodies IgG1-FITC, IgG1-PE, IgG1-PerCP, and IgG1-APC (Caltag Laboratories).
Quantifying Plasma Load of SIV by Real-time PCR.
To measure the viral load of infected monkeys, plasma was separated from whole blood collected in EDTA-containing tubes. Plasma samples were initially spun at 5,000 rpm for 10 min to remove any cells. About 600 μl to 1 ml of plasma was ultracentrifuged at 17,000 rpm for 60 min at 4°C. Supernatant was removed leaving ∼140 μl of plasma and a viral pellet. Viral RNA was purified using the QIAamp viral RNA kit (QIAGEN Inc.). Reverse transcription of viral RNA was then performed in 96-well plates. Each 30-μl reaction contained 10 μl of viral RNA, 1× Taqman Buffer A (Perkin-Elmer), 5 mM MgCl2, 2.5 μM random hexamers (Perkin-Elmer), 0.5 mM each of dATP, dCTP, dGTP, and dTTP, 20 U RNAsin (Promega), and 20 U Moloney murine leukemia virus reverse transcriptase (Superscript; GIBCO BRL). One round of reverse transcription (25°C for 15 min, 42°C for 40 min, 75°C for 5 min) was performed.
To quantify the copy number of viral RNA, a molecular beacon was used in combination with real-time PCR. This method of detection using molecular beacons (31, 32) and a fluorescence detector system (33) has been described previously. Each 50-μl reaction contained 30 μl of cDNA from the reverse transcription reaction, and the final concentration of each component was as follows: 0.4× PCR buffer II, 0.6× Taqman buffer A, 3.5 mM MgCl2, 0.4 pmol/μl of molecular beacon, 0.4 pmol/μl of each primer, 1.25 U of AmpliTaq Gold DNA polymerase (Perkin-Elmer). The primers used were SL03 (5′-AGGGAAGAAAGCAGATGAATTA-3′) and SL04 (5′-GTTTCACTTTCTCTTCTGCGT-3′). The molecular beacon was designed to recognize a region within SIV gag (5′-FAM-CGCTGGAGAACAAAGAAGGATGTCACAGCG-DABCYL-3′) where FAM (6-carboxyfluorescein) serves as the reporter fluorochrome and DABCYL (4′ dimethylaminophenylazo benzoic acid) the quencher. One cycle of denaturation (95°C for 10 min) was performed, followed by 45 cycles of amplification (95°C for 15 s, 55°C for 30 s, 72°C for 30 s). The PCR reaction was carried out in an ABI 7700 PRISM spectrofluorometric thermal cycler (Applied Biosystems, Inc.) that monitors changes in the fluorescence spectrum of each reaction tube, while simultaneously carrying out programmed temperature cycles.
The method of quantifying viral load was adapted from a previous report (33) with some modifications. For each run, a standard curve was generated from duplicate samples of purified RNA transcripts ranging from 106 copies to 50 copy equivalents per reaction (using serial log dilutions in RNase-free water). Each test specimen was reverse transcribed and amplified in duplicate. A third reaction was processed and amplified without the addition of reverse transcriptase to control for potential DNA contamination. Copy numbers were calculated by interpolation of the experimentally determined threshold cycle as described previously (33). The lower limit of detection was 50 copy equivalents per reaction with a linear dynamic range of >5 logs. When adjusted for the various dilution effects, this results in a sensitivity of ∼400 RNA copies per ml of plasma. The mean of replicate samples was reported.
Results
Eight macaques were included in this study. Seven were SIV-infected, and one was uninfected. The macaques had been inoculated with either SIVmac251 or 239 between 1 and 4 yr before these experiments (Table I). The effects of administration of either a murine anti-CD8 mAb, OKT8F, or an isotype-matched control antibody, P1.17, on lymphocyte subsets and plasma viremia were examined.
Inverse Association between CD8+ T Cell Count and Plasma Viremia after OKT8F Injection.
Six SIV-infected macaques were given OKT8F (2 mg/kg) intravenously as a bolus injection daily for three consecutive days. No febrile episodes or adverse events were observed after each antibody administration. Blood was taken before and at various time points after OKT8F injection. After the third antibody injection, there was an average of 99.9% reduction of CD8+ T cells in peripheral blood (from a mean of 1,139 to 1/μl). In five of six macaques, the depletion was apparent as early as 1 h after the first dose of OKT8F. The number of CD8+ T cells stayed low for 8–10 d, then began to recover in all six animals (Fig. 1). To ensure that the disappearance of CD8+ T cells from the blood was genuine, the difference between the percentage of CD3+ T cells and that of CD4+ T cells was determined as a measurement of the percentage of CD8+ T cells. Results showed that this difference was also substantially decreased in all animals (from a mean of 43 to 13%) after the administration of OKT8F.
Figure 1.

Temporal association between CD8 decline and viral load increase. The impact of OKT8 (dark blue arrows) on viral load (red circles) and CD8+ T cell counts (green squares) was examined in six chronically infected macaques (AT-02, AT-22, AR-68, AR-71, AR-90, and AR-93) and one uninfected animal (AT-03). The injection of a control antibody (light blue arrows), P1.17, to an infected macaque (AT-48) is also shown. The dotted line denotes the level of sensitivity of the viral load assay.
The effect of CD8+ T cell depletion on plasma viremia was dramatic. An immediate increase in viral load in five of six macaques (AT-02, AT-22, AR-68, AR-71, and AR-93) was noted. The magnitude of the peak viral load increase varied from 20- to 2,500-fold (Fig. 1, and Table I). One macaque, AR-90, had a viral load below the level of detection initially (<400 SIV RNA copies/ml) and remained so during the course of the experiment (Fig. 1). The rise and fall of viremia were temporally associated with the drop and then rebound of CD8+ T cell counts during the first 2 wk. After CD8+ T cell counts recovered to pretreatment levels, the viral loads also returned to near baseline levels in four of five macaques that had detectable viremia (Fig. 1). The second rise in plasma viremia on day 36 in AR-68 is unexplained. In contrast, the injection of a control antibody, P1.17, to SIV-infected macaque AT-48 caused only a minor perturbation of CD8+ T cells and a relatively modest elevation of plasma viremia transiently (Table I, and Fig. 1).
The Impact of OKT8F on Other Lymphocyte Subsets.
Consistent with a depletion of CD8+ T cells, the total number of CD3+ T lymphocytes was also reduced in all macaques receiving OKT8F (Fig. 2). The CD3 counts stayed lower than the baseline levels for ∼8–10 d, then began to recover in a majority of the animals (AT-22, AT-03, AT-02, AR-68, and AR-93), following kinetics very similar to those of CD8+ T cells. Macaques AR-71 and AR-90 had a slower rate of recovery.
Figure 2.

The impact of OKT8F, or the control antibody, on the total number of CD3+ (orange squares), CD4+ (blue triangles), and CD4+Ki67+ (purple circles) cells.
The injection of OKT8F also had effects on CD4+ T cells in the six SIV-infected macaques. A 51% reduction of the absolute number of CD4+ T cells occurred, most noticeably on day 1 (from a mean of 505 to 250/μl). This was followed by a period of rapid fluctuation in cell counts over the next few days before the CD4+ T cell numbers recovered to pretreatment levels by day 15 in most macaques (Fig. 2). Again, AR-71 and AR-90 had a slower rate of recovery. The reduction in the number of CD4+ T cells could be accounted for by either an increased destruction of CD4+ T cells as a consequence of elevated viral replication, or OKT8F-mediated cellular activation followed by apoptosis. To distinguish between these two possibilities, OKT8F was given to an uninfected macaque, AT-03. As expected, dramatic CD8 depletion (100%) was observed in the blood of this animal (Fig. 1). But the injection of this antibody also led to a 50% reduction of CD4+ T cells, similar to that observed in infected macaques. Therefore, the partial CD4 depletion is unlikely to be caused by SIV replication.
If antibody injection can lead to nonspecific cellular activation, then the observed viral load increase may have resulted from elevated viral production due to an expansion of activated CD4 target cells, rather than a simple loss of viral suppression by CD8+ T cells. To examine this possibility, an isotype-matched control antibody, P1.17, was given to an SIV-infected macaque, AT-48. P1.17 injection did not deplete CD8+ T cells, but fluctuations in CD4 and CD8 cells were observed (Figs. 1 and 2). On the other hand, the viral load fluctuated, with a modest peak increase of only threefold, which then decreased to levels below the baseline value (Fig. 1, and Table I). Thus, the stimulation caused by large doses of a murine mAb is not sufficient to explain the dramatic increases in plasma viremia observed after OKT8F injection.
The observed increase in viremia after CD8+ T cell depletion could either be a reflection of diminishing viral control by CD8+ T cells, or an augmentation of viral production due to increased availability of CD4+ target cells, or both. Because activated or proliferating CD4+ T cells are better target cells for SIV infections (34), CD4+ T cells were examined by flow cytometry for the expression of a nuclear antigen, Ki67, that is indicative of cells in the process of cycling (not in G0 [35]). Results from these experiments showed that there was an initial reduction in the absolute number of Ki67+CD4+ cells after the first dose of OKT8F, and a later recovery during the period of CD4 cell rebound (Fig. 2). On average, there was only a threefold increase (from 46 to 150/μl) in the number of CD4+ T cells expressing Ki67 in SIV-infected animals and less than a threefold increase in the SIV-negative monkey, AT-03, a level insufficient to account for the increase in plasma viremia. The first peak of Ki67+CD4+ T cells appeared around day 3 in six of seven macaques receiving OKT8F (AT-02, AT-22, AT-68, AR-71, AR-90, and AR-93). The same was true for the macaque (AT-48) that received the isotype-matched control antibody (Fig. 2). In several macaques (AT-02, AT-03, AT-22, and AR-68), there was a pronounced second peak of Ki67+CD4+ T cells on days 12–24, coincident with the timing of CD8+ T cell regeneration. The precise mechanism responsible for this second peak is unclear. However, since it appeared much later than the peak of plasma viremia, this second wave of Ki67+CD4+ cell rise is unlikely to have contributed to the one- to three-log increases in plasma viremia observed earlier.
Theoretical Predictions on the Possible Mechanisms Responsible for the Observed Increase in Plasma Viremia after CD8+ T Cell Depletion in Infected Macaques.
Several mechanisms could be responsible for the observed increase in viral load. The removal of CD8+ CTLs could increase the life span of productively infected cells, leading to greater virion production. Alternatively, the depletion of CD8+ T cells may reduce the production of β-chemokines, which block the entry of certain virions into target cells (26), or of inhibitory factors that suppress viral transcription, thereby increasing virion output from productively infected cells (36). To assess these possibilities, we used a standard model of HIV-1 dynamics (37, 38) adjusted to account for the eclipse phase of the viral life cycle (39, and our unpublished observations). Specifically, we used a model involving target cells, T, productively infected cells, T*, virus, V, and τ which defines the number of days required for a generation of HIV in vivo. In addition, the following parameters are introduced: (a) the death rate of infected cells, δ; (b) the viral production rate, p; and (c) the infection rate constant, k. Based on these parameters, the model could be described by the following equations: (1) dT/dt = λ – dTT – kVT, (2) dT*/dt = ∫ k(t − τ)V(t − τ)T(t − τ)dτ – δT*, and (3) dV/dt = pT* − cV.
The delay τ is given by a gamma distribution with a peak at 1.5 d and an SD of 0.31 d (39). Parameters initially chosen were δ = 0.5 d−1, c = 30 d−1 (reference 39, and our unpublished observations), p = 100 d−1, and dT = 0.01 d−1. The parameters λ and k were chosen to yield a steady state consistent with the measured baseline viral load and CD4+ T cell count. Giving anti-CD8 antibody was assumed to perturb the steady state of the system such that the parameter being examined changed immediately. Theoretical curves were then generated using nonlinear least-squares regression to find the new value of δ, k, or p that gave the best fit to the data.
A representative analysis of the experimental data on two macaques is shown in Fig. 3, where for AT-22, λ = 21.1 d−1 and k = 1.33 × 10⁻³ μl−1d−1, whereas for AR-93, λ = 10.4 d−1 and k = 9.0 × 10⁻⁴ μl−1d−1. To mimic the loss of CTL killing, the death rate of productively infected T cells, δ, was decreased. However, setting δ = 0 as the most extreme case did not cause the viral load to increase as rapidly as observed experimentally. Similarly, increasing the infection rate constant, k, to mimic the loss of β-chemokines from CD8+ T cells, could not explain the rapid increase in viral load seen during the first 24 h, since removing a block on infection has no effect on plasma viral load until after the eclipse phase of the viral life cycle (37). Finally, removing inhibitory factors on viral transcription is equivalent to increasing p, the rate of virion production by productively infected cells. As shown in the two examples in Fig. 3, this gives a rapid increase in plasma virus, followed by a plateau period during which newly produced virions go on to infect cells and traverse the eclipse phase. It is evident from these preliminary theoretical analyses that neither changes in p or k fit the observed data particularly well, but an increase in p provides a better fit than an increase in k.
Figure 3.
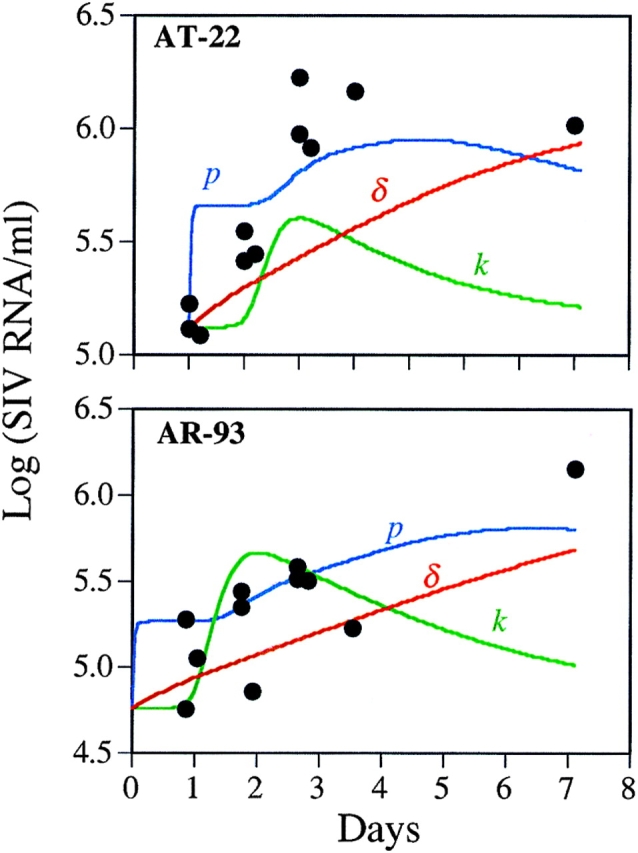
Plasma viral load data from two monkeys together with theoretical predictions based on a standard model of HIV-1 dynamics. The theoretical predictions model changes in the death rate of infected cells, δ, the viral production rate, p, or the infection rate constant, k, after anti-CD8 treatment. The theoretical curves shown were generated using nonlinear least-squares regression to find the new value of δ, k, or p that gave the best fit to the data.
Discussion
The role of CD8+ T cells in the control of SIV replication in vivo awaits experimental confirmation. Here, we examined their importance by depleting these cells with an anti-CD8 mAb, OKT8F, and by following the subsequent virologic and immunologic changes. Although the extent of CD8+ T cell depletion was not examined in lymphoid tissues in our study, we found that depleting such T cells in peripheral blood led to a peak viral load increase of one to three orders of magnitude in five of six macaques studied. These results demonstrate that CD8+ T cells, at a minimum, must play a major role in the control of SIV replication during chronic infection. If OKT8F administration did not result in complete CD8+ T cell depletion in lymphoid tissues in our experiment, then the role of these cells in inhibiting viral replication in vivo would be even more significant than what was observed here. Thus, we concur with the conclusion drawn by Matano et al. (29), who studied the effect of CD8 depletion in primary SHIV infection.
The depletion of CD8+ T cells by OKT8F was not unexpected; however, the speed at which CD8+ T cells disappeared from blood was surprising. Nevertheless, the kinetics of CD8 depletion observed in our experiments is consistent with previous depletion experiments done by others (28, 29). Likewise, the OKT4 antibody cleared CD4+ T cells from peripheral blood within 10 min of injection in rhesus monkeys (40). The OKT3 antibody also depleted most of the peripheral T lymphocytes within 1 h after administration to humans (41).
Several mechanisms may be responsible for the observed depletion of CD8+ T cells from the blood. First, the binding of OKT8F to CD8 molecules on cells may have led to complement-mediated cytolysis. Second, OKT8F may have only masked the epitope recognized by the staining anti-CD8 antibody, resulting in an artificially low number of CD8+ T cells. Third, there may have been an increased CD8 endocytosis after binding by OKT8F, thereby lowering surface CD8 expression without cellular depletion. Finally, there may have been a preferential trapping of antibody-bound CD8+ T cells in lymph tissues, leading to an apparent depletion of such cells in the circulation. To address the second and third possibilities above, we examined the difference in the number of CD3+ and CD4+ T cells. This difference declined in parallel with the number of CD8+ T cells measured directly, showing that there is a genuine depletion of CD8+ T cells in blood. Further experiments are necessary to examine the possibility of trapping of CD8 cells in lymphoid tissues after OKT8F injection. However, if the CD8+ T cells were trapped in the lymph nodes, where most of the viral replication takes place, they were probably nonfunctional given the substantial rise in plasma viremia. Irrespective of the underlying mechanism, the injection of OKT8F appears to have severely impacted the CD8+ T cells as to cause a dramatic increase in virus replication. However, it is still formally possible that the loss of control of viral replication is due partly to the elimination of NK cells that express CD8 on their surface.
Several different mechanisms could potentially be responsible for the increase in viral load. The removal of CD8+ CTLs could increase the life span of productively infected cells, leading to greater virion production. Alternatively, the depletion of CD8+ T cells may reduce the production of factors, such as β-chemokines, that block the entry of certain virions into target cells (26), or of inhibitory factors that suppress viral transcription, thereby reducing virion output from productively infected cells (36). To quantitatively evaluate these hypotheses, we used a standard model of HIV-1 dynamics (37, 38) adjusted to account for the eclipse phase of the viral life cycle (39, and our unpublished observations). For each monkey, a set of parameters was determined that corresponded to the animal being in a steady state with the measured baseline viral load and CD4+ T cell count. To mimic the loss of CTL killing, the death rate of productively infected T cells, δ, was decreased. Even lowering δ to 0 as the most extreme case did not cause the viral load to increase as rapidly as observed. Similarly, increasing the infection rate constant, k, to mimic the loss of β-chemokines from CD8+ T cells, could not explain the rapid increase in viral load seen during the first 24 h (Fig. 3). Finally, removing inhibitory factors on viral transcription (increasing p) gives a better fit to the data. Thus, the rapid rise in plasma viremia over the first 2–3 d is more consistent with a higher virus production rate than a higher infection rate. Moreover, even a maximal decrease in δ fails to give a good fit to the data, suggesting that decreased cytotoxic killing is not the primary mechanism responsible for the increased viremia. Overall, these conclusions on the mechanism of virus inhibition by CD8+ T cells should be viewed as preliminary and must be addressed in greater detail in future experiments.
The depletion of CD8+ T cells was accompanied by reduction in the CD4+ T cells in all animals receiving OKT8F. Several possible explanations might be considered. There may have been increased destruction of CD4+ T cells due to rapid rise in SIV replication after OKT8F infection. However, when the same antibody was given to an uninfected macaque (AT-03), a similar magnitude of depletion of CD4+ T cells was also observed. Therefore, SIV is unlikely to have contributed significantly to this phenomenon. In agreement with our findings, it was observed in a previous study that treatment with anti-CD8 antibody also resulted in lowering of B cells and CD4+ T cells (42). It is worth noting that the injection of OKT3 also led to a depletion of non-T cells, such as B cells and NK cells, in humans (41). Thus, another explanation is that OKT8F injection may be equivalent to a large dose of foreign antigen, activating numerous cell types, including CD4+ T cells that later undergo activation-induced apoptosis. Finally, we have noted that there are greater numbers of lymphocytes (up to 14%) that coexpress CD4 and CD8 in SIV-infected macaques (our unpublished observations). The elimination of such cells by OKT8F may contribute to the lowering of CD4+ T cell counts, although they are numerically insufficient to be the sole mechanism. Further studies are necessary to understand the indirect impact on the CD4+ T cell population.
In summary, we have demonstrated that CD8+ T cells do play a major role in controlling SIV in vivo. Therefore, we suggest that in the development of SIV or HIV vaccines, a stronger emphasis be placed on inducing specific CD8+ T cell responses.
Acknowledgments
We thank L. Martin, J. Lifson, and M. Piatak for advice, S. Monard and C. Lanclos for technical assistance, R. Connor for providing macaque AT-48, W. Chen for graphics, and R. Knowles for providing OKT8F.
Abbreviation used in this paper
- SIV
simian immunodeficiency virus
Footnotes
S. Tuttleton is a student in the Tri-Institutional M.D.-Ph.D. Program supported by National Institutes of Health Medical Scientist Training Program grant GM 07739. This study was supported by National Institutes of Health grants AI40387, AI42848, AI43042, and AI38573, as well as by funding from the Bristol Myers Squibb Foundation and the Irene Diamond Fund.
References
- 1.Daniel MD, Kirchhoff F, Czajak SC, Sehgal PK, Desrosiers RC. Protective effects of a live attenuated SIV vaccine with a deletion in the nef gene. Science. 1992;258:1938–1941. doi: 10.1126/science.1470917. [DOI] [PubMed] [Google Scholar]
- 2.Johnson RP, Glickman RL, Yang JQ, Kaur A, Dion JT, Mulligan MJ, Desrosiers RC. Induction of vigorous cytotoxic T-lymphocyte responses by live attenuated simian immunodeficiency virus. J Virol. 1997;71:7711–7718. doi: 10.1128/jvi.71.10.7711-7718.1997. [DOI] [PMC free article] [PubMed] [Google Scholar]
- 3.Dittmer U, Nisslein T, Bodemer W, Petry H, Sauermann U, Stahl-Hennig C, Hunsmann G. Cellular immune response of rhesus monkeys infected with a partially attenuated nef deletion mutant of the simian immunodeficiency virus. Virology. 1995;212:392–397. doi: 10.1006/viro.1995.1496. [DOI] [PubMed] [Google Scholar]
- 4.Connor RI, Montefiori DC, Binley JM, Moore JP, Bonhoeffer S, Gettie A, Fenamore EA, Sheridan KE, Ho DD, Dailey PJ, Marx PA. Temporal analyses of virus replication, immune responses, and efficacy in rhesus macaques immunized with a live, attenuated simian immunodeficiency virus vaccine. J Virol. 1998;72:7501–7509. doi: 10.1128/jvi.72.9.7501-7509.1998. [DOI] [PMC free article] [PubMed] [Google Scholar]
- 5.Almond N, Rose J, Sangster R, Silvera P, Stebbings R, Walker B, Stott EJ. Mechanisms of protection induced by attenuated simian immunodeficiency virus. I. Protection cannot be transferred with immune serum. J Gen Virol. 1997;78:1919–1922. doi: 10.1099/0022-1317-78-8-1919. [DOI] [PubMed] [Google Scholar]
- 6.Rosenberg ES, Billingsley JM, Caliendo AM, Boswell SL, Sax PE, Kalams SA, Walker BD. Vigorous HIV-1-specific CD4+ T cell responses associated with control of viremia. Science. 1997;278:1447–1450. doi: 10.1126/science.278.5342.1447. [DOI] [PubMed] [Google Scholar]
- 7.Yap KL, Ada GL, McKenzie IF. Transfer of specific cytotoxic T lymphocytes protects mice inoculated with influenza virus. Nature. 1978;18:238–239. doi: 10.1038/273238a0. [DOI] [PubMed] [Google Scholar]
- 8.McMichael AJ, Gotch FM, Nobel GR, Beave PAS. Cytotoxic T-cell immunity to influenza. N Engl J Med. 1983;309:13–17. doi: 10.1056/NEJM198307073090103. [DOI] [PubMed] [Google Scholar]
- 9.Borysiewicz LK, Hickling JK, Graham S, Sinclair J, Cranage MP, Smith GL, Sissons JGP. Human cytomegalovirus-specific cytotoxic T cells. Relative frequency of stage-specific CTL recognizing the 72-kD immediate early protein and glycoprotein B expressed by recombinant vaccinia viruses. J Exp Med. 1988;168:919–931. doi: 10.1084/jem.168.3.919. [DOI] [PMC free article] [PubMed] [Google Scholar]
- 10.Borysiewicz LK, Graham S, Hickling JK, Mason PD, Sissons JG. Human cytomegalovirus-specific cytotoxic T cells: their precursor frequency and stage specificity. Eur J Immunol. 1988;18:269–275. doi: 10.1002/eji.1830180214. [DOI] [PubMed] [Google Scholar]
- 11.Rickinson AB, Moss DJ, Wallace LE, Rowe M, Misko IS, Epstein MA, Pope JH. Long-term T-cell-mediated immunity to Epstein-Barr virus. Cancer Res. 1981;41:4216–4221. [PubMed] [Google Scholar]
- 12.Borrow P, Lewicki H, Hahn BH, Shaw GM, Oldstone MB. Virus-specific CD8+ cytotoxic T-lymphocyte activity associated with control of viremia in primary human immunodeficiency virus type 1 infection. J Virol. 1994;68:6103–6110. doi: 10.1128/jvi.68.9.6103-6110.1994. [DOI] [PMC free article] [PubMed] [Google Scholar]
- 13.Koup RA, Safrit JT, Cao Y, Andrews CA, McLeod G, Borkowsky W, Farthing C, Ho DD. Temporal association of cellular immune response with the initial control of viremia in primary HIV-1 syndrome. J Virol. 1994;68:4650–4655. doi: 10.1128/jvi.68.7.4650-4655.1994. [DOI] [PMC free article] [PubMed] [Google Scholar]
- 14.Rinaldo C, Huang XL, Fan ZF, Ding M, Beltz L, Logar A, Panicali D, Mazzara G, Liebmann J, Cottrill M, et al. High levels of anti-human immunodeficiency virus type 1 (HIV-1) memory cytotoxic T-lymphocyte activity and low viral load are associated with lack of disease in HIV-1-infected long-term nonprogressors. J Virol. 1995;69:5838–5842. doi: 10.1128/jvi.69.9.5838-5842.1995. [DOI] [PMC free article] [PubMed] [Google Scholar]
- 15.Rowland-Jones S, Sutton J, Ariyoshi K, Dong T, Gotch F, McAdam S, Whitby D, Sabally S, Gallimore A, Corrah T, et al. HIV-specific cytotoxic T-cells in HIV-exposed but uninfected Gambian women. Nat Med. 1995;1:59–64. doi: 10.1038/nm0195-59. [DOI] [PubMed] [Google Scholar]
- 16.Greenough TC, Brettler DB, Somasundaran M, Panicali DL, Sullivan JL. Human immunodeficiency virus type 1-specific cytotoxic T lymphocytes (CTL), virus load, and CD4 T cell loss: evidence supporting a protective role for CTL in vivo. J Infect Dis. 1997;176:118–125. doi: 10.1086/514013. [DOI] [PubMed] [Google Scholar]
- 17.Gallimore A, Cranage M, Cook N, Almond N, Bootman J, Rud E, Silvera P, Dennis M, Corcoran T, Stott J, et al. Early suppression of SIV replication by CD8+ nef-specific cytotoxic T cells in vaccinated macaques. Nat Med. 1995;1:1167–1173. doi: 10.1038/nm1195-1167. [DOI] [PubMed] [Google Scholar]
- 18.Cranage MP, Whatmore AM, Sharpe SA, Cook N, Polyanskaya N, Leech S, Smith JD, Rud EW, Dennis MJ, Hall GA. Macaques infected with live attenuated SIVmac are protected against superinfection via the rectal mucosa. Virology. 1997;229:143–154. doi: 10.1006/viro.1996.8419. [DOI] [PubMed] [Google Scholar]
- 19.Ariyoshi K, Cham F, Berry N, Jaffar S, Sabally S, Corrah T, Whittle H. HIV-2-specific cytotoxic T-lymphocyte activity is inversely related to proviral load. AIDS. 1995;9:555–559. doi: 10.1097/00002030-199506000-00004. [DOI] [PubMed] [Google Scholar]
- 20.Klein MR, van Baalen CA, Holwerda AM, Kerkhof SR, Garde, Bende RJ, Keet IPM, Eeftinck-Schattenkerk J-KM, Osterhaus ADME, Schuitemaker H, Miedema F. Kinetics of Gag-specific cytotoxic T lymphocyte responses during the clinical course of HIV-1 infection: a longitudinal analysis of rapid progressors and long-term asymptomatics. J Exp Med. 1995;181:1365–1372. doi: 10.1084/jem.181.4.1365. [DOI] [PMC free article] [PubMed] [Google Scholar]
- 21.Ogg GS, Jin X, Bonhoeffe S, Dunbar RP, Nowak MA, Monard S, Segal JP, Cao Y, Rowland-Jones SL, Cerundolo V, et al. Quantitation of HIV-1-specific cytotoxic T lymphocytes and plasma load of viral RNA. Science. 1998;279:2103–2106. doi: 10.1126/science.279.5359.2103. [DOI] [PubMed] [Google Scholar]
- 22.Carmichael A, Jin X, Sissons P, Borysiewicz L. Quantitative analysis of the human immunodeficiency virus type 1 (HIV-1)–specific cytotoxic T lymphocyte (CTL) response at different stages of HIV-1 infection: differential CTL responses to HIV-1 and Epstein-Barr virus in late disease. J Exp Med. 1993;177:249–256. doi: 10.1084/jem.177.2.249. [DOI] [PMC free article] [PubMed] [Google Scholar]
- 23.Kersten MJ, Klein MR, Holwerda AM, Miedema F, van Oers MH. Epstein-Barr virus–specific cytotoxic T cell responses in HIV-1 infection: different kinetics in patients progressing to opportunistic infection or non-Hodgkin's lymphoma. J Clin Invest. 1997;99:1525–1533. doi: 10.1172/JCI119315. [DOI] [PMC free article] [PubMed] [Google Scholar]
- 24.Walker CM, Moody DJ, Stites DP, Levy JA. CD8+ lymphocytes can control HIV infection in vitro by suppressing virus replication. Science. 1986;234:1563–1566. doi: 10.1126/science.2431484. [DOI] [PubMed] [Google Scholar]
- 25.Yang OO, Kalams SA, Trocha A, Cao H, Luster A, Johnson RP, Walker BD. Suppression of human immunodeficiency virus type 1 replication by CD8+ cells: evidence for HLA class I-restricted triggering of cytolytic and noncytolytic mechanisms. J Virol. 1997;71:3120–3128. doi: 10.1128/jvi.71.4.3120-3128.1997. [DOI] [PMC free article] [PubMed] [Google Scholar]
- 26.Cocchi F, DeVico AL, Garzino-Demo A, Arya SK, Gallo RC, Lusso P. Identification of RANTES, MIP-1 alpha, and MIP-1 beta as the major HIV-suppressive factors produced by CD8+ T cells. Science. 1995;270:1811–1815. doi: 10.1126/science.270.5243.1811. [DOI] [PubMed] [Google Scholar]
- 27.Gauduin MC, Glickman RL, Means R, Johnson RP. Inhibition of simian immunodeficiency virus (SIV) replication by CD8+T lymphocytes from macaques immunized with live attenuated SIV. J Virol. 1998;72:6315–6324. doi: 10.1128/jvi.72.8.6315-6324.1998. [DOI] [PMC free article] [PubMed] [Google Scholar]
- 28.Stebbings R, Stott J, Almond N, Hull R, Lines J, Silvera P, Sangster R, Corcoran T, Rose J, Cobbold S, et al. Mechanisms of protection induced by attenuated simian immunodeficiency virus. II. Lymphocyte depletion does not abrogate protection. AIDS Res Hum Retroviruses. 1998;14:1187–1198. doi: 10.1089/aid.1998.14.1187. [DOI] [PubMed] [Google Scholar]
- 29.Matano T, Shibata R, Siemon C, Connors M, Lane HC, Martin MA. Administration of an anti-CD8 monoclonal antibody interferes with the clearance of chimeric simian/human immunodeficiency virus during primary infections of rhesus macaques. J Virol. 1998;72:164–169. doi: 10.1128/jvi.72.1.164-169.1998. [DOI] [PMC free article] [PubMed] [Google Scholar]
- 30.Mellors JW, Rinaldo CR, Jr, Gupta P, White RM, Todd JA, Kingsley LA. Prognosis in HIV-1 infection predicted by the quantity of virus in plasma. Science. 1996;272:1167–1170. doi: 10.1126/science.272.5265.1167. [DOI] [PubMed] [Google Scholar]
- 31.Kostrikis LG, Tyagi S, Mhlanga MM, Ho DD, Kramer FR. Spectral genotyping of human alleles. Science. 1998;279:1228–1229. doi: 10.1126/science.279.5354.1228. [DOI] [PubMed] [Google Scholar]
- 32.Tyagi S, Kramer FR. Molecular beacons: probes that fluoresce upon hybridization. Nat Biotechnol. 1998;14:303–308. doi: 10.1038/nbt0396-303. [DOI] [PubMed] [Google Scholar]
- 33.Suryanarayana K, Wiltrout TA, Vasquez GM, Hirsch VM, Lifson JD. Plasma SIV RNA viral load determination by real-time quantification of product generation in reverse transcriptase-polymerase chain reaction. AIDS Res Hum Retroviruses. 1998;14:183–188. doi: 10.1089/aid.1998.14.183. [DOI] [PubMed] [Google Scholar]
- 34.Polacino PS, Liang HA, Clark EA. Formation of simian immunodeficiency virus long terminal repeat circles in resting T cells requires both T cell receptor– and IL-2– dependent activation. J Exp Med. 1995;182:617–621. doi: 10.1084/jem.182.2.617. [DOI] [PMC free article] [PubMed] [Google Scholar]
- 35.Gerdes J, Lemke H, Baisch H, Wacker HH, Schwab U, Stein H. Cell cycle analysis of a cell proliferation-associated human nuclear antigen defined by the monoclonal antibody Ki-67. J Immunol. 1984;133:1710–1715. [PubMed] [Google Scholar]
- 36.Mackewicz CE, Blackbourn DJ, Levy JA. CD8+ T cells suppress human immunodeficiency virus replication by inhibiting viral transcription. Proc Natl Acad Sci USA. 1995;92:2308–2312. doi: 10.1073/pnas.92.6.2308. [DOI] [PMC free article] [PubMed] [Google Scholar]
- 37.Perelson AS, Neumann AU, Markowitz M, Leonard JM, Ho DD. HIV-1 dynamics in vivo: virion clearance rate, infected cell life-span, and viral generation time. Science. 1996;271:1582–1586. doi: 10.1126/science.271.5255.1582. [DOI] [PubMed] [Google Scholar]
- 38.Bonhoeffer S, May RM, Shaw GM, Nowak MA. Viral dynamics and drug therapy. Proc Natl Acad Sci USA. 1997;94:6971–6976. doi: 10.1073/pnas.94.13.6971. [DOI] [PMC free article] [PubMed] [Google Scholar]
- 39.Mittler JE, Sulzer B, Neumann AU, Perelson AS. Influence of delayed virus production on viral dynamics in HIV-1 infected patients. Math Biosci. 1998;152:143–163. doi: 10.1016/s0025-5564(98)10027-5. [DOI] [PubMed] [Google Scholar]
- 40.Van Lambalgen R, Jonker M. Experimental allergic encephalomyelitis in rhesus monkeys. II. Treatment of EAE with anti-T lymphocyte subset monoclonal antibodies. Clin Exp Immunol. 1987;68:305–312. [PMC free article] [PubMed] [Google Scholar]
- 41.Zlabinger GJ, Stuhlmeier KM, Eher R, Schmaldienst S, Klauser R, Vychytil A, Watschinger B, Traindl O, Kovarik J, Pohanka E. Cytokine release and dynamics of leukocyte populations after CD3/TCR monoclonal antibody treatment. J Clin Immunol. 1992;12:170–177. doi: 10.1007/BF00918085. [DOI] [PubMed] [Google Scholar]
- 42.Jonker M, Nooij FJ, van Suylichem P, Neuhaus P, Goldstein G. The influence of OKT8F treatment on allograft survival in rhesus monkeys. Transplantation. 1986;41:431–435. doi: 10.1097/00007890-198604000-00004. [DOI] [PubMed] [Google Scholar]