

Abstract
Contact hypersensitivity (CHS) is thought to be mainly associated with the activation of T helper type 1 (Th1) cells. However, there is also evidence that Th2 cells or Th2 cytokines play a role in the development of CHS. To analyze the functional contribution of Th2 cytokines interleukin (IL)-4 and IL-13, signal transducer and activator of transcription 6 (STAT6)-deficient (STAT6−/−) and wild-type (wt) control C57BL/6 mice were contact sensitized with 5% 2,4,6-trinitrochlorobenzene (TNCB), 0.5% 2,4-dinitrofluorobenzene, or 5% 4-ethoxyl methylene-2-phenyl-2-oxazolin-5-one, and any skin reactions were examined. Ear swelling was significantly reduced with a delayed peak response in STAT6−/− mice compared with wt mice.
A histological analysis revealed that the infiltration of both eosinophils and neutrophils in the skin challenged after 24 h in STAT6−/− mice decreased substantially compared with that in wt mice. The expression of Th2 cytokines (IL-4, IL-5) in TNCB-challenged skin tissues and the supernatants from T cells stimulated by 2,4,6-trinitrobenzene sulfonate–modified spleen cells, as well as the immunoglobulin (Ig)E and IgG1 response after challenge, were also profoundly reduced in STAT6−/− mice, whereas the expression of interferon γ was the same in STAT6−/− and wt mice after challenge. Furthermore, adoptive transfer experiments revealed that STAT6−/− mice induced CHS after injection of lymph node cells obtained from sensitized wt mice. Our data suggest that the STAT6 signal plays a critical role in the induction phase of CHS.
Keywords: signal transducer and activator of transcription factor 6, contact hypersensitivity, Th2, IL-4, IL-13
Introduction
Contact hypersensitivity (CHS) is thought to be associated with the activation of T cells of Th1 type. However, the role of Th2 cells in CHS is still not clear. Gocinsli and Tigelaar 1 demonstrated that both CD4+ and CD8+ T cells play a role in inducing CHS, and also that an additional subset of CD4+ T cells plays a downregulatory role. It has also been demonstrated that in IL-4/IL-10–secreting CD4+ T cells, Th2 negatively regulates CHS response 2. Steinbrink et al. 3 implicated a downregulatory role of CD8+ T cells producing IL-4, IL-5, and IL-10.
A negative regulatory effect of IL-4 on the CHS responses to 2,4,6-trinitrochlorobenzene (TNCB) was reported by Gautam et al. 4 and Asada et al. 5. These authors observed that IL-4 inhibited the efferent phase of CHS, but not the afferent phase 4 5. Furthermore, we also recently demonstrated that IL-4 blocked CHS by the inhibition of Langerhans cell (LC) migration induced by TNF-α 6.
Contrary to these reports, IL-4 has been demonstrated by several groups to be an essential cytokine during the elicitation phase of CHS 7 8 9. Recently, it has been reported that the CHS response was diminished in IL-4–deficient mice at a late phase of the elicitation reaction 10. In contrast to these recent findings, Berg et al. 11 reported that there is no alteration in the CHS response induced by 4-ethoxyl methylene-2-phenyl-2-oxazolin-5-one (Oxa) in IL-4–deficient mice. Therefore, it remains to be clarified whether or not CHS is diminished in IL-4–deficient mice. Recently, Traidl et al. 12 reported that the complete loss of endogeneous IL-4 expression in Balb/c mice is associated with an impaired manifestation of CHS to dinitrochlorobenzene but not to Oxa 12. We also recently established signal transducer and activator of transcription factor 6 (STAT6)-deficient (STAT6−/−) mice 13 and demonstrated that STAT6 plays a central role in IL-4– and IL-13– mediated biological responses 13 14. In an attempt to clarify the role of Th2 cytokines, especially IL-4 and IL-13 in the CHS response, we examined the CHS response in the STAT6−/− mice in which the IL-4 and IL-13 signaling pathways have been completely abolished.
Materials and Methods
Animals.
C57BL/6 mice with a targeted disruption of the gene encoding STAT6 (Stat6−/−) were generated in the Department of Biochemistry at the Hyogo College of Medicine as previously reported 13, and age- and sex-matched wild-type (wt) littermate controls (C57BL/6 mice) were purchased from the Sankyo Co. All animals were housed under specific pathogen-free conditions and had free access to a commercial diet and water. They were used at 8–15 wk of age. Each experimental group consisted of at least five mice.
Reagents.
The following reagents were obtained from commercial sources: TNCB and Hepes from the Nakarai Chemical Co.; 2,4-dinitrofluorobenzene (DNFB), Oxa from the Sigma Chemical Co.; and trypsin, 1:250 from Difco. The following mAbs were used: FITC-conjugated anti–TCR-α/β mAb (hamster; PharMingen); PE–conjugated anti–TCR-γ/δ mAb (hamster; PharMingen); FITC-conjugated anti–TCR-γ/δ mAb (hamster; PharMingen); FITC-conjugated anti-Thy1.2 (IgG2; Caltag); PE-conjugated anti-Ly2 (hamster; PharMingen); PE-conjugated anti–mouse CD4 (L3T4) mAb (PharMingen); FITC-conjugated anti–mouse I-Ab (mouse; Cedarlane); PE-conjugated anti–mouse CD80 mAb (hamster; PharMingen); PE-conjugated anti–mouse CD86 mAb (hamster; PharMingen); PE-conjugated anti–mouse CD11b (rat, Mac-1a; Leinco Technologies); PE-conjugated anti–mouse F4/80 mAb (Cedarlane); PE-conjugated anti–mouse CD32/16 mAb (rat, clone 93; Southern Biotechnology Associates); PE-conjugated anti–mouse Vγ3 TCR mAb (hamster; PharMingen); anti–mouse IL-4Ra (S-20) mAb (rabbit; Santa Cruz Biotechnology); and PE-conjugated anti–rabbit IgG(H+L) mAb (Cedarlane).
Immunization for Induction of CHS to TNCB, DNFB, and Oxa.
The mice were contact sensitized by two daily consecutive topical applications of 50 μl of 0.5% solution of DNFB, 5% TNCB, or 3% Oxa in acetone in olive oil (4:1) on shaved abdominal skin. The control mice were treated in the same fashion with vehicle alone.
Challenge and Quantitation.
3 d after the last abdominal application, the mice were challenged by applying 20 μl of hapten solution (1% TNCB, 0.2% DNFB, 0.5% Oxa in olive oil) on both sides of one ear, and vehicle on both sides of the other ear. The thickness of the ear was then measured with an engineer's micrometer (Peacock; Ozaki Engineering) at 12, 24, 48, 72, and 96 h after challenge.
Induction of Irritant Response and Delayed Hypersensitivity Induced by Sheep RBCs.
The irritant response was induced by applying 10 μl of 1 or 100% croton oil (vol/vol) to the dorsal and ventral aspects of the right ear of Wt and STAT6−/− mice. The reaction was then evaluated by measuring the increase in ear thickness over time. wt and STAT 6−/− mice were sensitized with a subcutaneous injection of 100 μl of 20% sheep RBCs in the back. 6 d after sensitization, the mice were challenged by the injection of 20 μl of 20% sheep RBCs in the foot pad. The increases in foot pad thickness of wt or STAT 6−/− mice were measured with an engineer's micrometer at 24 and 48 h after the challenge.
Preparation of Enriched LCs.
The procedure for isolating basal epidermal cells (ECs) from the epidermis was described previously 15. In brief, separated pinnae were cut into 3- or 4-mm2 pieces, then transferred dermal side down into a Petri dish. After a 1-h incubation at 37°C in PBS containing 0.5% trypsin (Difco), epidermal sheets were peeled from the dermis using forceps and placed in “complete medium” (RPMI 1640 containing 10% heat-inactivated FCS, 2 mM l-glutamine, 50 mg/ml gentamycin, and 100 U/ml penicillin) supplemented with 0.0025% DNase I (Sigma Chemical Co.) After 20–30 min at room temperature, the sheets were vigorously stirred, and the resulting cell suspension was pelleted and resuspended in ice-cold, hypoosmolar PBS using simultaneous light-speed vortexing. This procedure was terminated by adding an excessive amount of washing medium when the viability of the cell suspension had dropped to a level of 10–20%. After two washes, 5 ml of the EC suspension (5 × 10⁶/ml) was layered on top of 5 ml of Lympholyte-M solution (density 1.0875; Cedarlane) and centrifuged at 1,500 g for 20 min at room temperature. Thereafter, the cells were collected from the interface and rinsed twice in complete medium, then cultured for 24 h, counted, tested for viability, and subjected to FITC-conjugated anti–I-Ab immunolabeling (see below). The enrichment of LCs was usually 23–46%.
Immunofluorescence Analysis of Cell Suspension.
EC suspensions enriched for LCs as described above were cultured for 24 h in complete medium with 100 ng/ml GM-CSF (Genzyme) in 24-well plate wells (no. 258201; Corning) at 37°C under 5% CO2 air. The ECs were then rinsed in ice-cold PBS containing 0.1% NaN3 with 1% FCS, and incubated for 30 min with 2.5 μg/ml of the FITC-conjugated anti–I-Ab mAb or the appropriate FITC-labeled IgG1 control. After a short exposure to normal mouse serum, ECs were incubated with either PE-conjugated anti-CD11b mAb, PE-conjugated anti-F4/80 mAb, PE-conjugated anti-CD32 mAb, PE-conjugated anti-CD80 mAb, or PE-labeled anti-CD86 mAb or the appropriate isotype control (PE–mouse IgG1, 5 mg/ml; Becton Dickinson). Flow cytometry was performed with a FACS® analyzer (Cyto ACE-150; Jasco Ltd.), using 10,000 cells per sample. Any dead cells were gated out with ethidium bromide.
To compare the surface markers of T cells in STAT6−/− and wt mice, at 5 d after sensitization with TNCB, the STAT6−/− or wt mice were killed by cervical dislocation, and their peripheral lymph nodes were removed. A cell suspension was then prepared by gentle teasing, and was thereafter washed three times with PBS. These cells were passed through a nylon fiber column (Wako Pure Chemicals), and were used as T cells. The T cells were rinsed in ice-cold PBS containing 0.1% NaN3 with 1% FCS, and then incubated for 30 min with 2.5 mg/ml of the FITC-conjugated anti-CD4 mAb, FITC-conjugated anti–mouse TCR-α/β mAb, FITC-conjugated anti-Thy1 mAb, or the appropriate FITC-labeled IgG1 control. After a short exposure to normal mouse serum, the cells were incubated with either PE-conjugated mAbs or the appropriate isotype control (PE–mouse IgG1, 5 mg/ml; BD).
Flow cytometry was performed with a fluorescent microscope (Nikon) or FACS® analyzer using 10,000 cells per sample. Dead cells were gated out with ethidium bromide.
Phenotypic Analysis and Enumeration of LCs and Thy1 Dendritic ECs.
Ear skin from the mice was placed in 0.5 M ammonium thiocyanate (0.1 M phosphate buffer, pH 6.8) at 37°C for 20 min. The epidermis was separated from the dermis, fixed with acetone for 5 min, and then washed extensively with PBS. Epidermal sheets were incubated overnight at 4°C with FITC-conjugated anti-Iab mAb, FITC-conjugated anti–TCR-γ/δ mAb, or FITC isotype control IgG. After washing three times with PBS, the sheets were mounted in 1% glycerine in PBS. Positively stained cells in >90 randomly chosen fields of epidermis were counted at a magnification of 400 using a rectangular grid. More than 500 I-A+ dendritic cells or γ/δ+ dendritic cells from each STAT6−/− or wt mouse were counted.
Primary Allogeneic Mixed EC–Lymphocyte Reaction.
T cells were prepared using a nylon wool column. More than 97% of nonadherent cells were CD3+ T cells based on immunofluorescence tests with directly labeled mAb to CD3. Stimulator cells consisted of cultured LCs enriched as described above from Stat6−/− or wt mice.
1–103 × 105 LC-enriched ECs per well were seeded as stimulator cells. Responders and stimulators were cocultured in 96-well round-bottomed plates at 37°C in 200 μl of complete medium. All cultures were pulsed overnight with 0.2 μCi [3H]TdR, and incorporated radioactivity was assessed by liquid scintillation counting 16.
Quantification of Cytokine Levels in the Supernatant from Cultured T Cells and in Skin Tissue Extracts.
The lymph node cells and spleen cells were prepared as described above. Single cell suspensions from lymph nodes were purified for T cells by nylon wool column. The spleen cells were suspended in 1.0 ml of 10 mM 2,4,6-trinitrobenzene sulfonate (TNBS), incubated at 37°C for 10 min, washed three times, and used as stimulator cells. 105 T cells were cultured in 96-well round-bottomed plates in 200 μl of complete medium in the presence or absence of 105 mitomycin C–treated TNBS-modified spleen cells or nonmodified spleen cells for 3 d. The supernatants were harvested and store at −80°C. These supernatants were used for ELISA.
Samples of ear tissue extracts for ELISA were prepared as described by Ferguson et al. 17. In brief, at 24 h after the application of TNCB, the ears were excised and immediately homogenized with a 10-fold vol of 0.1% Tween 20 in PBS. The samples were quickly frozen in liquid nitrogen, thawed in a 37°C water bath, sonicated for 15 s, and centrifuged for 5 min at 13,000 g, and supernatants were used for ELISA. The supernatants were stored at −80°C. The ELISA assays for IL-4, IL-5, and IFN-γ were conducted using ELISA kits (Endogen) according to the manufacturer's instructions.
Measurement of Serum Concentrations of IgE, IgG1, and IgG2.
Blood was drawn from the sinus cavernous, and serum was obtained by centrifugation at 1,500 g for 10 min. The serum IgE level was determined using a commercial ELISA kit (Yamasa). Concentrations of IgG1 and IgG2 were determined using commercial ELISA kits (Bethyl Laboratories) according to the manufacturer's instructions.
Adoptive Transfer Experiments.
Cell suspensions obtained from lymph nodes from TNCB-sensitized wt mice were injected into the ears of naive STAT6−/− mice or wt mice (five mice per group; 2 × 10⁵ per 20 μl PBS [12]). The mice were immediately challenged by applying 10 μl 1% TNCB in olive oil or olive oil alone on both sides of the ear. In these experiments, negative controls were groups of mice injected with PBS subcutaneously into the ear and challenged with 1% TNCB, or groups of mice injected with lymph node cells subcutaneously into the ear and challenged with olive oil. Ear thickness was measured as described above after 24 h.
Histological Examination.
The ear skin specimens were excised and fixed in 10% formalin, then processed and stained with hematoxylin and eosin, May-Grünwald-Giemsa, or toluidine blue. The number of mononuclear cells, mast cells, and granulocytes such as neutrophils and eosinophils infiltrating into the dermis was evaluated by staining the tissue specimen stained with Giemsa solution. The section was examined at a magnification of 400. At least 10 fields were examined for each lobe. The number of cells was counted and expressed as the number of cells per square millimeter.
Statistical Analysis.
The experimental data are expressed as the mean ± SD and shown in the figures as mean + SD for clarity. The statistical analysis was performed using the Student's t test.
Results
Diminished CHS Response to DNFB, TNCB, and Oxa in STAT6− /− Mice.
To evaluate the capacity of STAT6−/− mice to develop a CHS reaction, we examined the CHS response to DNFB, TNCB, and Oxa in STAT6−/− and wt mice. As shown in Fig. 1, the CHS response to DNFB decreased drastically, and the early phase of CHS to TNCB or Oxa was significantly diminished in STAT6−/− mice compared with wt mice (Fig. 1a Fig. b Fig. c). The peak response of ear swelling was detected 24 h after the challenge in wt mice, whereas the peak response was observed at 48 h after challenge in STAT6−/− mice.
Figure 1.


STAT6−/− mice exhibit a reduced CHS elicitation. STAT6−/− mice (□, ▪) and wt (WT) mice (▵, ▴) were contact sensitized for 2 d with (A) 5% TNCB, (B) 5% Oxa, or (C) 0.5% DNFB 2 d after the last immunization, and thereafter both mice were challenged. The maximal ear swelling was detected at 24 h for the wt mice and at 72 h for the STAT6−/− mice. The data presented are the mean values + SD of five mice per group and are representative of five independent experiments. *P < 0.01, significant compared with the results obtained with wt mice.
Normal Irritation Response and Delayed-Type Hypersensitivity Response Induced by Sheep RBCs of STAT6− /− Mice.
To determine whether or not STAT6 signaling is also essential for the induction of an irritant response, the irritant response was examined in STAT6−/− and wt mice after a challenge with the irritant croton oil. After exposure to 1 or 100% croton oil, maximal swelling was detected at 24 h in both wt and STAT6−/− mice (Fig. 2 A and B). As with the irritant treatment, no difference was observed between the STAT6−/− and wt mice.
Figure 2.


The STAT6−/− mice did not exhibit a reduced irritant response. The increases in the ear thickness of wt (WT) or STAT6−/− mice on a C57BL/6 background were measured 24 and 48 h after the application of (A) 1% croton oil or (B) 100% croton oil. The data presented are the mean values + SD of five mice per group and are representative of three independent experiments.
The data presented in Fig. 3 show the delayed-type hypersensitivity (DTH) response induced by sheep RBCs in STAT6−/− and wt mice. After the challenge with a subcutaneous injection of sheep RBCs, maximal swelling was detected at 24 h in both wt and STAT6−/− mice. There was no significant difference between STAT6−/− and wt mice.
Figure 3.

The STAT6−/− mice did not exhibit a reduced DTH induced by sheep RBCs (SRBC). Wt (WT) and STAT6−/− mice were sensitized with the subcutaneous injection of 0.1 ml of 20% sheep RBCs. The increases in foot pad thickness of the wt or STAT6−/− mice on a C57BL/6 background were measured 24 and 48 h after challenge by 20% sheep RBCs. Data presented are the mean values + SD of five mice per group and are representative of three independent experiments.
Histopathology of TNCB-induced CHS Induced in STAT6−/− Mice.
Since the CHS to TNCB in STAT6−/− mice decreased at 24 h after challenge, we performed a histological analysis in STAT6−/− mice and wt mice sensitized by TNCB. As shown in Fig. 4, a histological examination revealed that severe edema was detected in the challenged skin of the wt mice (Fig. 4 A), but not in the STAT6−/− mice (Fig. 4 B). A very severe inflammatory response with a strong infiltration of eosinophils, neutrophils, and mononuclear cells was observed in wt mice (Fig. 4 C). In contrast, only a mild inflammatory response with a diminished infiltration of mononuclear cells and neutrophils was observed in the challenged skin in STAT6−/− mice (Fig. 4 D). The number of infiltrated mononuclear cells, eosinophils, and neutrophils in the skin was calculated in both the STAT6−/− and wt mice. TNCB-challenged wt mice had a significantly greater number of eosinophils and neutrophils than the TNCB-challenged STAT6−/− mice (P < 0.01; Fig. 5).
Figure 4.
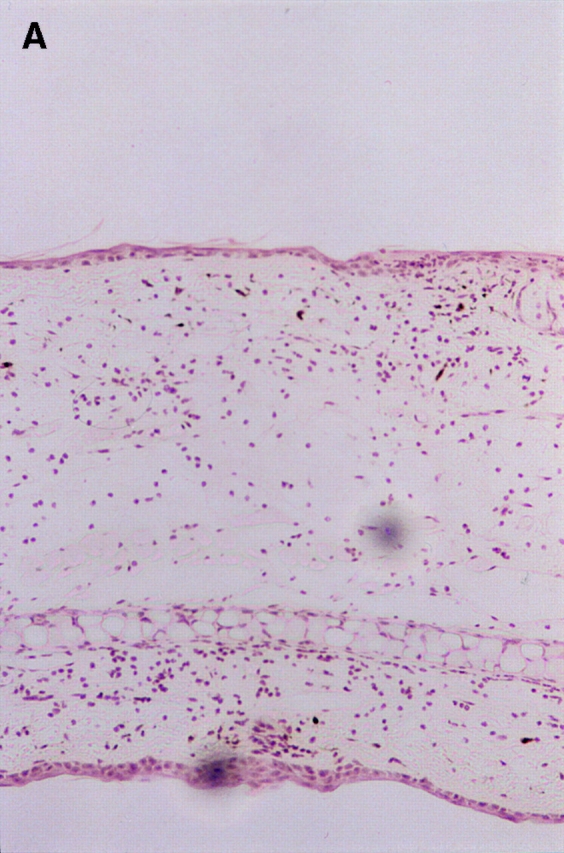
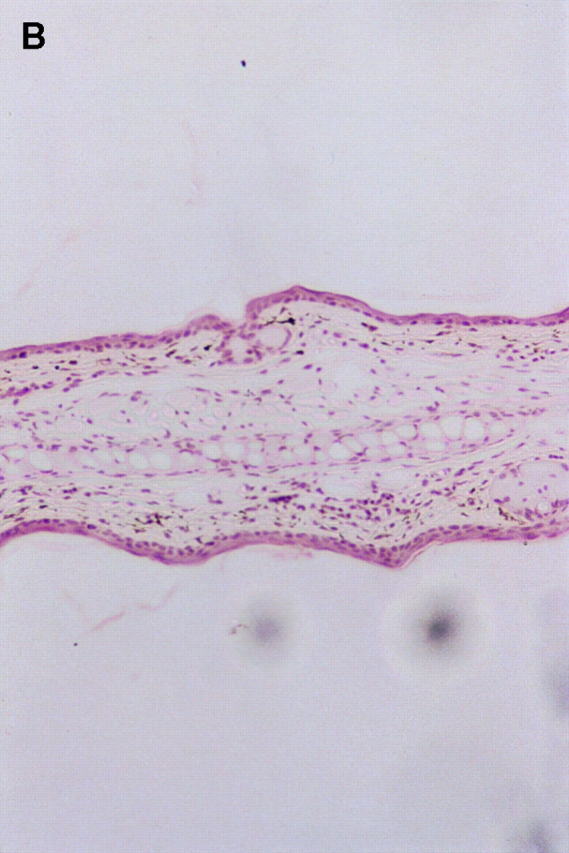
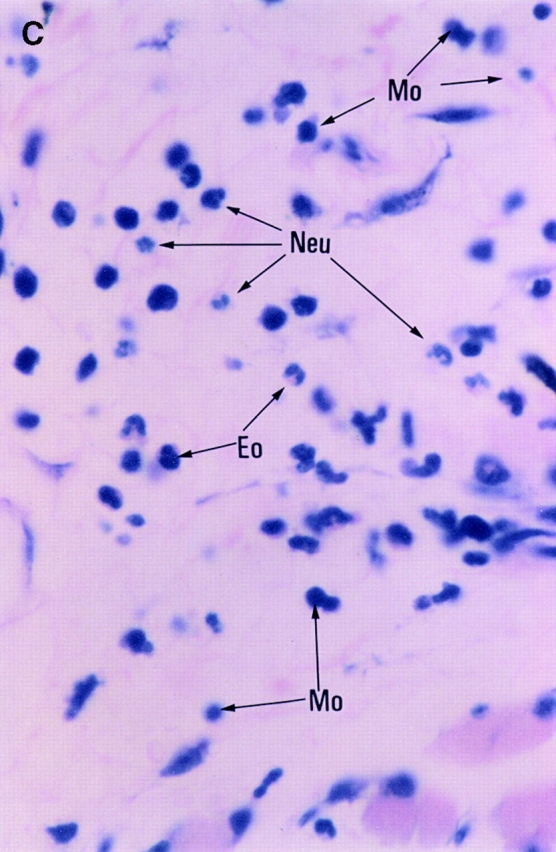
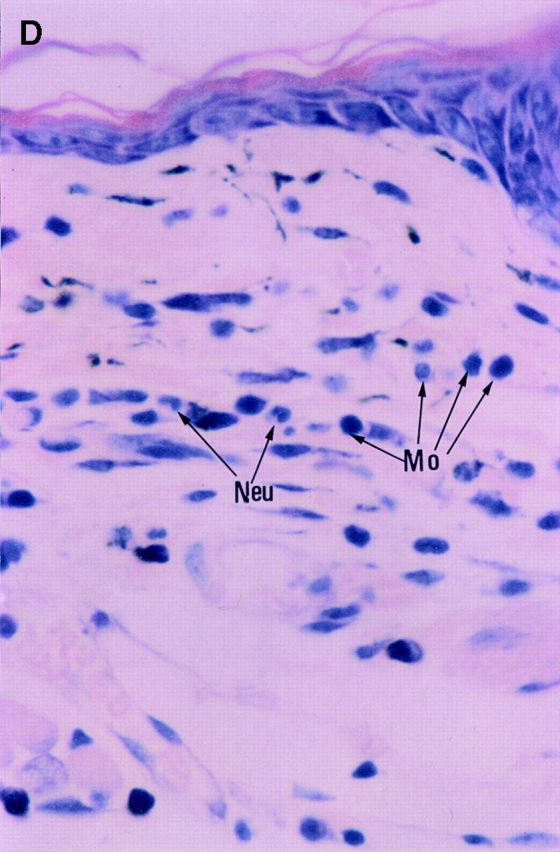
Histopathological findings of the CHS induced by TNCB painting in wt or STAT6−/− mice. Wt mice or STAT6−/− mice were immunized for two consecutive days by topical painting with 5% TNCB. 3 d after the last abdominal application, the mice were challenged by applying 1% TNCB solution. Histological features of the 24-h CHS ear skin reaction challenged by TNCB in wt mice (A and C) or in STAT6−/− mice (B and D) stained with Giemsa solution. An extremely large degree of edema was detected in the TNCB-challenged skin in the wt mice (A) but not in the STAT6−/− mice (B). A strong infiltration of mononuclear cells (Mo), neutrophils (Neu), and eosinophils (Eo) was observed in the dermis of wt mice (C); however, a diminished infiltration of neutrophils and mononuclear cells was observed in the dermis of STAT6−/− mice (D).
Figure 5.

Effect of STAT6 deficiency on the cellular distribution of challenged skin. Challenged skin was obtained from wt (WT) and STAT6−/− mice after challenge with the application of 1% TNCB or olive oil. Bars represent the number of eosinophils, neutrophils, monocytes/macrophages, and mast cells that infiltrated the challenged skin. The results shown are from a single experiment representative of three separate experiments. *P < 0.01 vs. TNCB-challenged wt mice. **P < 0.05 vs. TNCB-challenged wt mice.
No Elevation of Serum IgE and IgG1 in STAT6− /− Mice Challenged with TNCB.
As IgE is thought to be important in the pathogenesis of CHS 18 19, STAT6−/− and wt mice sensitized with TNCB were challenged with TNCB or olive oil. At 24 h after the TNCB-sensitized mice were challenged, the mice were bled, and the serum concentrations of IgE, IgG1, and IgG2a were measured by ELISA. The TNCB-challenged wt mice produced significantly higher amounts of serum IgE than the olive oil–challenged littermates. In contrast, neither the olive oil– nor the TNCB-challenged STAT6−/− mice produced detectable levels of serum IgE (Fig. 6). The wt mice displayed the expected increase in IgG1 concentration after TNCB challenge, whereas the serum IgG1 levels were not augmented after the TNCB challenge (Fig. 7 A). The serum concentration of IgG2a equally but not significantly increased after the TNCB challenge in both the wt and STAT6−/− mice, indicating that both mice were sensitized with TNCB (Fig. 7 B).
Figure 6.

Serum IgE levels of sensitized wt and STAT6−/− mice challenged with olive oil and TNCB. Mice were treated as described in Materials and Methods. The serum was analyzed by ELISA. The data represent the mean + SD for groups of four mice and are representative of three independent experiments. Ig levels were measured by ELISA at 24 h after the challenge. *P < 0.01 compared with other groups.
Figure 7.
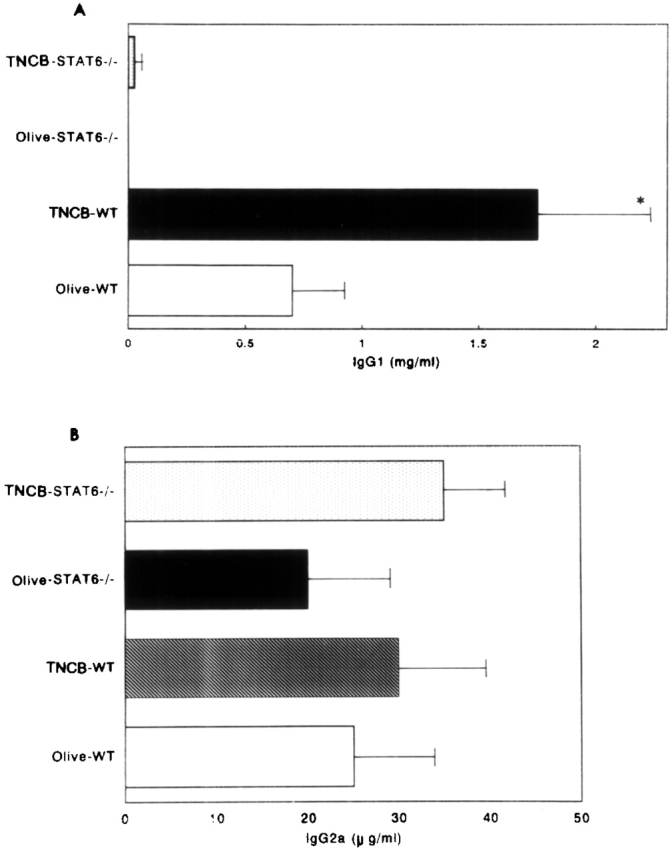
The serum IgG1 (A) and IgG2a (B) levels in olive oil– and TNCB-challenged sensitized wt (WT) and STAT6−/− mice. The mice were treated as described in Materials and Methods. Serum was analyzed by ELISA. The data represent the mean + SD for groups of four mice and are representative of three independent experiments. The Ig level was measured by ELISA at 24 h after the challenge. *P < 0.01 compared with other groups.
Lymph Nodes and Local Production of Cytokines in STAT6− /− Mice.
Neither IL-4 nor IL-5 was detected in the supernatants from T cells stimulated with TNP-conjugated spleen cells in STAT6−/− mice. However, the level of IFN-γ in the supernatants from T cells of STAT6−/− mice was comparable to that in the wt mice (Fig. 8 A).
Figure 8.
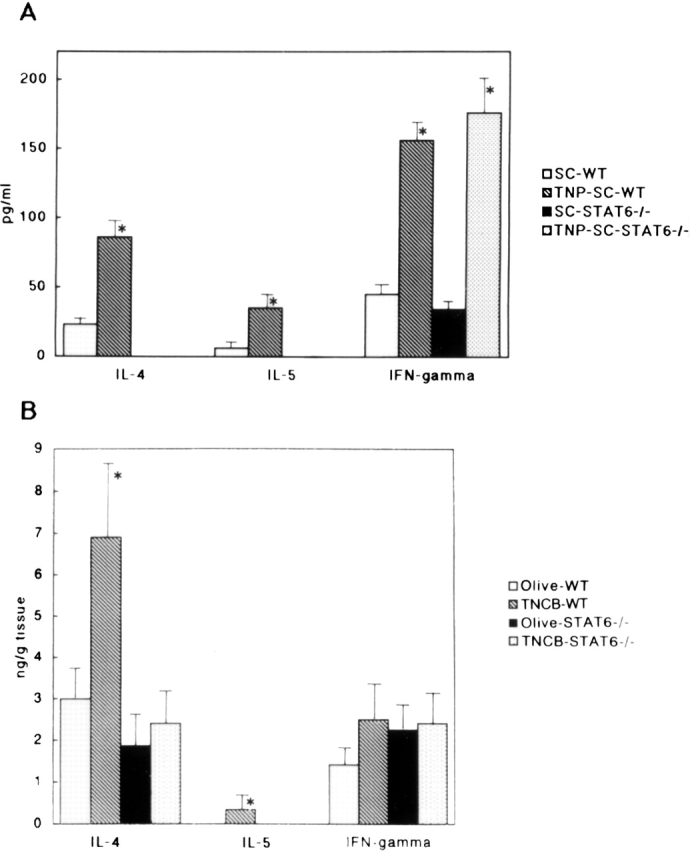
(A) The cytokine levels in the supernatants from T cells activated with TNBS-modified spleen cells or nonmodified spleen cells in sensitized STAT6−/− mice and wt (WT) mice. The lymph node cells were prepared as described above. Single cell suspensions from lymph nodes were purified for T cells by a nylon wool column. T cells were cultured in the presence or absence of mitomycin C–treated TNBS-modified spleen cells (TNP-SC) or nonmodified spleen cells (SC) for 3 d. The supernatants were used for ELISA. No detectable IL-4 or IL-5 in supernatants from deficient mice was observed. The data represent the mean concentrated values obtained from the supernatants from three wells and are representative of three independent experiments. The bars depict mean cpm + SD for triplicate experiments. *P < 0.01 compared with the cytokine levels in the supernatants from T cells stimulated with nonmodified spleen cells. (B) The cytokine levels in the skin tissue supernatants in olive oil– and TNCB-challenged sensitized STAT6−/− mice and wt (WT) mice. The data represent the mean + SD for groups of four mice and are representative of three independent experiments. The cytokine levels were measured by comparing them with all other groups. *P < 0.01 compared with other groups.
In the supernatant from skin tissue obtained from TNCB-challenged wt mice, the levels of both IL-4 and IL-5 were significantly higher than those in the supernatant from olive oil–challenged wt mice (Fig. 8 B). In contrast, these Th2 cytokine levels in the supernatant from TNCB-challenged STAT6−/− mice did not increase (Fig. 8 B). The level of IFN-γ in the STAT6−/− mice was comparable to that in the wt mice (Fig. 8 B).
Cytofluorometric Enumeration of LCs and Thy1 Dendritic ECs in Epidermal Sheets, and Characterization of Surface Marker of LCs in Cell Suspension.
The CHS response is dependent on the capacity of LCs of the skin to present the allergen and to activate T cells. To determine whether the morphology and distribution of LCs in STAT6− /− mice were normal, epidermal sheets were prepared from the ears of STAT6−/− and wt mice. The LCs were stained with anti-Iab mAb. The epidermal sheets obtained from STAT6−/− mice revealed an equal number of LCs compared with the LCs of wt mice (Fig. 9 A). No difference in the morphology of LCs was detected in the epidermal sheet between STAT6−/− and wt mice (data not shown). Furthermore, we examined the differences in the surface marker on LCs between wt and STAT6−/− mice by a FACS® analysis. The expression of CD40, CD80, CD86, intercellular adhesion molecule 1, CD32, CD11b, and F4/80 on LCs in STAT6−/− mice was comparable with that in the wt mice (data not shown).
Figure 9.


The population and function of LCs or Thy1+ DEC T cells between wt and STAT6−/− mice. (A) Thy1+ DEC T cells and I-A+ LCs show similar levels in the epidermal sheets prepared from STAT6−/− compared with wt (WT) mice. After epidermal sheets were prepared, fixed, and washed with PBS, they were incubated overnight at 4°C with FITC-conjugated anti–I-A mAb or FITC-conjugated anti–TCR-γ/δ mAb. The results shown are from a single experiment and are representative of three separate experiments. (B) The allostimulatory capacity of the enriched LCs prepared from the STAT6−/− mice is similar to that from the wt (WT) mice. ECs were prepared with trypsin from wt or STAT6−/− mice. The cultured LCs were harvested, separated with a gradient, washed, and then used as stimulator cells for T cell proliferation. 105 CD3+ T cells were seeded in the presence of 1–103 × 105 of enriched LCs in 96-well round-bottomed culture plates. The proliferation of T cells was revealed by [3H]TdR incorporation after 6 d of culturing. The results are representative of five experiments. Bars depict mean cpm + SD for triplicate experiments.
Assessment of the T Cell–stimulatory Capacity of Epidermal Cells in STAT6− /− Mice.
To investigate whether the LCs contained within the EC population were capable of supporting T cell stimulation, the ability of LCs to induce proliferation of allogeneic T cells was determined. The enriched LCs were prepared as described in Materials and Methods. The population of LCs in ECs in STAT6−/− was not substantially different from that in the wt mice in each experiment. Cultured enriched LCs in STAT6−/− mice provided efficient stimulators of T cell proliferation when alloreactive Balb/c mouse spleen cells were used as the responder T cells (Fig. 9 B). These results indicated that the T cell–stimulatory capacity of enriched LCs in the skin of STAT6−/− mice was comparable to that in the control mice (Fig. 9 B).
Lymph Node Cells from Wt Mice Induced CHS in STAT6− /− Mice.
To clarify whether the defect of CHS in STAT6−/− is at the afferent or efferent phase, adoptive transfer experiments were conducted. Lymph node cells from the wt mice sensitized with 5% TNCB were injected subcutaneously into the ears of STAT6−/− mice or wt mice, followed by a challenge with TNCB applied epicutaneously. Ear swelling was measured 12 and 24 h after challenge. As expressed in Fig. 10, not only wt but also STAT6−/− mice exhibited CHS after the injection of lymph node cells from the sensitized wt mice (Fig. 10). These data thus indicated that STAT6 is an important signal during the induction of CHS.
Figure 10.

Lymph node cells from sensitized wt mice could induce CHS in STAT6−/− mice. Adoptive transfer experiments were performed. Lymph node cells from the sensitized wt mice were injected subcutaneously into the ears of STAT6−/− and wt mice. The mice were challenged immediately after injection of lymph node cells with 1% TNCB or olive oil. Ear swelling was measured after 24 h. As a negative control, mice were challenged immediately after injection of PBS with 1% TNCB (PBS). As a positive control, the mice were contact sensitized by two daily consecutive topical applications of 50 μl of 5% TNCB on shaved abdominal skin. After 5 d, these mice were challenged with 1% TNCB (TNCB painting). The data represent the mean swelling values obtained after 24 h with five mice per group and are representative of three independent experiments. *P < 0.01 compared with other negative control groups; **P < 0.05 compared with other negative control groups.
Discussion
Although considerable progress has been made in elucidating the mechanism of CHS, the cellular and molecular mechanisms regulating CHS are still obscure. CHS is thought to be dependent on Th1 cells 2 3 20, although IL-4 has also been demonstrated to be involved in the response of CHS 7 8 9. It has also been reported that Th2 cells in mouse skin can induce a cellular inflammatory response with faster kinetics 21. In this paper, we questioned whether Th2 cells or Th2-type cytokines were also involved in the pathogenesis of the CHS response. It is well known that Th2 cells or Th2-type cytokines inhibit the activity of the Th1 cells in CHS in vitro. The IL-10 produced by Th2 cells indirectly inhibited the synthesis of Th1-type cytokines by abrogating the secretion of IL-12 by macrophages or by the secretion of Th1 cytokines 22 23. IL-4 directly inhibits Th1 cytokine, IL-12, and also inhibited the effector phase of CHS 24. In contrast to these reports, Asherson et al. 9 demonstrated that IL-4 plays a key role in CHS. They speculated that the IL-4 secreted from mast cells or B220+ cells binds to γ/δ1 T cells, and thus induces them to produce IL-4 or different cytokines that increased the expression of adhesion molecules on endothelial cells, which play a critical role in the induction of CHS 9. It has recently been reported that the CHS to DNFB decreased in IL-4–deficient mice 10, in contrast with another group's results in which Oxa was used as a contact allergen 11, and IL-4–deficient mice on a C57BL/6 did not show a reduced ear swelling response 48 h after challenge 11. A very recent report demonstrated that CHS to dinitrochlorobenzene but not to Oxa is inhibited in IL-4–deficient mice 12. It therefore remains unclear whether CHS is upregulated or downregulated in IL-4–deficient mice. We recently established STAT6-deficient mice and concluded that STAT6 plays a central role in exerting IL-4– and IL-13–mediated biological responses 13 14. Therefore, we used a STAT6-deficient mice model to study the role of Th2 cytokines, especially IL-4 and IL-13, in CHS.
Compared with the wt control mice, the ear swelling response in STAT6−/− mice significantly decreased at 24 h after the challenge. However, the reduction in ear swelling was not significant at 48 h after the challenge in the TNCB-induced CHS. The peak response of ear swelling was observed at 48 but not 24 h after challenge in STAT6−/− mice sensitized with Oxa, TNCB, or DNFB as the contact allergen. These data may be consistent with the recent demonstration that IL-4 plays a major role in the initiation phase of CHS and inhibits the late phase of CHS 8 9. However, our results do not correlate with those of CHS in IL-4−/− mice, as the Oxa-induced CHS did not diminish in the IL-4−/− mice 11 12. It is well known that the Th2 response was completely diminished in STAT6−/− mice, but a residual Th2 response has been clearly observed in IL-4−/− mice 13 14. This may explain the marked differences of CHS in response to a hapten challenge between the IL-4−/− mice and STAT6−/− mice.
Furthermore, neither the irritant response nor the DTH response induced by sheep RBCs decreased in STAT6−/− mice. These results indicated that STAT6 signaling may not play a critical role in the induction of either the irritant response or the DTH response induced by sheep RBCs. In contrast to IL-4 or IL-13, IL-10 is a suppressant of the cutaneous inflammatory response, including both the CHS and the irritant response 11.
A histological analysis revealed a tremendous reduction in the infiltration of both eosinophils and neutrophils in TNCB-challenged skin of STAT6−/− mice. In addition, the antigen-induced edematous changes in the dermis were also completely dependent on STAT6 signaling. In mice, the polymorphonuclear cell response has been demonstrated to be more vigorous than in guinea pigs, and eosinophils also infiltrated the TNCB-induced CHS in a peak response at 24 h after challenge 25 26. To date, the exact roles of these polymorphonuclear cells are still unclear. However, our data indicate that polymorphonuclear cells, including eosinophils and neutrophils dependent on STAT6 signaling, may play a major role in the induction of CHS.
Not only Th1 but also Th2 cells have been reported to induce hapten-specific CHS 21, and STAT6 proteins have been shown to be essential in Th2 differentiation in vitro 13 14. STAT6 signaling is essential for hapten-induced increase in Th2 cytokine production in vivo. The hapten-challenged wt mice demonstrated significant elevations in the Th2 cytokines (i.e., IL-4 and IL-5). In marked contrast, STAT6−/− mice were unable to produce IL-4 or IL-5 in response to the skin challenge. Interestingly, not only in challenged skin but also in lymph nodes, no detectable Th2 cytokines in supernatants of T cells stimulated in a hapten-specific manner were observed in STAT6−/− mice. These data indicated that the Th2 cells defected in STAT6−/− mice. A lack of Th2 cytokine production after hapten challenge in STAT6−/− mice reflects the balance of the Th1- and Th2-dependent antibody isotype production in the serum of STAT6−/− mice. TNCB-challenged wt mice developed an IgG1 and IgE antibody profile with a low IgG2a level. In contrast, STAT6−/− mice have predominant IgG2 antibody production and no detectable IgE, which is consistent with previous data in a mouse model of atopic asthma 27 28 29. TNCB-challenged wt mice produced a small amount of IgE. Ptak and colleagues 18 19 demonstrated that a low dose but not a high dose of IgE mediated DTH initiation via release of small amounts of 5-hydroxytryptamine by mast cells. IgE has also been reported to induce late-phase cutaneous reactions in humans 30 31. These results indicate that a small amount of IgE induced by STAT6 signaling in wt mice may play a critical role in the induction of CHS.
Since IL-4 modulates the differentiation of LCs from monocytes 32 33, we examined the population, morphology, surface marker, and function of LCs in STAT6−/− compared with wt mice. The density of LCs in the epidermis of STAT6−/− mice did not decrease. After the short-term culture of LCs, the development of LCs was not impaired. The expression of costimulatory molecules on LCs was not downregulated in STAT6−/− mice (data not shown). In line with these data, the allostimulatory activity of enriched LCs was also comparable in STAT6−/− and wt mice. The fact that LCs differentiated normally in the absence of a passageway through Th2-derived cytokines correlates with results by Weigmann et al. 10 and Georgopoulos et al. 34. As far as the LCs are concerned, the morphology, function, and surface marker of LCs in STAT6−/− were comparable with those in the wt mice.
Interestingly, adoptive transfer experiments revealed that the CHS response could be elicited when lymph node cells from sensitized wt mice were injected into the ears of STAT6−/− mice. These data indicate that STAT6 is an important signal during the induction phase, as also suggested previously by recent reports 8 12.
The transfer of DTH by cells from immune mice has been shown to require collaboration between α/β- and γ/δ-bearing T cells 35, and IL-4 plays a critical role through γ/δ T cells 9. However, in contrast to IL-4−/− mice 10, density and morphology of γ/δ1 Thy1 dendritic ECs (DECs) in the epidermis of the STAT6−/− mice were comparable with those in wt mice. Further studies are presently being conducted to elucidate the exact role of γ/δ T cells in CHS.
In summary, STAT6 is essential in the induction of CHS. STAT6 mediates CHS via its pivotal role in Th2 differentiation, resulting in the subsequent stimulation of IgE synthesis and the infiltration of eosinophils or neutrophils into the skin.
Acknowledgments
We thank Ms. Motoko Sekiya for her excellent technical assistance.
This work was partially supported by the Cosmetology Research Foundation, and by grants 08670952 and 10670781 from the Ministry of Education, Japan.
Footnotes
Abbreviations used in this paper: CHS, contact hypersensitivity; DEC, dendritic EC; DNFB, 2,4-dinitrofluorobenzene; DTH, delayed-type hypersensitivity; EC, epidermal cell; LC, Langerhans cell; STAT, signal transducer and activator of transcription; TNBS, 2,4,6-trinitrobenzene sulfonate; TNCB, 2,4,6-trinitrochlorobenzene; wt, wild-type.
References
- Gocinsli B.L., Tigelaar R.E. Role of CD41 and CD81 T cells in murine contact sensitivity revealed by in vivo monoclonal antibody depletion. J. Immunol. 1990;144:4121–4128. [PubMed] [Google Scholar]
- Xu H., DiIulio N.A., Fairchild R.I. T cell populations primed by hapten sensitization in contact sensitivity are distinguished by polarized patterns of cytokine productioninterferon γ–producing (Tc1) effector CD81 T cells and interleukin (IL)-4/IL-10–producing (Th2) negative regulatory CD4+ T cells. J. Exp. Med. 1996;183:1001–1012. doi: 10.1084/jem.183.3.1001. [DOI] [PMC free article] [PubMed] [Google Scholar]
- Steinbrink K., Sorg C., Macher E. Low zone tolerance to contact allergens in micea functional role for CD8+ T helper type 2 cells. J. Exp. Med. 1996;183:759–768. doi: 10.1084/jem.183.3.759. [DOI] [PMC free article] [PubMed] [Google Scholar]
- Gautam S.C., Chikkala N.F., Hamilton T.A. Anti-inflammatory action of IL-4. J. Immunol. 1992;148:1411–1415. [PubMed] [Google Scholar]
- Asada H., Linton J., Katz S.I. Cytokine gene expression during elicitation phase of contact sensitivityregulation by endogeneous IL-4. J. Invest. Dermatol. 1997;108:406–411. doi: 10.1111/1523-1747.ep12289700. [DOI] [PubMed] [Google Scholar]
- Takayama K., Yokozeki H., Ghoreishi M., Satoh T., Katayama I., Umeda T., Nishioka K. IL-4 inhibits the migration of human Langerhans cells through the down-regulation of TNF-RII expression. J. Invest. Dermatol. 1999;113:541–546. doi: 10.1046/j.1523-1747.1999.00629.x. [DOI] [PubMed] [Google Scholar]
- Dieli F., Asherson G.L., Romano G.C., Sireci G., Gervasi F., Salerno A. IL-4 is essential for the systemic transfer of delayed hypersensitivity by T cell lines. J. Immunol. 1994;152:2698–2704. [PubMed] [Google Scholar]
- Salerno A., Dieli F., Sireci G., Bellavia A., Asherson G.L. Interleukin-4 is a critical cytokine in contact sensitivity. Immunology. 1995;84:404–409. [PMC free article] [PubMed] [Google Scholar]
- Asherson G.L., Dieli F., Sireci G., Salerno A. Role of IL-4 in delayed type hypersensitivity. Clin. Exp. Immunol. 1996;103:1–4. doi: 10.1046/j.1365-2249.1996.845537.x. [DOI] [PMC free article] [PubMed] [Google Scholar]
- Weigmann B., Schwing J., Huber H., Ross R., Mossmann H., Knop J., Reske-Kunz A.B. Diminished contact hypersensitivity response in IL-4 deficient mice at a late phase of the elicitation reaction. Scand. J. Immunol. 1997;45:308–314. doi: 10.1046/j.1365-3083.1997.d01-402.x. [DOI] [PubMed] [Google Scholar]
- Berg D.J., Leach M.W., Kuhn R., Rajewsky K., Muller W., Davidson N.J., Rennick D. Interleukin 10 but not interleukin 4 is a natural suppressant of cutaneous inflammatory responses. J. Exp. Med. 1995;182:99–108. doi: 10.1084/jem.182.1.99. [DOI] [PMC free article] [PubMed] [Google Scholar]
- Traidl C., Jugert F., Krieg T., Merk H., Hunzelmann N. Inhibition of allergic contact dermatitis to DNCB but not to oxazolone in interleukin-4-deficient mice. J. Invest. Dermatol. 1999;112:476–482. doi: 10.1046/j.1523-1747.1999.00550.x. [DOI] [PubMed] [Google Scholar]
- Takeda K., Tanaka T., Shi W., Matsumoto M., Minami M., Kawamura S., Nakanishi K., Yoshida N., Kishimoto T., Akira S. Essential role of Stat6 in IL-4 signaling. Nature. 1996;380:627–630. doi: 10.1038/380627a0. [DOI] [PubMed] [Google Scholar]
- Takeda K., Kamanaka M., Tanaka T., Kishimoto T., Akira S. Impaired IL-13-mediated functions of macrophages in STAT6-deficient mice. J. Immunol. 1996;157:3220–3222. [PubMed] [Google Scholar]
- Katayama I., Matsunaga T., Yokozeki H., Nishioka K. Blockade of costimulatory molecules B7-1 (CD80) and B7-2 (CD86) down-regulates induction of contact sensitivity by haptenated epidermal cells. Br. J. Dermatol. 1997;136:846–852. [PubMed] [Google Scholar]
- Yokozeki H., Katayama I., Ohki O., Matsunaga T., Watanabe K., Satoh T., Azuma M., Okumura K., Nishioka K. Functional CD86 (B7-2/B70) on cultured human Langerhans cells. J. Invest. Dermatol. 1996;106:147–153. doi: 10.1111/1523-1747.ep12329735. [DOI] [PubMed] [Google Scholar]
- Ferguson T., Dube P., Griffith T.S. Regulation of contact hypersensitivity by interleukin 10. J. Exp. Med. 1994;179:1597–1604. doi: 10.1084/jem.179.5.1597. [DOI] [PMC free article] [PubMed] [Google Scholar]
- Ptak W., Geba G.P., Askenase W. Initiation of delayed-type hypersensitivity by low doses of monoclonal IgE antibody. Mediation by serotonine and inhibition by histamine. J. Immunol. 1991;146:3929–3936. [PubMed] [Google Scholar]
- Matsuda H., Ushio H., Paliwal V., Ptak W., Askenase P.W. Adoptive cell transfer of contact sensitivity-initiation mediated by nonimmune cells sensitized with monoclonal IgE antibodies. J. Immunol. 1995;154:5080–5092. [PubMed] [Google Scholar]
- Hauser C. Cultured epidermal Langerhans cells activate effector T cells for contact sensitivity. J. Invest. Dermatol. 1990;135:436–440. doi: 10.1111/1523-1747.ep12555587. [DOI] [PubMed] [Google Scholar]
- Muller K.M., Jaunin F., Masouye I., Saurat J.-H., Hauser C. Th2 cells mediate IL-4-dependent local tissue inflammation. J. Immunol. 1993;150:5576–5584. [PubMed] [Google Scholar]
- Fiorentino D., Bond M., Mosmann T.R. Two types of murine helper T cell clone. IV. Th2 clones secrete a factor that inhibits cytokine production by Th1 clones. J. Exp. Med. 1989;170:2081–2095. doi: 10.1084/jem.170.6.2081. [DOI] [PMC free article] [PubMed] [Google Scholar]
- D'Andrea A., Aste-Amezaga M., Valainte N., Ma X., Kubin M., Trinchieri G. Interleukin 10 (IL-10) inhibits lymphocyte interferon γ production by suppressing natural killer cell stimulatory factor/IL-12 synthesis in accessory cells. J. Exp. Med. 1993;178:1041–1048. doi: 10.1084/jem.178.3.1041. [DOI] [PMC free article] [PubMed] [Google Scholar]
- Vercelli D., Jabara H.H., Lauener R.P., Geha R.S. IL-4 inhibits the synthesis of IFN-γ and induces the synthesis of IgE in human mixed lymphocyte cultures. J. Immunol. 1990;144:570–573. [PubMed] [Google Scholar]
- Roupe G., Riedell B. The cellular infiltration in contact hypersensitivity to picryl chloride in the mouse. Acta Dermato-Venereol. 1979;59:191–195. [PubMed] [Google Scholar]
- Lavaud P., Rodrigue F., Carre C., Touvay C., Mencia-Huerta J.-M., Braquet P. Pharmacologic modulation of picryl chloride-induced contact dermatitis in the mouse. J. Invest. Dermatol. 1991;97:101–105. doi: 10.1111/1523-1747.ep12478438. [DOI] [PubMed] [Google Scholar]
- Kuperman D., Schofield B., Wills-Karp M., Grusby M.J. Signal transduction and activator of transcription factor 6 (Stat6)-deficient mice are protected from antigen-induced airway hyperresponsiveness and mucus production. J. Exp. Med. 1998;16:939–948. doi: 10.1084/jem.187.6.939. [DOI] [PMC free article] [PubMed] [Google Scholar]
- Akimoto T., Numata F., Tamura M., Takata Y., Higashida N., Takashi T., Takeda K., Akira S. Abrogation of bronchial eosinophilic inflammation and airway hypersensitivity in signal transducers and activators of transcription (STAT6)-deficient mice. J. Exp. Med. 1998;187:1537–1542. doi: 10.1084/jem.187.9.1537. [DOI] [PMC free article] [PubMed] [Google Scholar]
- Miyata S., Matsuyama T., Kodama T., Nishioka Y., Kuribayashi K., Takeda K., Akira S., Suguta M. STAT6 deficiency in a mouse model of allergen airway inflammation abolishes eosinophilia but induces infiltration of CD8+ T cells. Clin. Exp. Allergy. 1999;29:114–123. doi: 10.1046/j.1365-2222.1999.00405.x. [DOI] [PubMed] [Google Scholar]
- Solley G.O., Gleich G.J., Jordan R.E. The late phase of the immediate wheal and flare skin reactionits dependence upon IgE antibodies. J. Clin. Invest. 1976;58:408–420. doi: 10.1172/JCI108485. [DOI] [PMC free article] [PubMed] [Google Scholar]
- Warner J.A., Pienkowski M.M., Plaut M., Norman P.S., Lichtenstein L.M. Identification of histamine-releasing factor(s) in the late phase of cutaneous IgE-mediated reactions. J. Immunol. 1986;136:2583–2587. [PubMed] [Google Scholar]
- Sallusto F., Lanzavecchia A. Efficient presentation of soluble antigen by cultured human dendritic cells is maintained by granulocyte/macrophage colony-stimulating factor plus interleukin 4 and downregulated by tumor necrosis factor α. J. Exp. Med. 1994;179:1109–1118. doi: 10.1084/jem.179.4.1109. [DOI] [PMC free article] [PubMed] [Google Scholar]
- Chapuis F., Rosenzwajg M., Yagello M., Ekman M., Biberfeld P., Gluckman J.C. Differentiation of human dendritic cells from monocytes in vitro. Eur. J. Immunol. 1997;27:431–441. doi: 10.1002/eji.1830270213. [DOI] [PubMed] [Google Scholar]
- Georgopoulos K., Bigby M., Wang J. The Ikaros gene is required for the development of all lymphoid lineages. Cell. 1994;79:143–156. doi: 10.1016/0092-8674(94)90407-3. [DOI] [PubMed] [Google Scholar]
- Ptak K., Askenase P.W. γ/δ T cells assist α/β T cells in adoptive transfer of contact sensitivity. J. Immunol. 1992;149:3503–3508. [PubMed] [Google Scholar]