

Abstract
The distribution of immunoglobulin (Ig) isotypes within specific B cell clones in vivo after immunization is not well defined. Using an IgVH/CDR3- and isotype-specific reverse transcription polymerase chain reaction method, we have carried out a survey of the diversification of the isotype in a splenic response to phenyl-oxazolone (phOx) on a chicken serum albumin carrier. The phOx-specific VH (VHOx-1 with specific CDR3 motif) is associated with all of the heavy chains (μ, δ, α, γ, and ε) after simple immunization with antigen in alum. The kinetics of expression of each isotype are distinct and reproducible. Focusing mainly on the expression of secretory Ig transcripts, IgM, IgG1, and IgE are found after priming, whereas IgD and IgA appear after boosting. Secretory IgD transcripts are found reproducibly at moderate levels and may, therefore, contribute significantly to the secreted Ig response in mice. Most crucially, we find enhanced levels of secretory IgM/VHOx-1 transcripts (with ‘phOx-specific’ CDR3) after boosting, strongly indicating the existence of IgM memory cells that give rise to an enhanced specific IgM secretion in the secondary response.
Keywords: B cell memory, immunoglobulin isotype, repertoire, IgD, oxazolone
Introduction
Upon exposure to antigen, specific B cell clones are activated and expanded and their Ig receptors are often somatically mutated 1 2 3 to allow selection for enhanced memory and effector functions. This clonal maturation also involves Ig class switch recombination, which profoundly alters the location and effector function of the secreted antibodies as well as the signaling function of those that are membrane bound 4. Although we know much about the factors (mainly cytokines) that regulate switching at a molecular level 5 6 7, relatively little attention has been paid to the evolution of isotype usage within specific B cell clones in vivo. Analysis of serum antibody responses shows that IgM expression/secretion is followed by switching to IgG (and IgA in the gut) but delivers only a crude measure of what is happening to the dominant populations across the broad range of the response, while ignoring the subtlety of V gene/isotype combination diversity. A higher resolution is required to reveal how particular V genes are brought into opposition with the variety of heavy chain isotypes during the course of an immune response in vivo. This will throw light on issues such as the functional diversity of antibodies and regulation of switching in vivo, sequential switching, and the importance and fate of B cells that do not class switch, i.e., putative IgM+ memory cells.
Although IgM is generally viewed as an isotype expressed on naive B cells and secreted after primary activation, a number of studies in recent years point to the fact that some B cells with a memory phenotype and V region somatic mutations still express IgM 8 9 10 11. IgM+ cells in the marginal zone of the mouse spleen have been shown to class switch upon secondary challenge, although it was not clear whether these were virgin or memory responses or were somatically mutated 12. Studies involving oral administration of DNP-KLH have shown an increased number of antigen-specific IgM+ cells after in vitro restimulation but no evidence for enhanced antigen-specific IgM in serum after secondary challenge in vivo, suggesting that the fate of any IgM+ memory cells is to class switch after secondary challenge in vivo 13. The clonal relationship between secondary IgM and class-switched responses is also obscure. The data derived from this study address directly the relevance of an IgM memory population and specific IgM secretion into the serum in secondary responses.
The drawback of methods that exploit antibody function (i.e., measuring serum antibodies, making hybridomas, probing tissues with antigen or antiidiotypes) is that they place limits on the parts of the response analyzed; rare cells, cells not secreting antibody, or those with low-affinity antibody may be missed. To overcome some of these problems, we have studied different stages of the immune response to phenyl-oxazolone (phOx) by reverse transcription (RT)-PCR. A significant part of the high-affinity response to the hapten carrier phOx–CSA (chicken serum albumin) is comprised of Igs formed from the VHOx-1 gene with a particular, short CDR3 (six amino acids) that has the general sequence DXGXXW 2 14 15. We define DXGXXW as the Ox motif. Using a primer specific for this gene and another specific for heavy chain constant regions (both membrane and secretory forms), we have carried out isotype-specific RT-PCR to detect oxazolone-specific VHOx-1 gene expression in vivo 16.
In situations where PCR primers span the CDR3 and the target is the pool of VHOx-1 containing Ig RNA in the spleen, the PCR product contains a population of molecules varying in length by codon units according to the natural CDR3 length variation caused by VDJ recombination. Such length differences are easily resolved on polyacrylamide gels to give a ladder of PCR products. Mouse V region CDR3 lengths are distributed over the range of 3–18 amino acids (9–54 bp), with a modal value of 10 16 17. The phOx-specific VHOx-1 segment CDR3 is six amino acids long, so transcripts of this Ig give an RT-PCR signal four codon units down from the modal value (referred to as the ‘C6’ band to reflect the length of the encoded CDR3). This method delivers the specificity and resolution to detect VHOx-1–expressing, phOx-specific B cell clonal expansions from whole spleen RNA.
We present a survey of isotype profiles of the phOx-specific, VHOx-1–expressing B cell repertoire early and late after primary immunization and after secondary immunization. All isotypes are generated after immunization with distinct and highly reproducible kinetics. We find clear evidence of IgM memory and enhanced expression of specific serum IgM in secondary responses.
Materials and Methods
RT-PCR.
Total RNA extraction was performed using the RNAzol B reagent (Biogenesis) according to the manufacturer's instructions using 1 ml of reagent for the pelleted cells from 10% of a whole spleen suspension. 3.5 μg of RNA was denatured at 96°C for 3 min with 0.5 μg of oligo-dT (see Fig. 2 and Fig. 3) or pdN6 (see Fig. 4) and placed on ice before RT in a 50-μl reaction for 1 h at 42°C (oligo-dT) or 37°C (pdN6) with 1× RT buffer, 0.2 mM dNTPs, 1 mM dithiothreitol, 800 U/ml RNAsin (Promega), and 400 U of MoMuLV reverse transcriptase (all from Life Technologies except where indicated).
Figure 2.

(a) Isotype-specific RT-PCR analysis of total splenic VHOx-1 expression in immunized mice. After the primary membrane- or secretory-specific PCR, samples were subject to one cycle of 33P-labeled nested primer run-off and electrophoresed 1 cm into a 5% sequencing gel and exposed to x-ray film. This gives a standard RT-PCR estimation of total VHOx-1 gene expression on different isotypes with the added specificity of a nested isotype-specific run-off. Control, PBS-immunized mice; d11, 11 d after phOx–CSA immunization; d88, 88 d after phOx–CSA immunization; boost, 4 d after secondary phOx–CSA immunization at day 84. Numbers along the bottom label samples from individual mice, so samples running vertically up the figure are from the same mouse. (b) Control PCR for HPRT from same cDNA used for VHOx-1 amplification. Samples are from individuals 1–12 running left to right.
Figure 3.
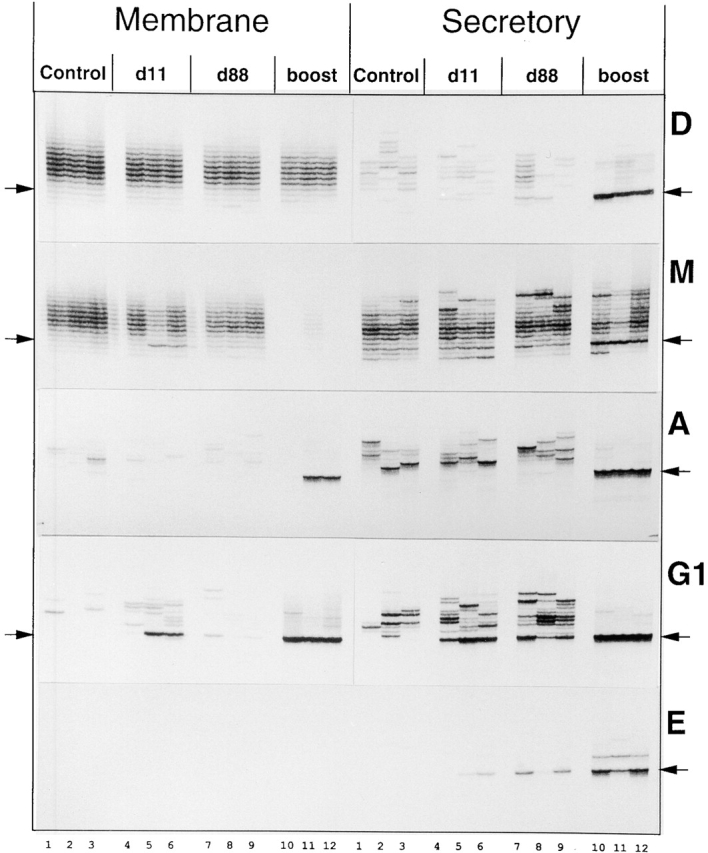
PAGE-resolved RT-PCR samples showing phOx-specific VH transcripts. After 12 cycles of 33P-labeled primer run-off, samples were fully resolved on 5% sequencing PAGE and exposed to x-ray film. Column labels are as for Fig. 2. D, IgD; M, IgM; A, IgA; G1, IgG1; E, IgE. Arrows indicate positions of VHOx-1 transcripts with six–amino acid CDR3s. From Table , all upregulated transcripts contain the Ox-motif CDR3, DXGXXW. Numbers along the bottom refer to individual mice; samples running vertically up the figure are from the same mouse.
Figure 4.

Tissue specificity of phOx-specific IgM and IgG1 transcripts. Ig RT-PCR of RNA samples from spleen, bone marrow, and peripheral blood. Column labels as before. Arrows indicate position of C6 transcripts. Peripheral blood sample 10 failed. First round RT-PCR was done with a reverse primer specific for the hinge region (IgG1) or the 3′ end of the CH1 exon (IgM) rather than for the membrane- or secretory-specific sequences at the far 3′ end of the cDNA for reasons given in Results. Numbers along the bottom refer to individual mice; samples running vertically up the figure are from the same mouse.
First round PCR (see Fig. 2) was done with 2 μl of cDNA reaction with standard reaction conditions using manufacturers' supplied buffer with Pfu-turbo polymerase (Stratagene) and 20 pmol of the appropriate primer, OXC2 and membrane or secretory isotype-specific primer for Fig. 2 and Fig. 3, OXC2 and a 3′ CH1 or hinge sequence isotype-specific primer for Fig. 4, in a 50-μl reaction for 30 cycles with the following cycling: 96°C, 30 s; 59°C, 30 s; 72°C, 2 min; preceded by an incubation at 96°C for 3 min before addition of polymerase.
For each single run-off reaction equivalent, 2 pmol of nested isotype-specific primer was end labeled with 3 μCi of γ-[33P]dATP (2,500 Ci/mmol; Amersham Pharmacia Biotech) using the User Friendly T4 polynucleotide kinase labeling system (Amersham Pharmacia Biotech). The reaction was NaOAc/EtOH precipitated and washed with 75% EtOH before use. Run-off reactions were performed for 12 cycles in a 20-μl volume with Pfu-turbo polymerase and buffer as before using 2 μl of the first-round PCR product with the following cycling: 96°C, 30 s; 60°C, 30 s; 72°C, 1 min. After cycling, reactions were treated as for standard sequencing gel electrophoresis and run on 5% acrylamide/urea gels, dried, and exposed to x-ray film (Kodak XAR and Biomax films). The maximum theoretical yield from the first round PCR is 20 pmol, a level probably reached by the secretory IgA and IgG1 amplifications from boosted mice. 2/50 of this = 0.8 pmol would be used in the run-off reactions, which contain 2 pmol of primer, and so these reactions would exhaust labeled primer after only a few cycles. The conditions were designed like this to bring up the signal from rarer transcripts for Fig. 3, but give a semiquantitative read out of total VHOx-1 expression levels in Fig. 2, which shows the signal after one cycle of run-off.
CDR3 Sequence Determination.
For PAGE purification of C6 transcripts, quadruple-sized run-off samples from the pooled PCR product of all three mice in a cohort were loaded on triple-width wells, electrophoresed, and located by autoradiography. Bands were cut out from the dried gel with fine scissors, soaked for 10 min in 100 μl of water, heated to 100°C for 15 min, and centrifuged at 15,000 rpm for 2 min. DNA was recovered from the supernatant by addition of 10 μg of linear polyacrylamide and NaOAc/EtOH precipitation on dry ice. After centrifugation, the pellet was washed with 75% EtOH, air dried, and redissolved in 10 μl of water. 4 μl of this was used in a 50-μl, 15-cycle PCR with Taq polymerase and manufacturers' supplied buffer with conditions as above and the OXC2 and appropriate nested isotype-specific primer that was also used in the run-off, with the following cycling: 94°C, 30 s; 59°C, 30 s; 72°C, 1 min. 2 μl of this product was TOPO-TA cloned, transformed into Escherichia coli TOP-10, and plated out on selective media according to manufacturer's instructions (Invitrogen). Individual colonies were picked and directly amplified for 25 cycles with Pfu-turbo (Stratagene), conditions as above, using the OXC2 and appropriate nested isotype-specific primer. 1 μl of this product was sequenced using the ABI Big-Dye kit (PerkinElmer) and analyzed on an ABI 377 DNA sequencer.
Oligonucleotide Primers.
OXC2, GGTGGAAGCACAAATTATAATTCG; Dmem, ACACGAGTGTTGGATGGTGTTGAC; Dsec, ACCGTCTGACTCAGGCAGGAGGTG; DCR2, TCTGGGGCTTTGCACTCTGAGAGG; Mmem, GCCTTCCTCCTCAGCATTCACCTC; Msec, CATGATCAGGGAGACATTGTACAG; MCR1, CAGATCTCTGTTTTTGCCTCCGTA; MCR2, GGCCACCAGATTCTTATCAGACAG; Amem, TAGCACATAGGAAAGTGGCTCTTG; Asec, CATGATCACAGACACGCTGACATT; ACR2, ATCAGGCAGCCGATTATCACTGGG; G1mem, TGGGCCTCAGCACAGGTCTCGTCC; G1sec, ACCAGAGGGCTCCAAGGACACTGG; G1CR1, ATGCAAGGCTTACAACCACAATCC; G1CR2, TCACCATGGAGTTAGTTTGGGCAG; Emem, CACCTCTTCAATACATAGGTCCTG; Esec, GGAGGGACGGAGGGAGGTGTTACC; and ECR2, TTACTAGGCAGCCTAGGGTCATGG. CR1 primers were used in place of membrane or secretory primers for the amplifications in Fig. 4.
Polymerase Error.
For the full RT-PCR/sequencing procedure—first round PCR (30 cycles, Pfu), linear run-off (12 cycles, Pfu), gel band amplification/cloning (15 cycles, Taq), and direct colony PCR (25 cycles, Pfu)—only the first round PCR and the gel band amplification have the potential to fix polymerase errors in the bulk of the to-be-sequenced PCR product. The other manipulations are either linear amplifications or the direct colony PCR, which is then directly sequenced. As 30 of these 45 cycles are done with Pfu-based polymerase (claimed error rate, 1.3 × 10⁻⁶) and only 15 with Taq (claimed error rate, 7.7 × 10⁻⁶), and the important target region—the CDR3—is only 18 bp, we ignored the possible effects of polymerase error. The CDR3 DNA sequences determined were very diverse, but those in the adjacent CH should give a reflection of the error rate by their divergence from germline. In the 23 clones sequenced for Table , we find a divergence from germline in the first 42 bp of IgM CH1 of 1/966 bp (0.1%), confirming the low PCR mutation rates in the small region under analysis.
Table 3.
CDR3 Sequences of SecIgM C6 Transcripts and FR3 Mutations in Ox Motif Clones
| Control | Day 4/S | Day 4/A | Day 11/A | Day 88 | Boost | ||||||||||||
|---|---|---|---|---|---|---|---|---|---|---|---|---|---|---|---|---|---|
| JH | JH | M | R | JH | JH | M | R | JH | JH | M | R | ||||||
| DGFAYW | 3 | DDGPYW | 4 | 0 | 0 | WSFAYW | 3 | DRGAYW | 3 | 0 | 0 | TGFDYW | 2 | DGGDYW | 4 | 1 | 0 |
| DGFAYW | 3 | TGFDYW | 2 | DGFAYW | 3 | DGGNSW | 4 | 0 | 0 | WGFAYW | 3 | DWGAYW | 3 | 2 | 1 | ||
| DQFAYW | 3 | TVVDYW | 2 | DTFAYW | 3 | DRGDYW | 2 | na | na | WGFAYW | 3 | DGGDYW | 4 | 1 | 0 | ||
| TGFDYW | 2 | IAMDYW | 4 | DRRDYW | 4 | DGGDYW | 2 | 0 | 0 | GGYHYW | 2 | DGGDYW | 4 | 1 | 0 | ||
| GTLDYW | 2 | DGNYYW | 2 | TGFDYW | 2 | NGFDYW | 2 | WGFAYW | 3 | DGGDYW | 4 | 3 | 2 | ||||
| WAFAYW | 3 | WRFAYW | 3 | AWDNYW | 2 | DGSAYW | 4 | RGFAYW | 3 | DGGDYW | 4 | 1 | 0 | ||||
| WGFAYW | 3 | WGFAYW | 3 | WGFAYW | 3 | TGFDYW | 2 | DRGDYW | 2 | 2 | 1 | ||||||
| DGFAYW | 3 | EGFAYW | 3 | EGIAYW | 3 | DGFAYW | 3 | DGGDYW | 4 | 1 | 0 | ||||||
| NAMDYW | 4 | EGIAYW | 3 | GPFDYW | 2 | DGGAYW | 3 | 0 | 0 | ||||||||
| DGFAYW | 3 | DGFAYW | 3 | TGFDYW | 2 | DGGDYW | 4 | 1 | 0 | ||||||||
| DGNYYW | 2 | DGFAYW | 3 | AGFDYW | 2 | DRGVYW | 3 | 0 | 0 | ||||||||
| WGFAYW | 3 | GNLAYW | 3 | TGFDYW | 2 | DGGDYW | 4 | 1 | 0 | ||||||||
| LGFDYW | 2 | WAMDYW | 4 | TGGIYW | 2 | DGGDYW | 4 | 1 | 0 | ||||||||
| WLLDYW | 2 | DGFAYW | 3 | TGFDYW | 2 | DGGDYW | 4 | 0 | 0 | ||||||||
| WGFAYW | 3 | YAMDYW | 4 | LYYGNW | 2 | DRGVYW | 2 | 2 | 1 | ||||||||
| YAMDYW | 4 | TGFDYW | 2 | WAFAYW | 3 | DGGDYW | 4 | 1 | 0 | ||||||||
| WDVDYW | 2 | DGGDYW | 4 | 1 | 0 | ||||||||||||
| TGGIYW | 2 | WGFAYW | 3 | ||||||||||||||
| DTFAYW | 3 | ||||||||||||||||
| WGFAYW | 3 | ||||||||||||||||
| WGFAYW | 3 | ||||||||||||||||
Column headings are as for Fig. 3 and Fig. 5. Ox motif sequences are underlined. M, total number of mutations found in the FR3 region of the corresponding Ox motif clone; R, number of mutations causing an amino acid replacement; na, FR3 sequence not analyzable; S, soluble antigen; A, alum/pertussis adjuvant.
Immunization.
The hapten carrier phOx–CSA was made as described previously 18. All mice immunized were 6-wk-old female BALB/c. For primary immunizations (day 0), mice were injected with either 30 μg of alum-precipitated phOx–CSA with 109 heat-killed pertussis intraperitoneally or PBS (nonimmunized). For boosting, (day 84) mice were injected with 30 μg of soluble phOx–CSA intraperitoneally in PBS.
Results
Protocol.
We carried out RT-PCR analysis of VHOx-1 RNA expression from whole spleen cell populations. Specificity was provided by two primers and subsequent CDR3 sequence determination. The forward primer OXC2 was specific for VHOx-1, the member of the Q52 mouse V gene family that forms a significant part of the response to phOx. It would be expected to amplify on the order of 1% of all Ig RNA expressed in the spleen. The reverse primers amplify from the membrane (mem) or secretory (sec) forms of IgD, IgM, IgA, IgG1, and IgE. Further control for isotype-specific amplification is provided by the use of a nested constant region primer run-off.
Fig. 1 shows a summary of the methods used in this study. It shows a map of a typical rearranged Ig heavy chain cDNA, the position of the primers used in this study, and a scheme for the PCR and 33P-labeled primer run-off analysis. The method differs little, in general, from previous methods for TCR ‘spectratyping’ 19. Radioactive rather than fluorescent labeling is used to facilitate PAGE purification of phOx-specific transcripts for CDR3 sequencing. Because the primers span the CDR3, as described in the Introduction, the amplified cDNA population forms a ladder of transcript lengths, of which the phOx-specific heavy chain transcript is one ‘rung.’ This heavy chain CDR3 is six amino acids long and so is referred to as the C6 band.
Figure 1.
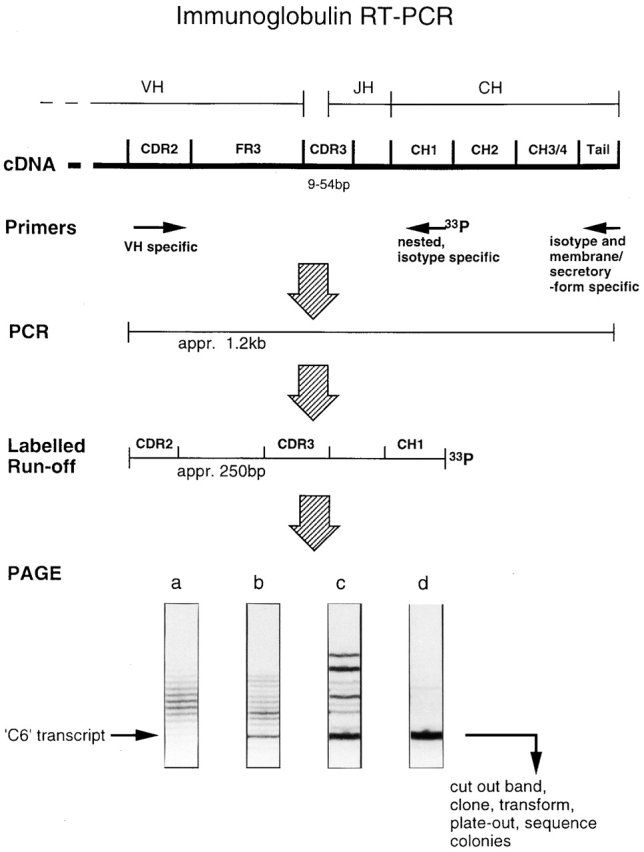
Scheme of Ig heavy-chain RT-PCR. Map of Ig heavy chain cDNA (not to scale) shows position of PCR primers used in the study and relative location of isotype-specific run-off primer for generating 33P-labeled fragments for PAGE. Autoradiograph images show typical outcomes obtained when repertoires of differing complexity are amplified by primers of different isotypes: (a) memIgD unimmunized mouse; (b) secIgM phOx-boosted mouse; (c) secIgG1 phOx-primed mouse; (d) secIgG1 phOx-boosted mouse. This study has focused on phOx-specific transcripts using VHOx-1 with a six–amino acid CDR3 that migrates in the position indicated by the arrow. These can be gel purified for further analysis.
Four typical outcomes obtained with this analysis are shown in Fig. 1. (a) Smooth: when the target cDNA pool is complex, in this case OXC2 × memIgD, and individual clones do not reach a large relative size, the amplified PCR product appears as a ladder with a smooth change in band densities. This reflects the Gaussian frequency distribution for in-frame transcript lengths. (b) Rough: when the amplified Ig pool is less complex and/or contains larger clones, then clonal expansions are detectable against the background of other specificities, as in this case, which is the product of PCR with OXC2 × secIgM. (c) Oligoclonal: class-switched repertoires show less diversity. They also contain larger clones that express higher levels of Ig. Consequently, the PCR product appears oligoclonal, with several easily detectable clones superimposed on a greatly diminished or zero background; OXC2 × secIgG1 from phOx-primed mouse. (d) ‘Nearly monoclonal’: in particular circumstances, for instance here in the PCR product from an OXC2 × secIgG1 amplification from a phOx-boosted mouse, the level of antigen-specific Ig is so high that the relative contribution of other clones is greatly diminished and the bulk of the PCR product is derived from VHOx-1/C6 Igs.
For the core of this study, nine mice were immunized in groups of three by intraperitoneal injection with 30 μg of phOx-20–CSA with alum/pertussis adjuvant. Three were analyzed at day 11 (d11), three were analyzed at day 88 (d88), and three were boosted at day 84 and analyzed at day 88. We take these groups to be primed (d11), long-term postprimed (d88), and boosted, respectively. Three age-matched, unimmunized mice were also analyzed.
Dynamics of Specific Isotype Responses.
The primary RT-PCR product from these samples indicates the total level of RNA coding for all of the Igs using the VHOx-1 gene, of a particular isotype. Fig. 2 a shows the RT-PCR analysis from the phOx-immunized cohort of mice. Rather than observing the PCR product directly on an agarose gel, it was subject to one cycle of run-off labeling with a nested primer and analyzed on PAGE without running the gel far enough to resolve the different CDR3 lengths. This gives a normal RT-PCR analysis of Ig expression with the added isotype specificity of a nested run-off primer. Fig. 2 b shows amplification of the cDNA from the same samples with primers for HPRT (hypoxanthine phospho-ribosyl transferase). After 11 further cycles of run-off and 5% PAGE, differing transcript lengths are resolved, and this is shown in Fig. 3. Ig transcripts with the DXGXXW Ox motif migrate at the C6 position, indicated with arrows. C6 bands were cut from gels when appropriate, cloned, and sequenced to confirm the presence of the Ox motif, and these sequences are shown in Table . This table shows that in every case where the C6 band is upregulated or appears for the first time in response to immunization, it is associated with DXGXXW containing CDR3s.
Table 1.
CDR3 Sequences of Secretory Form C6 Transcripts
| Day 11 | JH | Day 88 | JH | Boost | JH | |
|---|---|---|---|---|---|---|
| IgD | DRGDYW | 2 | ||||
| DRGDYW | 2 | |||||
| DRGDYW | 2 | |||||
| DRGAYW | 3 | |||||
| DRGDYW | 2 | |||||
| DGGDYW | 4 | |||||
| IgA | DSGVYW | 2 | ||||
| DLGDYW | 4 | |||||
| DRGISW | 3 | |||||
| DRGISW | 3 | |||||
| DRGDYW | 4 | |||||
| IgG1 | DGGVFW | 3 | DRGASW | 3 | DRGAYW | 3 |
| DRGAYW | 3 | DRGDSW | 3 | DRGDYW | 4 | |
| DRGAYW | 3 | DRGDYW | 2 | DRGDYW | 4 | |
| DRGAYW | 3 | DRGASW | 3 | DRGVYW | 3 | |
| DRGAYW | 3 | DRGAYW | 3 | DYGAYW | 3 | |
| IgE | DRGNPW | 3 | DGGDYW | 4 | DRGDYW | 2 |
| DRGDYW | 4 | DRGDYW | 2 | DLGDYW | 2 | |
| DWGAYW | 3 | DRGDYW | 4 | DQGDFW | 2 | |
| DRGYDW | 3 | DPGNHW | 2 | DRGVLW | 4 | |
| DRGVYW | 3 |
Column headings are as for Fig. 2.
Fig. 2 gives the overall level of VHOx-1 V segment expression in the spleen, and Fig. 3 and Table show the proportion of the transcript that is phOx specific. PhOx-specific transcript levels are defined, therefore, as the product of total VHOx-1 levels from Fig. 2 and the proportion of these that are C6 transcripts (Fig. 3) carrying the Ox motif (Table ). For ease of interpretation, the data from each of these analyses is described in detail for each isotype in turn.
IgD.
Whole spleen levels of VHOx-1 memIgD transcript vary within and between groups of mice (Fig. 2); however, on average, immunized mice seem to have less memIgD transcript than controls. As the bulk of memIgD is carried by mature but naive recirculating (M+D+) B cells, this might be due to the loss of IgD expression that accompanies specific and bystander (by pertussis) activation of cells after immunization. The memIgD CDR3 length profile is smooth (Fig. 3), as expected, in control mice. The memIgD-expressing cell population is complex, and sequences were not obtained for this study from memIgD C6 transcripts.
Total VHOx-1 secIgD was only just detectable in two boosted mice by RT-PCR (Fig. 2), but after further run-off and PAGE, all mice show an oligoclonal secIgD profile (Fig. 3). On top of this, the upregulation of secIgD after boosting, just visible in Fig. 2, appears to be entirely associated with production of phOx-specific secIgD in all boosted mice (Fig. 3 and Table ). This Ig is absent at d11 or d88 after priming. The expression of phOx-specific IgD after boosting is consistent with the presence of a long-lived/memory pool created by priming that is or can become IgD positive. There are other possible sources of the increased IgD (and IgM) seen after boosting, and these are investigated for IgM in the following section.
IgM.
Levels of VHOx-1 memIgM remain similar between the groups of mice during the primary response, but these drop off after boosting with phOx–CSA (Fig. 2). Many splenic B cells express memIgM including the mature, naive recirculating IgM/D+ double-positive B cells and IgM single-positive (marginal zone) B cells. The decrease of memIgM RNA in boosted mouse spleen, which is reproduced by the three individuals boosted here and has been observed subsequently in further experiments, could be due to a number of factors. Competition for space or niches in the antigen-boosted spleen could exclude some surface IgMhi cells and reduce the proportion in the sample. Modulation of the IgD/M expression ratio, selective exit of IgMhi single-positives, or a bias in RNA splicing toward the secretory form could also all have this effect. It is possible to amplify more memIgM product from boosted mice using a more efficient polymerase and/or more cycles, but under these conditions many of the PCR reactions for other isotypes would become saturated and not allow comparisons between primed and boosted samples. For this whole panel of RNA/cDNA samples, a standard polymerase, number of cycles, and master mix was used, and all samples for particular isotypes were processed at the same time.
The memIgM C6 transcript is significantly upregulated in two of three primed (d11) mice (Fig. 3), with this signal becoming less pronounced by day 88. All upregulation of memIgM/C6 in response to phOx is attributable to DXGXXW Ox motif–containing Ig (Table ).
Table 2.
CDR3 Sequences of MemIgM C6 Transcripts
| Control | JH | Day 11 | JH | Day 88 | JH | Boost | JH |
|---|---|---|---|---|---|---|---|
| DDGTYW | 3 | DGGAYW | 3 | GLFAYW | 3 | ||
| NAMDYW | 4 | DGGAYW | 3 | ELEDYW | 4 | ||
| ALYAYW | 3 | DGGAYW | 3 | EGFAYW | 3 | ||
| MGFAYW | 3 | DGGAYW | 3 | VEGDYW | 4 | Low | |
| EGFAYW | 3 | DWGDYW | 2 | TGLAYW | 3 | signal | |
| DYDAYW | 2 | DGGNSW | 4 | ||||
| DRFAYW | 3 | DRGAYW | 3 | ||||
| AWFAYW | 3 | ||||||
| NLFDYW | 2 | ||||||
| NYGAYW | 3 | ||||||
Column headings are as for Fig. 2. Ox motif sequences are underlined.
Overall levels of VHOx-1 secIgM expression remain similar over time and between groups of mice and always appear greater than levels of memIgM (Fig. 2). In contrast to expression of the membrane form, levels of secIgM C6 transcript do not appear enhanced after priming (Fig. 3), although 4/18 of these transcripts contain the Ox motif at day11 (Table ). At this stage, therefore, the high-affinity response is present but at a low level. Interestingly, the C6 secIgM transcript is overrepresented in all unimmunized mice (Fig. 3), but none of the sequences obtained from this contain the Ox motif (Table ). At day 88, there is no obvious difference in C6 transcript levels, and we find no Ox motif CDR3s in six sequenced transcripts. After boosting, the level of the C6 secIgM band increases significantly in all mice by over twofold on average, as determined by PhosphorImaging of the gel (Fig. 3 and Table ). Correlated with this, we find the Ox motif in 17/21 transcripts sequenced from the C6 band (Table ). Thus, all of the increase in secIgM C6 transcript levels in boosted mice is attributable to expression of high-affinity secIgM VH. The level of phOx-specific IgM after boosting is, therefore, approximately eightfold higher than that after priming. This figure is arrived at by multiplying the increase in average band density by the increase in proportion of Ox motif clones. See Fig. 5 for the band intensity data and an explanation of the rationale behind it.
Figure 5.

PAGE-resolved RT-PCR samples showing phOx-specific secIgM VH transcripts. (a) Control, unimmunized mice; d4/S, day 4 samples from mice primed with soluble antigen; d4/A, day 4 samples from mice primed with antigen and alum/pertussis adjuvant; boost, samples from boosted mice 4 d after boosting; d11/A, day 11 samples from mice primed with antigen and alum/pertussis adjuvant. (b) Carrier prime, day 4 after boosting samples from mice carrier-primed and boosted with phOx–CSA 31 d later; C6%, the amount of the C6 band expressed as a fraction of the total VHOx-1 ladder. We have used this measure because it should be independent of any PCR bias and sample size variation. When the C6 band is a minor fraction of total VHOx-1 expression, and total VHOx-1 expression does not vary systematically between different groups of mice (for example see secIgM, Fig. 2), it represents an accurate, semilinear measure of the level of expression of the C6 band. Band densities were measured directly from the gel with a Fuji PhosphorImager. Mean, the mean of the C6% figures for each group.
If the enhanced expression of IgM is derived from a memory cell population, these cells may have somatically mutated V genes, as seen in memory cells that contribute to class-switched secondary responses. We have analyzed the VHOx-1 framework-3 (FR3) sequences from the Ox motif–containing secIgM clones, and the numbers of point mutations and amino acid replacements found in this region are shown in Table as well. The VHOx-1 FR3 is 96 bp long. Of the four analyzable Ox motif clones from primary immunizations, three from day 11 and one from day 4, we find no mutations in 384 bp of FR3. Of the 17 Ox motif clones derived from boosted mice, we find that 14/17 have at least one mutation, and the average level is 19/1,632 bp = 1.2%, which is ∼10-fold higher than that seen as a result of PCR (0.1%; see Materials and Methods). We find a significant level of somatic mutation, therefore, in the VHOx-1 IgM expressed after boosting, and this is consistent with a memory cell origin. As a comparison, we have detected FR3 mutation levels of up to 3% in class-switched VHOx-1 FR3s (data not shown).
As well as an IgM+ memory cell population, other factors could cause an enhanced secondary IgM response. Selective recruitment of antigen-specific cells from other tissues after boosting could have this effect. Fig. 4 shows the RT-PCR/run-off for IgM in the bone marrow and peripheral blood, as well as the spleen, in the same cohort of mice. This figure shows total rather than membrane and secretory forms of IgM expression. Avoiding use of the membrane/secretory-specific primers allows much more sensitive detection of specific isotype transcripts from the small and variable peripheral blood and bone marrow samples because of the use of random hexamer cDNA priming and much shorter primary PCR targets.
It is clear from this figure that the enhanced secondary secIgM response seen in the spleen for VHOx-1/C6 transcripts, and reproduced here for total IgM, is also observed in the bone marrow and peripheral blood, where there is no obvious primary response, and this argues against recruitment of antigen-specific IgM+ cells from these tissues to the spleen on secondary challenge.
It is possible that IgM+ plasma cells could be generated early in a primary focus reaction that has decayed by day 11, when we take our primary immunization samples. In this case the secIgM expression we detect 4 d after boosting is simply a new, naive, primary focus reaction sampled at the appropriate time. We have immunized mice with phOx–CSA, with and without alum/pertussis adjuvant, and sampled them at day 4 after priming to see if a VHOx-1/Ox motif–based primary focus response is detectable at this time, and the results are shown in Fig. 5 and CDR3 sequences are shown in Table . There is no evidence for an Ox motif–type primary focus response in these day 4 samples that would explain the response seen after boosting. The VHOx-1/C6 band is not increased, and there was only one Ox motif CDR3 detected in the total of 32 day 4 clones, a level lower than at day 11.
It has been reported in hapten-carrier systems that increased carrier-specific T cell help, induced by priming, can contribute to an enhanced response to hapten on secondary exposure 20 21. Fig. 5 b shows the VHOx-1/secIgM spectratype 4 d after phOx boosting of carrier-primed mice. Mice were boosted 31 d after carrier priming, a time when CSA-specific T cell help would be high. These samples show no increase in VHOx-1/C6 levels and, therefore, imply that increased carrier-specific help is not responsible for the enhanced secIgM expression we observe on secondary challenge. Taken together, these observations are strong evidence for an IgM+ memory cell population that produces an enhanced secondary response containing IgM VH with a significant level of somatic mutation. The possible nature of these cells is dealt with in the Discussion.
IgA.
Total levels of VHOx-1 memIgA transcript are very low in all except two of the boosted mice (Fig. 2). Levels of secIgA are consistently high, even in controls, but increase further after phOx boosting (Fig. 2). This is associated with the appearance, at high levels, of phOx-specific secIgA transcript (Fig. 3 and Table ). This may have arisen by switching from another isotype immediately after boosting.
IgG1.
Studies of hybridomas derived from mice undergoing responses to phOx–CSA suggest that IgG1 is the dominant isotype in this response 15. In this study, total VHOx-1 memIgG1 is detectable by RT-PCR (Fig. 2) after boosting. VHOx-1 secIgG1 increases significantly after priming, remains at approximately these levels after 88 d, and increases dramatically again after boosting (Fig. 2). Fig. 3 and Table show that the bulk of this increase is associated with production of Ox motif–containing C6 transcripts. PhOx-specific memIgG1 appears after priming, falls of by day 84, and rises again after boosting but by several times the level induced by priming. PhOx-specific secIgG1 rises after priming, declines a little by day 88, and then rises to very high levels after boosting. Fig. 4 shows that the decline of antigen-specific IgG1 at day 88 in the spleen is associated with an increase in the bone marrow. This is consistent with migration of IgG1+ plasma cells to this tissue.
IgE.
Although not detected by VHOx-1 isotype–specific RT-PCR (not shown), after 12 cycles of run-off, phOx-specific (C6 band and Ox motif) secIgE is detectable in two out of three primed mice. It continues to be produced until day 88 and then increases after boosting (Fig. 3 and Table ). The pattern of this is similar to that of secIgG1. The use of alum as the priming adjuvant may be important in achieving the phOx-specific IgE.
Discussion
The data presented here demonstrates that V gene–specific, isotype-specific RT-PCR analysis is a powerful tool for studying Ig expression during an immune response, revealing insights that are not readily available to analysis at the protein level. All major isotypes of antibody, including IgD and IgA, using the same VH with closely related CDR3s, are produced in response to a simple primary or secondary challenge with phOx. The pattern of expression of particular isotypes is very reproducible between mice, and each isotype is expressed with characteristic kinetics. Findings of particular note are the routine appearance of secIgD in the secondary response and enhanced expression of IgM in the secondary response, indicative of IgM+ memory cells.
We have focused mainly on secretory rather than membrane-bound Igs in this study. MemIg is expressed on cells from a variety of developmental stages, and full interpretation of results will require fractionation of subpopulations (studies underway). In contrast to this situation, PCR of unfractionated spleen cells for secIg gives a measure of the antibody output of the spleen, on the assumption that levels of secIg mRNA map to levels of secreted Ig protein. Particularly for the class-switched antibodies, we would expect the secretory product to be derived largely from plasma cells. This approach allows us to directly detect all isotypes of secretory antibody expression by related B cell clones in the spleen as a whole and, therefore, study a humoral response in vivo with the sensitivity of PCR.
PhOx-specific secIgG1 is detected in the expected pattern. It is expressed after priming, maintained perhaps with a slight average reduction in levels to d88, consistent with migration of IgG1+ cells to the bone marrow, and increases severalfold after boosting. Expression of secIgE follows a similar pattern, although average levels may increase slightly between 11 and 88 d after priming. A priming dose of phOx–CSA, therefore, induces long-term, persisting, antigen-specific IgE expression.
In the spleen, the phOx-specific secVHOx-1–IgA expression is found only after boosting; no upregulation of mem- or secIgA is detected in any of the six primed mice. Reproducible (in three mice) expression of secIgA suggests that IgA plasma cell development in the spleen is a normal feature of a recall response. Given the lack of mem- or secIgA in the spleen before boosting, the IgA recall response may be derived from cells that have recently switched and were expressing another isotype before the boost.
PhOx-specific secVHOx-1–IgD is readily detected in all three boosted mice, and for this reason IgD must be considered a part of normal antibody responses in mice. Levels of expression appear higher than levels of IgE transcripts but lower than those for IgA and IgG1 (Fig. 2 and Fig. 3), although we cannot control for differences in primer efficiency between isotypes. The detection of secIgD only after boosting suggests the existence of a memory cell population that is committed to secreting this isotype upon rechallenge. The phenotype of these memory cells, however, is not obvious from this data. They will not be class switched, but it is not possible to state whether they express IgD, with or without IgM, or express IgM alone. This IgD secondary response might be explained by migration of secIgD-expressing cells to the spleen from elsewhere, but if this were the entire explanation we would observe some expression after primary immunization.
The phenotype of the cells secreting IgD is not clear either. We have observed that FACS®-sorted IgM+/IgD+ cells from phOx-boosted mice show no secVHOx-1/IgD C6 transcript expression (our unpublished observation), and so it is likely they are IgD single-positive cells. IgD has previously been shown to be involved in normal immune responses in IgM knockout mice 22.
A clear observation to arise from this study is the detection of eightfold enhanced antigen-specific secIgM that is somatically mutated after secondary exposure in the spleen. This suggests the existence of IgM+ memory cells that provide for IgM secondary responses. The kinetics of expression of this secIgM are similar to those of IgG1 and contrast with those seen when polyclonal serum IgM is analyzed in primary and secondary responses. The C6 secIgM band is not increased after priming (Fig. 3), and sequence analysis shows the presence of only 0/16 or 1/16 (day 4) or 4/18 (day 11) Ox motifs (Table ). In contrast, after boosting, not only do the levels of the C6 secIgM band increase significantly in all three mice, but sequence analysis shows the presence of 17/21 Ox motifs in these bands.
We have excluded carrier-primed T cell help and an early primary focus response as an explanation of the secIgM transcripts we detect after boosting. We conclude that we have detected an enhanced secondary IgM response produced by a long-lived (84 d) population of IgM+ cells that express somatically mutated Ig. This is strong evidence for an IgM+ memory cell population that produces an IgM secondary response. It remains to be determined whether these cells have properties similar to those of the memory cells that contribute to class-switched secondary responses.
Long-lived class-switched plasma cells have recently been described in the mouse 23 24 25. It is possible that there could be long-lived IgM+ plasma cells expressing low levels of surface IgM that could mediate an enhanced secondary response. This point raises an important issue about the very definition of memory cells. There is no data to imply that memory is the sole privilege of a particular type of B cell of a single developmental stage or phenotype. It is more likely that memory, as it is functionally defined, is distributed across different phenotypes, isotypes, and indeed developmental stages; it is the property of a diverse compartment, the composition of which may change over time after antigenic exposure. The conventional definition of immune memory is that it facilitates a faster, greater, and usually higher affinity antibody response to secondary exposure. We have documented a faster and greater IgM response and find somatic mutation consistent with affinity maturation.
If some of the secIgM we detect after boosting is derived from a type of restimulatable ‘plasma cell’ that expresses surface IgM, then these cells are a type of memory cell. The long-lived plasma cells that have been described as a source of long-lasting protective immunity are class switched, have no/low surface Ig, appear antigen independent, and do not respond to antigenic challenge 23 24 25. We think it is unlikely, therefore, that this particular type of cell is a part of the IgM-producing IgM+ memory cell compartment.
As discussed for IgD, the IgM secondary response is unlikely to result from migration of these cells from elsewhere, as it would be seen after priming. Also, the enhanced expression of IgM seen on boosting is detected in the bone marrow and peripheral blood as well as the spleen (Fig. 4), and this argues against recruitment of IgM-expressing cells from these tissues. The data presented here cannot resolve the question of whether these IgM-secreting cells are, or were derived from, IgM single-positive or IgM/IgD double-positive memory cells.
A significant upregulation of the memIgM C6 transcript is observed in two of three day 11 mice. The memIgM transcripts from these mice were sequenced (Table ), and this data confirms that elevated levels of the C6 transcript are attributable to expression of Ig with Ox motif CDR3s. These elevated levels of membrane-bound phOx-specific VH/IgM are consistent with the establishment of a memory cell pool.
We have not designed this study as an in depth analysis of somatic mutation or CDR3 sequence diversity. We have used CDR3 sequencing simply to confirm the presence of the Ox motif. From Table and Table , however, it does appear that the DGGXXW VHOx-1 CDR3 motif is more popular in IgM as compared with the other isotypes. We find DGGXXW in only 2/38 non-IgM secreted Ox motifs overall (Table ). It appears in 13/17 Ox motif secIgM sequences from pooled samples after boosting (Table ). To check the generality of this effect, we sequenced clones from the secIgM C6 band from the three individual boosted mice. Of the secIgM Ox motifs in these mice, 3/7, 9/9, and 1/4 were DGGXXW. This shows that DGGXXW is present in the secIgM CDR3 of all three mice, being popular in one and dominant in another. This observation suggests that although the kinetics of expression of secVHOx-1/IgM is comparable to other isotypes, the receptor diversity is different. This bias could be explained by reduced levels of somatic mutation in IgM+ cells, affinity-based selection out of the IgM compartment, or both. It is difficult to draw firm conclusions on this point because of the lack of information about light chain pairing.
It is often argued that the serum IgM repertoire is largely made up of ‘natural’ antibodies selected by endogenous ligands 26 27, many of which are synthesized by CD5 B cells 28 29. Our data would suggest that a significant proportion of serum IgM is the result of a specific immune response. That we observe an enhanced secIgM response 84 d after priming in a mouse suggests that the longer a mouse lives, the more significant and diverse the memory component of the secreted IgM response would become. The upregulation of phOx-specific secIgM upon boosting is not sufficient to affect the overall levels of VHOx-1 transcripts (Fig. 2), and so the amount of RNA detected appears less than that seen for IgG and IgA. It seems likely to us that these specific IgM clonal expansions would be masked by polyclonal serum antibody in in vitro assays and emphasizes the sensitivity of the PCR approach.
All three unimmunized mice show ‘overrepresentation’ of the secIgM C6 band: it is darker than it would be if it followed the Gaussian distribution of CDR3 lengths seen with random VDJ joining in unselected antigen receptor repertoires 16 19. As shown in Table , the sequences present in this band in the control mice are diverse and so do not represent a particular dominant clonal expansion. This suggests that the six–amino acid CDR3 is generally popular in the VHOx-1 gene repertoire of secIgM-expressing cells. This effect is not apparent in the memIgD tracks from the same three mice, which are completely smooth, nor is it obvious in the levels of memIgM expression. Thus, the cells expressing this diverse six–amino acid CDR3/VHOx-1 appear to be IgMhiIgDlo or IgM-only cells. These cells are less frequent in the mouse spleen than IgM+IgDhi cells and express higher levels of sec- than memIgM (data not shown). These may be the ‘natural’ antibody-secreting B1 cells or possibly the result of previous IgM memory expansions, a hypothesis consistent with the observation of VHOx-1 IgG1 C6 transcripts in the peripheral blood of unimmunized mice.
The immune system is arithmetically as well as biologically complex. We have found that focusing too early on particular parts of the phOx response using marker-defined cell populations as well as replica experiments and different tissues and time points leads to an exponentiating experimental throughput, particularly when large numbers of CDR3 sequences are needed to generate statistical significance for individual data points. In these circumstances, it is necessary to start with a coarse-grained study to redefine phenomena, recall responses for example, as observed with PCR. More focused studies on particular observations can then be designed within the context of these.
The interpretation of this type of data has some restrictions. It is not possible to define the specificity of expressed antibodies by their function, and there is no information on light chain pairing. We assume we are detecting antigen-specific antibody responses for two reasons. First, we are studying an immune response known to involve reproducibly a particular VH gene/CDR3 combination, which we identify, and define, with a V gene–specific primer and sequence determination. Second, the levels of expression of this defined heavy chain increase from zero in most compartments in response to immunization. With IgM, the PCR target population is more complex, the signal/noise ratio (after versus before immunization) becomes noninfinite, and the justification for detection of a VH response and its association with antigen is statistical. Not knowing light chain pairing is not a problem unless it is important to study the progeny of a single naive B cell. We are observing an immune response by a family of related clones defined by expression of a particular heavy chain, and it is within this context that our data is to be interpreted. In previous studies 2, 21/23 anti-Ox, VHOx-1–expressing hybridomas obtained from different stages of immunization used the VκOx-1 light chain, so it is likely that the bulk of the heavy chains we analyze are paired with this. Irrespective of this, the response we are studying is obviously not monoclonal. Sequences obtained from individual mice for secIgM show the Ox motif linked to more than one JH region, implying the existence of more than one founder clone (data not shown).
We have shown that all major heavy chain isotypes, attached to the same VH and using variants of the same CDR3, are involved in the oxazolone response in vivo and are expressed and probably secreted in reproducible patterns at the organ level. We have also directly detected an antigen-specific memory response derived from the IgM+ and, perhaps, IgD+ populations that contribute to enhanced expression of these isotypes on secondary challenge.
The reproducibility of this system and its potential to measure specific B cell responses from early developmental compartments makes RT-PCR of phOx, or other V-restricted responses, a promising approach to analyzing the effects of cytokines and manipulated genotypes on the immune response in vivo.
Acknowledgments
Special thanks to Roland Levinsky, Christine Kinnon, Robin Callard, and Adrian Thrasher for support, Michael Neuberger for critical comment, Cesar Milstein for discussion, and Marcos Timon for sequence analysis. Thanks also to Peter Beverley for support and PE Biosystems (UK) and Peter Loader for sequence analysis.
This work was partially funded by SPARKS. D. Gray is supported by the Wellcome Trust.
Footnotes
Abbreviations used in this paper: CSA, chicken serum albumin; mem, membrane; phOx, phenyl-oxazolone; RT, reverse transcription; sec, secretory.
References
- Bernard O., Hozumi N., Tonegawa S. Sequences of mouse immunoglobulin light chain genes before and after somatic changes. Cell. 1978;15:1133–1144. doi: 10.1016/0092-8674(78)90041-7. [DOI] [PubMed] [Google Scholar]
- Griffiths G.M., Berek C., Kaartinen M., Milstein C. Somatic mutation and the maturation of immune response to 2-phenyl oxazolone. Nature. 1984;312:271–275. doi: 10.1038/312271a0. [DOI] [PubMed] [Google Scholar]
- Neuberger M.S., Milstein C. Somatic hypermutation. Curr. Opin. Immunol. 1995;7:248–254. doi: 10.1016/0952-7915(95)80010-7. [DOI] [PubMed] [Google Scholar]
- Kaisho T., Schwenk F., Rajewsky K. The roles of gamma-1 heavy chain membrane expression and cytoplasmic tail in IgG1 responses. Science. 1997;276:412–415. doi: 10.1126/science.276.5311.412. [DOI] [PubMed] [Google Scholar]
- Isakson P.C., Pure E., Vitetta E.S., Krammer P.H. T cell derived B cell differentiation factor(s). Effect on the isotype switch of murine cells. J. Exp. Med. 1982;155:734–748. doi: 10.1084/jem.155.3.734. [DOI] [PMC free article] [PubMed] [Google Scholar]
- Snapper C.M., Paul W.E. Interferon-gamma and B cell stimulatory factor-1 reciprocally regulate Ig isotype production. Science. 1988;236:944–947. doi: 10.1126/science.3107127. [DOI] [PubMed] [Google Scholar]
- Stavnezer J. Immunoglobulin class switching. Curr. Opin. Immunol. 1996;8:199–205. doi: 10.1016/s0952-7915(96)80058-6. [DOI] [PubMed] [Google Scholar]
- Van Es J.H., Gmelig-Meyling F.H.J., Logtenberg T. High frequency of somatically mutated IgM molecules in the human adult B cell repertoire. Eur. J. Immunol. 1992;22:2761–2764. doi: 10.1002/eji.1830221046. [DOI] [PubMed] [Google Scholar]
- Pascual V., Liu Y.J., Maglaski A., de Bouteiller O., Banchereau J., Capra J.D. Analysis of somatic mutation in five B cell subsets in human tonsil. J. Exp. Med. 1994;180:329–339. doi: 10.1084/jem.180.1.329. [DOI] [PMC free article] [PubMed] [Google Scholar]
- Klein U., Kuppers R., Rajewsky K. Evidence for a large compartment of IgM expressing memory B cells in humans. Blood. 1997;89:1288–1298. [PubMed] [Google Scholar]
- Klein U., Rajewsky K., Kuppers R. Human immunoglobulin (Ig)M+IgD+ peripheral blood B cells expressing the CD27 cell surface antigen carry somatically mutated variable region genesCD27 as a general marker for somatically mutated (memory) B cells. J. Exp. Med. 1998;188:1679–1689. doi: 10.1084/jem.188.9.1679. [DOI] [PMC free article] [PubMed] [Google Scholar]
- Toellner K.-M., Gulbranson-Judge A., Taylor D.R., Sze D.M.-Y., MacLennan I.C.M. Immunoglobulin switch transcript production in vivo related to the site and time of antigen specific B cell activation. J. Exp. Med. 1996;183:2303–2312. doi: 10.1084/jem.183.5.2303. [DOI] [PMC free article] [PubMed] [Google Scholar]
- Vajdy M., Lycke N. Mucosal memory B cells retain the ability to produce IgM antibodies 2 years after oral immunization. Immunology. 1995;86:336–342. [PMC free article] [PubMed] [Google Scholar]
- Kaartinen M., Griffiths G.M., Hamlyn P.H., Markham A.F., Karjalainen K., Pelkonen J.L.T., Makela O., Milstein C. Oxazolone hybridomas and the structure of the oxazolone idiotype. J. Immunol. 1983;130:937–945. [PubMed] [Google Scholar]
- Kaartinen M., Griffiths G.M., Markham A.F., Milstein C. mRNA sequences define an unusually restricted IgG response to 2-phenyloxazolone and its early diversification. Nature. 1983;304:320–324. doi: 10.1038/304320a0. [DOI] [PubMed] [Google Scholar]
- White H.N. Restriction-PCR fingerprinting of the immunoglobulin VH repertoiredirect detection of an immune response and global analysis of B cell clonality. Eur. J. Immunol. 1998;28:3268–3279. doi: 10.1002/(SICI)1521-4141(199810)28:10<3268::AID-IMMU3268>3.0.CO;2-F. [DOI] [PubMed] [Google Scholar]
- Rock E.P., Sibbald P.R., Davis M.M., Chien Y.-H. CDR3 length in antigen specific immune receptors. J. Exp. Med. 1994;179:323–328. doi: 10.1084/jem.179.1.323. [DOI] [PMC free article] [PubMed] [Google Scholar]
- Makela O., Kaartinen M., Pelkonen J.L., Karjalainen K. Inheritance of antibody specificity V. Anti–2-phenyloxazolone in the mouse. J. Exp. Med. 1978;148:1644–1660. doi: 10.1084/jem.148.6.1644. [DOI] [PMC free article] [PubMed] [Google Scholar]
- Pannetier C., Even J., Kourilsky P. T cell repertoire diversity and clonal expansions in normal and clinical samples. Immunol. Today. 1995;16:176–181. doi: 10.1016/0167-5699(95)80117-0. [DOI] [PubMed] [Google Scholar]
- Kallberg E., Gray D., Leanderson T. The effect of carrier and carrier priming on the kinetics and pattern of somatic mutation in the V chi Ox1 gene. Eur. J. Immunol. 1995;25:2349–2354. doi: 10.1002/eji.1830250834. [DOI] [PubMed] [Google Scholar]
- Gray D., MacLennan I.C.M., Lane P.J.L. Virgin B-cell recruitment and the lifespan of memory clones during antibody responses to 2,4-dinitrophenyl-hemocyanin. Eur. J. Immunol. 1986;16:641–648. doi: 10.1002/eji.1830160609. [DOI] [PubMed] [Google Scholar]
- Lutz C., Ledermann B., Kosco-Vilbois M.H., Ochsenbein A.F., Zinkernagel R.M., Kohler G., Brombacher F. IgD can largely substitute for loss of IgM function in B cells. Nature. 1998;393:797–801. doi: 10.1038/31716. [DOI] [PubMed] [Google Scholar]
- Manz R.A., Thiel A., Radbruch A. Lifetime of plasma cells in the bone marrow. Nature. 1997;388:133–134. doi: 10.1038/40540. [DOI] [PubMed] [Google Scholar]
- Slifka M.K., Antia R., Whitmire J.K., Ahmed R. Humoral immunity due to long-lived plasma cells. Immunity. 1998;8:363–372. doi: 10.1016/s1074-7613(00)80541-5. [DOI] [PubMed] [Google Scholar]
- Manz R.A., Lohning M., Cassese G., Thiel A., Radbruch A. Survival of long-lived plasma cells is independent of antigen. Int. Immunol. 1998;10:1703–1711. doi: 10.1093/intimm/10.11.1703. [DOI] [PubMed] [Google Scholar]
- Coutinho A. Beyond clonal selection and network. Immunol. Rev. 1989;110:63–87. doi: 10.1111/j.1600-065x.1989.tb00027.x. [DOI] [PubMed] [Google Scholar]
- Haury M., Sundblad A., Grandien A., Barreau C., Coutinho A., Nobrega A. The repertoire of serum IgM in normal mice is largely independent of external antigenic contact. Eur. J. Immunol. 1997;27:1557–1563. doi: 10.1002/eji.1830270635. [DOI] [PubMed] [Google Scholar]
- Herzenberg L.A., Stall A.M., Lalor P.A., Sidman C., Moore W.A., Parks D.R., Herzenberg L.A. The Ly-1 B-cell lineage. Immunol. Rev. 1986;93:81–102. doi: 10.1111/j.1600-065x.1986.tb01503.x. [DOI] [PubMed] [Google Scholar]
- Forster I., Rajewsky K. Expansion and functional activity of Ly-1+ B cells upon transfer of peritoneal cells into allotype congenic, newborn mice. Eur. J. Immunol. 1987;17:521–528. doi: 10.1002/eji.1830170414. [DOI] [PubMed] [Google Scholar]