

Abstract
Human immunoglobulin (Ig)A exists in blood as two isotypes, IgA1 and IgA2, with IgA2 present as three allotypes: IgA2m(1), IgA2m(2), and IgA2m(n). We now demonstrate that recombinant, chimeric IgA1 and IgA2 differ in their pharmacokinetic properties. The major pathway for the clearance of all IgA2 allotypes is the liver. Liver-mediated uptake is through the asialoglycoprotein receptor (ASGR), since clearance can be blocked by injection of excess galactose-Ficoll ligand and suppressed in ASGR-deficient mice. In contrast, only a small percentage of IgA1 is cleared through this pathway. The clearance of IgA1 lacking the hinge region with its associated O-linked carbohydrate was more rapid than that of wild-type IgA1. IgA1 and IgA2 that are not rapidly eliminated by the ASGR are both removed through an undefined ASGR-independent pathway with half-lives of 14 and 10 h, respectively. The rapid clearance of IgA2 but not IgA1 through the liver may in part explain why the serum levels of IgA1 are greater than those of IgA2. In addition, dysfunction of the ASGR or altered N-linked glycosylation, but not O-glycans, that affects recognition by this receptor may account for the elevated serum IgA seen in liver disease and IgA nephropathy.
Keywords: asialoglycoprotein, glycosylation, IgA, liver, blood clearance
Introduction
An increased concentration of IgA is often seen in the serum of patients with alcoholic liver disease (ALD) and IgA nephropathy (IgAN) 1 2 3 4. The factors responsible for the elevated levels of serum IgA in these disorders remain to be elucidated. In ALD, changes in subclass distribution and molecular form of IgA and in the deposition of IgA in various tissues have been reported 2 5 6 7. Aberrant IgA glycosylation and defective clearance from plasma by the liver are implicated in the pathogenesis of IgAN 8 9 10.
In humans, IgA is the predominant immunoglobulin synthesized and exceeds the combined total of all the other immunoglobulin classes 11. It is estimated that 66 mg of IgA/kg of body weight is produced daily compared with 34 mg of IgG and 7.9 mg of IgM. However, in normal human serum the IgA concentration is about one fifth that of IgG. Most of the IgA synthesis occurs in the lamina propria of the mucosal surfaces. The IgA synthesized in the lamina propria is transported into the external secretions where it is the most abundant immunoglobulin.
Human IgA exists as two isotypes, IgA1 and IgA2; three allotypes of IgA2 have been described: IgA2m(1), IgA2m(2), and the more recently discovered novel allotype IgA2(n) 11 12 13. The major difference between the IgA1 and IgA2 subclasses is a 13–amino acid deletion in the IgA2 hinge region. The IgA1 hinge region contains three to five O-linked carbohydrate moieties lacking in IgA2. IgA1 has two N-linked carbohydrate addition sites in CH2 (Asn263) and in CH3 (Asn459). All IgA2 allotypes have two additional N-linked sites, in CH1 (Asn166) and in CH2 (Asn337). The IgA2m(2) and the IgA2(n) allotypes have a fifth N-linked site in CH1 (Asn211). The variations in the glycosylation structure of the different forms of IgA may affect their biological properties.
The importance of the Fc receptors in antibody function in vivo has been recently reviewed 14. Studies using myeloma IgA have implicated both the polymeric Ig receptor (pIgR) and the asialoglycoprotein-binding receptor (ASGR) expressed by the liver in the regulation of serum IgA levels (for reviews, see references 4 and 11). A limited number of studies in humans suggests that pIgR on hepatocytes may not play an important role in regulating the serum IgA levels 2 4. In rats and rabbits, the pIgR on hepatocytes has been shown to bind circulating polymeric IgA and mediate its transport into bile. In mice, the hepatic pIgR is less efficient in IgA clearance from plasma 15. The ASGR expressed by the hepatocytes of various animal species has also been implicated in the clearance of circulating serum IgA 11. However, none of these studies has investigated the contribution of the isotype and allotype differences of IgA to its in vivo metabolism and biodistribution.
With the advances in molecular biology, it is now possible to produce well-characterized IgA proteins differing only in their isotype and allotype. In this study, we have investigated in mice the physiology of IgA proteins of different isotype and allotype with an identical L chain and variable region: all proteins were produced in Sp2/0 cells. Our studies have shown that the ASGR present in the liver rapidly clears all three allotypes of IgA2. There is also some clearance of IgA1 through the ASGR, but this clearance pathway makes only a minor contribution to its serum half-life. The O-linked carbohydrates present in the hinge do not appear to be responsible for the rapid clearance, since hinge-deleted IgA1 was cleared more rapidly than the native molecule. Thus, our results suggest that the N-linked carbohydrates in IgA play an important role in the clearance from blood and uptake by the liver. In addition, our studies show the differences in the clearance of IgA1 and IgA2 and may provide insights into the cause of the altered abundance in different diseased states.
Materials and Methods
Reagents and Cells.
Restriction endonucleases and molecular cloning enzymes were obtained from either New England Biolabs, Inc., Amersham Pharmacia Biotech, Stratagene, or Promega, and were used according to the manufacturers' suggestions. [35S]Methionine was obtained from ICN Research Products. Carrier-free Na125I was purchased from NEN Life Science Products. Iodobeads used for iodination were purchased from Pierce Chemical Co. Sp2/0 and transfectants were cultured in IMDM containing 5% bovine calf serum (BCS; Hyclone Laboratories).
Production of Wild-Type and Carbohydrate Mutants of IgA.
The generation of α1, α2m(1), α2m(2), and α2(n) H chain genes containing a murine VH region specific for the hapten dansyl was described previously 16. The generation of IgA1 lacking the N-linked carbohydrate was described by Chuang and Morrison 17. IgA1 lacking a hinge region was generated by PCR using the α1 gene in the Bluescript+ as a template (Stratagene). The PCR product was generated using the M13 reverse primer and the oligomer 5′-GTCCTCGAGGGGGAACTGGAGTGGAGAGATGG-3′ (the underlined letters indicate the XhoI site). The PCR product was cloned into the TA vector (Invitrogen), and the sequence was confirmed by sequencing. A 737-bp XhoI-SalI fragment was cloned into the wild-type α1.
Cells expressing the desired protein were produced by electroporation into Sp2/0 cells expressing the dansyl-specific chimeric κ L chain gene as described previously 13. Transfectants were selected in medium containing 15 μg/ml hypoxanthine, 250 μg/ml xanthine, and 6 μg/ml mycophenolic acid. Surviving colonies were screened for IgA production by ELISA using microtiter plates coated with dansyl coupled to BSA to capture IgA and an alkaline phosphatase–conjugated goat anti–human κ to detect bound IgA. Color was developed by adding p-nitrophenyl phosphate (Sigma-Aldrich), and the absorbance at 410 nM was determined using a microplate reader (model MR 700; Dynatech). Clones producing the highest quantities of IgA were expanded in IMDM containing 10% (vol/vol) BCS.
Large Scale Cell Culture and Purification of IgA Antibodies.
Transfectomas were cultured in roller bottles (Becton Dickinson) in IMDM supplemented with 1% BCS (Hyclone) and 6 mM Glutamax (GIBCO BRL). Supernatants were filtered to remove any cells and cell debris and supplemented with 10 mM phosphate buffer, pH 6.8, 0.45 M NaCl, 0.02 M EDTA, and 0.02% NaN3. Proteins were purified by affinity chromatography using AH-Sepharose beads coupled with the dansyl isomer 2-dimeth-yl-aminonaphthalene-5-sulfonyl chloride (Molecular Probes). Bound antibodies were eluted with N-(5-carboxy-pentyl)-2-dimethyl-aminonaphthyl-5-sulfonamide. The eluted proteins were concentrated and the hapten was removed by extensive dialysis against Tris buffer, pH 7.8, containing 0.45 M NaCl and 0.02% NaN3. The concentration of proteins was determined with the bicinchoninic acid assay (Pierce Chemical Co.) or by comparison with a standard of known concentration after SDS-PAGE and staining with Coomassie blue.
Radioiodination.
Purified IgA was radiolabeled with carrier-free Na125I (NEN Life Science Products) using Iodobeads (Pierce Chemical Co.). In brief, 100 μCi 125I diluted in 20 μl of phosphate buffer (pH 7.0) was added to prewashed and dried Iodobeads. After 5 min, 25 μg of IgA was added to the tube and the reaction mixture was incubated at room temperature for 20 min. To stop the reaction, the bead was removed and rinsed with 20 μl of phosphate buffer. The iodinated protein solution was passed twice over Sephadex G-10 spin column to remove the free 125I. Under these conditions, the specific activity of the iodinated IgA was between 7 × 10⁵ and 1.2 × 10⁶ cpm/μg. The TCA-precipitable radioactivity for the different IgA preparations varied between 90 and 98%.
Reduction and Alkylation of IgA.
Purified and radiolabeled IgA (5 g) in 0.3 M Tris buffer (pH 8.6) was reduced by slow addition of 0.5 M 1,4-dithiothreitol to a final concentration of 0.05 M. The IgA was kept stirring gently in an ice bath for 30 min. The IgA was alkylated by slow addition of 0.5 M 2-iodoacetamide to a final concentration that is 50% molar excess of the dithiothreitol. The reaction solution was maintained stirring under a gentle stream of nitrogen. After 2 h, the IgA preparation was passed over P6 BioSpin (Bio-Rad Laboratories) column preequilibrated with borate-buffered saline (pH 8.0).
Analysis of IgA Proteins.
Purified proteins were analyzed by SDS-PAGE under nonreducing conditions in 5% phosphate gels to determine the covalent assembly pattern, and under reducing conditions in 12.5% Tris-glycine gels to determine the molecular weight of the H, L, and J chains. The size of IgA in each preparation reflecting both the covalent and noncovalent interactions was determined with 2–16% polyacrylamide gradient slab gels (PAA 2/16; Amersham Pharmacia Biotech), prerun for 30 min at 125 V with 0.09 M Tris, 0.08 M boric acid, 0.003 M EDTA, pH 8.35. The samples for analysis were diluted by adding a 40% sucrose solution in a volume equal to one quarter of the sample volume, and were loaded in every other slot. After electrophoresis at 70 V for 20 min, electrophoresis continued for a total of 1,800 V-h. The gel was then fixed in 10% sulfosalicylic acid for 10 min and stained in 0.1% Coomassie blue R-250 (Bio-Rad Laboratories) in 25% methanol, 10% acetic acid solution and destained by diffusion in 5% acetic acid, 20% methanol solution. Each gel was sliced vertically into channels, and each channel was cut into 2-mm slices that were analyzed for radioactivity.
Animal Experiments.
Female 2–3-mo-old C57BL/6J mice (16–20 g) were purchased from The Jackson Laboratory. Pairs of mice with homozygous disruption of ASGR2 (B6,129-ASGR2) were bred in house. All of the animal experiments were carried out in accordance with approved institutional guidelines (Animal Welfare Assurance No. 39222) at the Department of Pathology, Rhode Island Hospital, Brown University. Radioiodinated IgA (1 μg) diluted in 0.2 ml of PBS containing 0.2% HSA (Baxter) was injected into the tail vein. Blood samples of 20 μl obtained with heparin-treated micropipettes from the retroorbital venous plexus at different time intervals were expelled into 0.5 ml PBS in 12 × 75-mm glass tubes. An equal volume of 20% TCA was added and after overnight incubation at 4°C, the tubes were centrifuged at 2,000 g for 30 min. The TCA pellet and supernatant were counted separately in a gamma counter (1260-Multigamma II; LKB). The values of TCA-precipitable radioactivity remaining in the blood were used to derive the clearance curves; the zero time value was extrapolated from the first three data points (1, 2.5, and 5 min) by linear regression analysis. The means and standard deviations were calculated for each time point, plotted, and analyzed by graphic peeling 18. The elimination rate constant (K el) was derived from the slope of the curve (slope = K el/2.303), which was calculated by regression analysis in a worksheet program (Analytical Tools, Microsoft Excel, Microsoft Office 97). The half-life (t 1/2) of circulating IgA was determined from the expression, t 1/2 = 0.693/K el.
In the blocking studies, 1 mg of galactose-Ficoll 19 was mixed with 1 μg of IgA. The mixture was introduced into the tail vein, and the blood samples were collected and measured as described 20.
The organ distribution of the IgA was determined 10 and 60 min after injection of radioactive protein. The mice were anesthetized with pentobarbital followed immediately by incision of the thoracic cavity. The heart, kidneys, liver, and lungs were rendered free of blood by perfusion of 10 ml of saline through the left ventricle. All of the excised organs and tissues were weighed before measurement of radioactivity. The amount of radioactivity within each organ was determined in an LKB gamma scintillator, and the values were expressed as a percentage of the total amount administered or as a percentage of the dose per gram of tissue.
Data Analysis.
Student's t test or analysis of variance was used to determine statistical significance of differences between mean results in control and experimental groups.
Results
Characterization of Recombinant IgA Antibodies.
The production of the transfectants secreting IgA1, IgA2m(1), IgA2m(2), and IgA2m(n) was described previously 16. When the transfectants were cultured in medium containing [35S]methionine for 16 h, the secreted IgA was immunoprecipitated and analyzed by SDS-PAGE under nonreducing conditions. IgA1 and IgA(n) showed two predominant bands corresponding to the dimeric (dIgA) and monomeric (mIgA) forms of IgA and minor bands corresponding to HL and dIgA lacking L chains (data not shown). As reported previously, IgA2m(1) was present mostly as L, L2, H2, and H4J molecules lacking HL disulfide bonds. IgA2m(2) showed multiple bands corresponding to free H and L chains and H2L as well as mIgA and dIgA. When the proteins were analyzed by SDS-PAGE in 12.5% gels under reducing conditions, all contained α H chains, κ L chain, and J chain (data not shown).
Although in most laboratory animals, serum IgA exists predominantly as covalent polymers, >90% of human serum IgA is monomer 12. However, monomeric human serum IgA has been shown to form polymers (mainly dimer and smaller amounts of trimer and tetramers) held together by noncovalent interactions that can be disrupted by SDS. To determine the molecular form of the anti-dansyl IgA under nondenaturing conditions, the affinity-purified proteins were radioiodinated and analyzed in native 2–16% polyacrylamide gradient gels. Dimeric IgA was the predominant molecular form (51–75%) in all of the preparations (Fig. 1 and Table ). Only IgA2m(2) had a significant amount (34%) of a polymeric form larger than a dimer. IgA1 and IgA2m(1) had a significant and similar amount (25%) of the monomeric form.
Figure 1.

Analysis of IgA1, IgA2m(1), IgA2m(2), and IgA2(n) by native gradient PAGE. To determine the monomer, dimer, and polymer composition of IgA proteins, proteins were analyzed on 2–16% native polyacrylamide slab gels in the absence of any denaturant. An autoradiogram of each IgA preparation shows the distribution of radioactivity in the gel channel. For quantitative analysis, the gel channels were sliced and counted as described in Materials and Methods. Monomeric IgA migrates furthest and localizes toward the bottom of the gel between 60 and 80% of the gel length. IgA dimer migrates and localizes between 35 and 50% of the gel length.
Table 1.
Percentage of Molecular Forms in the Native and Reduced and Alkylated IgA Proteins
| Native | Reduced and alkylated | |||||||
|---|---|---|---|---|---|---|---|---|
| Molecular form | IgA1 | IgA2m(1) | IgA2m(2) | IgA2m(n) | IgA1 | IgA2m(1) | IgA2m(2) | IgA2m(n) |
| pIgA | 10.5 | 7 | 34 | 18.3 | – | – | – | – |
| dIgA | 61 | 68.5 | 51.2 | 75 | 29 | 68 | 38 | 24 |
| mIgA | 25 | 22.5 | 12.7 | 5.6 | 61 | 27 | 59 | 51 |
Native and reduced and alkylated IgA proteins were analyzed by PAGE in 2–16% native gradient gels and analyzed by autoradiography.
Blood Clearance of IgA1 and IgA2 Antibodies.
To determine whether isotypic and allotypic differences influence the in vivo survival of IgA, we studied the blood clearance of 1 μg of 125I-labeled IgA1 or IgA2 injected into the tail vein of C57BL/6 mice. At timed intervals after injection, blood was collected from the retroorbital plexus and the TCA-precipitable counts remaining in circulation were determined. Although both IgA1 and IgA2 cleared rapidly, IgA2 was eliminated more rapidly from the circulation than IgA1 (Fig. 2). Half of the IgA1 was removed from the blood in ∼35 min. In contrast, half of IgA2m(1), IgA2m(2), and IgA2m(n) was removed in 5, 4, and 3 min, respectively.
Figure 2.

Kinetics of 60-min serum clearance of anti-dansyl IgA1, IgA2m(1), IgA2m(2), and IgA2(n) in C57BL/6 mice. 1 μg of each of the 125I-labeled proteins was injected into the tail vein. At indicated times after injection, aliquots of blood obtained from the retroorbital venous plexus were precipitated with 10% TCA to determine protein-bound radioactivity. The first three data points were used to extrapolate the 100% value at zero time point using linear regression analysis. Each data point represents the mean ± SD of three mice. Data are representative of multiple experiments performed using different preparations of IgA containing varying ratios of polymer to monomer. The superimposed dotted gridlines highlight the time (t 50%) required for the disappearance of 50% of the administered dose.
Tissue Distribution of IgA1 and IgA2.
To assess the fate of the circulating IgA, the tissue distribution of radioactivity was examined at 10 and 60 min after intravenous administration (Table ). At 10 min after injection, the liver was the principal organ mediating IgA removal from the circulation. At that time, 10% of the IgA1 and ∼30% of IgA2m(1) and IgA2m(2) and 41% of IgA2(n) were found per gram of liver. At 60 min after injection, the amount of IgA1 in the liver remained relatively constant, whereas the amount of IgA2 decreased to 15–18% per gram of liver. These results are consistent with the kinetics of IgA1 and IgA2 disappearance from the blood and suggest that IgA2 is rapidly removed and degraded by the liver. By 60 min, ∼12% of IgA2 and 2.5% of IgA1 were found per gram of gastrointestinal tract. The increase in radioactivity in the gastrointestinal tract correlates with an increase in the TCA-soluble radioactivity in the blood, suggesting that the radioactivity found in the gastrointestinal tract may represent the excretion of the degraded products.
Table 2.
Distribution of IgA in Tissues 10 and 60 min after Injection
| IgA1 | IgA2m(1) | IgA2m(2) | IgA2m(n) | |||||
|---|---|---|---|---|---|---|---|---|
| Tissue | 10 min | 60 min | 10 min | 60 min | 10 min | 60 min | 10 min | 60 min |
| Gastrointestinal | 0.9 ± 0.1 | 2.4 ± 1.4 | 0.6 ± 0.1 | 11.8 ± 1.4 | 1.5 ± 0.6 | 11.5 ± 4.4 | 0.6 ± 0.1 | 13.1 ± 2.9 |
| Heart | 1.8 ± 0.9 | 1.1 ± 0.6 | 0.7 ± 0.1 | 1.2 ± 0.3 | 0.7 ± 0.1 | 0.9 ± 0.3 | 0.6 ± 0.0 | 1.1 ± 0.2 |
| Kidney | 5.5 ± 0.6 | 4.9 ± 0.1 | 4.1 ± 0.9 | 5.3 ± 1.8 | 6.6 ± 1.3 | 8.4 ± 1.4 | 2.8 ± 0.6 | 4.9 ± 2.8 |
| Liver | 9.7 ± 0.1 | 8.7 ± 0.2 | 31.6 ± 2.7 | 17.9 ± 3.2 | 38.8 ± 3.4 | 15.0 ± 2.8 | 39.6 ± 2.8 | 17.0 ± 2.3 |
| Lungs | 2.0 ± 1.0 | 2.0 ± 0.4 | 1.0 ± 0.2 | 1.6 ± 0.4 | 1.0 ± 0.2 | 1.5 ± 0.1 | 1.3 ± 0.3 | 1.1 ± 0.8 |
| Spleen | 4.1 ± 0.6 | 4.0 ± 0.9 | 1.2 ± 1.3 | 2.4 ± 1.1 | 1.6 ± 0.4 | 2.8 ± 0.6 | 2.8 ± 0.3 | 2.1 ± 0.7 |
Data represent percentage of administered dose per gram of tissue. Each value is the mean ± SD for a group of three mice.
Influence of IgA Size on Clearance.
Dimeric but not monomeric IgA is removed from circulation through binding to the pIgR on rodent hepatocytes 4 11 15. Since IgA preparations used in these studies contained different amounts of dimers and monomers, the clearance of native monomers and dimers was characterized 21. Sequential plasma specimens obtained at 1, 5, 10, and 30 min, 1, 2, 4, 8, and 24 h after injection of iodinated IgA1 were analyzed by gradient PAGE (Fig. 3A and Fig. B). The radioactivity in the bands was quantified by cutting the bands and counting, and the percentage of the radioactivity remaining in the circulation was plotted against time (Fig. 3 C). Dimeric IgA1 was cleared more rapidly than monomeric IgA. Because only single point measurements were used for these clearance curves, statistical analysis of the components was not conducted. Clearance of the dimer was biphasic, with an initial rapid phase in which 69% of IgA1 was cleared with an estimated half-life (t 1/2) of 8.3 min and a slow phase in which 31% of IgA1 was cleared with a t 1/2 of 3.6 h. A similar initial phase was observed for monomeric IgA1, with 67% removed with a t 1/2 of 98 min; the rate of monomer clearance in the second phase was much slower, with 33% removed with a t 1/2 of 22.8 h.
Figure 3.
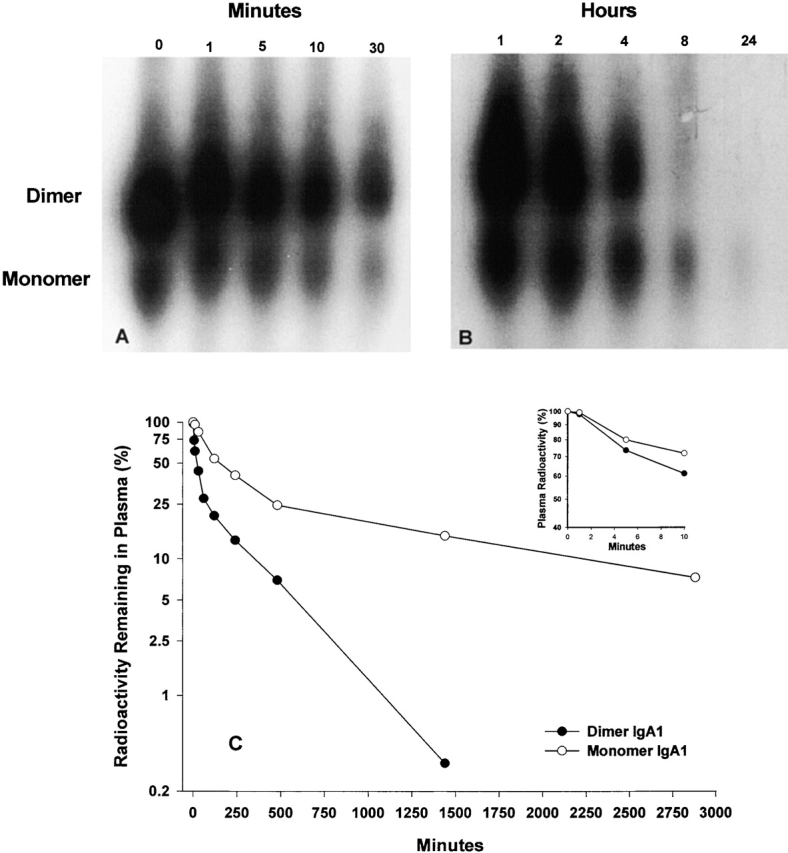
Analysis by electrophoresis in native gradient polyacrylamide gels (2–16%) of the disappearance from the circulation of monomeric and dimeric IgA1. Purified IgA1 (0 min) and plasma samples obtained during the first 30 min after injection (A) or 1 and 24 h after injection (B) were fractionated on native gradient gels and analyzed by autoradiography (exposures: [A] 36 h; [B] 7 d). (C) Clearance of dimeric and monomeric IgA determined by the measurement of the radioactivity present in plasma that localized at 35–50% (dimer) or 60–80% (monomer) of the gel length.
To further investigate the influence of size on IgA clearance, radiolabeled IgA1 and IgA2 preparations were mildly reduced and alkylated to enrich for monomeric forms. As presented in Table , the amount of monomer in the reduced and alkylated IgA preparations, determined by electrophoresis in 2–16% gels, was as follows: 62% for IgA1, 28% for IgA2m(1), 59% for IgA2m(2), and 51% for IgA2(n). Only the IgA2m(1) failed to be enriched for monomeric IgA. The reduced-alkylated IgA preparations were injected into C57BL/6 mice, and the clearance was monitored (Fig. 4 A). Enrichment for monomeric IgA did not significantly slow the clearance rate or alter the clearance patterns (compare Fig. 2 and Fig. 4 A). If anything, enrichment for monomers increased the hepatic clearance of IgA2 (compare Table and Fig. 4 B). These results indicate that the removal of IgA2 from the circulation is not determined by its polymerization state and suggest that the pIgR does not play a primary role in the clearance of human IgA2 in mice.
Figure 4.
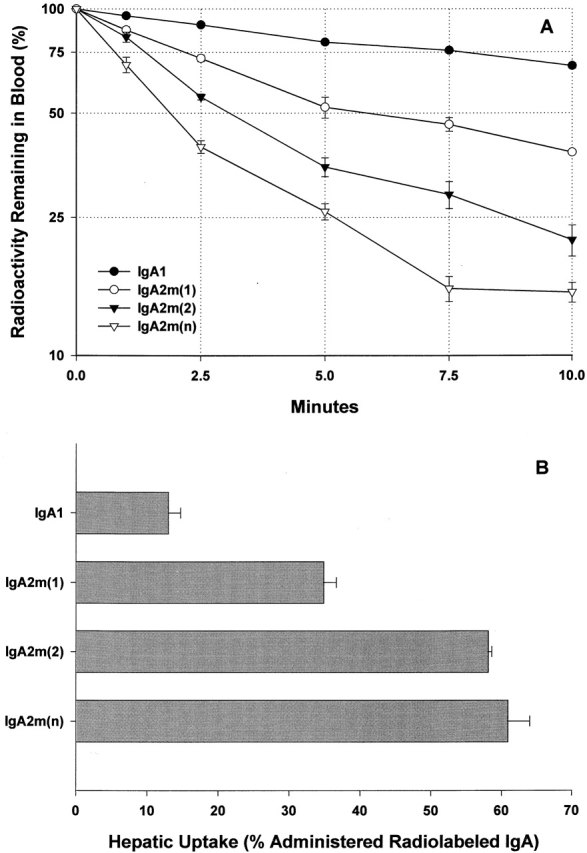
Clearance and hepatic uptake of mildly reduced and alkylated IgA. (A) Clearance from the circulation of 1 μg of mildly reduced and alkylated IgA1, IgA2m(1), IgA2m(2), and IgA2(n). The IgA remaining in blood was determined as described in the legend to Fig. 3. Each data point is the mean ± SD for three normal mice. The superimposed dotted gridlines highlight the time (t 50%) required for the disappearance of 50% of the administered dose. (B) Hepatic uptake represented as the percentage of the injected dose of radioactivity measured in the blood-free liver at 10 min.
Role of the ASGR in IgA Elimination.
To elucidate the mechanisms that mediate the rapid clearance from the circulation and the rapid hepatic uptake of the IgA2 allotypes, we examined the potential role of the liver ASGR. In a series of experiments, we determined the kinetics of clearance of 1 μg of IgA in the presence of excess (1 mg) of the specific ASGR ligand, galactose-Ficoll (Fig. 5). The presence of galactose-Ficoll as a receptor competitor did not significantly affect the clearance of IgA1, but it did drastically prolong the clearance of all three IgA2 allotypes. To confirm the role of ASGR in mediating the elimination of circulating IgA2, the clearance of IgA1 and IgA2 allotypes in ASGR knockout mice (ASGR−/−) was determined (Fig. 5). The elimination patterns of the IgA2 allotypes in ASGR−/− were indistinguishable from the clearance curves in the presence galactose-Ficoll. Interestingly, blocking or inactivating the ASGR resulted in elimination of all three IgA2 allotypes in a pattern similar to IgA1.
Figure 5.

Clearance from the serum of IgA1, IgA2m(1), IgA2m(2), and IgA2(n) in ASGR−/− knockout mice and in wild-type (WT) mice in the presence and absence of the ASGR ligand galactose-Ficoll. Trace amounts of radiolabeled IgA (1 μg) were injected into the tail vein of mice and at the indicated time points, the IgA remaining in blood was determined as described in the legend to Fig. 3. To inhibit ASGR uptake in wild-type mice, 1 mg of galactose-Ficoll was simultaneously administered with the radiolabeled IgA.
The hepatic uptake data at 10 min (Fig. 6) confirmed a role for the ASGR in the clearance of IgA. Galactose-Ficoll significantly (P = 0.0028) reduced the hepatic uptake of IgA1 (from 10 to 7.8% of administered dose) in C57BL/6 mice. Galactose-Ficoll had an even more dramatic effect on hepatic uptake of all three IgA2 allotypes. Similar decreased hepatic uptake of all three IgA2 allotypes was also observed in ASGR−/− mice. Thus, both blocking and inactivating the receptor demonstrate that the hepatic ASGR plays a major role in the rapid elimination of human IgA2 from the circulation.
Figure 6.

Hepatic uptake of IgA2 in the presence of a saturating dose of galactose-Ficoll in wild-type mice (WT) and in ASGR−/− mice. The hepatic content of radioactivity 10 min after injection is shown as the percentage of injected dose in blood-free liver. Each bar represents the mean ± SD of three mice.
Influence of the ASGR on the Catabolism of IgA2.
To further explore the role of the ASGR in the catabolism of IgA2, the 24-h clearance of IgA2m(1) and IgA2m(2) in wild-type and ASGR−/− mice was compared. The 24-h disappearance curves for IgA2m(1), Fig. 7 A, were composed of three exponential components, as determined by graphic peeling in conjunction with linear regression analysis. There is a significant difference (P = 0.0016) in the amount of IgA2m(1) removed from circulation in the first rapid phase, with 43.7 ± 5.1% rapidly removed in wild-type compared with 16.8 ± 2.1% in ASGR−/− mice. In the second intermediate phase, there was no significant difference between the amount of IgA2m(1) in wild-type (39.0 ± 4.0%) and ASGR−/− (37.0 ± 2.5%) mice. The decrease in the amount of IgA2m(1) removal in the first phase in the ASGR−/− mice is accompanied by an increase in the amount slowly metabolized in the terminal phase (from 17.4 ± 1.2% in wild-type to 46.3 ± 2.7% in ASGR−/− mice; P = 0.0004). Interestingly, during this phase a similar rate of clearance was seen in the ASGR−/− and wild-type mice (9.6 ± 0.2 h in wild-type vs. 10.5 ± 0.8 h in ASGR−/−). The rapid increase of TCA-soluble radioactivity during the first 4 h (Fig. 7 A, insert) seen in the wild-type mice but not in ASGR−/− mice during this period is consistent with the elimination pattern.
Figure 7.
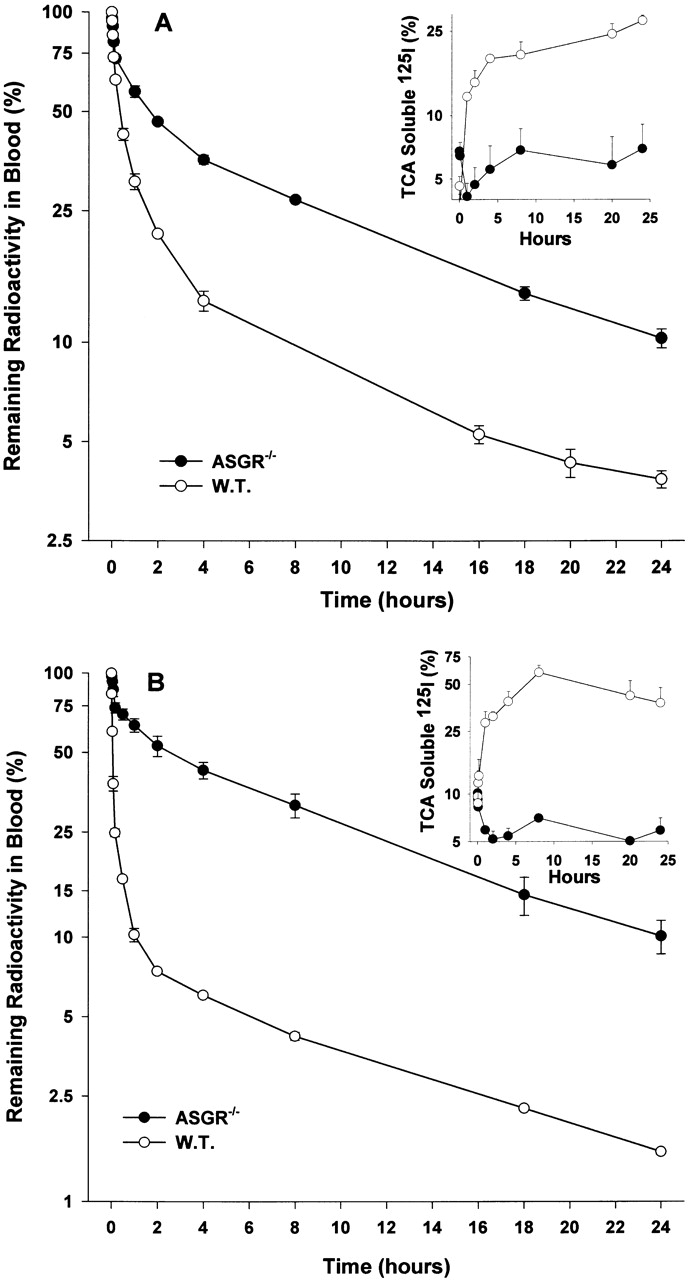
Comparison of kinetics of serum clearance of IgA2m(1) and IgA2m(2) in C57BL/6 (W.T.) and ASGR−/− knockout mice. Radiolabeled IgA2m(1) (A) or IgA2m(2) (B) was injected into the tail vein of C57BL/6 or ASGR−/− knockout mice. At the indicated time points, the IgA remaining in the blood was determined as described in the legend to Fig. 3. The amount of TCA-soluble material present in the blood at the different times is shown in the insert. Each data point represents the mean ± SD of three mice.
A significant (P < 0.0001) difference was also seen in the clearance of IgA2m(2) in wild-type and ASGR−/− mice. In wild-type mice, the majority of the IgAm(2) (84.5 ± 1.3%) was eliminated from the circulation with a t 1/2 = 3.0 ± 0.2 min (Fig. 7 B), whereas in ASGR−/− mice only 26.9 ± 4.5% was rapidly removed with a t 1/2 = 5.3 ± 2.5 min. Similar to what was observed with IgA2m(1), in ASGR−/− mice there was a significant increase (P < 0.0001) in amount of IgA clearing slowly in the terminal phase (from 7.3 ± 0.1 to 63.7 ± 4.9%). Again, a similar rate of elimination during this phase was observed in wild-type (t 1/2 = 9.5 ± 0.1 h) and ASGR−/− (t 1/2 = 9.2 ± 0.5 h) mice. The high rate of uptake and catabolism of IgA2m(2) in wild-type mice during the initial phase is accompanied by a dramatic increase in TCA-soluble material, reaching 60% of the radioactivity in the blood sample at 8 h (Fig. 7 B, insert). In contrast, there was little change in the amount of TCA-soluble radioactivity in the blood samples of the ASGR−/− mice. These data suggest two pathways for IgA2 clearance: the first pathway is dependent on the ASGR and leads to rapid hepatic uptake and degradation; the second pathway is independent of the ASGR.
Role of Glycosylation in IgA1 Clearance.
IgA1 contains two N-linked glycosylation sites at positions Asn263 in CH2 and Asn459 in CH3 and five O-linked glycosylation sites in the hinge region. Indeed, the terminal galactosyl-(β1–3)-N-acetylgalactosamine residues present on the O-linked sugars have been proposed as a ligand for the ASGR.
To determine the role of the O-linked carbohydrate moieties in IgA1 clearance, the 24-h clearance of IgA1 lacking the hinge region (IgA1-δHinge) was determined. Surprisingly, the clearance of IgA1-δHinge was significantly (P = 0.0006) more rapid than the clearance of IgA1, with 51.8 ± 1.4% of IgA1-δHinge cleared in the initial rapid phase with a t 1/2 = 6.1 ± 1.7 min (Fig. 8) compared with 36.2 ± 2.3% of IgA1. The rapid elimination of IgA1-δHinge was accompanied by the generation of circulating TCA-soluble radioactivity (Fig. 8, insert). As a consequence of the initial rapid elimination, significantly less (P < 0.0001, 24.2 ± 0.6%) of the IgA1-δHinge was eliminated during the terminal phase than IgA1 (32.7 ± 4.6%). During this phase, the IgA1-δHinge was also catabolized significantly (P = 0.0035) faster (t 1/2 = 10.3 ± 0.6 h) than IgA1 (t 1/2 = 14.5 ± 1.4 h).
Figure 8.
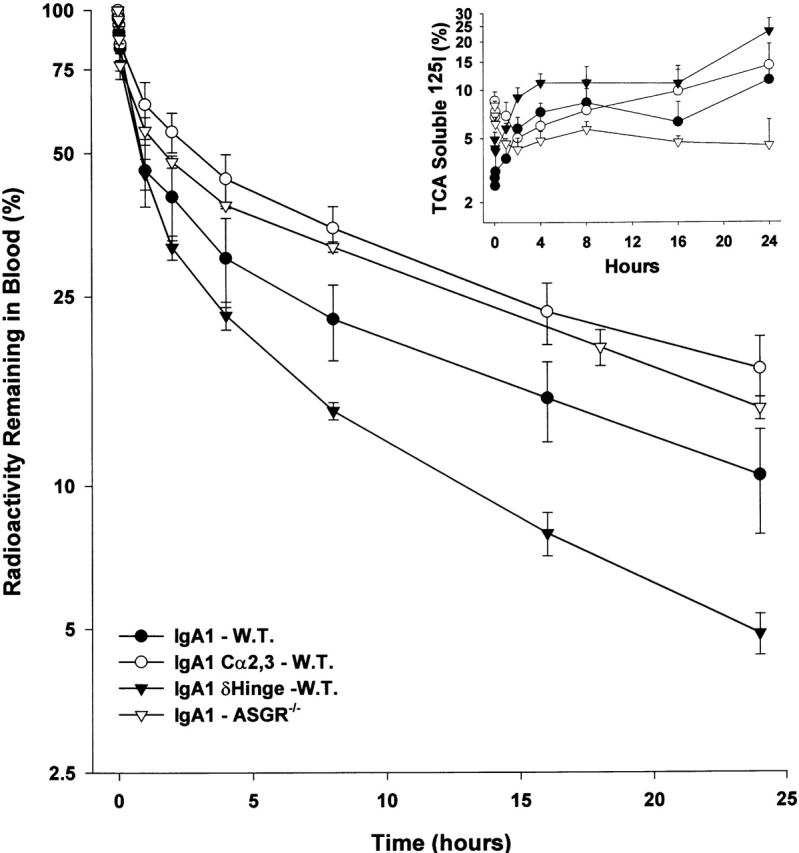
Influence of glycosylation on the blood removal and catabolism of IgA1. The clearance in wild-type mice (W.T.) of intact IgA1, IgA1 lacking N-linked glycosylation (IgA1-Cα2,3), and IgA1 lacking the hinge with its associated O-linked oligosaccharides is compared with the clearance of intact IgA1 in ASGR−/− mice. The appearance of TCA-soluble material (percentage of sample) radioactivity in the blood is shown in the insert.
To determine if N-linked glycosylation plays a role in the overall clearance of IgA1, the 24-h clearance of IgA1 lacking the N-linked carbohydrates (IgA1-Cα2,3) was determined. Only 22.4 ± 8.6% of IgA1-Cα2,3 was cleared in the initial rapid phase compared with 36.2 ± 2.3% of IgA1 in wild-type mice and 32.8 ± 4.4% in ASGR−/− mice. The amount of IgA1-Cα2,3 (48.1 ± 4.8%) clearing during the terminal phase was similar to the amount of IgA1 clearing during the terminal phase in ASGR−/− (48.1 ± 0.6%) mice. During the terminal phase, IgA1-Cα2,3 (t 1/2 = 16.2 ± 2.0 h) and IgA1 in both wild-type (t 1/2 = 14.5 ± 1.4 h) and ASGR−/− mice (t 1/2 = 13.5 ± 0.7 h) were catabolized at similar rates. The elimination pattern of the IgA1-Cα2,3 in wild-type mice was similar to that of IgA1 in ASGR−/− mice. Taken together, these results suggest that the ASGR may contribute to the rapid elimination of a portion of IgA1 through the N-linked carbohydrate residues. More importantly, the ASGR does not recognize the O-linked galactosyl residues in the IgA1 hinge region.
Discussion
Human serum is 90% IgA1 and 10% IgA2 11 12. However, in external secretions the proportion of IgA2 can be as high as 50%. This characteristic distribution may reflect the fact that plasma cells in the bone marrow are the source of serum IgA1 and plasma cells in the lamina propria are the source of secreted IgA 22. A difference in the serum half-life of different forms of IgA could also contribute to these differences. Although several investigators have studied the half-life of human IgA1, there are no studies comparing the clearance kinetics of IgA1 and IgA2. Here, we have compared the kinetics and pathways of clearance of well-characterized IgA proteins of different isotypes and allotypes that share an identical L chain and variable region and are produced in the same Sp2/0 cells.
Our data demonstrate that all allotypes of IgA2 cleared from blood of mice faster than IgA1. We found that IgA1 purified from human serum exhibited a rate and pattern of clearance similar to those seen with recombinant IgA1 (data not shown). Hence, the slower rate of clearance of IgA1 is not a result of either the chimeric structure of the IgA1 or the expression system used for its production. Our results are contrary to in vitro studies demonstrating higher binding of IgA1 than IgA2 to liver parenchymal and nonparenchymal cells 23 24. As expected from previous experimental and clinical studies 21 25 26, we found that the dimeric form of IgA1 cleared more rapidly than the monomeric form (Fig. 3). However, enrichment of the monomeric molecular form of IgA2 by mild reduction and alkylation did not slow the rate of clearance (Fig. 4). Therefore, the polymerization state of IgA2 is not the major determinant of its rapid clearance.
We have found that injection of excess galactose-Ficoll, a specific ASGR ligand 20 27, had little effect on the clearance of IgA1 but sharply decreased the clearance rate of all three IgA2 allotypes. Our results are in contrast to in vitro studies that reported the binding of human IgA1 but not IgA2 to the ASGR on hepatocytes 23 24. Therefore, we also studied IgA clearance in mice with ASGR deficiency due to disruption of the hepatic lectin 2 subunit of the ASGR 28 29. We confirmed that these mice are unable to eliminate radiolabeled asialoorosomucoid (data not shown). Similar to what we had observed after injection of galactose-Ficoll, the rate of IgA2 elimination in ASGR−/− mice resembled that of IgA1 (Fig. 5). The decreased hepatic uptake of the IgA2 in the presence of galactose-Ficoll in wild-type mice and in the ASGR−/− mice (Fig. 6) confirmed an essential role for ASGR in mediating the rapid elimination and hepatic uptake of IgA2. These experimental findings may explain the clinical observations that the impairment of ASGR function in liver cirrhosis and ALD 30 31 32 may result in increased levels of serum IgA2 2 3 7.
Examination of the 24-h clearance patterns of IgA2m(1) and IgA2m(2) in wild-type and ASGR−/− mice (Fig. 7) suggests that the ASGR affects only the initial phase of elimination. IgA2 surviving the initial rapid elimination is catabolized at the same rate (t 1/2 = 9.5 vs. 10 h) in wild-type and ASGR−/− mice. The cause and nature of this slow exponential phase are unknown. Gel analysis and autoradiography of plasma samples obtained during the first 60 min (data not shown) indicated similar rapid elimination of both dimeric and monomeric IgA2. Furthermore, monomer-rich IgA2 preparations were eliminated faster, with a higher percentage of hepatic uptake than the polymer-rich preparation (Fig. 4). Instead, it may be that a portion of the IgA2 did not have an exposed galactose residue and it is this IgA2 that clears more slowly. Thus, there are two pathways for the catabolism of IgA2: one through rapid hepatic uptake by the ASGR, and a second, slower ASGR-independent pathway. These experimental findings have important clinical implications. Among liver diseases, hepatic cirrhosis is closely linked to ASGR impairment 4 8 31, and alterations in IgA metabolism may explain the shift in the ratio of serum IgA1 to IgA2 seen in the majority of alcoholics 5 6 7.
In patients with IgAN, the most common form of glomerulonephritis worldwide, altered IgA1 O-linked glycosylation has been implicated as the cause of mesangial IgA1 deposition 33 34. It is postulated that such alteration would lead to anomalous handling of IgA1 in IgAN, including the failure of normal clearance mechanisms and mesangial deposition 9 10. Contrary to this postulate, we have found that IgA1 lacking the hinge, the site of O-linked glycosylation, not only failed to clear more slowly but instead cleared significantly faster than wild-type IgA1 in C57BL/6 mice (Fig. 8). These data would suggest that the O-glycosylation normally present on IgA1 is not responsible for rapid clearance. Indeed, the more rapid clearance of IgA1-δHinge suggests that the absence of the hinge region leads to structural changes that influence catabolism. Hepatic uptake of IgA1 lacking O-linked glycosylation at 10 min was only 10% (data not shown), a level that is similar to the original IgA1 molecule. Furthermore, the hinge deletion affected largely the slow terminal phase by significantly (P = 0.0035) increasing the IgA1 catabolic rate (t 1/2 = 10.3 ± 0.6 h). Interestingly, this catabolic rate is similar to that of IgA2 (t 1/2 = 9.5 ± 0.1 h), which naturally lacks 13 amino acids in the hinge region. Collectively, these turnover results are consistent with the clinical observations of Morell et al. 25 showing that human IgA2 catabolic rate (t 1/2 = 4.5 d) is higher than IgA1 (t 1/2 = 5.9 d).
In our studies, the ASGR appeared to play a relatively minor, but not insignificant, role in the clearance of IgA1. First, IgA1 lacking the N-linked glycosylation (IgA1-Cα2,3) cleared significantly (P = 0.05) less (63% remaining in circulation) than the unaltered IgA1 (46%) in the first hour from the blood of wild-type C57BL/6 mice. Similarly, the 1-h clearance value (58%) of IgA1 in ASGR−/− mice was less than in wild-type mice. Second, measurement of hepatic uptake at 10 min, before any degradation, revealed significantly (P = 0.0010) less IgA1-Cα2,3 (5% of administered dose) than IgA1 (10%) taken up by the liver of wild-type mice. This is especially significant because the IgA1-Cα2,3 lacking the N-linked glycosylation consists predominantly of dimers and higher polymers and therefore may be expected to be removed faster with higher liver uptake than wild-type IgA1 17. Third, hepatic uptake of IgA1 at 10 min in ASGR−/− mice (7%) was significantly (P < 0.002) less than wild-type C57BL/6 mice. Thus, it is possible that the influence of N-linked glycosylation on clearance and hepatic uptake of IgA1 may have been minimized or masked by the greater role of other receptor-mediated removal systems in the mouse liver such as the pIgR. Unlike humans, some species such as the rat and rabbit rapidly eliminate their polymeric IgA by hepatobiliary transport through the pIgR (for a review, see reference 4). Although the mouse eliminates a significant portion (34%) of serum polymeric IgA through the pIgR hepatobiliary transport system, the kinetics (8 h) of such elimination is fairly prolonged and 10 times less efficient than the rat 15. Studies by Schiff et al. 35 demonstrated that human IgA may act as a heterovalent ligand that binds to both the ASGR and pIgR of rat hepatocytes. Our data, demonstrating slow elimination and low hepatic uptake of IgA1-Cα2,3 in wild-type mice in a pattern similar to IgA1 in ASGR−/− mice, are consistent with the synergistic action of ASGR and pIgR in removing IgA from the circulation of mice. Importantly, the use of two different cooperative receptors for IgA removal from the circulation observed in rodents may not be extrapolated to humans due to the lack of the pIgR on human hepatocytes.
Our results clearly indicate that the N-linked carbohydrate residues are important for clearance from the blood by the ASGR. Since both IgA1 and IgA2 contain N-linked carbohydrate, the question remains as to why the majority of the IgA2 but only a small portion of IgA1 is rapidly removed by the ASGR. It is possible that IgA2 binds the ASGR with a higher affinity than IgA1 as a consequence of the presence of two additional N-linked glycosylation sites (Asn166 and Asn337 in CH1 and CH2, respectively) on all IgA2 allotypes. It is also possible that the N-linked carbohydrates attached to IgA2 differ in structure from that attached to IgA1 and therefore are bound more strongly by the ASGR. Studies to determine the role of the Asn166 and Asn337 N-linked glycosylation sites in clearance are in progress.
Structural analysis of the N-glycans from human IgA1 revealed three major N-linked disialylated biantennary complex–type structures 36 37. Only a minor amount (7%) of the N-linked oligosaccharides is triantennary, with an outer branch substituted with fucose α1–3. Of all the carbohydrate structures, it is well established that tetraantennary oligosaccharides, found in asialoorosomucoid, have the highest binding affinity to the ASGR 38. Thus, the lower affinity of the biantennary complex–type structure and highly sialylated N-glycans on IgA1 may account for its slow removal from the circulation by the ASGR. Microheterogeneity of carbohydrate structure may also explain why a small percentage of IgA1 is rapidly cleared. In addition, unlike IgG in which the N-linked carbohydrates are buried between the H chains, the N-linked carbohydrates in IgA1 are exposed to the outside 39. Therefore, the N-linked carbohydrates would be expected to be exposed on the surface and available for recognition by the ASGR 40. The additional N-linked carbohydrate structures present on IgA2 may be available in combination to bind the ASGR, resulting in an increase in the avidity of the IgA2 for the ASGR.
In summary, our results suggest that human IgA1 and IgA2 isotypes behave differently in the circulation. For the first time, we have demonstrated that IgA2 allotypes are rapidly eliminated from the circulation and taken up by the ASGR expressed on the hepatocytes. At the molecular level, the N-linked glycans on IgA play an important role in binding to the ASGR. The increased number of N-linked glycans on IgA2 may contribute to its rapid elimination from the circulation, leading to the characteristic distribution of IgA isotypes observed in humans. These results suggest that abnormal ASGR-mediated clearance and metabolism of IgA in alcoholic liver cirrhosis disease may lead to enhanced deposition of IgA in liver and kidneys.
Acknowledgments
This work was supported by National Institutes of Health Fellowship AI08994 to K.R. Chintalacharuvu, and by National Institutes of Health grants AI29470 and AI39187 to S.L. Morrison and DK49361 to A. Rifai.
Footnotes
Abbreviations used in this paper: ASGR, asialoglycoprotein-binding receptor; ALD, alcoholic liver disease; BCS, bovine calf serum; IgAN, IgA nephropathy; pIgR, polymeric Ig receptor.
References
- Kalsi J., Delacroix D.L., Hodgson H.J.F. IgA in alcoholic cirrhosis. Clin. Exp. Immunol. 1983;52:499–504. [PMC free article] [PubMed] [Google Scholar]
- Delacroix D.L., Elkon K.B., Geubel A.P., Hodgson H.F., Dive C. Change in size, subclass, and metabolic properties of serum immunoglobulin A in liver diseases and in other diseases with high serum immunoglobulin A. J. Clin. Invest. 1983;71:358–367. doi: 10.1172/JCI110777. [DOI] [PMC free article] [PubMed] [Google Scholar]
- van de Wiel A., van Hattum J., Schuurman H. J., Kater L. Immunoglobulin A in the diagnosis of alcoholic liver disease. Gastroenterology. 1988;94:457–462. doi: 10.1016/0016-5085(88)90437-4. [DOI] [PubMed] [Google Scholar]
- Brown W.R., Kloppel T. M. The liver and IgAimmunological, cell biological and clinical implications. Hepatology. 1989;9:763–783. doi: 10.1002/hep.1840090518. [DOI] [PubMed] [Google Scholar]
- Swerdlow M.A., Chowdhury L.N. IgA subclasses in liver tissues in alcoholic liver disease. Am. J. Clin. Pathol. 1983;80:283–289. doi: 10.1093/ajcp/80.3.283. [DOI] [PubMed] [Google Scholar]
- van de Wiel A., Delacroix D.L., van Hattum J., Schuurman H.J., Kater L. Characteristics of serum IgA and liver IgA deposits in alcoholic liver disease. Hepatology. 1987;7:95–99. doi: 10.1002/hep.1840070120. [DOI] [PubMed] [Google Scholar]
- Meillet D., Labrousse F., Benoit M.O., Hernvann A., Musset L., van Amerongen G. Increased serum concentration of IgA2 subclass and IgA2/IgA1 ratiospecific markers of chronic alcoholic abuse? Eur. J. Clin. Chem. Clin. Biochem. 1997;35:275–279. doi: 10.1515/cclm.1997.35.4.275. [DOI] [PubMed] [Google Scholar]
- Roccatello D., Picciotto G., Torchio M., Ropolo R., Ferro M., Franceschini R., Quattrocchio G., Cacace G., Coppo R., Sena L.M. Removal systems of immunoglobulin A containing complexes in IgA nephropathy and cirrhosis patients. The role of asialoglycoprotein receptors. Lab. Invest. 1993;69:714–723. [PubMed] [Google Scholar]
- Allen A.C., Harper S.J., Feehally J. Galactosylation of N- and O-linked carbohydrate moieties of IgA1 and IgG in IgA nephropathy. Clin. Exp. Immunol. 1995;100:470–474. doi: 10.1111/j.1365-2249.1995.tb03724.x. [DOI] [PMC free article] [PubMed] [Google Scholar]
- Feehally J., Allen A.C. Pathogenesis of IgA nephropathy. Ann. Med. Intern. 1999;150:91–98. [PubMed] [Google Scholar]
- Mestecky J., McGhee J.R. Immunoglobulin A (IgA)molecular and cellular interactions involved in IgA biosynthesis and immune response. Adv. Immunol. 1987;40:153–245. doi: 10.1016/s0065-2776(08)60240-0. [DOI] [PubMed] [Google Scholar]
- Kerr M.A. The structure and function of human IgA. Biochem. J. 1990;271:285–296. doi: 10.1042/bj2710285. [DOI] [PMC free article] [PubMed] [Google Scholar]
- Chintalacharuvu K.R., Raines M., Morrison S.L. Divergence of human-chain constant region gene sequences. A novel recombinant 2 gene. J. Immunol. 1994;152:5299–5304. [PubMed] [Google Scholar]
- Ravetch J.V., Clynes R.A. Divergent roles for Fc receptors and complement in vivo . Annu. Rev. Immunol. 1998;16:421–432. doi: 10.1146/annurev.immunol.16.1.421. [DOI] [PubMed] [Google Scholar]
- Delacroix D.L., Malburny G.N., Vaerman J.P. Hepatobiliary transport of plasma IgA in the mousecontribution to clearance of intravascular IgA. Eur. J. Immunol. 1985;15:893–899. doi: 10.1002/eji.1830150906. [DOI] [PubMed] [Google Scholar]
- Chintalacharuvu K.R., Morrison S.L. Residues critical for disulfide bond formation in human IgA1 and IgA2. J. Immunol. 1996;157:3443–3449. [PubMed] [Google Scholar]
- Chuang P.D., Morrison S.L. Elimination of N-linked glycosylation sites from the human IgA1 constant region. Effects on structure and function. J. Immunol. 1997;158:724–732. [PubMed] [Google Scholar]
- Rifai A., Mannik M. Clearance of circulating IgA immune complexes is mediated by a specific receptor on Kupffer cells in mice. J. Exp. Med. 1984;160:125–137. doi: 10.1084/jem.160.1.125. [DOI] [PMC free article] [PubMed] [Google Scholar]
- Plotz P.H., Rifai A. Stable, soluble, model immune complexes made with versatile multivalent affinity-labeling antigen. Biochemistry. 1982;21:301–308. doi: 10.1021/bi00531a016. [DOI] [PubMed] [Google Scholar]
- Rifai A., Finbloom D.S., Magilavy D.B., Plotz P.H. Modulation of the circulation and hepatic uptake of immune complexes by carbohydrate recognition systems. J. Immunol. 1982;128:2269–2275. [PubMed] [Google Scholar]
- Rifai A., Mannik M. Clearance kinetics and fate of mouse IgA immune complexes prepared with monomeric or dimeric IgA. J. Immunol. 1983;130:1826–1832. [PubMed] [Google Scholar]
- Mestecky J., Lue C., Tarkowski A., Ladjeva I., Peterman J.H., Moldoveanu Z., Russell M.W., Brown T.A., Radl J., Haauman J.J. Comparative studies of the biological properties of human IgA subclasses. Prot. Biol. Fl. 1989;36:173–182. [Google Scholar]
- Stockert R.J., Kressner M.S., Collins J.C., Sternlieb I., Morell A.G. IgA interaction with the asialoglycoprotein receptor. Proc. Natl. Acad. Sci. USA. 1982;79:6229–6231. doi: 10.1073/pnas.79.20.6229. [DOI] [PMC free article] [PubMed] [Google Scholar]
- Tomana M., Kulhavy R., Mestecky J. Receptor-mediated binding and uptake of immunoglobulin A by human liver. Gastroenterology. 1988;94:762–770. doi: 10.1016/0016-5085(88)90252-1. [DOI] [PubMed] [Google Scholar]
- Morell A., Skvaril F., Noseda G., Barandun S. Metabolic properties of human IgA subclasses. Clin. Exp. Immunol. 1973;13:521–528. [PMC free article] [PubMed] [Google Scholar]
- Rifai A., Schena P., Montinaro V., Mele M., D'Addabbo A., Nitti L., Pezzullo J.C. Clearance kinetics and fate of macromolecular IgA in patients with IgA nephropathy. Lab. Invest. 1989;61:381–388. [PubMed] [Google Scholar]
- Finbloom D.S., Magilavy D.B., Harford J.B., Rifai A., Plotz P.H. Influence of the antigen on immune complex behavior in mice. J. Clin. Invest. 1981;68:214–224. doi: 10.1172/JCI110238. [DOI] [PMC free article] [PubMed] [Google Scholar]
- Ishibashi S., Hammer R.E., Herz J. Asialoglycoprotein receptor deficiency in mice lacking the minor receptor subunit. J. Biol. Chem. 1994;269:27803–27806. [PubMed] [Google Scholar]
- Braun J.R., Willnow T.E., Ishibashi S., Ashwell G., Herz J. The major subunit of the asialoglycoprotein receptor is expressed on the hepatocellular surface in mice lacking the minor receptor subunit. J. Biol. Chem. 1996;271:21160–21166. doi: 10.1074/jbc.271.35.21160. [DOI] [PubMed] [Google Scholar]
- Itano S., Sata M., Kumashiro R., Hirai K., Tanikawa K. Usefulness of technetium-99m-galactosyl human serum albumin liver scintigraphy for assessment of severity of alcoholic hepatitis Alcohol Clin. Exp. Res. 201 Suppl.1996. 86A 90A [DOI] [PubMed] [Google Scholar]
- Burgess J.B., Baenziger J.U., Brown W.R. Abnormal surface distribution of the human asialoglycoprotein in cirrhosis. Hepatology. 1992;15:702–706. doi: 10.1002/hep.1840150425. [DOI] [PubMed] [Google Scholar]
- Tworek B.L., Oka J.A., Casey C.A., Weigel P.H. Ethanol feeding causes inactivation of both state 1 and state 2 rat hepatic asialoglycoprotein receptors. Alcohol Clin. Exp. Res. 1997;21:1429–1434. [PubMed] [Google Scholar]
- Tomana M., Matousovic K., Julian B.A., Radl J., Konecny K., Mestecky J. Galactose-deficient IgA1 in sera of IgA nephropathy patients is present in complexes with IgG. Kidney Int. 1997;52:509–516. doi: 10.1038/ki.1997.361. [DOI] [PubMed] [Google Scholar]
- Tomana M., Novak J., Julian B.A., Matousovic K., Konecny K., Mestecky J. Circulating immune complexes in IgA nephropathy consist of IgA1 with galactose-deficient hinge region and antiglycan antibodies. J. Clin. Invest. 1999;104:73–91. doi: 10.1172/JCI5535. [DOI] [PMC free article] [PubMed] [Google Scholar]
- Schiff M.J., Fisher M.M., Jones A.L., Underdown B.J. Human IgA as a heterovalent ligandswitching from the asialoglycoprotein receptor to secretory component during transport across the rat hepatocyte. J. Cell Biol. 1986;102:920–931. doi: 10.1083/jcb.102.3.920. [DOI] [PMC free article] [PubMed] [Google Scholar]
- Field M.C., Amatayakul-Chantler S., Rademacher T.W., Rudd P.M., Dwek R.A. Structural analysis of the N-glycans from human immunoglobulin A1comparison of normal human serum immunoglobulin A1 with that isolated from patients with rheumatoid arthritis. Biochem. J. 1994;299:261–275. doi: 10.1042/bj2990261. [DOI] [PMC free article] [PubMed] [Google Scholar]
- Mattu T.S., Pleass R.J., Willis A.C., Kilian M., Wormald M.R., Lellouch A.C., Rudd P.M., Woof J.M., Dwek R.A. The glycosylation and structure of human serum IgA1, Fab, and Fc regions and the role of N-glycosylation on Fc alpha receptor interactions. J. Biol. Chem. 1998;273:2260–2272. doi: 10.1074/jbc.273.4.2260. [DOI] [PubMed] [Google Scholar]
- Stockert R.J. The asialoglycoprotein receptorrelationships between structure, function, and expression. Physiol. Rev. 1995;75:591–609. doi: 10.1152/physrev.1995.75.3.591. [DOI] [PubMed] [Google Scholar]
- Boehm M.K., Woof J.M., Kerr M.A., Perkins S.J. The Fab and Fc Fragments of IgA1 exhibit a different arrangement from that in IgGa study by x-ray and neutron solution scattering and homology modelling. J. Mol. Biol. 1999;286:1421–1447. doi: 10.1006/jmbi.1998.2556. [DOI] [PubMed] [Google Scholar]
- Balaji P.V., Qasba P.K., Rao V.S.R. Molecular dynamics simulations of asialoglycoprotein receptor ligands. Biochemistry. 1993;32:12599–12611. doi: 10.1021/bi00210a008. [DOI] [PubMed] [Google Scholar]