

Abstract
We have previously reported that hepatitis B virus (HBV)–specific CD8+ cytotoxic T lymphocytes and CD4+ helper T lymphocytes can inhibit HBV replication in the liver of HBV transgenic mice by secreting interferon (IFN)-γ when they recognize viral antigen. To determine whether an activated innate immune system can also inhibit HBV replication, in this study we activated natural killer T (NKT) cells in the liver of HBV transgenic mice by a single injection of α-galactosylceramide (α-GalCer), a glycolipid antigen presented to Vα14+NK1.1+ T cells by the nonclassical major histocompatibility complex class I–like molecule CD1d. Within 24 h of α-GalCer injection, IFN-γ and IFN-α/β were detected in the liver of HBV transgenic mice and HBV replication was abolished. Both of these events were temporally associated with the rapid disappearance of NKT cells from the liver, presumably reflecting activation-induced cell death, and by the recruitment of activated NK cells into the organ. In addition, prior antibody-mediated depletion of CD4+ and CD8+ T cells from the mice did not diminish the ability of α-GalCer to trigger the disappearance of HBV from the liver, indicating that conventional T cells were not downstream mediators of this effect. Finally, the antiviral effect of α-GalCer was inhibited in mice that are genetically deficient for either IFN-γ or the IFN-α/β receptor, indicating that most of the antiviral activity of α-GalCer is mediated by these cytokines. Based on these results, we conclude that α-GalCer inhibits HBV replication by directly activating NKT cells and by secondarily activating NK cells to secrete antiviral cytokines in the liver. In view of these findings, we suggest that, if activated, the innate immune response, like the adaptive immune response, has the potential to control viral replication during natural HBV infection. In addition, the data suggest that therapeutic activation of NKT cells may represent a new strategy for the treatment of chronic HBV infection.
Keywords: natural killer T cells, transgenic/knockout, hepatitis B virus, immunity, liver
Introduction
NK T (NKT) cells are a subset of CD4+CD8− or CD4−CD8− T cells that express markers associated with NK cells (NK1.1 antigen and LY49 receptors), exhibit an activated phenotype (CD44highLy6ChighIL-2Rβhigh), and display a restricted TCR repertoire (Vα14/Vβ8 in mice, Vα24/Vβ11 in humans 1 2 3 4 5 6 7). NKT cells are restricted by the nonclassical MHC class I–like molecule CD1d, which is known to be expressed on cells of hematopoietic origin (dendritic cells, B cells, T cells, and macrophages) as well as hepatocytes 6 8 9. NKT cells have been shown to recognize glycolipid antigens, such as α-galactosylceramide (α-GalCer), a glycolipid isolated from marine sponges that specifically binds CD1d 9 10 11 12 13. After the interaction of the α-GalCer–CD1d complex with the Vα14/Vβ8 TCR, intrahepatic mouse NKT cells become activated 12 13 14. NKT cell activation results in (a) rapid production of cytokines such as IL-4 and IFN-γ, (b) upregulation of activation markers such as CD69, (c) cell proliferation, and (d) increased cytotoxic capacity 6 9 12. Other cells, such as NK cells and T cells, can become activated after the injection of α-GalCer in mice. This process has been shown to be dependent on the release of IFN-γ from the activated NKT cells 15 16 17.
NKT cells are particularly abundant in the liver 4 6 18, accounting for 20–30% of intraheptic lymphocytes (IHLs), and they are thought to play a role in immunity to intracellular bacteria and parasites 19 20 21 and certain tumors 22. The possibility that NKT cells play a role in the control of viral infections has not been carefully examined. Using a hepatitis B virus (HBV) transgenic mouse model, we have previously shown that the intrahepatic induction of IFN-γ inhibits HBV replication in the liver 23 24 by a nitric oxide (NO)-dependent pathway 25. We have also shown that IFN-α/β produced in the liver of HBV transgenic mice during various virus infections or after poly–inosinic-polycytidylic acid (Poly-I/C) injection inhibits HBV replication via NO-independent pathways 24 26 27. Noncytopathic antiviral mechanisms like these contribute to viral clearance during acute viral hepatitis in chimpanzees 28, thus confirming the transgenic mouse studies in a natural infection model.
Based on the abundance of NKT cells in the liver and their ability to produce antiviral cytokines, it is possible that activated NKT cells might inhibit viral replication during HBV infection. To test this hypothesis, in this study we monitored the ability of α-GalCer to inhibit HBV replication in the liver of HBV transgenic mice.
Materials and Methods
Mice.
HBV transgenic mouse lineages 1.3.32 and 1.3.46 used in this study have been described previously 29. Both lineages of mice replicate HBV at high levels in the liver and kidney without any evidence of cytopathology. Lineage 1.3.32 was expanded by repetitive backcrossing against C57BL/6 parental strain and then bred one generation against BALB/c mice to produce F1 hybrids used in this study. Lineage 1.3.46 was initially produced and expanded on an inbred B10D2 background. Transgenic mice were repetitively backcrossed against mice genetically deficient for IFN-γ (IFN-γ−/− 30), the IFN-α/βR (IFN-α/βR−/− 31), the TNF-αp55R (TNF-αR−/− 32), or inducible NO synthase (iNOS [iNOS−/−]; reference 33), exactly as described 24 25. The knockout mice were provided by Drs. Timothy Stewart (IFN-γ−/−) and Michel Aguet (IFN-α/βR−/−) at Genentech, Inc., South San Francisco, CA; Dr. Tak Mak (TNF-αR−/−) at the University of Toronto, Ontario, Canada. The iNOS−/− mice were provided by Drs. John Mudgett (Merck Research Laboratories, Rahway, NJ), John MacMicking, and Carl Nathan (both from Cornell University Medical College, New York, NY). The genetic background of the original parental lineages of all knockout animals was 129/Sv/Ev/ × C57BL/6. The IFN-γ−/− mice were previously backcrossed four to five generations against BALB/c mice, and the IFN-α/βR−/−, TNF-αR−/−, and iNOS−/− mice were previously backcrossed more than five generations against C57BL/6 before they were mated with lineage 1.3.46 (inbred B10D2). F1 progeny were interbred to yield hepatitis B e antigen–positive (HBeAg; determined by using a commercially available kit from Abbott Laboratories) F2 progeny that were either homozygous or heterozygous for the null mutation. To deplete CD4+ and CD8+ T cells, mice were injected intravenously with 2 mg of rat anti–mouse CD4 (YTS191.1) and rat anti–mouse CD8 (YTS169.4) monoclonal antibodies provided by Dr. Rolf Zinkernagel (University Hospital of Zurich, Zurich, Switzerland 34) 3 and 1 d before α-GalCer injection. Efficacy of treatment was monitored by FACScan™ (Becton Dickinson). In all experiments, the mice were matched for age (8 wk), sex (male), and HBeAg levels in their serum before experimental manipulations. All animals were housed in pathogen-free rooms under strict barrier conditions.
α-GalCer.
The glycolipid α-GalCer was originally isolated as a natural product from marine sponges 10 11. α-GalCer was diluted in PBS from a 10 μg/ml stock solution in DMSO. The glycolipid control α-mannosylceramide (α-ManCer) was also diluted in PBS from a 10 μg/ml stock solution in DMSO 12. Mice were injected intravenously once with varying doses of α-GalCer or α-ManCer, and they were killed at various time points thereafter. Their livers were harvested for histological analyses, or they were snap frozen in liquid nitrogen and stored at −80°C for subsequent molecular analyses (see below). Control animals were also injected intravenously with either saline (NaCl) or the vehicle alone (DMSO diluted in PBS).
Tissue DNA and RNA Analyses.
Frozen livers (left lobe) were mechanically pulverized under liquid nitrogen, and total genomic DNA and RNA were isolated for Southern blot (SB) and Northern blot (NB) analyses exactly as described previously 29. Nylon membranes were analyzed for HBV DNA, HBV RNA, glyceraldehyde 3-phosphate dehydrogenase (GAPDH), and 2′5′-oligoadenylate synthetase (2′5′-OAS) as described elsewhere 26. Quantitation of iNOS, cytokine, T cell, and macrophage marker mRNAs was performed by RNase protection assay (RPA) exactly as described previously 23 24 25. The relative abundance of HBV DNA molecules was quantitated by phosphor imaging analysis, using the Optiquant™ image analysis software (Packard Instrument Co.).
Biochemical and Histological Analyses.
The extent of hepatocellular injury was monitored by measuring serum alanine aminotransferase (sALT) activity at multiple time points after treatment. sALT activity was measured in a Paramax chemical analyzer (Baxter Diagnostics, Inc.) exactly as described previously 23. For histological analysis, liver was fixed in 10% zinc-buffered formalin (Anatech), embedded in paraffin, sectioned (3 μm), and stained with hematoxylin and eosin 23.
Lymphomononuclear Cell Preparation.
Single-cell suspensions were prepared from liver that was perfused with PBS via the inferior vena cava and pressed through a 70-μm Cell Strainer (Becton Dickinson). Total liver cells were digested with 10 ml of RPMI 1640 (Life Technologies) containing 0.02% (wt/vol) collagenase IV (Sigma-Aldrich) and 0.002% (wt/vol) DNase I (Sigma-Aldrich) for 40 min at 37°C. Cells were washed with RPMI 1640 and then underlaid with 24% (wt/vol) metrizamide (Sigma-Aldrich) in PBS. After centrifugation for 20 min at 1,500 g, IHLs were isolated at the interface. RBCs were lysed by lysing buffer (0.15 M NH4Cl, 10.0 mM KHCO3, and 0.1 mM Na2EDTA at pH 7.2). The cells were washed once with RPMI 1640 and used for further analysis.
Flow Cytometry.
Single-cell suspensions of IHLs or PBMCs were washed in PBS (containing 1% BSA and 0.02% sodium azide), and incubated for 20 min on ice with culture supernatant from the hybridoma cell line 2.4G2 (American Type Culture Collection) to block Fc receptors. The cells were surface stained with fluorochrome-conjugated monoclonal antibody for 20 min on ice. The following antibodies were used: anti-CD3 (clone 17A2), anti-CD4 (clone GK1.5), anti–mouse CD8α (clone 53-6.7), anti-CD69 (clone H1.2F3), and anti-NK1.1 (clone PK136; all from BD PharMingen). Samples were acquired on a FACScan™ flow cytometer, and the data were analyzed using CELLQuest™ software (Becton Dickinson).
Results
α-GalCer Specifically Inhibits HBV Replication.
To examine the antiviral activity of α-GalCer in HBV transgenic mice, four age- (8–10 wk), sex- (male), and serum HBeAg–matched transgenic mice from lineage 1.3.32 were injected intravenously with 2 μg of α-GalCer and killed 24 h later. Total hepatic DNA was analyzed for HBV DNA by SB. Total hepatic RNA was analyzed by NB for the expression of 2′5′-OAS (a marker of IFN-α/β induction) and GAPDH. Total hepatic RNA was also analyzed by RPA for the expression of iNOS and various cytokines. The results were compared with those observed in mice that were injected intravenously either with the vehicle alone (10% DMSO in PBS) or with 2 μg of α-ManCer, a glycolipid control that has no ability to activate NKT cells 12.
As shown in Fig. 1 for two representative mice per group, injection of α-GalCer resulted in a profound inhibition of most HBV replicative intermediates (∼10-fold, as measured by phosphor imaging analysis, not shown), including the single stranded (SS) DNA forms, which completely disappeared from the liver of these animals by day 1. The more mature high molecular weight forms, such as the relaxed circular (RC) double stranded DNA forms, remained detectable, albeit at levels that were lower than those detected in control mice (Fig. 1). This antiviral effect was associated with the intrahepatic induction of the mRNA for 2′5′-OAS, iNOS, TNF-α, and IFN-γ (Fig. 1). IL-4 was also induced in these animals, although to a much lesser extent (the intensity of the band for IL-4 corresponds to a much longer exposure than that for IFN-γ; see legend to Fig. 1 for more details). Concomitant expression of IFN-γ and IL-4 suggests that NKT cells were activated in these livers, since both cytokines are known to be produced by these cells after α-GalCer–dependent activation 13. Other cytokines (TNF-β, IL-5, IL1-α, IL-2, IL-6, IL-1β, and IL-3) were also analyzed in this assay (Fig. 1). The messages for these cytokines were at most minimally induced in the liver of α-GalCer–injected mice in this and follow-up experiments. Thus, these messages are not shown in the following figures (see below). Importantly, HBV replication was not suppressed in the liver of mice that received either DMSO or α-ManCer, in keeping with the failure of these agents to induce cytokines in the liver (Fig. 1). These results strongly suggest that α-GalCer inhibits viral replication by activating NKT cells to produce antiviral cytokines.
Figure 1.
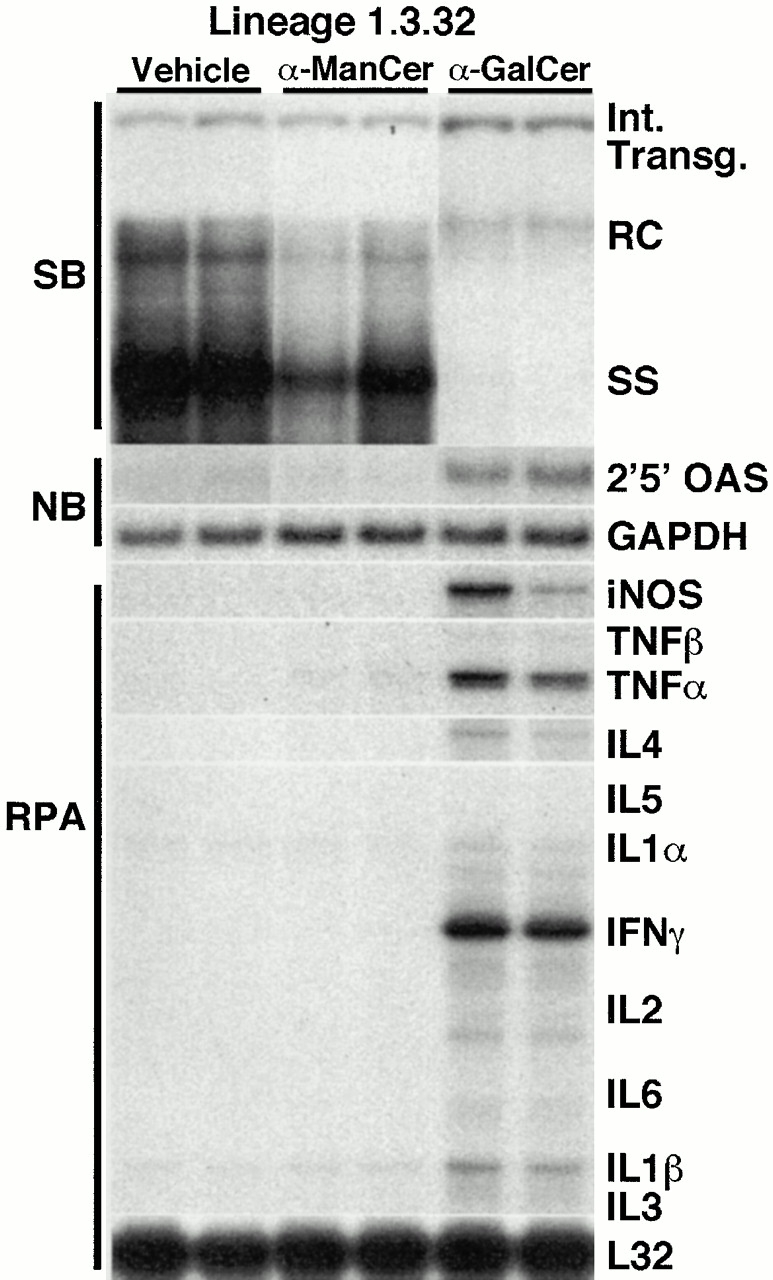
α-GalCer specifically inhibits HBV replication. Age-, sex-, and serum HBeAg–matched lineage 1.3.32 HBV transgenic mice were injected intravenously with 2 μg of α-GalCer, α-ManCer, or vehicle (DMSO), and mice were killed 1 d after injection. Results were compared with those observed in livers pooled from 10 age-, sex-, and serum HBeAg–matched, saline-injected transgenic controls (NaCl). Total hepatic DNA was analyzed for HBV DNA by SB analysis. All DNA samples were RNase treated before quantitation and gel electrophoresis. Bands corresponding to the integrated transgene, RC double stranded HBV DNA, and SS linear HBV DNA replicative forms are indicated. The integrated transgene can be used to normalize the amount of DNA bound to the membrane. The filter was hybridized with a 32P-labeled HBV-specific DNA probe. Total hepatic RNA was analyzed for 2′5′-OAS and GAPDH transcripts by NB analysis and for iNOS and cytokine transcripts by RPA, as indicated. Note that all cytokine mRNAs were analyzed in the same RPA. However, the intensity of the indicated band for IL-4 corresponds to an autoradiographic exposure of 18 d, whereas the intensity of the bands for all other cytokines corresponds to a 2-d exposure. The mRNA encoding the ribosomal protein L32 was used to normalize the amount of RNA loaded in each lane of the RPA assay.
α-GalCer–dependent Inhibition of HBV Replication: Dose Response.
To determine the minimum dose of α-GalCer required to inhibit HBV replication in the transgenic mice, groups (3 mice per group) of age- (8–10 wk), sex- (male), and serum HBeAg–matched transgenic mice from lineage 1.3.32 were injected intravenously with varying doses of α-GalCer, and killed on day 1. Results were compared with those observed in livers pooled from 10 age-, sex-, and serum HBeAg–matched transgenic littermates injected with saline (NaCl).
As shown in Fig. 2 for two representative mice per group, HBV DNA replication was profoundly inhibited in the liver of the animals that received either 1 ng or 100 pg of α-GalCer, coincident with the induction of 2′5′-OAS, iNOS, IFN-γ, and TNF-α mRNA in these livers. HBV replication was also inhibited (albeit not completely) in the liver of mice that received 10 pg of α-GalCer and this coincided with lower degrees of induction of 2′5′-OAS and iNOS mRNAs. Finally, no reduction of HBV replication and no induction of cytokine or NO mRNAs was observed at doses of α-GalCer of 1 pg or less (Fig. 2). All together, these results indicate that the minimum dose of α-GalCer that exerts maximum antiviral activity is between 100 and 10 pg/mouse.
Figure 2.

α-GalCer–dependent inhibition of HBV replication: dose response. Age-, sex-, and serum HBeAg–matched lineage 1.3.32 HBV transgenic mice were injected intravenously with varying doses (as indicated) of α-GalCer and killed on day 1. Total hepatic DNA and RNA were analyzed as described in the legend to Fig. 1. The sALT activity values at the time of autopsy are indicated (bottom) for each mouse and expressed in U/liter.
α-GalCer–dependent Inhibition of HBV Replication: Time Course.
To examine the kinetics and duration of the antiviral effect of α-GalCer, groups (three mice per group) of age- (8–10 wk), sex- (male), and serum HBeAg–matched transgenic mice from lineage 1.3.32 were injected intravenously with 10 ng of α-GalCer and killed at various time points thereafter. To evaluate the magnitude and nature of the intrahepatic inflammatory response in these livers, we also monitored in these mice the mRNA content of CD8 (expressed by CTLs 35 and dendritic cells 36), CD4 (expressed by T helper cells 37, NKT cells 6, and macrophages 38), F480 (expressed mostly by macrophages 38), and CD3 (expressed by CTLs, T helper cells 39, and NKT cells 6). Histological analysis of the livers was also performed to document the intrahepatic cellular events induced by α-GalCer injection (see Fig. 4). In addition, IHLs were also isolated and analyzed by flow cytometry using lineage-specific monoclonal antibodies (see Fig. 5). The total number of each cell subset in the liver was calculated by multiplying the total number of IHLs by the frequency of the subset in the IHL populations by FACS® analysis. Importantly, no differences were observed in the intrahepatic NKT, NK, and T cell subsets in the HBV transgenic mice and genetically identical nontransgenic controls (not shown).
Figure 4.

Histological features of α-GalCer–induced hepatitis in the liver of mice after 10 ng of α-GalCer injection. Liver sections obtained from α-GalCer–injected mice killed on day 1 (A) or day 3 (B and C) were stained with hematoxylin and eosin as described in Materials and Methods. On day 1, the liver was mostly cytologically normal except for a few very small and widely scattered necroinflammatory foci consisting of lymphomononuclear cells and rare apoptotic hepatocytes (arrows; A). On day 3, inflammatory foci became larger and more abundant, consisting of a mixed population of lymphomononuclear cells that often displayed granulomatous features (B). In addition, a mixed lymphomononuclear cell infiltrate was also detected in and adjacent to the portal tracts at this time point (C). The infiltrate subsided progressively thereafter, returning to baseline by day 14 (not shown).
Figure 5.
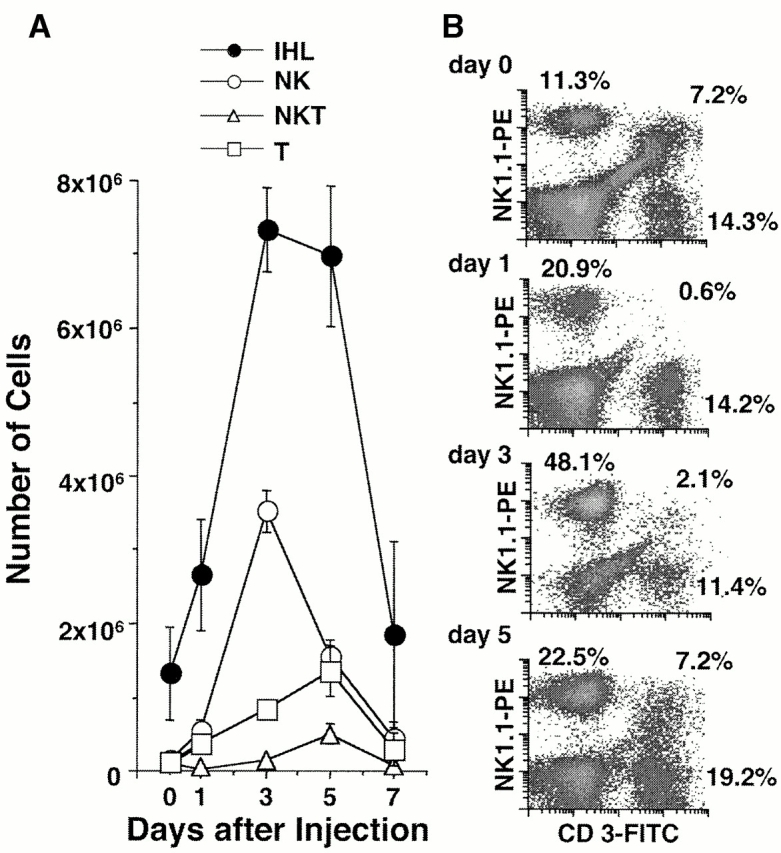
IHLs after α-GalCer injection. Age-, sex-, and serum HBeAg–matched lineage 1.3.32 HBV transgenic mice were injected intravenously with 10 ng of α-GalCer and killed at the indicated time points. IHLs from these animals were isolated and analyzed by flow cytometry. (A) The total number of IHLs was 1.3 × 10⁶ before injection, 2.7 × 10⁶ on day 1, 7.3 × 10⁶ on day 3, 7.0 × 10⁶ on day 5, and 1.8 × 10⁶ on day 7. The number of each cell subset in the liver was calculated by multiplying the total number of IHLs by the frequency of the subset in the IHL populations by FACS® analysis. (B) Phenotypic analysis of IHLs that express NK1.1 or CD3. The numbers indicate the percentage of NK1.1+CD3− (i.e., NK) cells (top left), NK1.1+CD3+ (i.e., NKT) cells (top right), and NK1.1−CD3+ (i.e., classical T) cells (bottom right) present in the isolated IHL population.
As shown in Fig. 3 for two representative mice per group, HBV replication was strongly suppressed on day 1 after α-GalCer injection, similar to the results shown in Fig. 1 and Fig. 2. This effect was associated with a strong induction of 2′5′-OAS, iNOS, IFN-γ, and TNF-α mRNA and with a very little induction of CD8, CD4, and CD3 mRNA (Fig. 3), indicating that very few CD8+, CD4+, and CD3+ cells were recruited into the liver at this time point. In keeping with these results, very small and widely scattered necroinflammatory foci (consisting of a few lymphomononuclear cells and rare apoptotic hepatocytes) were detected in the liver parenchyma of these animals by histological analysis (Fig. 4 A), and there was a slight (approximately twofold) increase in the total number of IHLs recruited into the liver (Fig. 5 A) and most of the increase was accounted by an influx of NK cells (Fig. 5 B). The disproportionate increase of cytokine and iNOS transcripts (Fig. 3) on day 1 relative to the T cell and macrophage markers at this time point (Fig. 3 and Fig. 5) suggests that α-GalCer triggered cytokine and NO production in other cell populations, presumably NKT cells and secondarily NK cells, neither of which are detectable by RPA in Fig. 3 but are detectable by FACS® in Fig. 5. Indeed, we demonstrated that NKT cells were activated on day 1, since α-GalCer injection rapidly reduced the number of NKT cells from 1.1 × 10⁵ to 1.6 × 10⁴ (Fig. 5 A) and the frequency of NKT cells by >90% on day 1 (Fig. 5 B). This is consistent with NKT cell activation, since activated NKT cells are known to rapidly undergo apoptosis 17 40. Importantly, as the NKT cells were disappearing from the liver on day 1, the total number of intrahepatic NK cells increased from 1.4 × 10⁵ to 5.5 × 10⁵ (Fig. 5 A) and they were all CD69+ (not shown), indicating that, like the NKT cell populations, the intrahepatic NK cells had become activated in these mice. Collectively, these results reinforce the notion that both the NKT and NK cell populations were probably the source of the intrahepatic cytokines detectable in the liver at that early time point (Fig. 3).
Figure 3.

α-GalCer–dependent inhibition of HBV replication: time course. Age-, sex-, and serum HBeAg–matched lineage 1.3.32 HBV transgenic mice were injected intravenously with 10 ng of α-GalCer and killed at the indicated time points. Total hepatic DNA and RNA were analyzed as described in the legend to Fig. 1. The sALT activity values at the time of autopsy are indicated (bottom) for each mouse and expressed in U/liter.
Further analysis (see below) suggested that the NK cell infiltrate was probably recruited by the activated NKT cells, since the NK cell content of the liver continued to rise on day 3 when the NKT cell subset had started to return to baseline (Fig. 5 B). Indeed, the intrahepatic inflammatory infiltrate increased dramatically on day 3 (Fig. 4A and Fig. B, and Fig. 5 A), reflecting a series of coordinated events including the recovery of the NKT cell population (Fig. 5 B), a further influx of NK cells (Fig. 5 B), and a major increase in CD4+ and CD8+ T cells and F480+ macrophages (Fig. 3) in the liver. These results were confirmed histologically. As shown in Fig. 4A and Fig. B, the inflammatory foci became larger and more abundant at this time point, consisting of a mixed population of lymphomononuclear cells that often displayed granulomatous features in the hepatic parenchyma (Fig. 4 B). In addition, a mixed lymphomononuclear periportal infiltrate was also detected in the liver at this time point (Fig. 4 C). Despite the expanded inflammatory infiltrate at this time point, the intrahepatic cytokine and iNOS transcript signals were either unchanged or diminished (Fig. 3), suggesting that the cells that were recruited after day 1 did not significantly amplify the intrahepatic cytokine content in these animals. Nonetheless, HBV replication was further inhibited on day 3 when even the mature forms (RC) eventually disappeared (Fig. 3), reflecting the continued, although reduced, production of cytokines.
As the cytokine content of the liver returned towards baseline on day 5 and thereafter (Fig. 3), the immature SS DNA forms reappeared before the mature RC DNA forms, in keeping with the natural replication cycle of HBV, and both forms eventually approached preinjection levels by day 14 (Fig. 3). Consistent with these changes, the intrahepatic content of 2′5′-OAS, iNOS, IFN-γ, TNF-α, CD8, CD4, F480, and CD3 mRNA progressively decreased, returning almost to preinjection levels by day 14 (Fig. 3). By flow cytometry we showed that the intrahepatic inflammatory cell infiltrate subsided considerably on day 7 (Fig. 5 A) and progressively diminished to baseline by day 14, at which time no inflammatory foci were detected in the liver histologically (not shown).
The liver disease in these animals was also monitored biochemically by measuring sALT. sALT activity was slightly increased on day 1 (Fig. 3, bottom), suggesting that the NKT cells and NK cells or their products were minimally cytopathic for the hepatocyte. The sALT activity remained slightly elevated on day 3 and eventually subsided to normal levels between 5 and 7 d after injection of α-GalCer. Since the sALT activity was not significantly higher on day 3 than on day 1 in the face of a large increase in the number of intrahepatic inflammatory cells at this time point, it appears that the recruited cells were not highly cytotoxic.
Inhibition of HBV Replication by α-GalCer Is T Cell Independent.
Because we observed a slight increase in CD3, CD4, and CD8 mRNA in the liver 1 d after α-GalCer injection, at which time HBV replication had been almost completely abolished (Fig. 3), we determined if the antiviral effect might reflect activation of the conventional T cell populations. Accordingly, HBV transgenic mice, age- (8–10 wk), sex- (male), and serum HBeAg–matched transgenic mice (three mice per group) from lineage 1.3.32 were treated with rat anti–mouse CD4 and rat anti–mouse CD8 monoclonal antibodies to deplete these cells before the injection of α-GalCer. FACS® analysis of the IHLs before and after depletion revealed that the intrahepatic CD4+ and CD8+ T cell populations were reduced to <1.5% of preinjection levels after antibody treatment, whereas the number of NKT cells and NK cells were unaffected (Fig. 6A and Fig. B). Mice were then injected intravenously with 1 ng of α-GalCer or saline (NaCl) as control and killed 24 h later. As shown in Fig. 6 C for two representative mice per group, α-GalCer profoundly inhibited HBV DNA replication in the liver of the animals lacking CD4+ and CD8+ cells, suggesting that they did not contribute to the antiviral activity at this time point. This is consistent with the notion that α-GalCer directly activates intrahepatic NKT cells which are very abundant in the normal liver and, furthermore, that the activation products of the NKT cells trigger the recruitment and activation of NK cells that, together with the NKT cells, secrete antiviral cytokines that are responsible for the intrahepatic antiviral activity of α-GalCer.
Figure 6.

CD4 and CD8 T cell–independent inhibition of HBV replication by α-GalCer. Age-, sex-, and serum HBeAg–matched lineage 1.3.32 HBV transgenic mice were injected intravenously with 2 mg of rat anti–mouse CD4 (YTS191.1) and rat anti–mouse CD8 (YTS169.4) monoclonal antibodies 3 and 1 d before they received 1 μg of α-GalCer, and the mice were killed 1 d later. (A and B) The efficacy of T cell depletion was checked by CD4 and CD8 staining of IHLs from the treated and control mice. The numbers indicate the percentage of CD4+ cells (bottom right), CD8+ cells (top left), and NKT cells (top right). (C) Total hepatic DNA was analyzed for HBV DNA by SB analysis as described in the legend to Fig. 1.
The Antiviral Effect of α-GalCer Is Mediated by IFN-γ and IFN-α/β.
To determine the relative contributions of inflammatory cytokines and NO to the antiviral effect of α-GalCer, 1 μg of α-GalCer was injected into HBV transgenic mice (lineage 1.3.46) that had been crossed with mice that are genetically deficient for IFN-γ (IFN-γ−/− 30), the IFN-α/βR (IFN-α/βR−/− 31), the TNF-αp55R (TNF-αR−/− 32), or iNOS (iNOS−/− 33). Groups (four mice per group) of age- (8–10 wk), sex- (male), and serum HBeAg–matched animals that were either heterozygous (+/−) or homozygous (−/−) for the respective null mutation were killed on day 1 after α-GalCer injection and their livers were processed as described above. Results were compared with those observed in livers pooled from six age-, sex-, and serum HBeAg–matched transgenic littermates in each group that were injected with saline (NaCl). It is important to note that saline-injected IFN-γ−/−, IFN-α/βR−/−, and iNOS−/− HBV transgenic mice are known to replicate HBV at higher levels than are observed in control heterozygous mice or TNF-αR−/− mice (24 25; Fig. 7).
Figure 7.

The antiviral effect of α-GalCer is partially mediated by IFN-γ and IFN-α/β. Age-, sex-, and serum HBeAg–matched lineage 1.3.46 HBV transgenic mice that were either heterozygous (+/−) or homozygous (−/−) for the IFN-γ, the IFN-α/βR, the TNF-αp55R, or iNOS were injected with 1 μg of α-GalCer and killed 1 d later. Total hepatic DNA was analyzed for HBV DNA by SB analysis. All DNA samples were RNase treated before quantitation and gel electrophoresis. Bands corresponding to the integrated transgene, RC double stranded HBV DNA, and SS linear HBV DNA replicative forms are indicated. The integrated transgene can be used to normalize the amount of DNA bound to the membrane. The filter was hybridized with a 32P-labeled HBV-specific DNA probe. Total hepatic RNA was analyzed for 2′5′-OAS and GAPDH transcripts by NB analysis and for iNOS and cytokine transcripts by RPA, as indicated. The mRNA encoding the ribosomal protein L32 was used to normalize the amount of RNA loaded in each lane of the RPA assay. Results were compared with those observed in livers pooled from six age-, sex-, and serum HBeAg–matched transgenic littermates in each group that were injected with saline (NaCl).
As expected, HBV replication was suppressed in all of the heterozygous control mice (represented by the TNF-αR+/− mice in Fig. 7), and this coincided with the induction of 2′5′-OAS, iNOS, IFN-γ, and TNF-α mRNAs (Fig. 7). Similarly, HBV replication was inhibited in the TNF-αR−/− and the iNOS−/− mice, concomitant with the induction of 2′5′-OAS, iNOS (except in the iNOS−/− mice), IFN-γ, and TNF-α mRNAs. These results indicate that TNF-α and NO are not required for the antiviral effect of α-GalCer. In contrast, HBV replication was still easily detectable in IFN-γ−/− and IFN-α/βR−/− mice, although it was slightly reduced (Fig. 7). Since 2′5′-OAS was induced in IFN-γ−/− mice (albeit to a lesser extent than in α-GalCer–injected heterozygous control mice), it is possible that the residual antiviral activity of α-GalCer was mediated in IFN-γ−/− animals by IFN-α/β. Reciprocally, since IFN-γ was induced in IFN-α/βR−/− mice, it is possible that the residual antiviral activity of α-GalCer in IFN-α/βR−/− animals was mediated by IFN-γ. This is consistent with our previous reports that these two cytokines activate independent antiviral pathways in this model 24 25.
Discussion
In this study, we demonstrated that α-GalCer inhibits HBV replication in the liver of HBV transgenic mice. The antiviral effect of α-GalCer is rapid, profound, and specific, and is associated with the induction of IFN-γ and IFN-α/β in the liver. Both of these cytokines mediate the antiviral effect of α-GalCer, since its activity is strongly reduced in mice that are genetically deficient for either IFN-γ or the IFN-α/βR. Since the induction of IFN-γ and IFN-α/β as well as the inhibition of HBV replication occur before a significant number of inflammatory cells are recruited into the organ, it is likely that these cytokines are produced by cells that reside in the liver, specifically NKT cells that are known to produce IFN-γ very rapidly in response to α-GalCer 13 and NK cells that are promptly activated by NKT cells and enhance induction of IFN-γ production 16 17. Importantly, our results also demonstrate that α-GalCer induces IFN-α/β in the liver, a previously unreported effect of this glycolipid.
We have previously shown that IFN-γ (produced in the liver by passively transferred HBV-specific CTLs 23) and IFN-α/β (produced in the liver after injection of Poly-I/C or during infection with unrelated hepatotropic viruses) can inhibit HBV replication by independent pathways 24. The results reported herein show that similar antiviral events can be triggered by α-GalCer via its ability to activate intrahepatic NKT cells. Based on these results, it is possible that intrahepatic NKT cells could inhibit HBV replication during natural infection. In keeping with this hypothesis, we recently showed that HBV DNA largely disappears from the liver and the blood of acutely infected chimpanzees concomitant with the appearance of IFN-γ, but before the major influx of CD3+ T cells 28, suggesting that IFN-γ might have been produced by nonclassical T cells, perhaps by activated NKT cells that are known to express low levels of the CD3–TCR complex and/or by NK cells that are known to be activated by NKT cells. If this is correct, intrahepatic NKT cells might contribute to viral clearance if they become activated during HBV infection.
NKT cells could become activated by direct or indirect mechanisms. Direct mechanisms could include the specific recognition of viral or virus-induced antigen via the TCR. CD1 is known to accommodate highly hydrophobic molecules, such as glycolipids and phospholipids 41 42 43 44. HBV virions and subviral particles contain glycolipids and phospholipids derived from cellular membranes 45 that could be processed by CD1+ cells (professional antigen-presenting cells and hepatocytes) and presented to intrahepatic NKT cells. We doubt that this mechanism is operative during natural HBV infection because we did not observe any difference in the abundance or activation of the NKT cell populations in the livers of HBV transgenic versus nontransgenic mice. Other direct mechanisms include the recognition of putative ligands by non-TCR receptors (such as the NKR-P1 receptor, which is also present on NK cells [46, 47]) or the recognition of cells that lack surface expression of MHC class I molecules (a mechanism that also induces NK cell activation [46, 47]). Indirect mechanisms could include activation of NKT cells by virus-induced cytokines 6 22. Additional studies will be needed to clarify these alternative scenarios.
NKT cells are resident IHLs, accounting for 20–30% of IHLs 4 6 18; they have a limited TCR repertoire (Vα14/Vβ8 in mice, Vα24/Vβ11 in humans); and they are restricted by the nonclassical, nonpolymorphic MHC class I–like molecule CD1d. The pertinence of these observations for the treatment of chronic HBV infection derives from the fact that, because of their abundance in the liver, NKT cells do not need to be recruited in order to exert their antiviral effect. Furthermore, because of their limited repertoire, if provided with the appropriate ligand (e.g., α-GalCer) NKT cells can be activated very efficiently in individuals irrespective of their classical MHC class I haplotype. This offers a major advantage over antigen-specific immunotherapy for chronic HBV infection since it eliminates the need for priming and expansion of antigen-specific effector cells and recruitment of these effector cells into the liver. Furthermore, attempts to therapeutically induce HBV antigen–specific T cell responses in chronically HBV-infected patients 48 have not been very successful thus far, probably because of neonatal and/or peripheral tolerance; we have had the same experience in HBV transgenic mice 49. In contrast, since they probably do not recognize viral peptide antigens, NKT cells are not likely to be deleted in chronically infected patients 50 51, just as they were not in the HBV transgenic mice in this study (not shown). This creates the unique opportunity to use pharmacological approaches to activate the resident intrahepatic NKT cell population and, secondarily, the intrahepatic NK cell population, thereby rapidly and efficiently enhancing the production of potentially curative antiviral cytokines in the liver of infected patients in a quantitatively and temporally controllable manner. Thus, it may be possible to harness the potentially curative antiviral potential of the innate immune response to compensate for the apparent failure of the adaptive immune response in chronically infected patients.
In conclusion, this study demonstrates that α-GalCer activates intrahepatic NKT cells to secrete antiviral cytokines (IFN-γ and IFN-α/β) in the liver. The rapid and strong induction of these cytokines may reflect the relative abundance of NKT cells in the liver 4 6 18, all of which can be simultaneously activated by the glycolipid. Based on these results, it is conceivable that NKT cells may play a hitherto unsuspected role in the immunobiology of HBV infection. In addition, the results suggest that therapeutic activation of intrahepatic NKT cells may be able to terminate chronic HBV infection.
Acknowledgments
We thank Timothy Stewart and Michel Aguet for providing IFN-γ−/− and IFN-α/βR−/− mice, respectively; John Mudgett, John MacMicking, and Carl Nathan for providing iNOS−/− mice; Tak Mak for providing TNF-αR−/− mice; Ian Campbell for providing the iNOS probe and Monte Hobbs for providing the cytokine gene and T cell marker probe sets used in the RNase Protection assays; Rolf Zinkernagel for providing anti-CD4 and anti-CD8 antibody; and Alana Althage, Heike McClary, Rick Koch, Christina Whitten, Amber Morris, and Margie Chadwell for excellent technical assistance.
This work was supported by grants AI40696 (L.G. Guidotti) and CA40489 (F.V. Chisari) from the National Institutes of Health. This is manuscript 13221-MEM from The Scripps Research Institute.
Footnotes
Abbreviations used in this paper: α-GalCer, α-galactosylceramide; GAPDH, glyceraldehyde 3-phosphate dehydrogenase; HBeAg, hepatitis B e antigen; HBV, hepatitis B virus; IHL, intrahepatic lymphocyte; iNOS, inducible NO synthase; α-ManCer, α-mannosylceramide; NB, Northern blot; NKT, NK T; NO, nitric oxide; Poly-I/C, poly–inosinic-polycytidylic acid; RC, relaxed circular; RPA, RNase protection assay; sALT, serum alanine aminotransferase; SB, Southern blot; SS, single stranded.
References
- Lantz O., Bendelac A. An invariant T cell receptor alpha chain is used by a unique subset of major histocompatibility complex class I–specific CD4+ and CD4−8− T cells in mice and humans. J. Exp. Med. 1994;180:1097–1106. doi: 10.1084/jem.180.3.1097. [DOI] [PMC free article] [PubMed] [Google Scholar]
- Ohteki T., MacDonald H.R. Stringent V β requirement for the development of NK1.1+ T cell receptor-α/β1 cells in mouse liver. J. Exp. Med. 1996;183:1277–1282. doi: 10.1084/jem.183.3.1277. [DOI] [PMC free article] [PubMed] [Google Scholar]
- Arase H., Arase N., Ogasawara K., Good R.A., Onoe K. An NK1.1+ CD4+8− single-positive thymocyte subpopulation that expresses a highly skewed T-cell antigen receptor V beta family. Proc. Natl. Acad. Sci. USA. 1992;89:6506–6510. doi: 10.1073/pnas.89.14.6506. [DOI] [PMC free article] [PubMed] [Google Scholar]
- Ohteki T., MacDonald H.R. Major histocompatibility complex class I related molecules control the development of CD4+8− and CD4−8− subsets of natural killer 1.1+ T cell receptor-α/β1 cells in the liver of mice. J. Exp. Med. 1994;180:699–704. doi: 10.1084/jem.180.2.699. [DOI] [PMC free article] [PubMed] [Google Scholar]
- MacDonald H.R. NK1.1+ T cell receptor-α/β1 cellsnew clues to their origin, specificity, and function. J. Exp. Med. 1995;182:633–638. doi: 10.1084/jem.182.3.633. [DOI] [PMC free article] [PubMed] [Google Scholar]
- Bendelac A., Rivera M.N., Park S.H., Roark J.H. Mouse CD1-specific NK1 T cellsdevelopment, specificity, and function. Annu. Rev. Immunol. 1997;15:535–562. doi: 10.1146/annurev.immunol.15.1.535. [DOI] [PubMed] [Google Scholar]
- MacDonald H.R., Lees R.K., Held W. Developmentally regulated extinction of Ly-49 receptor expression permits maturation and selection of NK1.1+ T cells. J. Exp. Med. 1998;187:2109–2114. doi: 10.1084/jem.187.12.2109. [DOI] [PMC free article] [PubMed] [Google Scholar]
- Brossay L., Jullien D., Cardell S., Sydora B.C., Burdin N., Modlin R.L., Kronenberg M. Mouse CD1 is mainly expressed on hemopoietic-derived cells. J. Immunol. 1997;159:1216–1224. [PubMed] [Google Scholar]
- Hong S., Scherer D.C., Singh N., Mendiratta S.K., Serizawa I., Koezuka Y., Van Kaer L. Lipid antigen presentation in the immune systemlessons learned from CD1d knockout mice. Immunol. Rev. 1999;169:31–44. doi: 10.1111/j.1600-065x.1999.tb01304.x. [DOI] [PubMed] [Google Scholar]
- Natori T., Koezuka Y., Higa T. Agelasphis, novel α-galactosylceramides from marine sponge Agelas mauritianus . Tetrahedron Lett. 1993;34:5591–5592. [Google Scholar]
- Natori T., Morita M., Akimoto K., Koezuka Y. Agelasphins, novel antitumor and immunostimulatory cerebrosides from marine sponge Agelas mauritianus . Tetrahedron. 1994;50:2771–2784. [Google Scholar]
- Kawano T., Cui J., Koezuka Y., Toura I., Kaneko Y., Motoki K., Ueno H., Nakagawa R., Sato H., Kondo E. CD1d-restricted and TCR-mediated activation of valpha14 NKT cells by glycosylceramides. Science. 1997;278:1626–1629. doi: 10.1126/science.278.5343.1626. [DOI] [PubMed] [Google Scholar]
- Burdin N., Brossay L., Koezuka Y., Smiley S.T., Grusby M.J., Gui M., Taniguchi M., Hayakawa K., Kronenberg M. Selective ability of mouse CD1 to present glycolipidsalpha-galactosylceramide specifically stimulates V alpha 14+ NK T lymphocytes. J. Immunol. 1998;161:3271–3281. [PubMed] [Google Scholar]
- Brossay L., Naidenko O., Burdin N., Matsuda J., Sakai T., Kronenberg M. Structural requirements for galactosylceramide recognition by CD1− restricted NK T cells. J. Immunol. 1998;161:5124–5128. [PubMed] [Google Scholar]
- Singh N., Hong S., Scherer D.C., Serizawa I., Burdin N., Kronenberg M., Koezuka Y., Van Kaer L. Cutting edgeactivation of NK T cells by CD1d and alpha-galactosylceramide directs conventional T cells to the acquisition of a Th2 phenotype. J. Immunol. 1999;163:2373–2377. [PubMed] [Google Scholar]
- Carnaud C., Lee D., Donnars O., Park S.H., Beavis A., Koezuka Y., Bendelac A. Cutting edgeCross-talk between cells of the innate immune system: NKT cells rapidly activate NK cells. J. Immunol. 1999;163:4647–4650. [PubMed] [Google Scholar]
- Eberl G., MacDonald H.R. Selective induction of NK cell proliferation and cytotoxicity by activated NKT cells. Eur. J. Immunol. 2000;30:985–992. doi: 10.1002/(SICI)1521-4141(200004)30:4<985::AID-IMMU985>3.0.CO;2-E. [DOI] [PubMed] [Google Scholar]
- Eberl G., Lees R., Smiley S.T., Taniguchi M., Grusby M.J., MacDonald H.R. Tissue-specific segregation of CD1d-dependent and CD1d-independent NK T cells. J. Immunol. 1999;162:6410–6419. [PubMed] [Google Scholar]
- Denkers E.Y., Scharton-Kersten T., Barbieri S., Caspar P., Sher A. A role for CD4+ NK1.1+ T lymphocytes as major histocompatibility complex class II independent helper cells in the generation of CD8+ effector function against intracellular infection. J. Exp. Med. 1996;184:131–139. doi: 10.1084/jem.184.1.131. [DOI] [PMC free article] [PubMed] [Google Scholar]
- Schofield L., McConville M.J., Hansen D., Campbell A.S., Fraser-Reid B., Grusby M.J., Tachado S.D. CD1d-restricted immunoglobulin G formation to GPI-anchored antigens mediated by NKT cells. Science. 1999;283:225–229. doi: 10.1126/science.283.5399.225. [DOI] [PubMed] [Google Scholar]
- Apostolou I., Takahama Y., Belmant C., Kawano T., Huerre M., Marchal G., Cui J., Taniguchi M., Nakauchi H., Fournie J.J. Murine natural killer T (NKT) cells contribute to the granulomatous reaction caused by mycobacterial cell walls. Proc. Natl. Acad. Sci. USA. 1999;96:5141–5146. doi: 10.1073/pnas.96.9.5141. [DOI] [PMC free article] [PubMed] [Google Scholar]
- Cui J., Shin T., Kawano T., Sato H., Kondo E., Toura I., Kaneko Y., Koseki H., Kanno M., Taniguchi M. Requirement for valpha14 NKT cells in IL-12-mediated rejection of tumors. Science. 1997;278:1623–1626. doi: 10.1126/science.278.5343.1623. [DOI] [PubMed] [Google Scholar]
- Guidotti L.G., Ishikawa T., Hobbs M.V., Matzke B., Schreiber R., Chisari F.V. Intracellular inactivation of the hepatitis B virus by cytotoxic T lymphocytes. Immunity. 1996;4:25–36. doi: 10.1016/s1074-7613(00)80295-2. [DOI] [PubMed] [Google Scholar]
- McClary H., Koch R., Chisari F.V., Guidotti L.G. Relative sensitivity of hepatitis B virus and other hepatotropic viruses to the antiviral effects of cytokines. J. Virol. 2000;74:2255–2264. doi: 10.1128/jvi.74.5.2255-2264.2000. [DOI] [PMC free article] [PubMed] [Google Scholar]
- Guidotti L.G., McClary H., Moorhead Loudis J., Chisari F.V. Nitric oxide inhibits hepatitis B virus replication in the liver of transgenic mice. J. Exp. Med. 2000;191:1247–1252. doi: 10.1084/jem.191.7.1247. [DOI] [PMC free article] [PubMed] [Google Scholar]
- Guidotti L.G., Borrow P., Hobbs M.V., Matzke B., Gresser I., Oldstone M.B., Chisari F.V. Viral cross talkintracellular inactivation of the hepatitis B virus during an unrelated viral infection of the liver. Proc. Natl. Acad. Sci. USA. 1996;93:4589–4594. doi: 10.1073/pnas.93.10.4589. [DOI] [PMC free article] [PubMed] [Google Scholar]
- Cavanaugh V.J., Guidotti L.G., Chisari F.V. Inhibition of hepatitis B virus replication during adenovirus and cytomegalovirus infections in transgenic mice. J. Virol. 1998;72:2630–2637. doi: 10.1128/jvi.72.4.2630-2637.1998. [DOI] [PMC free article] [PubMed] [Google Scholar]
- Guidotti L.G., Rochford R., Chung J., Shapiro M., Purcell R., Chisari F.V. Viral clearance without destruction of infected cells during acute HBV infection. Science. 1999;284:825–829. doi: 10.1126/science.284.5415.825. [DOI] [PubMed] [Google Scholar]
- Guidotti L.G., Matzke B., Schaller H., Chisari F.V. High-level hepatitis B virus replication in transgenic mice. J. Virol. 1995;69:6158–6169. doi: 10.1128/jvi.69.10.6158-6169.1995. [DOI] [PMC free article] [PubMed] [Google Scholar]
- Dalton D.K., Pitts-Meek S., Keshav S., Figari I.S., Bradley A., Stewart T.A. Multiple defects of immune cell function in mice with disrupted interferon-γ genes. Science. 1993;259:1739–1742. doi: 10.1126/science.8456300. [DOI] [PubMed] [Google Scholar]
- Muller U., Steinhoff U., Reis L.F., Hemmi S., Pavlovic J., Zinkernagel R.M., Aguet M. Functional role of type I and type II interferons in antiviral defense. Science. 1994;264:1918–1921. doi: 10.1126/science.8009221. [DOI] [PubMed] [Google Scholar]
- Pfeffer K., Matsuyama T., Kandig T.M., Wakeham A., Kishihara K., Shahinian A., Wiegmann K., Ohashi P.S., Krinke M., Mak T.W. Mice deficient for the 55 kd tumor necrosis factor receptor are resistant to endotoxic shock, yet succumb to L. monocytogenes infection. Cell. 1993;73:457–467. doi: 10.1016/0092-8674(93)90134-c. [DOI] [PubMed] [Google Scholar]
- MacMicking J.D., Nathan C., Hom G., Chartrain N., Fletcher D.S., Trumbauer M., Stevens K., Xie Q.-W., Sokol K., Hutchinson N. Altered responses to bacterial infection and endotoxic shock in mice lacking inducible nitric oxide synthase. Cell. 1995;81:641–650. doi: 10.1016/0092-8674(95)90085-3. [DOI] [PubMed] [Google Scholar]
- Cobbold S.P., Martin G., Qin S., Waldmann H. Monoclonal antibodies to promote marrow engraftment and tissue graft tolerance. Nature. 1986;323:164–166. doi: 10.1038/323164a0. [DOI] [PubMed] [Google Scholar]
- Ledbetter J.A., Rouse R.V., Micklem H.S., Herzenberg L.A. T cell subsets defined by expression of Lyt-1,2,3 and Thy-1 antigens. Two-parameter immunofluorescence and cytotoxicity analysis with monoclonal antibodies modifies current views. J. Exp. Med. 1980;152:280–295. doi: 10.1084/jem.152.2.280. [DOI] [PMC free article] [PubMed] [Google Scholar]
- Vremec D., Zorbas M., Scollay R., Saunders D.J., Ardavin C.F., Wu L., Shortman K. The surface phenotype of dendritic cells purified from mouse thymus and spleeninvestigation of the CD8 expression by a subpopulation of dendritic cells. J. Exp. Med. 1992;176:47–58. doi: 10.1084/jem.176.1.47. [DOI] [PMC free article] [PubMed] [Google Scholar]
- Dialynas D.P., Quan Z.S., Wall K.A., Pierres A., Quintans J., Loken M.R., Pierres M., Fitch F.W. Characterization of the murine T cell surface molecule, designated L3T4, identified by monoclonal antibody GK1.5similarity of L3T4 to the human Leu-3/T4 molecule. J. Immunol. 1983;131:2445–2451. [PubMed] [Google Scholar]
- Laskin D.L., Pendino K.J. Macrophages and inflammatory mediators in tissue injury. Annu. Rev. Pharmacol. Toxicol. 1995;35:655–677. doi: 10.1146/annurev.pa.35.040195.003255. [DOI] [PubMed] [Google Scholar]
- Leo O., Foo M., Sachs D.H., Samelson L.E., Bluestone J.A. Identification of a monoclonal antibody specific for a murine T3 polypeptide. Proc. Natl. Acad. Sci. USA. 1987;84:1374–1378. doi: 10.1073/pnas.84.5.1374. [DOI] [PMC free article] [PubMed] [Google Scholar]
- Eberl G., MacDonald H.R. Rapid death and regeneration of NKT cells in anti-CD3epsilon- or IL-12-treated micea major role for bone marrow in NKT cell homeostasis. Immunity. 1998;9:345–353. doi: 10.1016/s1074-7613(00)80617-2. [DOI] [PubMed] [Google Scholar]
- Zeng Z., Castano A.R., Segelke B.W., Stura E.A., Peterson P.A., Wilson I.A. Crystal structure of mouse CD1an MHC-like fold with a large hydrophobic binding groove. Science. 1997;277:339–345. doi: 10.1126/science.277.5324.339. [DOI] [PubMed] [Google Scholar]
- Beckman E.M., Porcelli S.A., Morita C.T., Behar S.M., Furlong S.T., Brenner M.B. Recognition of a lipid antigen by CD1-restricted alpha beta+ T cells. Nature. 1994;372:691–694. doi: 10.1038/372691a0. [DOI] [PubMed] [Google Scholar]
- Sieling P.A., Chatterjee D., Porcelli S.A., Prigozy T.I., Mazzaccaro R.J., Soriano T., Bloom B.R., Brenner M.B., Kronenberg M., Brennan P.J. CD1-restricted T cell recognition of microbial lipoglycan antigens. Science. 1995;269:227–230. doi: 10.1126/science.7542404. [DOI] [PubMed] [Google Scholar]
- Gumperz J.E., Roy C., Makowska A., Lum D., Sugita M., Podrebarac T., Koezuka Y., Porcelli S., Cardell S., Brennner M.B., Behar S.M. Murine CD1d-restricted T cell recognition of cellular lipids. Immunity. 2000;12:211–221. doi: 10.1016/s1074-7613(00)80174-0. [DOI] [PubMed] [Google Scholar]
- Ganem D., Varmus H.E. The molecular biology of the hepatitis B viruses. Annu. Rev. Biochem. 1987;56:651–693. doi: 10.1146/annurev.bi.56.070187.003251. [DOI] [PubMed] [Google Scholar]
- Biron C.A., Nguyen K.B., Pien G.C., Cousens L.P., Salazar-Mather T.P. Natural killer cells in antiviral defensefunction and regulation by innate cytokines. Annu. Rev. Immunol. 1999;17:189–220. doi: 10.1146/annurev.immunol.17.1.189. [DOI] [PubMed] [Google Scholar]
- Lanier L.L. NK cell receptors. Annu. Rev. Immunol. 1998;16:359–393. doi: 10.1146/annurev.immunol.16.1.359. [DOI] [PubMed] [Google Scholar]
- Chisari F.V., Ferrari C. Hepatitis B virus immunopathogenesis. Annu. Rev. Immunol. 1995;13:29–60. doi: 10.1146/annurev.iy.13.040195.000333. [DOI] [PubMed] [Google Scholar]
- Wirth S., Guidotti L.G., Ando K., Schlicht H.J., Chisari F.V. Breaking tolerance leads to autoantibody production but not autoimmune liver disease in hepatitis B virus envelope transgenic mice. J. Immunol. 1995;154:2504–2515. [PubMed] [Google Scholar]
- Doherty D.G., Norris S., Madrigal-Estebas L., McEntee G., Traynor O., Hegarty J.E., O'Farrelly C. The human liver contains multiple populations of NK cells, T cells, and CD3+CD56+ natural T cells with distinct cytotoxic activities and Th1, Th2, and Th0 cytokine secretion patterns. J. Immunol. 1999;163:2314–2321. [PubMed] [Google Scholar]
- Norris S., Doherty D.G., Collins C., McEntee G., Traynor O., Hegarty J.E., O'Farrelly C. Natural T cells in the human livercytotoxic lymphocytes with dual T cell and natural killer cell phenotype and function are phenotypically heterogeneous and include Valpha24-JalphaQ and gammadelta T cell receptor bearing cells. Hum. Immunol. 1999;60:20–31. doi: 10.1016/s0198-8859(98)00098-6. [DOI] [PubMed] [Google Scholar]