

Abstract
Distinguishing between the development of functional potential in antigen-specific T helper (Th) cells and the delivery of these specialized functions in vivo has been difficult to resolve. Here, we quantify the frequency of cytokine-producing cells within the primary and memory B10.BR Th cell response to pigeon cytochrome c (PCC). In vitro analysis of acquired functional potential indicated no Th1/Th2 cytokine polarity at the peak of the primary response with surprisingly little evidence for the selective preservation of interleukin (IL)-2, tumor necrosis factor (TNF)-α, IL-4, and interferon (IFN)-γ potentials into the memory compartment. However, the expression of these functional potentials appears tightly regulated in vivo. The staggered appearance of primary response cytokines directly ex vivo contrasts markedly with their rapid coordinate expression in the memory response. Frequencies of IL-2–, TNF-α–, IFN-γ–, and IL-10–expressing memory responders increased over their primary response counterparts, but were still markedly lower than revealed in vitro. IL-4–, IFN-γ–, and IL-10–expressing Th cells remained at low but stable frequencies over the first 6 d of the memory response. Analysis of T cell receptor β chain sequences of IL-4– and TNF-α–expressing PCC-specific Th cells provides evidence for early functional commitment among clonal progeny. These data indicate that the development of functional potential is a consequence of initial antigen experience, but delivery of specialized functions is differentially regulated in primary and memory immune responses.
Keywords: immunological memory, cytokines, antigen-specific immunity, helper T cells, T cell receptor
Introduction
Memory Th cells are critical regulators of long-term protective immunity. The cardinal sign of a memory Th cell response is the accelerated emergence of antigen-specific Th cells upon antigen rechallenge in vivo 1 2 3 4. In the B10.BR response to pigeon cytochrome c (PCC), clonal expansion in the memory response reaches maximal levels 4 d faster than seen after initial antigen priming 3 4. These memory responders express restricted V region genes (Vα11Vβ3) with TCR junctional features known to confer peptide specificity 5 6 7 8. Selection of these PCC-specific Th cells with preferred TCR occurs rapidly after initial priming, they are propagated through clonal expansion, and then are preserved as precursors for the memory response 3 4. Antigen-experienced Th cells rapidly produce cytokines at lower doses of antigen, displaying lowered requirements for costimulation 9 10 11. This rapid appearance of effector Th cell function and increased levels of cytokines accompany accelerated cellular expansion in the memory response 1 2 12 13 14. Thus, antigen-specific Th cells that have committed to the production of preferred cytokines may be selectively retained in the memory compartment.
Naive Th cells produce a limited range of cytokines with mitogen stimulus in vitro. Upon exposure to antigen in vivo, Th cells can commit to the production of many different cytokines through preexisting intrinsic mechanisms 15 16 17 18 and are influenced to varying degrees by extrinsic factors that induce transcriptional 19 20 21 and heritable locus-specific genetic changes 16 22 23. The patterns of functional commitment were initially classified into Th cells that produced either type 1 (IL-2, TNF-β, IFN-γ) or type 2 (IL-4, IL-5, IL-6, IL-10) cytokines, with some cytokines found in both (IL-3 and TNF-α) 24 25. There are now many exceptions to this initial Th1/Th2 schematic 26 27 28 29 30, with gene expression patterns at the single cell level being more consistent with independent cytokine gene regulation 31 32. Distinguishing between this development of functional potential as a consequence of antigen experience and the expression of these potentials as effector functions in vivo has not been adequately addressed. Cytokine production is still generally assessed after short-term restimulation in vitro 1 2 12 26 33. Even sensitive enzyme-linked immunospot assays require an antigen pulse to reveal cytokine production in vitro 34 35. These short-term restimulation assays exaggerate the frequencies of cells expressing cytokine mRNA directly ex vivo 36 37. TCR transgenic Th cells have been elegantly used to monitor specific Th cell responses 12 13 33 38, and frequency estimates for cytokine mRNA expression directly ex vivo are very low, even in memory responses using these models 13. Therefore, it still remains unclear whether cytokine production in vivo is regulated by controlling the numbers of antigen-specific Th cells committed to particular functions or through the differential expression of their functional potentials.
In this study, we analyze cytokine production in single PCC-specific Th cells from B10.BR mice. A great deal is known about the cellular dynamics of the PCC-specific primary and memory response 3 4 5, the TCR structure and affinity for antigen 6 7 8 39, the kinetics of clonal selection, and the preservation of clonal dominance in this response 3 4 8. Although it is possible to isolate PCC-specific Th cells using moth cytochrome c (MCC)/I-Ek tetramers (39; and McHeyzer-Williams, L.J., unpublished results), these reagents effectively cross-link the TCR and hence are not ideal for subsequent analysis of function 40. We use an alternate cell purification strategy with anti-TCR antibodies (anti-Vα11Vβ3) and comodulation of cell surface molecules (CD44 upregulation and CD62L downregulation) that isolates PCC-specific Th cells regardless of TCR affinity for peptide–MHC 3 4 and does not induce calcium transients during cell preparation and isolation (41. Further, we use whole protein antigen and a nondepot adjuvant system (Ribi, an LPS derivative in a metabolizable oil) that efficiently induces high titer antibody responses with isotype switch to IgG1, IgG2a/2b, and IgE 42 43. Hence, the activity of the PCC-responsive Th cells is focused in the draining LNs to induce (a) Th cell proliferation, implicating IL-2 and TNF-α expression 44 45; (b) isotype switch in B cells, implicating IL-4 and IFN-γ expression 46 47; and (c) efficient antibody secretion by plasma cells, implicating IL-6 and IL-10 expression 48 49 50.
Using short-term mitogen stimulation in vitro and a single cell reverse transcription (RT)-PCR assay for expression of cytokine mRNA directly ex vivo, we provide direct quantitative analysis of cytokine production in PCC-specific Th cells. The mitogen restimulation assay provides one indication of antigen-driven commitment to function, and the RT-PCR assay quantifies the frequency of PCC-specific cells that actually express a particular function at any specified time during the immune response. Surprisingly, there was no change in the functional potential of PCC-specific Th cells between the peak of the primary response and the peak of the memory response for IL-2, TNF-α, IL-4, and IFN-γ. Further, there were relatively low frequencies of PCC-specific cells committed to produce IL-4, IFN-γ, and IL-10 as a consequence of initial antigen experience. The expression of cytokines directly ex vivo varied in frequency and kinetics between primary and memory response. The primary cytokine response to PCC was dominated by IL-4+ (day 9: 10.2 ± 4.6%), some TNF-α+ (day 9: 2.7 ± 1.2%), very few IFN-γ+ (day 9: 0.4 ± 0.4%), and sporadic IL-10+ and IL-6+ Th cells directly ex vivo. In the memory response, IL-2+, TNF-α+, IL-4+, IFN-γ+, and IL-10+ PCC-specific Th cells emerged rapidly after recall, with no evidence for IL-6+ cells. Frequencies for IL-4+ Th cells remained the same while all the other expressed cytokines increased in prevalence. Thus, expression of preferred memory function is not simply a reflection of the increased functional capacity of the memory Th cells; rather, their accelerated expression and increased prevalence appear differentially regulated by the microenvironment of the memory response.
Materials and Methods
Animals and Immunization.
5–8-wk-old B10.BR mice were purchased from The Jackson Laboratory and housed in pathogen-free conditions at the Duke University Vivarium. Mice were immunized with 400 μg whole PCC (Sigma-Aldrich) in PBS emulsified with 200 μl Ribi adjuvant (Ribi ImmunoChem Research, Inc.) by two injections at each side of the base of tail. To examine a secondary response, mice were rechallenged 8 wk after the primary immunization with the same 400 μg PCC in 200 μl Ribi adjuvant.
Flow Cytometry.
For population and single cell analysis of cytokine expression by RT-PCR, mice were killed at different days after immunization. The inguinal and periaortic LNs were removed, and red blood cells were lysed with 0.17 M NH4Cl. The remaining cells were resuspended in PBS containing 5% FCS and stained at 2 × 10⁸ cells/ml with the appropriate concentrations of antibodies. For sorting of PCC-specific Th cells, LN cells were stained with Cy5PE-53-6.7 (anti-CD8; BD PharMingen), Cy5PE-M1/70.15 (anti-CD11b; Caltag), Cy5PE-6B2 (anti-B220; BD PharMingen), FITC-RR8.1 (anti-Vα11; BD PharMingen), allophycocyanin (APC)-KJ25 (anti-Vβ3), PE-Mel14 (anti-CD62L; BD PharMingen), and biotin-IM7 (anti-CD44; BD PharMingen). For MCC/I-Ek tetramer staining (a gift from M.M. Davis and J.D. Altman, Stanford University, Palo Alto, CA), the anti-Vβ3 was replaced with a PE–tetramer conjugate used with the same combination of antibodies outlined above with Texas red (TR)-Mel14 and APC-IM7 on different fluorophores (accounting for slightly different mean fluorescence intensities). After washing twice with PBS containing 5% FCS, the cells were stained at 2 × 10⁸ cells/ml with streptavidin-TR (BD PharMingen). Cells were washed and resuspended in PBS containing 5% FCS and 2 μg/ml propidium iodide to label dead cells. The cells were analyzed using a dual laser modified FACStarPLUS™ (Becton Dickinson) capable of seven parameter simultaneous collection then analyzed using FlowJo software (Treestar) as described previously 4.
In Vitro Activation.
To examine the cytokine-expressing potential of PCC-specific Th cells, cells were isolated from the inguinal and periaortic LNs of B10.BR mice at day 9 of the primary response and day 3 of the secondary response. After red cell lysis and resuspension in PBS containing 5% FCS, cells were cultured at 2 × 10⁶ cells/ml in RPMI 1640 (GIBCO BRL) containing 10% FCS with or without 50 ng/ml PMA (Sigma-Aldrich) and 500 ng/ml ionomycin (Sigma-Aldrich) for 4 h at 37°C. Brefeldin A (5 μg/ml; Sigma-Aldrich) was added at the start of the culturing. Cells were washed with PBS containing 5% FCS and resuspended in the same with 10 μg/ml brefeldin A added. Cells were stained for analysis by flow cytometry (see above).
To compare the frequency of CD4+ T cells expressing IL-2, IFN-γ, or TNF-α determined by intracellular staining and RT-PCR (see Fig. 3), spleen cells from unimmunized B10.BR mice were isolated and activated in vitro with PMA and ionomycin as described above. To compare the frequency of cells expressing IL-4 or IL-10, C57BL/6 mice were immunized intraperitoneally with 400 μg NP-KLH in Ribi adjuvant and killed 7 d later. Spleen cells were isolated and activated in vitro with PMA and ionomycin as described above. Cells were harvested and stained for analysis by flow cytometry.
Figure 3.
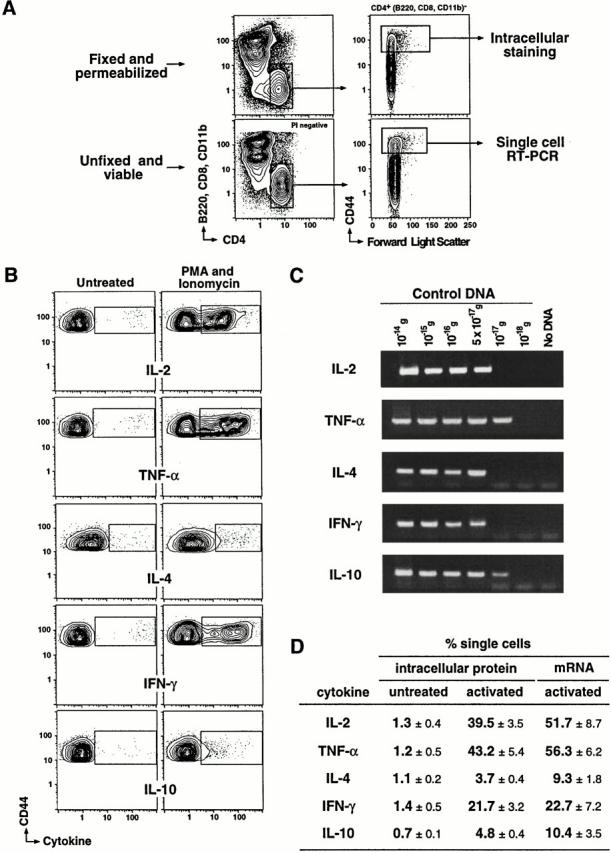
Single cell sensitivity of the RT-PCR assay. (A) Spleen cells from unimmunized B10.BR or C57BL/6 mice were isolated and activated with PMA and ionomycin as described in Materials and Methods. Activated cells were stained with Cy5PE-53-6.7 (anti-CD8), Cy5PE-M1/70.15 (anti-CD11b), Cy5PE-6B2 (anti-B220), TR–Pgp-1(anti-CD44), and FITC–CT-CD4 (anti-CD4). One half of the spleen cells was fixed, permeabilized, and stained for intracellular cytokines. Intracellular cytokines were evaluated in the total CD44hiCD4+ cell population (B220, CD8, and CD11b negative). The remaining half of the spleen cells was kept unfixed. Single CD44hiCD4+ cells were isolated using the same gating scheme as used for the fixed spleen cells and were sorted directly into cDNA reaction mix and analyzed by RT-PCR. (B) Representative probability contours of CD4+ spleen cells cultured with and without PMA and ionomycin and stained for intracellular cytokines are shown. The cells cultured without PMA and ionomycin acted as a negative control for the intracellular staining. The analysis of IL-2, TNF-α, and IFN-γ and the IL-4 and IL-10 expression were obtained in separate experiments. (C) Cloned cytokine DNA was quantified, by OD260, titrated, and subjected to two rounds of nested PCR using optimized PCR primers and conditions. PCR products from each dilution are shown. The approximate numbers of single strand molecules of input DNA in the highest detectable dilution for each cytokine are as follows: 50 molecules of TNF-α control DNA, 300 molecules of IL-4 DNA, 200 molecules of IFN-γ DNA, 50 molecules of IL-10 DNA, and 400 molecules of IL-6 DNA (data not shown). These numbers are calculated using the size of input DNA and the quantity of DNA added to the PCR reaction. (D) The frequencies of cells with detectable cytokine expression determined by intracellular staining and RT-PCR are compared. The proportion of PMA and ionomycin–treated CD4+CD44hi cells (mean ± SEM) that stained positively for each cytokine is shown. The mean percentages of CD4+CD44hi cells (± SEM) cultured with PMA and ionomycin with detectable cytokine message are also shown. The frequencies were obtained from three separate experiments.
Intracellular Staining for Cytokines.
Cells were stained for intracellular cytokines using the protocol described by Openshaw et al. 29. Cells cultured with or without PMA and ionomycin were stained for surface antigens at a concentration of 2 × 10⁸ cells/ml. To evaluate the cytokine-expressing potential of antigen-specific cells, cultured LN cells from day 9 of the primary response or day 3 of the memory response were stained with Cy5PE-53-6.7 (anti-CD8; BD PharMingen), Cy5PE-M1/70.15 (anti-CD11b; Caltag), Cy5PE-6B2 (anti-B220; BD PharMingen), FITC-RR8.1 (anti-Vα11; BD PharMingen), APC-KJ25 (anti-Vβ3), and TR–Pgp-1 (anti-CD44). After surface staining, cells were fixed for 20 min with 2% formaldehyde, then permeabilized in PBS containing 5% FCS, 1% BSA (Boehringer), and 0.5% saponin (Sigma-Aldrich) for 10 min. Cells were stained in this permeabilization buffer with PE-conjugated antibodies directed toward each cytokine: PE-S4B6 (anti–IL-2), PE–MP6-XT22 (anti–TNF-α), PE-XMG1.2 (anti–IFN-γ), PE–BVD4-1D11 (anti–IL-4), and PE–JES5-16E3 (anti–IL-10) (all reagents were purchased from BD PharMingen). After washing twice with PBS/FCS/BSA/saponin, cells were washed with PBS/FCS/BSA then resuspended in PBS with 5% FCS and analyzed by flow cytometry.
To compare the frequency of CD4+ T cells expressing each cytokine as determined by intracellular staining and RT-PCR, cultured spleen cells were stained with Cy5PE-53-6.7 (anti-CD8; BD PharMingen), Cy5PE-M1/70.15 (anti-CD11b; Caltag), Cy5PE-6B2 (anti-B220; BD PharMingen), TR–Pgp-1 (anti-CD44), and FITC–CT-CD4 (anti-CD4; Caltag). One half of the stained cells remained on ice until cell sorting. The remainder of the stained cells were fixed, permeabilized, and stained for intracellular cytokines as described above.
cDNA Synthesis.
Cells with the appropriate surface phenotype, 100 or 200 cells for population analysis or single cells, were sorted directly into 5 μl of an oligo d(T)–primed cDNA reaction mixture. This reaction mixture contained 4 U/ml MLV-RT (GIBCO BRL) with its recommended 1× buffer, 0.5 nM spermidine (Sigma-Aldrich), 100 μg/ml BSA (Boehringer), 10 ng/μl oligo d(T) (Becton Dickinson), 200 μM each dNTP (Boehringer), 1 mM dithiothreitol (Promega), 220 U/ml RNAsin (Promega), 100 μg/ml Escherichia coli tRNA (Boehringer), and 1% Triton X-100. cDNA was synthesized immediately at 37°C for 90 min then stored at −80°C until further use. Single cells were sorted into cDNA reaction mix in low profile, 72-well microtiter trays (Robbins Scientific) using the automatic cell dispensing unit (ACDU) attached to the FACStarPLUS™ (Becton Dickinson) and Clone-Cyt™ software (Becton Dickinson).
Nested PCR.
PCR conditions were optimized for each cytokine. 2.5–5.0 μl of cDNA was added to a reaction mixture containing 2 U/ml Taq polymerase and corresponding 1× reaction buffer (Promega), 0.4 mM dNTPs (Boehringer), and 0.4 μM of each external primer (Genosys; as listed in Table ). The first PCR reaction consisted of 5 min at 95°C, 40 cycles of 95°C for 15 s, 50°C for 45 s, and 72°C for 90 s, followed by 5 min at 72°C. 1.0 μl of this first reaction mixture was transferred to a second reaction containing 2 U/ml Taq polymerase and corresponding 1× reaction buffer (Promega), 0.2 mM dNTPs (Boehringer), and 0.8 μM of each internal primer (Genosys). The second PCR reaction consisted of 5 min at 95°C, 35 (IL-4, IL-6, IL-10, TNF-α, and actin) or 40 (IL-2 and IFN-γ) cycles of 95°C for 15 s, 55°C for 45 s, and 72°C for 90 s, followed by 5 min at 72°C. PCR product was viewed on a 2% agarose gel stained with ethidium bromide. cDNA was analyzed for the presence of actin to control for the accuracy of cell sorting. If the frequency of actin-positive cell samples dropped below 65%, the calculated frequency of cytokine producing cells was adjusted. This occurred in 6/33 plates sampled for actin.
Table 1.
Primer Sets for Cytokine PCR (5′–3′)
| IL-2 | Ext S | CTCGCATCCTGTGTCACATGG | IFN-γ | Ext S | GGCTGTTTCTGGCTGTTACTG |
|---|---|---|---|---|---|
| Ext A | CTCGCATCCTGTGTCACATGG | Ext A | TTGTTACTATAAATACTTCTTTGG | ||
| Int S | CTACAGCGGAAGCACAGCAG | Int S | CCCCACCCCGAATCAGCAGCGACTC | ||
| Int A | GCACTCAAATGTGTTGTCAG′ | Int A | TCTGGAGGAACTGGCAAAAGGATGG | ||
| IL-4 | Ext S | CATCCTGCTCTTCTTTCTCG | TNF-α | Ext S | CGTGGAACTGGCAGAAGAGG |
| Ext A | GTACTACGAGTAATCCATTTG | Ext A | GGGGCAGGGGCTCTTGACGGC | ||
| Int S | CACTTGAGAGAGATCATCGG | Int S | CTTCCAGAACTCCAGGCGGTG | ||
| Int A | CTTTCAGTGATGTGGACTTGG | Int A | GCTGACGGTGTGGGTGAGGAG | ||
| IL-6 | Ext S | CATCCAGTTGCCTTCTTGGG | Actin | Ext S | GACCCTGAAGTACCCCATTG |
| Ext A | TCCTTAGCCACTCCTTCTGTG | Ext A | GTAATCTCCTTCTGCATCCTG | ||
| Int S | CTTCCCTACTTCACAAGTCCG | Int S | GGGACGACATGGAGAAGATC | ||
| Int A | TTGGAAATTGGGGTAGGAAGG | Int A | AGGTCTTTACGGATGTCAACG | ||
| IL-10 | Ext S | CTATGCTGCCTGCTCTTACT | |||
| Ext A | GTAGACACCTTGGTCTTGGAG | ||||
| Int S | CTGCGGACTGCCTTCAGCCAG | ||||
| Int A | TTCACCTGCTCCACTGCCTTG |
Ext S, external primer (sense); Ext A, external primer (antisense); Int S, internal primer (sense); Int A, internal primer (antisense).
TCR Sequencing.
To assess the Vβ3 TCR sequence from cells expressing IL-4 or TNF-α, one half of the cDNA from a single cell sorted at day 9 of the primary response was analyzed for the presence of each cytokine. If the cells expressed either cytokine, the remaining cDNA was amplified with primers specific for Vβ3 and sequenced as described 4. In brief, 2.5 μl of cDNA was added to a reaction mixture containing 2 mM MgCl2, 0.1 mM of each dNTP, 2 U/ml Taq polymerase with 1× buffer, 0.4 μM sense primer (5′-ATGGCTACAAGGCTCCTCTGGTA-3′), and 0.4 μM antisense primer (5′-CACGTGGTCAGGGAAGAA-3′). 1 μl of the first PCR reaction was transferred to a second reaction containing 2 mM MgCl2, 0.1 mM of each dNTP, 2 U/ml Taq polymerase with 1× buffer, 0.4 μM sense primer (5′-AATCTGCAGAATTCAAAAGTCATTCA-3′), and 0.4 μM antisense primer (5′-AATCTGCAGCACGAGGGTAGCCTTTTG-3′). cDNA was added to a reaction mixture containing 4 μl Dye Terminator Ready Reaction Mix (PerkinElmer), and 1.5 pmol primer (5′-CTGTGCTGAAGTGTCCTTCAAAC-3′) and amplified for 25 cycles of 96°C for 10 s, 50°C for 5 s, and 60°C for 4 min. Samples were separated on a 6.5% acrylamide gel in an ABI 373 sequencing system and analyzed using the ABI Prism sequence 2.1.2 software (Applied Biosystems). The clone names describe the cell the TCR sequence was obtained from, the response (P = primary), the day (day 9), the animal, and the sample number.
Results
Isolating PCC-specific Th Cells.
To purify PCC-specific Th cells directly ex vivo, we used a five-color flow cytometric strategy that has been described in detail elsewhere 4 51. In brief, we focused on Vα11+Vβ3+ Th cells in the draining LNs that have upregulated CD44 and downregulated CD62L in response to antigen (Fig. 1 A). By day 5 of the primary response, >80% of these cells express highly restricted CDR3 regions that exhibit the canonical attributes of peptide specificity 4. No such population emerges in response to adjuvant only or in response to an irrelevant protein antigen such as hen egg lysozyme (4 51; data not shown). Repertoire studies using direct staining with MCC/I-Ek tetramers have validated the V region–based strategy used in this study (McHeyzer-Williams, L.J., unpublished results). The great majority of Vα11+ MCC/I-Ek tetramer–binding cells (>75%) at the end of the first week after priming have upregulated CD44 and downregulated CD62L (one example displayed in Fig. 1 B). These Vα11+ tetramer-binding cells express similar CDR3 restriction, with canonical features associated with PCC specificity as seen with the V region–based strategy. As described above, these tetramers are known to cross-link TCR and deliver signals to the Th cells, and hence have not been used for the subsequent analysis of function. Further, using the V region–based strategy, antigen-specific Th cells can be isolated directly ex vivo regardless of their affinity for peptide–MHC complexes.
Figure 1.

Isolating PCC-specific Th cells directly ex vivo. (A) B10.BR mice were immunized with 400 μg PCC in Ribi adjuvant. Cells from the draining LNs were stained with Cy5PE-53-6.7 (anti-CD8), Cy5PE-M1/70.15 (anti-CD11b), Cy5PE-6B2 (anti-B220), FITC-RR8.1 (anti-Vα11), APC-KJ25 (anti-Vβ3), PE-Mel14 (anti-CD62L), and biotin-IM7 (anti-CD44) as described in Materials and Methods. Forward and obtuse light scatter gates were used to exclude neutrophils and macrophages but include T cell blasts. Cells stained with propidium iodide (PI) are excluded in the Cy5PE channel at acquisition. A representative probability contour of Vα11/Vβ3–expressing T cells from an unimmunized animal (Day 0) and an animal immunized 7 d earlier (Day 7) are shown. Vα11/Vβ3-expressing T cells that have upregulated CD44 and downregulated CD62L at each time point are displayed in the small insert box. (B) LN cells from B10.BR mice labeled with MCC/I-Ek tetramers on day 8 after priming as described above. KJ25 (anti-Vβ3) blocks MCC/I-Ek labeling and so cannot be used together with the tetramer. 5% probability contours display 3.5% of cells binding MCC/I-Ek tetramers within the Vα11+ LN cells (1.8% of LN cells; >95% CD4). 80% of Vα11+MCC/I-Ek+ cells are CD44hiCD62Llo (right panel) and express CDR3 regions typical of antigen binding (McHeyzer-Williams, L.J., unpublished results).
Establishing Cytokine-producing Potential In Vivo.
We first examined the cytokine-producing potential of PCC-specific primary responders (Fig. 2 A, Vα11+Vβ3+ cells that upregulate CD44). We focused analysis on PCC-specific Th cells from day 9 of the primary response, 2 d after peak cell expansion in vivo and before any significant local decline of specific cells. Short-term antigen stimulation in vitro leads to rapid loss of TCR, which obscures our ability to isolate the PCC-specific Th cells and hence could not be used in this study. We used short-term mitogen stimulus in vitro to avoid the influence of antigen dose, TCR affinity, or extensive culturing on the pattern of cytokines produced (Fig. 2 B displays examples of the intracellular cytokine label). These mitogenic stimuli deliver powerful signals over 4 h in vitro, independent of TCR or particular costimulatory requirements of the target cells. Background staining for each reagent was estimated using PCC-specific Th cells that were cultured without mitogen (Fig. 2 B). Representative probability contours indicate low background staining and the varied efficacy of mitogen treatment for the induction of IL-2, TNF-α, IL-4, IFN-γ, and IL-10 in the target population (Fig. 2 B; summarized in C and D). Similar fluorescence ranges for negative staining were seen in CD44loVα11+Vβ3+ cells (non–PCC-specific naive) and helped to define background staining for the reagents (data not shown; frequencies displayed in Fig. 2 C). Since CD44 levels do not change during the 4 h of culture with PMA and ionomycin (28.0 ± 3.6% with PMA and ionomycin and 30.8 ± 1.2% without), the Vα11+Vβ3+CD44hi cells are PCC specific cells primed in vivo, and the Vα11+Vβ3+CD44lo cells are naive non–PCC specific Th cells.
Figure 2.
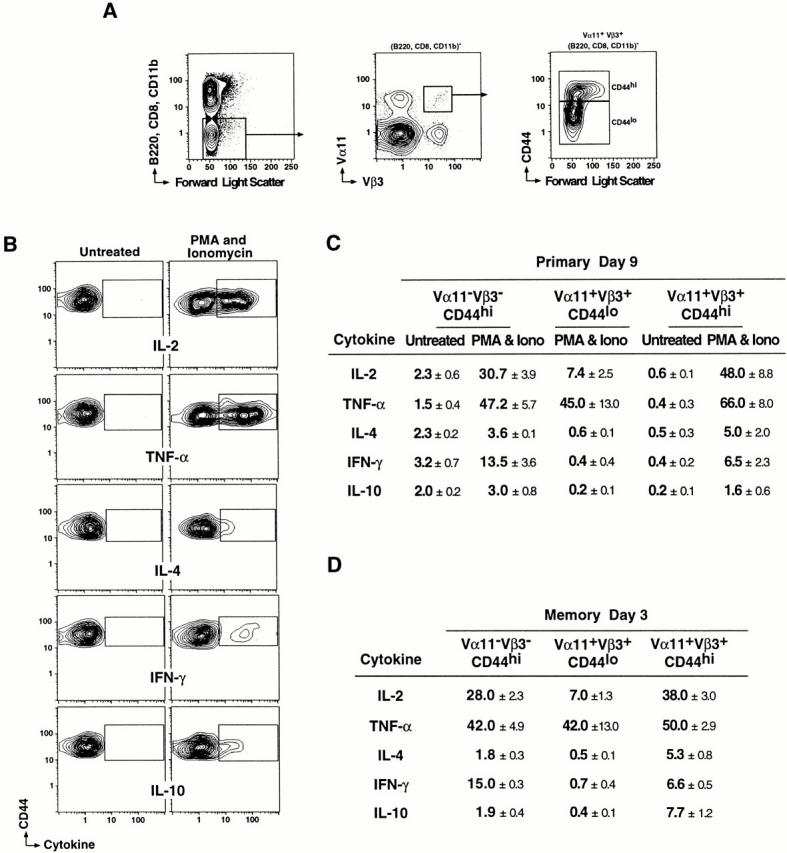
Cytokine-expressing potential of PCC-specific primary and memory responders. (A) Cells from draining LNs of B10.BR mice at day 9 of a primary response or day 3 of a memory response to PCC were isolated and cultured with or without PMA and ionomycin. Cells were stained with Cy5PE-53-6.7 (anti-CD8), Cy5PE-M1/70.15 (anti-CD11b), Cy5PE-6B2 (anti-B220), FITC-RR8.1 (anti-Vα11), APC-KJ25 (anti-Vβ3), PE-Mel14 (anti-CD62L), and TR–Pgp-1(anti-CD44), then fixed, permeabilized, and stained for intracellular cytokines. The cells analyzed for cytokine expression did not express B220, CD11b, or CD8 but expressed both Vα11 and Vβ3 TCR subunits. Cells expressing low and high levels of CD44 were analyzed for intracellular cytokine staining as were the total Vα11−Vβ3− cell population. (B) Representative 5% probability contours of Vα11/Vβ3-expressing cells with high levels of CD44 expression cultured with and without PMA and ionomycin and stained for intracellular cytokines are shown. The probability contours for the cells cultured without PMA and ionomycin were used to determine the gates for cells expressing each cytokine. (C) The table shows the percentage of cells (± SEM) from day 9 of the primary response that stained positively for each cytokine after in vitro activation with PMA and ionomycin (Iono). As CD44 levels do not change during the 4 h of culture, the Vα11+Vβ3+ CD44hi population of cells are the PCC-specific cells primed in vivo, and the Vα11+Vβ3+ CD44lo cells are naive non–PCC-specific Th cells. The Vα11−Vβ3− CD44hi cells are most likely antigen-experienced cells that are not PCC specific but appear responsive to mitogen. The frequency of Vα11+Vβ3+ CD44lo cells (mean ± SEM) from day 9 cultured without PMA and ionomycin (Untreated) that stained positively for each cytokine was <0.5%. Data represent three separate experiments. (D) The table shows the percentage of cells (mean ± SEM) within the PCC-specific and nonspecific subpopulations from day 3 of the memory response that stained positively for each cytokine after in vitro PMA and ionomycin treatment. The frequency of cells cultured in the absence of PMA and ionomycin that stained positively for each cytokine ranged from 0.1 to 1.0%.
The majority of antigen-experienced Th cells produced IL-2 and/or TNF-α with only a minor compartment producing IL-4, IFN-γ, and IL-10 upon PMA and ionomycin activation. This pattern of cytokine-producing potential in PCC-specific cells can be attributed to antigen experience for IL-2, IL-4, IFN-γ, and IL-10 production, with clear differences from the naive non–PCC-specific Th cells (Vα11+Vβ3+CD44lo Th cells that do not express PCC-specific CDR3 regions; Fig. 2 C). These naive non–PCC-specific cells contained similar numbers of TNF-α–producing cells, but far fewer IL-2–producing cells and no IL-4–, IFN-γ–, or IL-10–producing cells. Further, there was no evidence for Th1/Th2 polarity within the PCC-specific Th cells, with similar frequencies of IL-4– and IFN-γ–producing cells. Therefore, this short-term mitogen restimulation assay provided a distinct and quantitative signature of the mitogen-induced cytokine-producing potentials for PCC-specific Th cells with high level IL-2 and TNF-α–producing capacity, low IL-4, IFN-γ, and IL-10, and no Th1/Th2 polarity.
We next turned to the PCC-specific memory response to ask whether there was an enrichment for preferred cytokine-producing potential. Animals were rested for 8 wk after initial priming and then boosted with a second priming dose of antigen in adjuvant. We have shown previously that PCC-specific clonal expansion in this memory response is accelerated and reaches similar peak cell numbers by day 3 in the draining LNs, with no evidence for significant decline in specific cells until day 6 of the memory response (reference 3; see Fig. 4 A). The frequencies of cytokine-expressing cells in the total CD44hi cells (>85% CD4+Vα11−Vβ3−) and the memory PCC-specific compartment (CD44hiVα11+Vβ3+) were significantly different for IL-2 (P = 0.03), IL-4 (P = 0.01), IFN-γ (P = 0.0001), and IL-10 (P = 0.01). These data argue further for a distinctive signature of mitogen-induced cytokine-producing potential associated with PCC responsiveness versus the total antigen-experienced pool (total CD44hi cells). Considering the PCC-specific Th cell compartment, there was no increase in the frequency of IL-2, TNF-α, IL-4, or IFN-γ producers between the peak of the memory response (Fig. 2 D) and the peak of the primary response (Fig. 2 C). IL-10 was an exception, with significantly greater frequencies at day 3 of the memory response (P = 0.01). Thus, the expanded population of PCC-specific memory response Th cells contains frequencies of cells with mitogen-induced cytokine-producing potentials similar to its primary response counterpart population.
Figure 4.
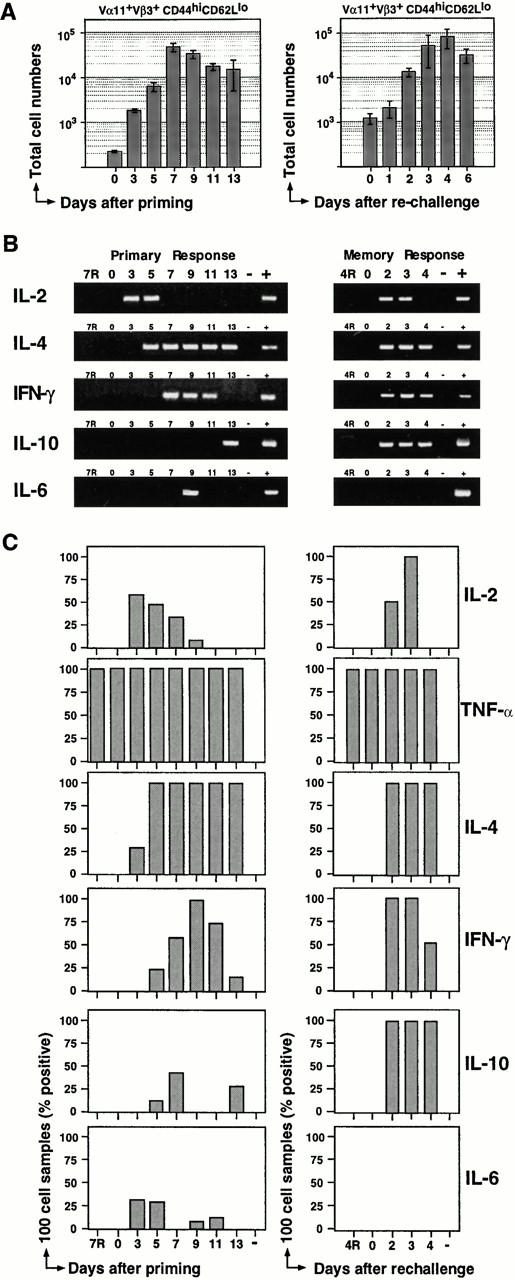
Kinetics of PCC-specific cytokine mRNA expression directly ex vivo. (A) The frequency of CD44hiCD62Llo Vα11/Vβ3-expressing T cells and total cell numbers within the LNs for the corresponding animal were used to calculate the total number of PCC-specific Th cells over the course of the primary (left) and memory (right) response. The mean (± SEM) for two to five animals are shown at each time point. (B) cDNA was synthesized from 100 CD44hiCD62Llo Vα11/Vβ3-expressing Th cells sorted at each time point of the primary and secondary responses (days 3–13 after the primary and days 2–4 after the memory immunization). After two rounds of nested PCR, PCR products were viewed by ethidium bromide–stained agarose gels. PCR products, representative of two or three experiments, are shown for each time point. Naive Vα11/Vβ3-expressing Th cells (CD44loCD62Lhi) were also sorted at each time point and analyzed for each cytokine. Results of this analysis are represented for day 7 of the primary response (7R) and day 4 of the memory response (4R). Lane −, PCR samples that did not contain cDNA; lane +, PCR samples that contained cloned cytokine cDNA that was analyzed as a positive control for size. (C) A summary of the RT-PCR analysis of 100 cell samples is presented. Each graph shows the percentage of samples that resulted in a product after two rounds of PCR. Two to seven samples were analyzed at each time point for the presence of each cytokine. Samples labeled 7R (day 7, primary), 4R (day 4, memory), and day 0 contained cells with the CD44loCD62Lhi, resting phenotype. Lane −, samples that did not contain cDNA.
Cytokine mRNA Expression at the Single Cell Level.
Although mitogen responsiveness in vitro reveals some aspects of functional potential in the antigen-specific compartment, it does not accurately represent the pattern of cytokine expression in vivo. It was also clear from the untreated controls in the previous experiments (Fig. 2 B) that the intracellular staining for cytokine proteins was not sensitive enough to detect the presence of cytokine protein in individual cells directly ex vivo. Further, when T cells stimulated by antigen and antigen-presenting cells in vitro are dissociated from the antigen-presenting cells, they stop secreting cytokines. This may also occur when single cell suspensions are prepared from LNs of immunized animals, although this has not been tested directly. For these reasons, we chose to focus on cytokine mRNA expression directly ex vivo. We also took care to process all cell samples at 4°C to minimize mRNA degradation. Therefore, to evaluate the frequency of PCC-specific Th cells expressing cytokine mRNA directly ex vivo, we developed a single cell RT-PCR assay for a spectrum of T cell–derived cytokines.
To evaluate the sensitivity of the RT-PCR assays, we compared the frequency of mitogen-induced cytokine-producing CD44hi Th cells (regardless of TCR expression) using intracellular staining for protein by flow cytometry to the frequencies obtained after single cell sorting and RT-PCR (Fig. 3 A). Representative probability contours indicate low background staining and the varied efficacy of mitogen treatment for induction of IL-2, TNF-α, IL-4, IFN-γ, and IL-10 in the target population (Fig. 3 B; summarized in D, first two columns). The sensitivity of the PCR reaction across the different cytokine targets was similar on cloned cDNA, detecting between 50 and 300 cDNA molecules (Fig. 3 C; details in the figure legend). Interestingly, the frequency of IFN-γ–producing CD4+ cells appeared higher for these splenic samples than the estimates in the draining LNs (Fig. 2). More importantly, the frequency of single cells that expressed mRNA for each of the different cytokines was similar to the frequency of cells expressing cytokine protein as assessed by flow cytometry (Fig. 3 D; compare last two columns). The RT-PCR assay for IL-4 and IL-10 appeared somewhat more sensitive than the flow cytometric assay (most likely due to the low level of protein produced under these culture conditions; see flow profiles in Fig. 3 B). Overall, the RT-PCR assay was reliable to the single cell level and the presence of mRNA correlated well with production of protein.
Kinetics of Cytokine mRNA Expression In Vivo.
We next sorted small populations of PCC-specific Th cells (100–200 cell samples) across the primary response (as depicted in Fig. 4 A) to assess the emergence and decline of cells expressing a range of cytokine mRNA. As the RT-PCR assay was sensitive to the single cell level, a negative sample would represent a frequency of <1%, which would not be pursued further at the single cell level. As assessed in the small populations, cytokine mRNA appearance was staggered over the first week of the primary response (Fig. 4B and Fig. C). This pattern is best illustrated in Fig. 4 B for one primary response time course, and is summarized for three independent experiments in Fig. 4 C. IL-2 mRNA appeared earliest and consistently in 100 cell samples from day 3. Its prevalence in samples gradually declined to day 9 and was absent by day 11 (Fig. 4 C). IL-4 mRNA was next to appear, occasionally detected at day 3 but consistently present in all samples from days 5–13. IFN-γ was the next cytokine to appear, detected occasionally at day 5, increasing to peak prevalence at day 9, declining markedly by day 11, and absent at day 13. In contrast, IL-10 and IL-6 mRNA appeared sporadically across the primary response in only 20% of samples (n = 34 samples for each cytokine, including 14 samples of 200 cells) (IL-6 RT-PCR was sensitive to 400 cDNA molecules; data not shown). This sporadic appearance of IL-6 and IL-10 is most likely due to very low frequencies of these producers after initial priming. TNF-α mRNA was found in all samples (including the naive Th cell populations) so was not amenable to kinetic analysis using small populations. Thus, the small population RT-PCR analysis offers some resolution to the orchestrated appearance and disappearance of cytokine mRNA in antigen-specific Th cells during the primary immune response.
In the memory response, antigen-driven expression of cytokine mRNA in vivo was clearly accelerated (Fig. 4B and Fig. C; second column). All cytokines were present at the earliest memory response time point (day 2), with the exception of IL-6, which was absent at all time points. Cytokine production was restricted to the PCC-specific Th cell compartment, with very little background in the naive Th cells (background cell samples Vα11+Vβ3+CD44loCD62Lhi: 0/76 samples analyzed for either IL-4, IFN-γ, or IL-6; 2/27 samples of IL-2; and 1/23 samples for IL-10). It also appeared that cytokine production in either primary or memory response was not grossly polarized to Th1 or Th2 patterns by the Ribi adjuvant system as suggested by the in vitro restimulation assay (Fig. 2). Therefore, with the exception of IL-6, the range of cytokines seen in the memory response recapitulated that found in the primary response, albeit accelerated and more sustained in expression.
Frequency of Cytokine-expressing Cells Directly Ex Vivo.
Although the pattern of memory response cytokines was similar to the primary response, it was possible that the frequency of preferred cytokine-producing cells was enhanced in the memory compartment. To address this possibility, we first sorted single PCC-specific Th cells from primary response day 9 for RT-PCR analysis of cytokine mRNA (Fig. 5). The representative agarose gel for each cytokine indicates that whether single cells or 100-cell samples were used, maximal PCR product of the right size was obtained (compare Fig. 4 B and 5 A). Hence, the nested RT-PCR strategy was not quantitative, but sufficiently sensitive to allow direct ex vivo estimation of effector Th cell frequencies. Also note that wells 1 and 12 have no cells sorted into the cDNA reaction mix, and that each gel presented comes from a different set of single cells (i.e., 1/5 wells are always processed alongside positive samples as a negative control). In the population studies, both IL-2 and IL-10 were detected infrequently (Fig. 4 C) so were not pursued for the single cell analysis at this primary time point. In contrast, TNF-α could be assessed at the single cell level because the background frequencies were 0.9 ± 0.5% (n = 240; naive Th cells: Vα11+ Vβ3+CD44lo CD62Lhi). Surprisingly, far fewer PCC-specific Th cells expressed TNF-α mRNA directly ex vivo (2.5 ± 1.1%; Fig. 5) than were capable of producing it in vitro (66 ± 8%; Fig. 2). Thus, IL-2 and TNF-α that were readily induced in vitro appeared more tightly regulated in vivo.
Figure 5.

Frequency of cytokine-expressing PCC-specific Th cells directly ex vivo. (A) Single CD44hiCD62Llo Vα11/Vβ3-expressing T cells were sorted directly into wells of Terasaki plates containing cDNA reaction mix. After cDNA synthesis and two rounds of nested PCR, PCR products were viewed on ethidium bromide–stained agarose gels. Examples of PCR products obtained after RT-PCR analysis of a single row of cells sorted at day 2 of the memory response are shown for IL-2, TNF-α, IL-4, IFN-γ, IL-10, and actin. A different row of cells was analyzed for each cytokine and actin. Cells were not sorted into the first 1 or last 12 wells of each row, and these samples were processed alongside the cell samples as negative controls. PCR products from cloned cytokine cDNA are shown as a positive control for size (+). Actin was used to control for the efficiency cDNA synthesis and cell sorting. (B) Single, CD44hiCD62Llo Vα11/Vβ3-expressing T cells were sorted at day 9 of the primary response and day 4 of the memory response and analyzed by RT-PCR. The table shows the total number of single cells analyzed for each cytokine at each time point. The mean percentage (± SEM) of cells with detectable cytokine mRNA from three separate experiments are shown. Examples of frequencies obtained from individual experiments at day 3 of the memory response are as follows: IL-2: 3.3, 1.7, 2.8; TNF-α: 8.0, 3.3, 11.7, 5.0; IL-4: 11.7, 11.7, 10.0; IFN-γ: 6.7, 3.3, 1.7; and IL-10: 0.8, 1.7, 3.7, 8.3.
IL-4 was the most prevalent cytokine at day 9 of the primary response (10.2 ± 4.6%; Fig. 5 B). Considering the greater sensitivity of the RT-PCR assay for this cytokine, the frequency of IL-4+ cells was similar to that seen after in vitro restimulation (5.0 ± 2.0%; Fig. 2 C). In contrast, there were at least 25-fold fewer PCC-specific Th cells expressing IFN-γ mRNA directly ex vivo (0.4 ± 0.4%; Fig. 5 B). PCC-specific Th cells with IFN-γ mRNA were detected in only 1 of 4 animals examined for frequency at this time point (1/270 cells screened). Although no dramatic Th1/Th2 polarity could be seen in vitro, marked skewing to Th2-like polarity in the PCC-specific Th cell response occurred at the level of mRNA expression in vivo.
Using the same single cell approach, we next sorted PCC-specific Th cells from day 3 of the memory response to evaluate any change in frequencies of cytokine-producing cells. Although IL-2 and IL-10 were undetectable at the peak of the primary response, they were both present at low but reproducible frequencies at the peak of the memory response (2.6 ± 0.5 and 3.6 ± 1.7%, respectively; Fig. 5 B). TNF-α–expressing cells were also present at higher frequencies in the memory response compared with the primary (7.0 ± 1.8 and 2.7 ± 1.2%, respectively; Fig. 5 B). Frequencies of IFN-γ–expressing cells in the memory response increased 10-fold above estimations for the primary response (3.9 ± 1.5 and 0.4 ± 0.4%, respectively; Fig. 5 B). This increase in frequency of IFN-γ–expressing cells occurred with no change in the frequency of IL-4–expressing memory Th cells, which remained at maximal levels (11.1 ± 0.6 and 10.2 ± 4.6%, primary to memory; Fig. 5 B). With the exception of IL-4, all frequencies of memory Th cells expressing particular cytokine mRNA were substantially lower than seen in the same cells after mitogen restimulation in vitro (compare with Fig. 2 D, last column). Therefore, the cytokine-producing potentials of memory response PCC-specific Th cells only changed for IL-10, whereas the change in frequencies of cells expressing cytokine mRNA in vivo was more widespread. Taken together, these changes in frequency underscore the role of the microenvironment in regulating local cytokine production and demonstrate the selective expression of Th cell function in vivo.
Efficacy of Single Cell RT-PCR Frequency Estimations.
It was possible that we were underestimating frequencies of cytokine-expressing cells with the single cell RT-PCR assay. First, to check the efficiency of the cell sorting itself, an actin-specific RT-PCR served as one external control, indicating that 70–80% of the wells contained at least one cell (Fig. 5). Direct microscopic examination of 72-well plates after single cell sorting (same as used for the cDNA synthesis reaction) indicated that 75% of the wells contained one cell at its base and in no cases did we see more than one cell in each well (n = 180). As another check on the sensitivity of the RT-PCR for single cells directly ex vivo, we diluted the cDNA from single cytokine-expressing cells into subsequent PCR reactions. We first assessed frequencies for cytokine-expressing cells using half of the original cDNA and detected no change in expected frequency of positives for each cytokine. A significant number of these positives could still be detected using 1/5 of the cDNA from a single cell (45% TNF-α, 50% IL-4, 29% IFN-γ, 35% IL-10). Hence, the RT-PCR assay is robust for this panel of cytokine mRNA.
Next, we assessed whether the RT-PCR assay could detect in vivo antigen-activated Th cells (as opposed to the in vitro–activated cells shown in Fig. 3). We sorted either three or six antigen-specific cells per well and evaluated the corresponding increase in the frequency of positives. If we were missing many single positive events because they were below threshold sensitivity, when we increased cell input the observed frequency would now exceed the expected frequency (extrapolated from the single cell analysis). We found a high concordance for TNF-α and IL-10 (expected versus observed: 18 vs. 20% at 3 cells per well, and 12 vs. 15% at 6 cells per well, respectively) with a slightly lowered frequency for IL-4 and IFN-γ than expected (expected versus observed: 30 vs. 14.4% at 3 cells per well, and 18 vs. 7.1% at 6 cells per well, respectively), which is best explained by variability between animals and not as an overestimation of frequencies at the single cell level. Thus, it was highly unlikely that we were underestimating the frequency of cytokine-producing Th cells in the target population.
Dynamics of Cytokine Expression during the Memory Response.
In the next series of experiments, we quantified the dynamics of cytokine expression across the course of the memory response. The first time point analyzed was day 2 (before the peak of cell expansion) through to day 6 when there is evidence for the decline of PCC-specific Th cells in the draining LNs (Fig. 6). The frequency of IL-2+ cells was surprisingly low considering the extent of clonal expansion in the memory response (days 0–2: 10-fold, and days 2–4: 7.5-fold; Fig. 4 A). In contrast, the peak frequencies for TNF-α+ cells at day 2 (10.8 ± 4.6%; Fig. 6) resembled the higher frequencies of IL-4+ cells in both primary and memory responses. Hence, TNF-α may provide the stronger proliferative drive to memory Th cells than IL-2. Regarding the cytokines more involved in B cell differentiation, frequencies for IL-4, IFN-γ, and IL-10 remained relatively stable across the memory time course. IL-4+ Th cells represent 11 ± 1.1% of antigen-specific memory responders by day 2, with an average across days 2–6 of 10.4 ± 0.7% (n = 1,180 single cells across 12 separate animals). IFN-γ is present at lower but stable frequencies across days 2–6 at 3.2 ± 0.4% (n = 840 across 12 separate animals). IL-10+ Th cells were present at even lower frequencies, but were also relatively stable across days 2–6 at 2.0 ± 0.6% (n = 1,140 single cells across 13 separate animals). These extended frequency data indicate that we have not simply missed the peak of cytokine production for the panel analyzed and provide high confidence estimations for the low frequencies reported. Further, the stability of frequency over large increases and decreases in total cell numbers suggests that expression of particular functions may assort with the clonal progeny of memory responders.
Figure 6.
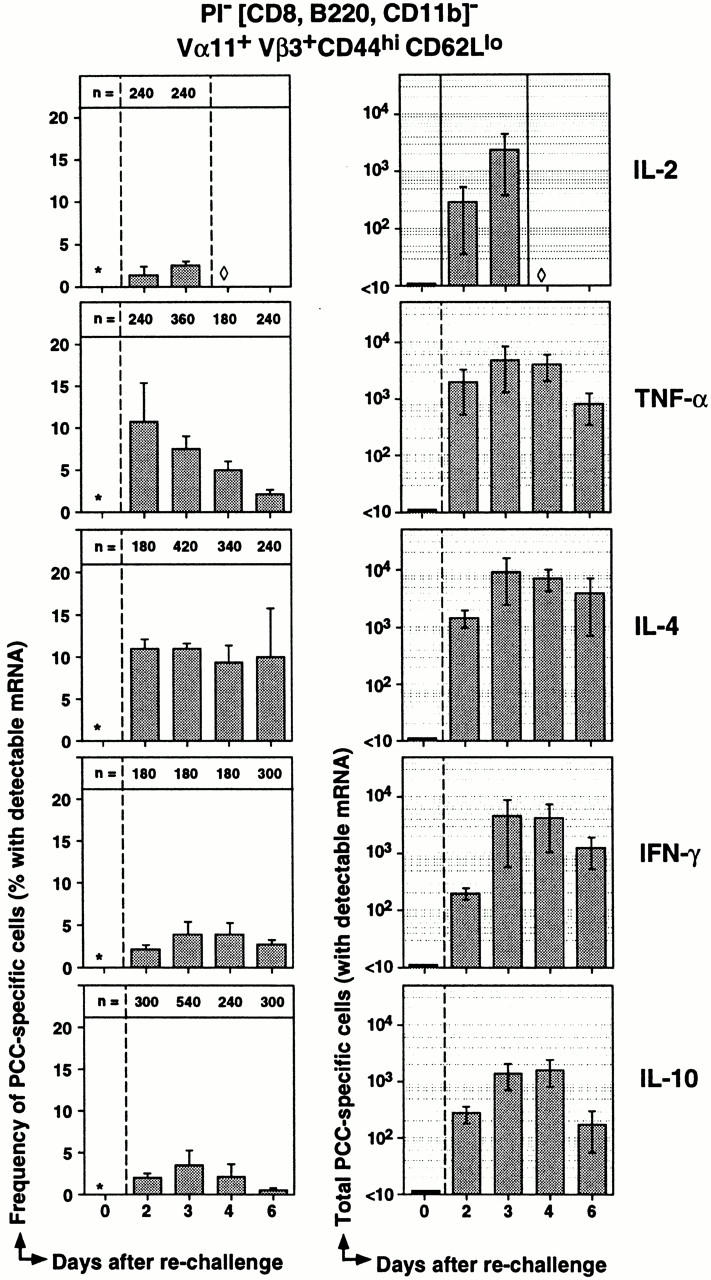
Dynamics of cytokine expression across the PCC-specific memory response. Single, CD44hiCD62Llo Vα11/Vβ3-expressing Th cells were sorted at days 2, 3, 4, and 6 of the memory response. The percentage of single cells that had detectable cytokine cDNA at each time point is shown in the first column of graphs (mean ± SEM). The number of single cells analyzed at each time point is presented at the top of each graph. At day 0, the number of Vα11/Vβ3-expressing T cells with a CD44hiCD62Llo phenotype was too low to sort single cells for analysis (*). Results from population analyses of CD44loCD62Lhi Vα11/Vβ3-expressing Th cells show that the percentage of naive Th cells that express IL-2, IL-4, IL-10, or IFN-γ mRNA at any time point is low, whereas the percentage that express TNF-α mRNA is 0.9 ± 0.5%. Single cells were not analyzed for IL-2 at day 4 since population analysis predicts <1% of cells express this cytokine (see Fig. 4). The total number of Vα11+Vβ3+ CD44hiCD62Llo cells with detectable cytokine cDNA was determined for each mouse using the percentage of cytokine-expressing cells and the total number of activated cells in the inguinal and periaortic LNs. The total numbers (mean ± SEM) are presented for each cytokine at each time point of the memory response in the second column of graphs. Day 0 estimations are based on frequencies of <1% for each cytokine in the total CD44loCD62Lhi Vα11/Vβ3-expressing Th cell compartment.
Functional Commitment among Clonal Progeny.
To more directly evaluate clonal relatedness among cytokine-expressing Th cells and to scrutinize the relationship between TCR structure and Th cell function, we next examined the TCR-β chain CDR3 regions of individual cytokine-expressing cells (Fig. 7). We focused this repertoire study on TNF-α+ and IL-4+ antigen-specific Th cells from day 9 of the primary response. Half of the cDNA from individual Th cells was used for the cytokine-specific RT-PCR, and the TCR-β chain was amplified from the remaining cDNA of positive cells and then directly sequenced through the CDR3 region. Three types of results can be seen in the CDR3 sequence data. First, the restriction of CDR3 length (nine amino acids), J region usage (Jβ1.2 and Jβ2.5), and amino acid residues in positions β100 (N) and β102 (A/G) are generally in accord with expected PCC-specific CDR3 structures across both sets of cytokine-expressing cells. Next, the CDR3 sequence used by a cytokine-expressing PCC-specific Th cell can be compared with the total set of PCC-specific TCR analyzed previously for repertoire alone 4. The TNF-α+ clone expressing a glutamine residue seen at β100 (P9.C4 and P9.C5; Fig. 5) is atypical, with only 4% of total PCC-specific cells expressing this residue (after day 5 primary n = 313 [reference 4]) and rarely paired with alanine at β102. The set of IL-4+ cells may preferentially express TCR using Jβ2.5, with 41% using this J segment compared with 20% of total PCC-specific Th cells (after day 5 primary n = 313 [reference 4]). This type of analysis suggests that particular TCR structures may influence the commitment to Th cell function in vivo.
Figure 7.
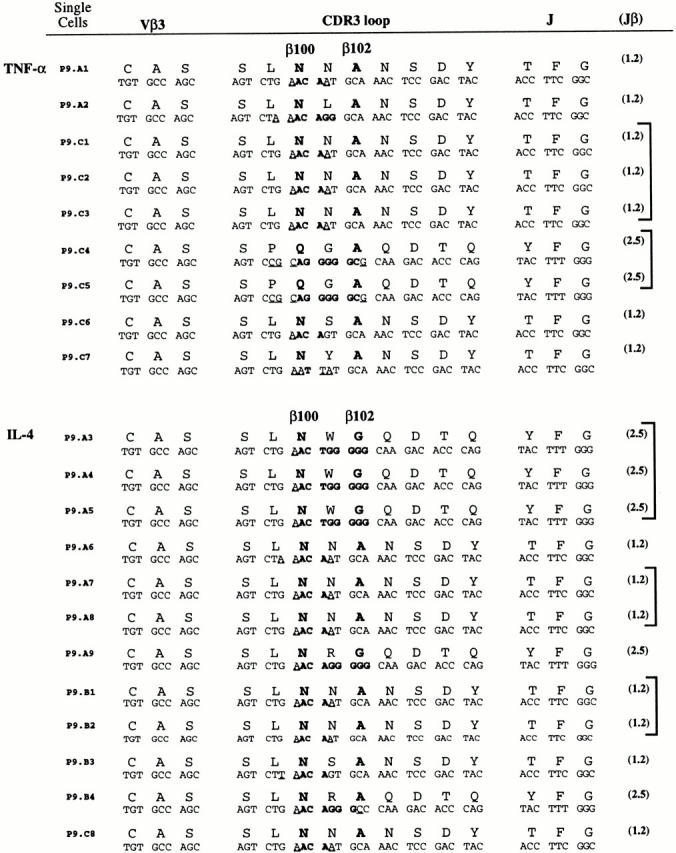
Commitment to TNF-α or IL-4 among clonal progeny. Single, CD44hiCD62Llo Vα11/Vβ3-expressing T cells were sorted at day 9 of the primary response and cDNA was immediately synthesized. One half of the single cell cDNA sample was analyzed for the presence of IL-4 or TNF-α cDNA. If a sample contained detectable IL-4 or TNF-α, the remaining cDNA was subjected to two rounds of nested PCR to amplify the TCR Vβ3 cDNA. The Vβ3 PCR product was sequenced, focusing on the CDR3 region as described. Nucleotide and predicted amino acid sequences obtained from 21 single cells are grouped by the cytokine they expressed. The TCR-β amino acid positions 100 and 102 are highlighted in each sequence. The sequences of the CDR3 and portion of the J element that is not a part of the CDR3 are shown with the number of the particular J element within this TCR. PCC-specific cells from individual animals that have the same TCR-β nucleotide sequence are grouped with square brackets at the end of each sequence.
Finally, in both sets of cytokine-expressing Th cells there were several examples of repeat sequences (at the base pair level; Fig. 7, enclosed by the square brackets at the end of the panels). These repeat CDR3 sequences are indicative of repeat TCRs from different cells in vivo and not generated artificially in vitro (this is rigorously controlled for in the experimental design; see Materials and Methods for more details). In general, junctional sequence in the TCR β chain can be used as an indicator of clonal relatedness; however, in our experience the NNA motif seen in many of the TCR β chains of PCC-specific Th cells (with the same nucleotide sequence) can pair with distinct TCR α chains and should not be used as an indicator of clonality in this response 4. Nevertheless, for each of the cytokines analyzed there was at least one other example of repeated sequences within individual animals using less typical sequences (QGA for TNF-α and NWG for IL-4). As we have amplified and sequenced the TCR β chain from only a few IL-4– and TNF-α–producing representatives from individual mice, the presence of repeat sequences provides strong evidence for functional commitment among clonal progeny.
Discussion
This study quantifies the antigen-dependent development of Th cell function as frequencies of mitogen-induced cytokine-producing PCC-specific Th cells and frequencies of PCC-specific Th cells expressing cytokine mRNA directly ex vivo. To our knowledge, these results provide the first direct frequency estimates of Th cell function for nontransgenic Th cells primed in vivo with antigen. Comparing Th cell function in the primary and memory response offers some surprising insights. The frequencies of PCC-specific Th cells able to produce B cell differentiation factors such as IL-4, IFN-γ, and IL-10 were remarkably low directly ex vivo and still low after powerful restimulation in vitro. Even in the memory response, very few PCC-specific memory responders expressed this capacity in vivo. Although the frequency of functionally committed Th cells was clearly higher in the antigen-experienced compared with the naive Th cell compartment, it was notable that this level of commitment appeared to be set by day 9 after initial encounter with antigen. In addition, there was little evidence for the selective preservation of preferred primary effector function into the memory compartment. Hence, the memory Th cell compartment is comprised of functionally specialized Th cell precursors from which the memory response to antigen rechallenge is drawn. Thus, functional potential is a consequence of the initial antigen/adjuvant experience, whereas expression of preferred function depends on the particular needs of the host at the time of antigen exposure.
Direct Frequency Estimation for Antigen-specific Th Cell Function.
More accurate analysis of T cell function accompanies the ability to isolate antigen-specific T cell directly ex vivo. The introduction of peptide–MHC tetramers 52 has provided a new level of discrimination to the analysis of complex T cell populations, as they have been elegantly exploited in the study of MHC class I–restricted T cell responses in both humans 52 53 and mice 54 55 56. The MHC class II versions of this new class of reagent have been more difficult to produce and less widely applied 39 57 58 59. Effective labeling with these multimeric reagents depends on adequate TCR affinity, and they are also known to deliver signals through the TCR upon binding 40. Further, the very low frequencies of antigen-specific Th cells (compared with antiviral CTL responses) makes reliable flow cytometric isolation from nontransgenic animals difficult. In the current study, we chose an earlier strategy for PCC-specific Th cell isolation using V region gene expression and comodulation of activation markers 3 4 51. We have shown that these PCC-specific Th cells bind MCC/I-Ek tetramers (Fig. 1; McHeyzer-Williams, L.J., unpublished results) and more importantly, that the V region–based strategy does not induce calcium transients during cell isolation 41. Thus, starting with purified antigen-specific Th cells allowed us to quantify directly the frequency of cells within the responding populations that could either produce a particular cytokine in vitro or express a particular cytokine mRNA in vivo.
Development of Functional Potential in the Th Cell Compartment.
The mitogen restimulation assay quantifies some aspects of acquired functional potential due to antigen experience. Clearly, PMA and ionomycin stimulation is a powerful mitogenic signal to T cells and may not reflect the true spectrum of functional potentials in vivo. Nevertheless, differences in the response to this mitogen are seen across the different populations of Th cells analyzed in this study and provide one distinct signature of antigen-dependent changes in functional potential. Accurate analysis of Th cell function in vitro remains difficult using any strategy, mainly due to the complex microenvironmental conditions in vivo that remain poorly defined, especially in the later phases of a developing immune response.
The early studies of Mosmann and Coffman 24 organized Th clones into two broad categories based on the pattern of cytokines they produced, predicting either a cell-mediated (Th1) or humoral (Th2) focus to the subsequent adaptive immune response. This functional lineage commitment appears to be based on adjuvant, the route of immunization, and the strength and duration of antigen signal 60 61 62. In the current study, we use a nonreplicating protein antigen and a nondepot adjuvant that was developed to generate high titer antibody responses 42 43. Using the same immunization regimen, we recently quantified a vigorous hapten-specific memory B cell response with ample evidence of IgG1-, IgG2a-, and IgE-expressing memory B cells, further demonstrating the humoral bias of this protocol and efficacy of the Ribi adjuvant system 63. Despite this bias towards a humoral response, there was no evidence for skewed acquisition of Th2 functional potential in the population as revealed by mitogen stimulation in vitro. These data are consistent with many studies in which there is no evidence for Th1/Th2 lineage commitment at the single cell level 26 27 28 29 30. The Ribi adjuvant used in the current study promotes both IFN-γ–controlled IgG2a 46 and IL-4–controlled IgG1 and IgE 46 47 and hence, may explain codevelopment of Th cells with these characteristics. Nevertheless, these data clearly indicate stable commitment for the capacity to produce both Th1 and Th2 cytokines within the PCC-specific memory Th cell compartment.
Even though the immunization regimen used in this study biases towards humoral immunity, very few PCC-specific Th cells were committed to the production of cytokines that regulate B cell differentiation (IL-4, IFN-γ, and IL-10). In this study, using powerful in vitro re-stimulation conditions, it is unlikely that we are greatly underestimating the cytokine-producing potentials of the PCC-specific cells. Furthermore, there was no enrichment in the memory response for Th cells with the capacity to produce IL-4 and IFN-γ, suggesting no heightened need for these cytokines in the memory B cell response. IL-10 was the exception to this pattern, with evidence for a significant increase between primary and memory response. This Th cell function may be selectively preserved due to its ability to promote plasma cell differentiation 49; however, capacity for IL-10 production is still only found in <10% of the PCC-specific memory response Th cells. Thus, we must conclude that the low frequencies of cytokine-producing Th cells that we see in response to PCC are sufficient to promote B cell differentiation and memory B cell responses in vivo.
The low and relatively stable frequencies for potential cytokine production may reflect T cell–intrinsic mechanisms for regulating functional commitment as demonstrated for IL-4 16 17. It is also possible that other mechanisms more influenced by extrinsic factors, such as gene-specific chromatin remodeling 22 23 64 65 and expression of key transcription factors 19 21, are differentially regulated in specialized microenvironments of the developing immune response. Nevertheless, established potentials for cytokine production are evident early after initial antigen priming, with little evidence for selection of preferred function into the long-lived memory Th cell compartment. These data are consistent with the stable acquisition of in vitro–induced patterns of cytokine production demonstrated for TCR transgenic Th cells in adoptive transfer models 12 33 66. Thus, if selection for functional potential is a major component of the primary response to PCC, it must occur very rapidly after initial antigen exposure.
Expression of Cytokine Function In Vivo.
The single cell RT-PCR assay provides a direct view of cytokine expression patterns in vivo and quantifies the frequency of PCC-specific cells actively expressing cytokine mRNA directly ex vivo. This analysis provides a “snapshot” of activity, precisely at the time of organ disruption for the preparation of cell suspensions. We argue that the frequency of cells expressing mRNA for particular cytokines directly ex vivo offers a good estimate for cells with this activity in vivo. Regardless, this estimate of cytokine activity in vivo will underestimate the full range of Th cell activities, as they only measure frequencies of PCC-specific Th cells actively engaged in cognate interactions at the time of analysis 67 68. Although antigen specificity was not directly evaluated in previous studies 13 69 70, the low frequencies for cytokine producers reported here are consistent with these earlier estimates. Due to low frequencies and the rapid appearance of IL-2 in vivo 70 71 72, the peak of primary response IL-2 production may not be visible using our current model. TNF-α appeared at higher frequencies than IL-2 in the memory response, and may suggest a more dominant role for TNF-α in memory Th cell expansion.
Although there was no evidence for Th1/Th2 polarity at the level of lineage commitment, there was a clear propensity for IL-4 over IFN-γ expression directly ex vivo during the primary response. IL-4 also appeared earlier and persisted for longer than IFN-γ after initial challenge, further indicating a dominant role in this PCC-specific Th cell response. However, in the memory response both cytokines reappeared rapidly. IFN-γ–expressing cells appeared at higher frequencies in memory responders with no change in IL-4 prevalence. Thus, expression of preferred function appears regulated by the response microenvironment and not through the development of preferred functional potentials. The increase in expression with no change in potential was also found for IL-2 and TNF-α. In contrast, there were increases in both the potential for production and the frequency of memory responders expressing IL-10. Although IL-6 production in vitro was not analyzed, expression was detected at low levels in the primary response but was absent in the memory. These latter two cytokines may represent exceptions in which particular Th cell functions are selectively retained (or lost) in the primary response or through selective expansion in the memory response. Therefore, it is clear that extrinsic factors regulate the cytokine expression pattern in vivo; however, in some cases the fate of antigen-experienced precursors may be determined by their functional potential.
Relationship of TCR Structure to Function.
TCR recognition of peptide–MHC is central to synapse formation and the initiation of adaptive immunity. It is clear that the microenvironmental context of coreceptor, costimulation, and cytokine environment can greatly influence the development of function 14. It also appears that different antigen doses under identical culture conditions can drive different functional outcomes 60 61. These stimuli mainly change the strength and duration of TCR signaling 62. A recent study also indicates that very slight changes in TCR structure can have major influence on Th cell differentiation pattern 73. Our initial TCR structure–function study focuses on the PCC-specific Th cells that express either IL-4 or TNF-α at day 9 of the primary response. There was some indication that these Th cells as a group differ slightly in sequence features from the total PCC-specific population and hence lend support to the association discussed above. These studies are in their early phase and require many more sequences before any strong conclusions can be drawn. The stronger and perhaps more informative data lie in the evidence for clonal progeny at this early primary response time point. Here, we sample very few cytokine-expressing cells (compared with the total compartment present in any individual animal) and find evidence for clonal progeny. The extent of expansion for each committed clone must already be large by day 9, and suggests that commitment to function for these clones must have occurred some considerable time earlier. Thus, commitment to function and perhaps selection for preferred function may occur with similar kinetics to the selection for preferred TCR structure 3 4.
Development and Delivery of Antigen-specific Th Cell Function.
These studies help to distinguish between the development of Th cell functional potential and the delivery of specialized function in vivo. Development of potential as assessed by mitogen stimulation in vitro appears set very early after initial priming, and if there is any preferential selection for function, it is over very rapidly for most cytokines. Delivery of specialized function as assessed by the RT-PCR assay reveals different patterns of expression across primary and memory responses. Cytokine-expressing Th cells emerge at low frequencies in a staggered and somewhat polarized pattern in the primary response and, as expected, reemergence in the memory response is rapid with changes in frequencies evident for many of the cytokines tested. These data indicate a complex organization of Th cell function that appears regulated through both the differential development of functional potential after initial priming and the controlled expression of these potentials through dynamic microenvironmental influences.
Acknowledgments
We would like to thank M.M. Davis and J.D. Altman for the generous gift of MCC/I-Ek tetramers. We would also like to acknowledge the Duke Comprehensive Cancer Center Flow Cytometry Shared Resource.
These studies were supported by an Arthritis Foundation Biomedical Sciences grant and by National Institutes of Health grant AI40215.
Footnotes
Abbreviations used in this paper: APC, allophycocyanin; MCC, moth cytochrome c; PCC, pigeon cytochrome c; RT, reverse transcription; TR, Texas red.
References
- Bradley L.M., Duncan D.D., Tonkonogy S., Swain S.L. Characterization of antigen-specific CD4+ effector T cells in vivoimmunization results in a transient population of MEL-14−, CD45RB− helper T cells that secretes interleukin 2 (IL-2), IL-3, IL-4, and interferon-γ. J. Exp. Med. 1991;174:547–559. doi: 10.1084/jem.174.3.547. [DOI] [PMC free article] [PubMed] [Google Scholar]
- Bradley L.M., Duncan D.D., Yoshimoto K., Swain S.L. Memory effectorsa potent, IL-4-secreting helper T cell population that develops in vivo after restimulation with antigen. J. Immunol. 1993;150:3119–3130. [PubMed] [Google Scholar]
- McHeyzer-Williams M.G., Davis M.M. Antigen-specific development of primary and memory T cells in vivo. Science. 1995;268:106–111. doi: 10.1126/science.7535476. [DOI] [PubMed] [Google Scholar]
- McHeyzer-Williams L.J., Panus J.F., Mikszta J.A., McHeyzer-Williams M.G. Evolution of antigen-specific T cell receptors in vivopreimmune and antigen-driven selection of preferred complementarity-determining region 3 (CDR3) motifs. J. Exp. Med. 1999;189:1823–1838. doi: 10.1084/jem.189.11.1823. [DOI] [PMC free article] [PubMed] [Google Scholar]
- Schwartz R.H. T-lymphocyte recognition of antigen in association with gene products of the major histocompatibility complex. Annu. Rev. Immunol. 1985;3:237–261. doi: 10.1146/annurev.iy.03.040185.001321. [DOI] [PubMed] [Google Scholar]
- Winoto A., Urban J.L., Lan N.C., Goverman J., Hood L., Hansburg D. Predominant use of a Vα gene segment in mouse T-cell receptors for cytochrome c. Nature. 1986;324:679–682. doi: 10.1038/324679a0. [DOI] [PubMed] [Google Scholar]
- Hedrick S.M., Engel I., McElligott D.L., Fink P.J., Hsu M.-L., Hansburg D., Matis L.A. Selection of amino acid sequences in the beta chain of the T cell receptor. Science. 1988;239:1541–1544. doi: 10.1126/science.2832942. [DOI] [PubMed] [Google Scholar]
- Jorgensen J.L., Esser U., Fazekas de St. Groth B., Reay P., Davis M.M. Mapping the T-cell receptor-peptide contacts by variant peptide immunization of single chain transgenics. Nature. 1992;355:224–230. doi: 10.1038/355224a0. [DOI] [PubMed] [Google Scholar]
- Duncan D.D., Swain S.L. Role of antigen-presenting cells in the polarized development of helper T cell subsetsevidence for differential cytokine production by Th0 cells in response to antigen presentation by B cells and macrophages. Eur. J. Immunol. 1994;24:2506–2514. doi: 10.1002/eji.1830241037. [DOI] [PubMed] [Google Scholar]
- Croft M., Swain S.L. Recently activated naive CD4 T cells can help resting B cells, and can produce sufficient autocrine IL-4 to drive differentiation to secretion of T helper 2-type cytokines. J. Immunol. 1995;154:4269–4282. [PubMed] [Google Scholar]
- Dubey C., Croft M., Swain S.L. Naive and effector CD4 T cells differ in their requirements for T cell receptor versus costimulatory signals. J. Immunol. 1996;157:3280–3289. [PubMed] [Google Scholar]
- Swain S.L. Generation and in vivo persistence of polarized Th1 and Th2 memory cells. Immunity. 1994;1:543–552. doi: 10.1016/1074-7613(94)90044-2. [DOI] [PubMed] [Google Scholar]
- Rogers W.O., Weaver C.T., Kraus L.A., Li J., Li L., Bucy R.P. Visualization of antigen-specific T cell activation and cytokine expression in vivo. J. Immunol. 1997;158:649–657. [PubMed] [Google Scholar]
- Dutton R.W., Bradley L.M., Swain S.L. T cell memory. Annu. Rev. Immunol. 1998;16:201–223. doi: 10.1146/annurev.immunol.16.1.201. [DOI] [PubMed] [Google Scholar]
- Guler M.L., Gorham J.D., Hsieh C.S., Mackey A.J., Steen R.G., Dietrich W.F., Murphy K.M. Genetic susceptibility to LeishmaniaIL-12 responsiveness in TH1 cell development. Science. 1996;271:984–987. doi: 10.1126/science.271.5251.984. [DOI] [PubMed] [Google Scholar]
- Bix M., Locksley R.M. Independent and epigenetic regulation of the interleukin-4 alleles in CD4+ T cells. Science. 1998;281:1352–1354. doi: 10.1126/science.281.5381.1352. [DOI] [PubMed] [Google Scholar]
- Bix M., Wang Z.E., Thiel B., Schork N.J., Locksley R.M. Genetic regulation of commitment to interleukin 4 production by a CD4+ T cell–intrinsic mechanism. J. Exp. Med. 1998;188:2289–2299. doi: 10.1084/jem.188.12.2289. [DOI] [PMC free article] [PubMed] [Google Scholar]
- Guler M.L., Gorham J.D., Dietrich W.F., Murphy T.L., Steen R.G., Parvin C.A., Fenoglio D., Grupe A., Peltz G., Murphy K.M. Tpm1, a locus controlling IL-12 responsiveness, acts by a cell-autonomous mechanism. J. Immunol. 1999;162:1339–1347. [PubMed] [Google Scholar]
- Ho I.C., Hodge M.R., Rooney J.W., Glimcher L.H. The proto-oncogene c-maf is responsible for tissue-specific expression of interleukin-4. Cell. 1996;85:973–983. doi: 10.1016/s0092-8674(00)81299-4. [DOI] [PubMed] [Google Scholar]
- Szabo S.J., Dighe A.S., Gubler U., Murphy K.M. Regulation of the interleukin (IL)-12R beta 2 subunit expression in developing T helper 1 (Th1) and Th2 cells. J. Exp. Med. 1997;185:817–824. doi: 10.1084/jem.185.5.817. [DOI] [PMC free article] [PubMed] [Google Scholar]
- Zheng W., Flavell R.A. The transcription factor GATA-3 is necessary and sufficient for Th2 cytokine gene expression in CD4 T cells. Cell. 1997;89:587–596. doi: 10.1016/s0092-8674(00)80240-8. [DOI] [PubMed] [Google Scholar]
- Bird J.J., Brown D.R., Mullen A.C., Moskowitz N.H., Mahowald M.A., Sider J.R., Gajewski T.F., Wang C.-R., Reiner S.L. Helper T cell differentiation is controlled by the cell cycle. Immunity. 1998;9:229–237. doi: 10.1016/s1074-7613(00)80605-6. [DOI] [PubMed] [Google Scholar]
- Agarwal S., Rao A. Modulation of chromatin structure regulates cytokine gene expression during T cell differentiation. Immunity. 1998;9:765–775. doi: 10.1016/s1074-7613(00)80642-1. [DOI] [PubMed] [Google Scholar]
- Mosmann T.R., Coffman R.L. TH1 and TH2 cellsdifferent patterns of lymphokine secretion lead to different functional properties. Annu. Rev. Immunol. 1989;7:145–173. doi: 10.1146/annurev.iy.07.040189.001045. [DOI] [PubMed] [Google Scholar]
- Abbas A.K., Murphy K.M., Sher A. Functional diversity of helper T lymphocytes. Nature. 1996;383:787–793. doi: 10.1038/383787a0. [DOI] [PubMed] [Google Scholar]
- Assenmacher M., Schmitz J., Radbruch A. Flow cytometric determination of cytokines in activated murine T helper lymphocytesexpression of interleukin-10 in interferon-gamma and in interleukin-4-expressing cells. Eur. J. Immunol. 1994;24:1097–1101. doi: 10.1002/eji.1830240513. [DOI] [PubMed] [Google Scholar]
- Bucy R.P., Panoskaltsis-Mortari A., Huang G.Q., Li J., Karr L., Ross M., Russell J.H., Murphy K.M., Weaver C.T. Heterogeneity of single cell cytokine gene expression in clonal T cell populations. J. Exp. Med. 1994;180:1251–1262. doi: 10.1084/jem.180.4.1251. [DOI] [PMC free article] [PubMed] [Google Scholar]
- Kelso A., Groves P., Troutt A.B., Francis K. Evidence for the stochastic acquisition of cytokine profile by CD4+ T cells activated in a T helper type 2-like response in vivo. Eur. J. Immunol. 1995;25:1168–1175. doi: 10.1002/eji.1830250506. [DOI] [PubMed] [Google Scholar]
- Openshaw P., Murphy E.E., Hosken N.A., Maino V., Davis K., Murphy K., O'Garra A. Heterogeneity of intracellular cytokine synthesis at the single cell level in polarized T helper 1 and T helper 2 populations. J. Exp. Med. 1995;182:1357–1367. doi: 10.1084/jem.182.5.1357. [DOI] [PMC free article] [PubMed] [Google Scholar]
- Kelso A., Groves P., Ramm L., Doyle A.G. Single-cell analysis by RT-PCR reveals differential expression of multiple type 1 and 2 cytokine genes among cells within polarized CD4+ T cell populations. Int. Immunol. 1999;11:617–621. doi: 10.1093/intimm/11.4.617. [DOI] [PubMed] [Google Scholar]
- Kelso A. Th1 and Th2 subsetsparadigms lost? Immunol. Today. 1995;16:374–379. doi: 10.1016/0167-5699(95)80004-2. [DOI] [PubMed] [Google Scholar]
- Kelso A. Educating T cellsearly events in the differentiation and commitment of cytokine-producing CD4+ and CD8+ T cells. Springer Semin. Immunopathol. 1999;21:231–248. doi: 10.1007/BF00812255. [DOI] [PubMed] [Google Scholar]
- Swain S.L., Hu H., Huston G. Class II-independent generation of CD4 memory T cells from effectors. Science. 1999;286:1381–1383. doi: 10.1126/science.286.5443.1381. [DOI] [PubMed] [Google Scholar]
- Forsthuber T., Yip H.C., Lehmann P.V. Induction of TH1 and TH2 immunity in neonatal mice. Science. 1996;271:1728–1730. doi: 10.1126/science.271.5256.1728. [DOI] [PubMed] [Google Scholar]
- Karulin A.Y., Hesse M.D., Tary-Lehmann M., Lehmann P.V. Single-cytokine-producing CD4 memory cells predominate in type 1 and type 2 immunity. J. Immunol. 2000;164:1862–1872. doi: 10.4049/jimmunol.164.4.1862. [DOI] [PubMed] [Google Scholar]
- Kelso A., Troutt A.B., Maraskovsky E., Gough N.M., Morris L., Pech M.H., Thomson J.A. Heterogeneity in lymphokine profiles of CD4+ and CD8+ T cells and clones activated in vivo and in vitro. Immunol. Rev. 1991;123:85–114. doi: 10.1111/j.1600-065x.1991.tb00607.x. [DOI] [PubMed] [Google Scholar]
- Troutt A., Kelso A. Enumeration of lymphokine mRNA-containing cells in vivo in a murine graft-versus-host reaction using the PCR. Proc. Natl. Acad. Sci. USA. 1992;89:5276–5280. doi: 10.1073/pnas.89.12.5276. [DOI] [PMC free article] [PubMed] [Google Scholar]
- Kearney E.R., Pape K.A., Loh D.Y., Jenkins M.K. Visualization of peptide-specific T cell immunity and peripheral tolerance induction in vivo. Immunity. 1994;1:327–339. doi: 10.1016/1074-7613(94)90084-1. [DOI] [PubMed] [Google Scholar]
- Savage P.A., Boniface J.J., Davis M.M. A kinetic basis for T cell receptor repertoire selection during an immune response. Immunity. 1999;10:485–492. doi: 10.1016/s1074-7613(00)80048-5. [DOI] [PubMed] [Google Scholar]
- Boniface J.J., Rabinowitz J.D., Wulfing C., Hampl J., Reich Z., Altman J.D., Kantor R.M., Beeson C., McConnell H.M., Davis M.M. Initiation of signal transduction through the T cell receptor requires the multivalent engagement of peptide/MHC ligands Immunity. 9 1998. 459 466[published erratum at 9:891] [DOI] [PubMed] [Google Scholar]
- Bikah G., Pogue-Caley R.R., McHeyzer-Williams L.J., McHeyzer-Williams M.G. Regulating T helper cell immunity through antigen responsiveness and calcium entry. Nat. Immunol. 2000;In press doi: 10.1038/80841. [DOI] [PubMed] [Google Scholar]
- Tiong G.K.L., Harsharnjit S.G., Lofthouse S., Puri N.K. Comparison of conventional adjuvants and adjuvant-free monoclonal antibody targeting for stimulating antibody responses against a conjugate of luteinizing hormone releasing hormone and avidin. Vaccine. 1993;11:425–430. doi: 10.1016/0264-410x(93)90283-4. [DOI] [PubMed] [Google Scholar]
- Daly T.M., Long C.A. Influence of adjuvants on protection induced by a recombinant fusion protein against malarial infection. Infect. Immun. 1996;64:2602–2608. doi: 10.1128/iai.64.7.2602-2608.1996. [DOI] [PMC free article] [PubMed] [Google Scholar]
- Smith K.A., Lachman L.B., Oppenheim J.J., Favata M.F. The functional relationship of the interleukins. J. Exp. Med. 1980;151:1551–1556. doi: 10.1084/jem.151.6.1551. [DOI] [PMC free article] [PubMed] [Google Scholar]
- Pape K.A., Khoruts A., Mondino A., Jenkins M.K. Inflammatory cytokines enhance the in vivo clonal expansion and differentiation of antigen-activated CD4+ T cells. J. Immunol. 1997;159:591–598. [PubMed] [Google Scholar]
- Snapper C.M., Paul W.E. Interferon-gamma and B cell stimulatory factor-1 reciprocally regulate Ig isotype production. Science. 1987;236:944–947. doi: 10.1126/science.3107127. [DOI] [PubMed] [Google Scholar]
- McHeyzer-Williams M.G. Combinations of interleukins 2, 4 and 5 regulate the secretion of murine immunoglobulin isotypes. Eur. J. Immunol. 1989;19:2025–2030. doi: 10.1002/eji.1830191109. [DOI] [PubMed] [Google Scholar]
- Teranishi T., Hirano T., Arima N., Onoue K. Human helper T cell factor(s) (ThF). II. Induction of IgG production in B lymphoblastoid cell lines and identification of T cell-replacing factor- (TRF) like factor(s) J. Immunol. 1982;128:1903–1908. [PubMed] [Google Scholar]
- Arpin C., Dechanet J., Van Kooten C., Merville P., Grouard G., Briere F., Banchereau J., Liu Y.J. Generation of memory B cells and plasma cells in vitro. Science. 1995;268:720–722. doi: 10.1126/science.7537388. [DOI] [PubMed] [Google Scholar]
- McHeyzer-Williams M.G., Ahmed R. B cell memory and the long-lived plasma cell. Curr. Opin. Immunol. 1999;11:172–179. doi: 10.1016/s0952-7915(99)80029-6. [DOI] [PubMed] [Google Scholar]
- Mikszta J.A., McHeyzer-Williams L.J., McHeyzer-Williams M.G. Antigen-driven selection of TCR in vivorelated TCR alpha-chains pair with diverse TCR beta-chains. J. Immunol. 1999;163:5978–5988. [PubMed] [Google Scholar]
- Altman J.D., Moss P.A.H., Goulder P.J.R., Barouch D.H., McHeyzer-Williams M.G., Bell J.I., McMichael A.J., Davis M.M. Phenotypic analysis of antigen-specific T lymphocytes. Science. 1996;274:94–96. doi: 10.1126/science.274.5284.94. [DOI] [PubMed] [Google Scholar]
- Ogg G.S., Jin X., Bonhoeffer S., Dunbar P.R., Nowak M.A., Monard S., Segal J.P., Cao Y., Rowland-Jones S.L., Cerundolo V. Quantitation of HIV-1-specific cytotoxic T lymphocytes and plasma load of viral RNA. Science. 1998;279:2103–2106. doi: 10.1126/science.279.5359.2103. [DOI] [PubMed] [Google Scholar]
- Murali-Krishna K., Altman J.D., Suresh M., Sourdive D.J., Zajac A.J., Miller J.D., Slansky J., Ahmed R. Counting antigen-specific CD8 T cellsa reevaluation of bystander activation during viral infection. Immunity. 1998;8:177–187. doi: 10.1016/s1074-7613(00)80470-7. [DOI] [PubMed] [Google Scholar]
- Busch D.H., Pilip I.M., Vijh S., Pamer E.G. Coordinate regulation of complex T cell populations responding to bacterial infection. Immunity. 1998;8:353–362. doi: 10.1016/s1074-7613(00)80540-3. [DOI] [PubMed] [Google Scholar]
- Flynn K.J., Belz G.T., Altman J.D., Ahmed R., Woodland D.L., Doherty P.C. Virus-specific CD8+ T cells in primary and secondary influenza pneumonia. Immunity. 1998;8:683–691. doi: 10.1016/s1074-7613(00)80573-7. [DOI] [PubMed] [Google Scholar]
- Gutgemann I., Fahrer A.M., Altman J.D., Davis M.M., Chien Y.H. Induction of rapid T cell activation and tolerance by systemic presentation of an orally administered antigen. Immunity. 1998;8:667–673. doi: 10.1016/s1074-7613(00)80571-3. [DOI] [PubMed] [Google Scholar]
- Crawford F., Kozono H., White J., Marrack P., Kappler J. Detection of antigen-specific T cells with multivalent soluble class II MHC covalent peptide complexes. Immunity. 1998;8:675–682. doi: 10.1016/s1074-7613(00)80572-5. [DOI] [PubMed] [Google Scholar]
- Rees W., Bender J., Teague T.K., Kedl R.M., Crawford F., Marrack P., Kappler J. An inverse relationship between T cell receptor affinity and antigen dose during CD4+ T cell response in vivo and in vitro. Proc. Natl. Acad. Sci. USA. 1999;96:9781–9786. doi: 10.1073/pnas.96.17.9781. [DOI] [PMC free article] [PubMed] [Google Scholar]
- Constant S., Pfeiffer C., Woodard A., Pasqualini T., Bottomly K. Extent of T cell receptor ligation can determine the functional differentiation of naive CD4+ T cells. J. Exp. Med. 1995;182:1591–1596. doi: 10.1084/jem.182.5.1591. [DOI] [PMC free article] [PubMed] [Google Scholar]
- Hosken N.A., Shibuya K., Heath A.W., Murphy K.M., O'Garra A. The effect of antigen dose on CD4+ T helper cell phenotype development in a T cell receptor-alpha beta-transgenic model. J. Exp. Med. 1995;182:1579–1584. doi: 10.1084/jem.182.5.1579. [DOI] [PMC free article] [PubMed] [Google Scholar]
- Iezzi G., Karjalainen K., Lanzavecchia A. The duration of antigenic stimulation determines the fate of naive and effector T cells. Immunity. 1998;8:89–95. doi: 10.1016/s1074-7613(00)80461-6. [DOI] [PubMed] [Google Scholar]
- McHeyzer-Williams L.J., Cool M., McHeyzer-Williams M.G. Antigen-specific B cell memoryexpression and replenishment of a novel B220− memory B cell compartment. J. Exp. Med. 2000;191:1149–1166. doi: 10.1084/jem.191.7.1149. [DOI] [PMC free article] [PubMed] [Google Scholar]
- Gett A.V., Hodgkin P.D. Cell division regulates the T cell cytokine repertoire, revealing a mechanism underlying immune class regulation. Proc. Natl. Acad. Sci. USA. 1998;95:9488–9493. doi: 10.1073/pnas.95.16.9488. [DOI] [PMC free article] [PubMed] [Google Scholar]
- Fitzpatrick D.R., Shirley K.M., McDonald L.E., Bielefeldt-Ohmann H., Kay G.F., Kelso A. Distinct methylation of the interferon-γ (IFN-γ) and interleukin 3 (IL-3) genes in newly activated primary CD8+ T lymphocytesregional IFN-γ promoter demethylation and mRNA expression are heritable in CD44highCD8+ T cells. J. Exp. Med. 1998;188:103–117. doi: 10.1084/jem.188.1.103. [DOI] [PMC free article] [PubMed] [Google Scholar]
- Grakoui A., Donermeyer D.L., Kanagawa O., Murphy K.M., Allen P. TCR-independent pathways mediate the effects of antigen dose and altered peptide ligands on T cell polarization. J. Immunol. 1999;162:1923–1930. [PubMed] [Google Scholar]
- Monks C.R., Kupfer H., Tamir I., Barlow A., Kupfer A. Selective modulation of protein kinase C-theta during T-cell activation. Nature. 1997;385:83–86. doi: 10.1038/385083a0. [DOI] [PubMed] [Google Scholar]
- Grakoui A., Bromley S.K., Sumen C., Davis M.M., Shaw A.S., Allen P.M., Dustin M.L. The immunological synapsea molecular machine controlling T cell activation. Science. 1999;285:221–227. doi: 10.1126/science.285.5425.221. [DOI] [PubMed] [Google Scholar]
- Bogen S.A., Fogelman I., Abbas A.K. Analysis of IL-2, IL-4, and IFN-γ-producing cells in situ during the immune responses to protein antigens. J. Immunol. 1993;150:4197–4203. [PubMed] [Google Scholar]
- Naramura M., Ren-Ju H., Gu H. Mice with fluorescent marker for interleukin 2 gene activation. Immunity. 1998;9:209–216. doi: 10.1016/s1074-7613(00)80603-2. [DOI] [PubMed] [Google Scholar]
- Khoruts A., Mondino A., Pape K.A., Reiner S.L., Jenkins M.K. A neutral immunological adjuvant enhances T cell clonal expansion through a CD28-dependent, interleukin (IL)-2–independent mechanism. J. Exp. Med. 1998;187:225–236. doi: 10.1084/jem.187.2.225. [DOI] [PMC free article] [PubMed] [Google Scholar]
- Saparov A., Wagner F.H., Zheng R., Oliver J.R., Maeda H., Hockett R.D., Weaver C.T. Interleukin-2 expression by a subpopulation of primary T cells is linked to enhanced memory/effector function. Immunity. 1999;11:271–280. doi: 10.1016/s1074-7613(00)80102-8. [DOI] [PubMed] [Google Scholar]
- Blander J.M., Sant'Angelo D.B., Bottomly K., Janeway C.A., Jr. Alteration at a single amino acid residue in the T cell receptor α chain complementarity determining region 2 changes the differentiation of naive CD4 T cells in response to antigen from T helper cell type 1 (Th1) to Th2. J. Exp. Med. 2000;191:2065–2074. doi: 10.1084/jem.191.12.2065. [DOI] [PMC free article] [PubMed] [Google Scholar]