

Abstract
Endo/lysosomal proteases control two key events in antigen (Ag) presentation: the degradation of protein Ag and the generation of peptide-receptive major histocompatibility complex (MHC) class II molecules. Here we show that the proinflammatory cytokines tumor necrosis factor α and interleukin (IL)-1β rapidly increase the activity of cathepsin (cat) S and catB in human dendritic cells (DCs). As a consequence, a wave of MHC class II sodium dodecyl sulfate stable dimer formation ensues in a catS-dependent fashion. In contrast, the antiinflammatory cytokine IL-10 renders DCs incapable of upregulating catS and catB activity and in fact, attenuates the level of both enzymes. Suppressed catS and catB activity delays MHC class II sodium dodecyl sulfate stable dimer formation and impairs Ag degradation. In DCs exposed to tetanus toxoid, IL-10 accordingly reduces the number of MHC class II–peptide complexes accessible to tetanus toxoid–specific T cell receptors, as analyzed by measuring T cell receptor downregulation in Ag-specific T cell clones. Thus, the control of protease activity by pro- and antiinflammatory cytokines is an essential feature of the Ag presentation properties of DCs.
Keywords: antigen-presenting cell, cathepsin, class II maturation, antigen degradation, TCR
Introduction
During their transition from an immature to a mature state, dendritic cells (DCs) acquire the unique ability to stimulate immunologically naive T cells. Maturation of DCs is a process initiated by cellular activation and is manifested in cells treated with proinflammatory cytokines 1 2 3. Upon activation, DCs lose their ability to take up external Ags but begin to export peptide-loaded MHC products to the cell surface. Within T cell areas of lymphoid organs, fully mature DCs abundantly display MHC molecules loaded with antigenic peptides together with costimulatory signals. The coordinated delivery of both signals to T cells ensures the induction of a productive T cell response 2 3. At least some aspects of cytokine-induced DC maturation are counteracted by antiinflammatory stimuli 4.
In the MHC class II presentation pathway, lysosomal proteases of the cathepsin (cat) family control the processing of Ag and the formation of peptide-receptive class II dimers 5. The nature of these cats is a matter of debate. Specific proteases may be dedicated to the presentation of certain Ags: asparaginyl endopeptidase is involved in the degradation of tetanus toxin by B lymphoblasts 6. While the role of this protease in human DCs remains to be established, it is reasonable to suggest that additional proteases are critical for Ag degradation. In fact, catB is viewed as an exopeptidase responsible for the degradation of peptides, proteins, toxins, and cell surface receptors that enter the cell via endo- or phagocytosis 7 8 9.
The digestion of the invariant chain (Ii) is a central step in class II–dependent Ag presentation, since it is a prerequisite for the formation of peptide-occupied SDS stable class II αβ dimers. The stepwise proteolytic degradation of Ii in endo/lysosomal compartments generates a heterogeneous set of ∼3-kD fragments, termed class II–associated Ii-derived peptides (CLIPs), which remain bound to the class II binding groove until exchanged for antigenic peptides in a histocompatibility leukocyte Ag (HLA)-DM–dependent fashion 5 10 11. catS is the most potent catalyst of the CLIP generation in vitro and in vivo 12 13 14 15. Further potential candidate enzymes are catF, catB, catD, and catL, which degrade Ii in vitro 16. catF can degrade Ii in catS-deficient murine macrophages 17, whereas catD and catB unlikely are involved in the CLIP generation in murine cells 13 16. catL is the pivotal enzyme for Ii degradation in thymic epithelial cells and, hence, is required for positive selection of CD4+ thymocytes 18.
The expression levels of several cat family members are upregulated by IL-4 and IFN-γ 16 19 20, both of which are potent inducers of class II expression in different cell types. Stimuli that induce DC maturation might also regulate the activity of proteases relevant for the generation of exogenous Ag-derived peptides and proteases that are responsible for the generation of SDS stable class II dimers. Along these lines, it has been suggested that the regulation of cystatin C (Cy C) levels in DCs controls the activity of catS in the course of maturation 21. The effects imposed by antiinflammatory stimuli on DC function might likewise act by controlling the levels of intracellular proteolytic activity. IL-10 impairs class II–dependent Ag presentation in a cell type–dependent fashion 4 22 23 24 and is the prototype cytokine that inactivates DCs in vivo and in vitro 25.
Here we asked whether protease activity is dynamically regulated by physiologically relevant stimuli and, if so, which are the enzymes affected. Cytokine-mediated regulation of protease activity might help us understand how pro- and antiinflammatory stimuli balance class II assembly and Ag processing. Therefore, we examined the nature and function of cats involved in class II–dependent Ag presentation by human DCs and analyzed the effects of pro- and antiinflammatory cytokines on cat activity and T cell activation.
Materials and Methods
Abs and Reagents.
CBz-Tyr-Ala-CN2 was provided by H. Chapman (University of California at San Francisco, San Francisco, CA) and iodinated. Anti-CD45 (MEM-28) and anti–HLA-DR (MEM-12) mAbs were provided by V. Horejsi (Academy of Natural Sciences, Prague, Czech Republic). Rabbit anti–cat sera (anti-B, -L, -D, -S) were provided by E. Weber (University of Halle-Wittenberg, Halle, Germany). N-morpholinurea-leucine-homophenylalanine-vinylsulfone-phenyl (LHVS; provided by J.T. Palmer, Arris Pharmaceuticals, San Francisco, CA), Fmoc YACHN2 (provided by R.W. Mason, Alfred I. duPont Hospital, Wilmington, DE; reference 26), and CA074Me (Bachem Feinchemikalien AG) were dissolved at 10 mM in DMSO and stored at −20°C. Chloroquine and bafilomycin A1 were from Calbiochem.
Cell Preparation and Culture.
B cells were prepared from PBMCs by anti-CD19 (Leu12; Becton Dickinson) immunostaining and flow sorting (FACStarPLUS™; Becton Dickinson). CD34+-derived DCs, and CD11c+ and CD11c− peripheral blood DCs were prepared as described 27 28. Monocyte-derived (md) DCs were prepared in the presence of 1 ng/ml TGF-β1 (R&D Systems) in serum-free conditions (LGM3 medium; CLONTECH Laboratories, Inc.; reference 29). mdDCs were stimulated with 100 ng/ml TNF-α and 10 ng/ml IL-1β (both R&D Systems; referred to as “TNF/IL-1 stimulation”). When indicated, cells were precultured with 300 U/ml IL-10 (R&D Systems) overnight before stimulation. Tetanus toxoid (TT)-specific T cell clones (TCCs) were established and characterized as described 30.
Detergent Extraction and Immunoblotting.
Cells were solubilized, lysates were submitted to 12% SDS-PAGE, and immunoblotting was performed 31. mAb MEM-28 (1:5,000), rabbit anti-actin (1:5,000; Sigma-Aldrich), or rabbit anti–cat sera (1:5,000 or 1:2,500) were incubated for 6 h. The binding of peroxidase-conjugated donkey anti–rabbit IgG or sheep anti–mouse IgG F(ab′)2 (both 1:20,000; Amersham Pharmacia Biotech) was detected using ECLplus™ (Amersham Pharmacia Biotech).
Metabolic Labeling and Immunoprecipitation.
DCs were starved in methionine and cysteine-free medium, pulsed for 30 min with 1 mCi/ml (5–10 × 106 cells/ml) of InVivo Cell™ labeling mix (Amersham Pharmacia Biotech), aliquoted, and chased at 37°C. Protease inhibitors were added 4 h before pulse. Cells were lysed at the indicated time points as described 31. Lysates were precleared with protein G beads (Sigma-Aldrich) and anti–HLA-DR immunoprecipitation (mAb TÜ36; BD PharMingen) was performed for 3 h. Precipitated proteins were eluted for 20 min with nonreducing PAGE sample buffer containing 2% SDS. Nonboiled and boiled aliquots of each sample were analyzed by 12% SDS-PAGE.
Active-site Labeling of Cysteine Proteases.
0.5–1 × 10⁶ DCs were stimulated with TNF/IL-1 in the presence or absence of protease inhibitors. Cells were washed, incubated with CBz-125I-Tyr-Ala-CN2 for 30 min at 37°C, washed again to remove free label, and lysed. 12% SDS-PAGE was performed under reducing conditions. Cellular protein content per lane was defined by the use of equal cell numbers per sample. Even loading was controlled by Coomassie blue staining of each gel.
Ag Degradation Assay.
DCs were incubated with 10 μg/ml of anti-FcγRII mAbs (IV.3; Medarex) for 1 h at 4°C, washed, and exposed to 125I-labeled goat anti–mouse IgG (Amersham Pharmacia Biotech) for 1 h at 4°C. After extensive washes with cold PBS, aliquots of 0.5 × 10⁶ cells were chased under various conditions. Then cells were lysed, lysates were mixed with nonreducing sample buffer, and subjected to 10% SDS-PAGE. No signals from [125I]IgG were obtained without the anti-FcγRII incubation step. Cellular protein content per lane was controlled as described.
Gel Densitometry.
The amount of SDS stable class II αβ dimers and of Ii fragments was defined as follows: intensity of the respective band regions was determined from digitalized autoradiograms using the Kodak 1D v2.02 software package (Eastman Kodak Co.). Values obtained from the β chains of boiled precipitation aliquots were considered 100% for the calculation of the amount of the corresponding SDS stable αβ dimers or small leupeptin-induced Ii peptide (SLIP). Signal intensities from [125I]IgG were quantified as described.
Assessment of Ag Internalization.
DCs were exposed to 10 μg/ml biotinylated anti-FcγRII or control mAbs (MOPC 21; Sigma-Aldrich) for 30 min at 4°C. After washing, cells were incubated with goat anti-mouse F(ab′)2 (Molecular Probes) for another 30 min at 4°C to cross-link receptor-bound mAbs. Excess F(ab′)2 was removed and internalization of surface-bound Ab complexes was monitored after various culture periods at 37°C as follows: DCs were harvested, chilled, and incubated with PE-labeled streptavidin (1 μg/ml SA-PE; Becton Dickinson) for 30 min at 4°C. PE fluorescence was analyzed using a FACScan™ flow cytometer (Becton Dickinson) and expressed as the specific mean fluorescence intensity (MFI; ΔMFI, MFI of anti-FcγRII mAb-stained cells minus MFI of control mAb-stained cells). The ratio of the ΔMFI of DCs cultured at 37°C over the ΔMFI of DCs kept on ice multiplied by 100 gives the percentage of ligand internalization.
Acidity of Endocytic Compartments.
DCs were exposed to anti-FcγRII mAbs followed by receptor cross-linking with FITC- or oregon green (OG)–labeled goat anti–mouse F(ab′)2 (Molecular Probes) at 4°C. Cells were washed and cultured at 37°C. pH-sensitive FITC and pH-insensitive OG fluorescence was measured by FACS®. The ratio of FITC over OG fluorescence was calculated for DCs cultured for the indicated time periods at 37°C. The FITC/OG ratio of cells kept on ice was set at 100%. Ratios determined from DCs cultured for various time periods were expressed as the percentage of this value. Results are given as the percentage of specific reduction of FITC fluorescence relative to the baseline value (0%; 0 h). Additionally, the pH of endocytic DC compartments was assessed directly using LysoSensor™ yellow/blue conjugated to 0.25 mg/ml 10-kD dextran (Molecular Probes; reference 32). DCs were labeled overnight in the presence or absence of IL-10. TNF/IL-1 was added for the indicated time periods, cells were washed in PBS, and the fluorescence emission of internalized LysoSensor™ was measured within the next 10 min using an Axiovert 100 microscope (ZEISS) equipped with the Attofluor™ system (Atto Instruments; excitation: 365 ± 12 nm; emission: 515–530 nm and 450–490 nm). The ratio of green over blue emission of at least 10 randomly selected cells/microscopic field was calculated using the Attofluor™ ratio vision software (Atto Instruments). Standard curve for intracellular pH measurement: calibration buffer (125 mM KCl, 20 mM NaCl, 0.5 mM CaCl2, 0.5 mM MgCl2) was titrated to pH 4 or 5 with 25 mM acetic acid, pH 6 with 25 mM MES (Merck), and pH 7 with 25 mM morpholino propane sulfonic acid (Sigma-Aldrich). Cells of defined intracellular pH were generated by incubation with pH-adjusted calibration buffers supplemented with 10 μg/ml nigericin and 10 μg/ml monensin (Sigma-Aldrich). Ratios of at least 10 cells/pH grade were acquired as described above.
Assessment of Expression and Surface Stability of HLA-DR.
DCs were analyzed in parallel for surface and total cellular HLA-DR expression by FACS®. For the latter analysis, cells were subjected to Fix&Perm™ (An der Grub Bioresearch) and stained with 1 μg/ml FITC-labeled mAb L243 (Becton Dickinson). The surface stability of HLA-DR complexes was analyzed with biotinylated Fab fragments of 10 μg/ml MEM-12. DCs were labeled for 30 min at 4°C, washed, and cultured for the indicated time periods at 37°C. Biotin moieties remaining at the cell surface were detected with SA-PE.
TCR Downregulation Experiments.
TCR downregulation experiments were performed as described with minor modifications 33 34. DCs were labeled with 20 nM CFDA-SE (Molecular Probes) in PBS for 20 min at 37°C, washed, and incubated for 30 min with TT (Calbiochem) or TT peptides (TT947–967; Pichem) at the indicated concentrations or medium only. After washing thoroughly DCs were chased, mixed with a TT-specific TCC (DC/T cell ratio 4:1 in RPMI 1640, 10% human AB serum; PAA Laboratories), and cocultured for 4 h. TCR internalization was stopped and DC-T cell clusters were disrupted by chilling with cold PBS and 0.5 mM EDTA. T cells were stained with PE-labeled anti-CD3 (Leu4; Becton Dickinson) or isotype control mAbs (Becton Dickinson) and analyzed by FACS®. ΔMFI values of gated T cells were calculated as described above and transformed to absolute numbers of TCR/CD3 molecules per cell using the QuantiBRITE PE™ calibration kit (Becton Dickinson). The numbers of triggered TCRs were calculated by subtracting the TCR/CD3 numbers of T cells cocultured with Ag-modified DCs from those of T cells exposed to nonAg-modified DCs.
Results
DCs Acquire High Levels of Mature cats during Their Differentiation from Precursors.
We used mdDCs as model DCs as large cell numbers are easily accessible at an immature stage and selected culture conditions in which mdDCs do not produce IL-10 endogenously 29 35. This allows a comparison of the effects of pro- versus antiinflammatory cytokines on DC function. We first defined expression patterns of cats to see whether the proteases expressed in mdDCs were representative of human DCs.
Protease activity can be examined by at least two independent methods. First, the level of proteases themselves can be measured by immunochemical methods. However, the assessment of the total protease content based on immunoblotting may not yield an accurate estimate of the level of active enzyme. Therefore, the second approach is to measure the activity of the proteases using active site–directed, mechanism-based inhibitors. Using these two types of approach, we addressed the changes in protease content and activity that accompany the development and the maturation of DCs. First, cat expression in B cells, monocytes, various types of DCs, and DC precursors was assessed by immunoblotting (Fig. 1 A). None of the proteases analyzed (catB, catD, catL, and catS) was detectable as the mature form in resting B cells. The only cat clearly detected in these cells is the proform of catB, also expressed in monocytes. Low level cat expression by resting B cells could have escaped detection by immunoblotting. It is equally possible that resting B cells have to undergo activation and maturation for high level cat expression. Monocytes express pro-catB, pro-catL, pro- and mature catS, as well as pro- and mature catD. During the transition from the monocytic precursor to the immature mdDC, mature catB is expressed de novo and several cats (mature catS, mature catD, and pro-catL) are upregulated. Importantly, the cat expression profile of mdDCs is virtually identical to CD34+ stem cell–derived DCs, and the cat pattern of monocytes, the mdDC precursors, is similar to other well-defined DC progenitors 28; peripheral blood CD11c+ DC (DC1) precursors and CD11c− plasmacytoid DC (DC2) precursors express the proforms of catB and catL as well as mature catS and catD. The levels of mature enzymes detected are low, probably related to the relative immaturity of DC1 and DC2. Thus, resting DCs and DC precursors differ in the expression levels of pro versus mature proteases only. Our data allow the conclusion that, as far as protease content is concerned, mdDCs (referred to as “DC” from now on) can be used as a representative DC population for our studies.
Figure 1.
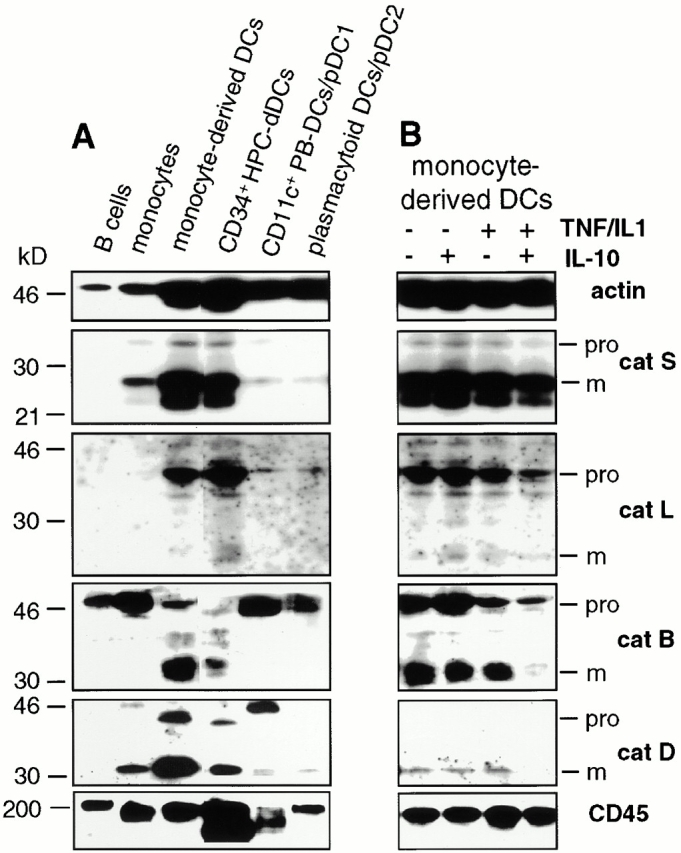
Regulation of cat expression in DCs. (A) cat expression profile of DCs and DC precursors. NP-40 lysates of equal numbers of the indicated cell types were subjected to anti-catS, -catL, -catB, and -catD immunoblotting. Anti-actin and -CD45 reactivity was assessed for control purposes. (B) Regulation of cat expression by pro- and antiinflammatory cytokines. mdDCs were incubated with IL-10 and/or TNF/IL-1 for 24 h before immunoblotting. The positions of pro and mature (m) cats and mol wt markers (kD) are given right and left, respectively.
Do stimuli that control distinctive DC functions regulate the cat expression profile of DCs? The proinflammatory, “DC maturation–inducing” cytokines TNF-α and IL-1β do not induce significant changes in the protease levels detected in DCs (Fig. 1 B). Total intracellular protease content was equally insensitive to treatment with the antiinflammatory stimulus IL-10 alone. Expression of pro-catB was not significantly altered by exposure of DCs to IL-10 plus TNF/IL-1. However, stimulation of IL-10–treated cells with TNF/IL-1 lowers the levels of other proenzymes (pro-catL, pro-catS) and downregulates the expression of mature catB, catS, and catD within 24 h. We next analyzed the kinetics of individual enzymatic activity levels in response to pro- and antiinflammatory stimuli.
Pro- and Antiinflammatory Cytokines Regulate Intracellular cat Activity in a Reciprocal Fashion.
catS, catB, and catL activity can be monitored in intact cells with the active site–directed probe CBz-125I-Tyr-Ala-CN2. catB and catS were constitutively active in resting DCs (Fig. 2 A, left). Stimulation of DCs with TNF/IL-1 induces a rapid (within 30 min) increase in the activity of catS and catB (Fig. 2A and Fig. B, left). No catL activity was observed in resting or activated DCs in most experiments (in 2/20 experiments catL activity was detected after 12 h of stimulation; data not shown). Quantitative analysis (Fig. 2 A, right) demonstrates a sixfold increase of catS activity accompanied by a moderate, but significant (greater than twofold) induction of catB activity upon stimulation with TNF/IL-1. Inclusion of 5 nM LHVS completely blocked catS over the period of observation. Exposure of DCs to the broad cysteine protease inhibitor leupeptin resulted in complete loss of all detected cats (Fig. 2 A, left). Although IL-10 alone does not decrease catS and catB activity in DCs (Fig. 2 B, 0 h), it attenuates the TNF/IL-1–mediated upregulation of catS and catB and induces a successive loss of both active enzymes in TNF/IL-1–stimulated DCs (Fig. 2 B). In summary, these data show that proinflammatory cytokines induce an immediate upregulation of enzymatic activity that can be suppressed by the antiinflammatory stimulus IL-10. Does such a cytokine-dependent regulation of proteolytic activity affect class II processing?
Figure 2.

Reciprocal regulation of cat activity by cyto-kines. (A) Proinflammatory cytokines upregulate catS and catB activity. DCs were incubated for 4 h with or without LHVS or leupeptin and were cultured in the presence or absence of TNF/IL-1 for the indicated time periods. (Left) Autoradiography of an active-site labeling experiment. The positions of active catS and catB are indicated. (Right) Quantification of TNF/IL-1–induced catS and catB activities. Data are expressed as the mean percentage cat activity (± SEM, n = 3) in TNF/IL-1–stimulated DCs as compared with nonstimulated controls. (B) IL-10 downregulates catS and catB activity. After overnight culture in medium (left, upper gel) or in medium containing IL-10 (left, lower gel), DCs were exposed to TNF/IL-1 and analyzed for catS and catB activity. (Left) Representative autoradiography. (Right) Quantification of the IL-10–induced loss of catS and catB activity. Data are expressed as the mean percentage cat activity (± SEM, n = 3) in IL-10–treated DCs as compared with controls.
Cytokine-induced catS Activity Mediates Rapid and Efficient SDS Stable Class II αβ Dimer Formation.
We examined the kinetics of class II maturation in TNF/IL-1–stimulated and resting DCs by pulse-chase analysis. The metabolically labeled, nonstimulated cells maintained the HLA-DRlowCD86lowCD83− phenotype of immature resting DCs and responded to TNF/IL-1 stimulation equally well as nonlabeled DCs (data not shown). Immunoprecipitations were performed at the indicated time points from cell number–adjusted aliquots of metabolically labeled DCs using the HLA-DR–specific mAb TÜ36. This mAb recognizes HLA-DR-αβ bound to full-length Ii (splice variants p31/33, p41, and the highly sialylated form of p41, p47), or to Ii remnants (SLIP, leupeptin-induced Ii peptide [LIP], CLIP), as well as HLA-DR-αβ–peptide complexes. Fig. 3 A shows the rapid formation of SDS stable class II αβ dimers in TNF/IL-1–activated DCs. After a 2-h chase, stimulated DCs already contained 36% of the total HLA-DR-β–bound radioactivity in SDS stable HLA-DR-αβ dimers (average, n = 3). This value increases to 73% after 16 h (Fig. 3 B). In contrast, in resting DCs (Fig. 3 E) SDS stable class II dimers appear slowly and rather inefficiently (only 36% of HLA-DR-β incorporated radioactivity in SDS stable dimers after 16 h). Dimer formation by resting DCs is hardly affected by catS blockade (Fig. 3E and Fig. G) and few SLIP fragments accumulate when LHVS is added to the culture (Fig. 3 F). This finding is consistent with the rather low level of catS activity of resting DCs, as detected with CBz-125I-Tyr-Ala-CN2 (Fig. 2 A). LHVS-mediated inhibition of catS in activated DCs induces the accumulation of SLIP (Fig. 3a and Fig. C) and a pronounced, but temporary, inhibition in the generation of SDS stable class II dimers (Fig. 3a and Fig. B). These findings correlate well with the activation-induced upregulation of catS activity (Fig. 2). In summary, the wave of MHC class II SDS stable dimer formation induced by TNF/IL-1 (Fig. 3 D) depends on and is mediated by the immediate upregulation of catS activity seen in response to such treatment.
Figure 3.


Cytokine-induced catS activity mediates efficient SDS stable class II dimer formation. (A) Metabolically labeled DCs were chased in TNF/IL-1–containing medium in the presence or absence of LHVS and subjected to anti–HLA-DR immunoprecipitation. Nonboiled (NB) and boiled (B) precipitates were analyzed by SDS-PAGE. The positions of free HLA-DR-α (α) and β chains (β), Ii isoforms (p33, p41, p47), SDS stable HLA-DR-αβ dimers (αβ), and LHVS-induced SLIP are indicated. (B–G) Pulse-chase immunoprecipitation experiments from TNF/IL-1–stimulated (B–D) and resting DCs (E and F) in the presence (•) or absence of LHVS (○). The radioactivity incorporated into SDS stable dimers (B and E) or into SLIP (C and F) is expressed as the percent of the total HLA-DR-β–bound radioactivity (ordinate; mean % ± SEM, n = 3). (D and G) catS-dependent class II dimer formation expressed as the difference between the SDS stable dimers in control and LHVS-treated cells (ordinate). Abscissa shows the chase time.
IL-10 Alters Class II Processing by Modulating cat Activity.
Is the observed IL-10–mediated downregulation of cat activity relevant for Ii degradation and SDS stable class II αβ dimer formation? TNF/IL-1–stimulated DCs, either unmodified or precultured in IL-10– or LHVS-containing medium, were metabolically labeled and subjected to HLA-DR immunoprecipitation. As expected, inhibition of catS by LHVS induces accumulation of SLIP (Fig. 4 A). SLIP appears in precipitates from IL-10–exposed but not from control DCs (Fig. 4 A). Since catS is the major enzyme that can effectively digest SLIP in TNF/IL-1–stimulated DCs, it appears that IL-10 impairs catS activity such that it affects class II maturation. Indeed, exposure of DCs to IL-10 leads to a delay in SDS stable dimer formation (Fig. 4 B), but has no effect on the synthesis of the class II subunits themselves (Fig. 4 A). Thus, it appears that the temporary accumulation of SLIP in stimulated, IL-10–treated DCs is because of the combined action of the TNF/IL-1–mediated increase in class II synthesis and the attenuated catS activity in response to IL-10.
Figure 4.
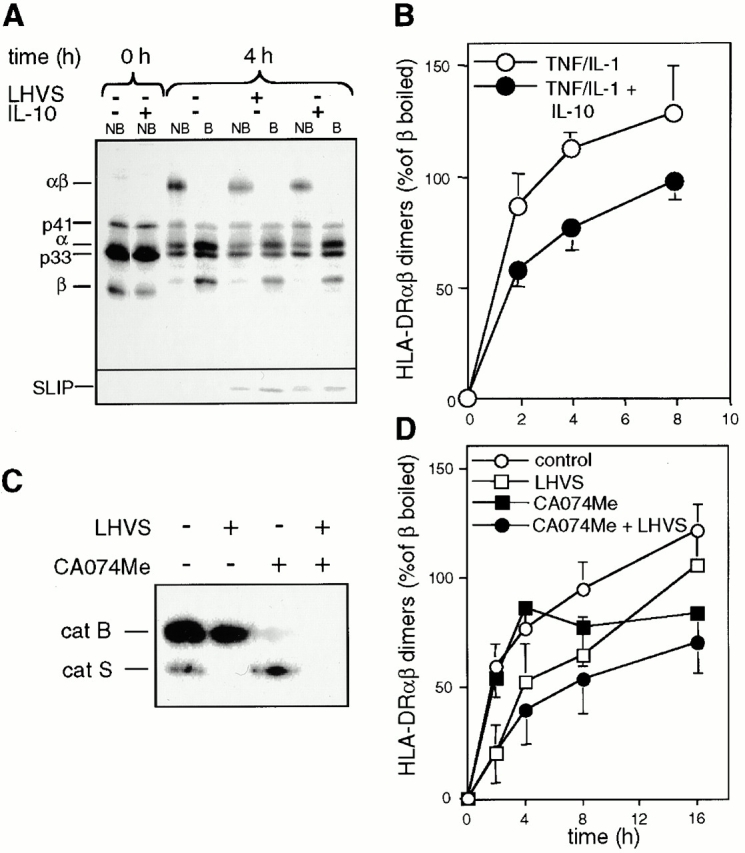
Role of IL-10 and catB for SDS stable class II dimer formation. (A and B) IL-10 delays SDS stable dimer formation. DCs cultured in the presence or absence of LHVS for 4 h or IL-10 (overnight) were stimulated with TNF/IL-1 for 4 h, metabolically labeled, and chased under prelabeling culture conditions. Immunoprecipitated class II complexes were analyzed by SDS-PAGE. (A) Representative autoradiography. (B) Quantification of SDS stable dimer formation in IL-10–treated (•) and control DCs (○). The radioactivity incorporated into SDS stable dimers is expressed as the percent of the total HLA-DR-β–bound radioactivity (ordinate; mean % ± SEM, n = 3). Abscissa gives the chase time. (C) Selective elimination of catS and/or catB activity in DCs. DCs were incubated with or without LHVS, CA074Me, or both inhibitors for 4 h. cat activity was analyzed using CBz-125I-Tyr-Ala-CN2. The inhibition profile remained constant for >16 h (data not shown). (D) catB activity contributes to SDS stable dimer formation. DCs were exposed to LHVS (□), CA074Me (▪), the combination of both (•), or medium only (○) and stimulated with TNF/IL-1 for 4 h and then subjected to pulse-chase immunoprecipitation as described. The radioactivity incorporated into SDS stable dimers is expressed as the percentage of the total HLA-DR-β–bound radioactivity (ordinate; mean % ± SEM, n = 3). Abscissa gives the chase time.
As IL-10 suppresses not only catS but also catB activity, we assessed the relative impact of either protease on class II maturation. For this purpose, the catB- and the catS-specific inhibitors CA074Me and LHVS were used to create catB- and/or catS-deficient cells (Fig. 4 C) for pulse-chase analysis. 100 nM CA074Me did not influence or only moderately influenced catS activity during the 16-h chase period (4-h time point in Fig. 4 C). In agreement with our earlier results, catS but not catB mediates rapid SDS stable dimer formation in cytokine-stimulated DCs. Our conclusion that dimers that form late during the chase period rely on catB rather than catS activity is, however, based on the assumption that CA074Me does not prevent the activation and maturation of enzymes other than catB. DCs deficient for both enzymes show reduced dimer formation during the entire time period analyzed (Fig. 4 D). This temporal resolution of the individual enzyme's contributions suggests that they serve discrete functions in the class II pathway. Accordingly, LHVS, but not CA074Me, induces the accumulation of Ii remnants (Fig. 2 and Fig. 4, and data not shown).
IL-10 Inhibits Ag Degradation by DCs.
To further characterize the functional importance of catB in DCs, we asked whether pharmacological or cytokine-mediated modulation of catB results in impaired Ag degradation and, consequently, altered peptide display. Digestion of iodinated IgG internalized via FcγRII was used to investigate Ag degradation by DCs. Equal numbers of Ag-loaded cells were chased for various time periods and fragmentation patterns of internalized IgG were analyzed. TNF/IL-1 treatment increases the capacity of DCs to degrade Ag, as judged from the accelerated disappearance of both full-length IgG and its fragments (Fig. 5 A). IL-10 treatment of nonstimulated cells was without visible effect (data not shown). When IL-10–treated DCs were stimulated with TNF/IL-1, their Ag degradation capacity changed considerably (Fig. 5 B). Untreated and IL-10–treated DCs internalized IgG with virtually identical kinetics and efficacy (Fig. 5 C) excluding the possibility of prolonged Ag persistence at the cell surface. In stimulated DCs, intact Ag has a t 1/2 of ∼1 h and degradation products are hardly discernible (Fig. 5 B). The presence of IL-10 increases the t 1/2 of intact Ag to >8 h and protein fragments ranging from 20 to 60 kD become prominent (Fig. 5B and Fig. D). Similar to the results seen in the FcγRII targeting experiments, the degradation of IgG taken up via the mannose receptor pathway of macropinocytosis 36 was inhibited by IL-10 although internalization rates were not at all affected (data not shown). We conclude that IL-10 indeed inhibits the Ag degrading capacity of DCs.
Figure 5.

IL-10 inhibits Ag degradation but not Ag uptake. (A–D) DCs were cultured in the presence or absence of IL-10 overnight. When indicated, DCs were stimulated with TNF/IL-1 for 4 h. Cells were exposed to anti-FcγRII mAbs followed by 125I-labeled goat anti–mouse IgG (A and B) or biotinylated anti-FcγRII mAbs followed by goat anti–mouse F(ab′)2 at 4°C (C) and chased under prelabeling conditions. The degradation of iodinated IgG was followed by nonreducing 10% SDS-PAGE (A and B). Mol wt markers in kD on the left. (C) The internalization of biotinylated IgG via FcγRII was assessed by SA-PE labeling and FACS®. The percentage of Ag internalized (ordinate) by IL-10–treated (•) and control DCs (○) (mean percentage of two experiments) is depicted as a function of the chase time (abscissa). (D) Quantification of [125I]IgG degradation by IL-10–treated (•) and control DCs (○). The percentage of intact IgG (ordinate) is depicted as a function of the processing time (abscissa; mean % ± SEM, n = 3).
IL-10 Inhibits Ag Degradation by Inhibiting catB Activity and by Modulating the pH of Endocytic DC Compartments.
Do specific cat inhibitors and IL-10 induce similar Ag fragmentation patterns? If so, a comparison between inhibitor- and IL-10–treated cells could provide further clues as to the key protease(s) involved. IL-10 treatment of DCs induces the accumulation of IgG fragments in the range from 20 to 60 kD (Fig. 6 A). Although 100 nM CA047Me selectively inhibited catB in our experimental setting (Fig. 4 C), a single mode of interference still may not be sufficient to allow definitive conclusions about the function of this enzymatic activity 37. Thus, we decided to use three independent strategies to block catB, i.e., exposure of DCs to (a) CA047Me 38, (b) the catB/catL–specific inhibitor Fmoc YACHN2 26, and (c) a high concentration of LHVS (0.5 μM) that eliminates catB, catL, and catS activity 12 16 39. Each condition produced an Ag fragmentation pattern quantitatively and qualitatively similar to IL-10–exposed DCs (Fig. 6 A). Thus, these fragments are attributable to IL-10–mediated inhibition of catB. catS and catL are not required for Ag degradation in the presence of active catB. catS and catL become important only in the absence of active catB. This is seen from the accumulation of fragments <30 kD in catL/catB– and catS/catB–double deficient cells to an extent similar to IL-10–exposed DCs. Data from cat B−/− mice show only a modest shift in the efficiency of presentation of certain antigenic determinants indicative for a minor role of this protease for Ag degradation in murine splenocytes 40. Our results with human DCs differ from this observation and underline again the importance of studying defined populations of APCs in their own sight. In summary, we conclude that catB is a major Ag-degrading protease of human DCs and, further, that catB activity is negatively regulated by IL-10.
Figure 6.


IL-10 inhibits catB-mediated Ag degradation and modulates the pH of endocytic DC compartments. (A) IL-10 inhibits Ag degradation by inhibiting catB activity. DCs were cultured in the presence or absence of IL-10 overnight or were exposed for 4 h to bafilomycin, CA074Me, LHVS (5, 50, or 200 nM; indicated by the wedge), CA074Me plus LHVS (5 nM), or FmocYACHN2 in the presence of TNF/IL-1. Next DCs were labeled with anti-FcγRII/125I-goat anti–mouse IgG and allowed to process Ag for 2 h at 37°C. The fragmentation pattern of [125I]IgG in the ≤ 65-kD range is shown. (B) Internalized immune complexes experience a less acidic milieu in DCs exposed to IL-10. DCs cultured in the presence (•) or absence of IL-10 (○) were exposed to TNF/IL-1 for 4 h. Then cells were labeled with biotinylated anti-FcγRII and goat anti–mouse F(ab′)2, or with FcγRII followed by FITC- or OG-labeled goat anti–mouse F(ab′)2, and chased under prelabeling conditions for the indicated time peroids (abscissa). On the ordinate, the percentage of the ligand internalization (broken lines; mean, n = 2) and of the pH-dependent reduction of ligand fluorescence (solid lines; mean ± SEM, n = 3) is shown. (C) IL-10 increases the pH of endocytic DC compartments. DCs were loaded with LysoSensor™-coupled dextran in the presence or absence of IL-10 overnight and then exposed to TNF/IL-1 for 6 h. The endosomal pH of DCs either exposed (lower) or not exposed to IL-10 (upper) was determined microscopically and is shown in a pH color code. (D) catB and S activity is downregulated by reagents that raise endosomal pH. DCs were cultured for 4 h in the presence or absence of bafilomycin, or chloroquine in TNF/IL-1–supplemented medium, and subjected to active-site labeling. Positions of catS and catB are shown.
Since the pH of endo/lysosomal compartments is a critical factor regulating the activity and stability of cats 16 41, we asked whether IL-10 inhibits protease activities in DCs by elevating the pH of the endocytic pathway. DCs were labeled with mouse mAbs to FcγRII followed by anti–mouse Abs coupled to a low pH-sensitive dye (FITC), and pH-dependent FITC quenching, which accompanies ligand internalization, was monitored (Fig. 6 B). In the presence of IL-10, intracellular FITC quenching was strikingly reduced whereas the kinetics and efficacy of ligand internalization were not affected (Fig. 6 B). Using quantitative ratio measurements of fluorescence emission, we further demonstrate directly that endo/lysosomal compartments of IL-10–treated stimulated DCs are less acidic than those of control cells (Fig. 6 C). Calculations based on the standard curve show that the average pH in endocytic compartments changes from pH 4.5 to 5.3 (data not shown).
Do drugs that raise the pH of the endo/lysosomal system reproduce the effects of IL-10 in DCs? DCs were exposed to the lysosomotropic drugs bafilomycin or chloroquine and monitored for their cat activity, their total intracellular protease content, and for their Ag degradation capacity. Active-site labeling shows that catB and catS activity are massively downregulated upon exposure of DCs to either of the pH-modulating drugs (Fig. 6 D). Both compounds significantly lower the total intracellular protein levels of mature catB and catS in DCs as assayed by immunoblotting (data not shown). Importantly, DCs exposed to bafilomycin were largely incapable of degrading intact Ag taken up via FcγRII and showed accumulation of a major 50-kD IgG fragment also prominent in IL-10–treated and catB-deficient DCs (Fig. 6 A). According to the literature, IL-6 acidifies endosomes in DCs 42. Our data suggest that IL-10, by raising endo/lysosomal pH, induces the opposite effect. Indeed, IL-6 reverses the IL-10–induced impairment of Ag degradation (data not shown). Thus, we conclude that regulation of endosomal pH by IL-10 contributes to the control of proteolytic activity.
IL-10 Prevents Long-Term Delivery of a TCR Signal.
TNF/IL-1–induced accumulation of HLA-DR at the cell surface is clearly impaired by IL-10 as determined by FACS® (Fig. 7 A). Likewise, leupeptin treatment results in reduced class II surface expression upon exposure to TNF/IL-1 (Fig. 7 A). In contrast, neither IL-10 nor leupeptin clearly affects the surface expression of HLA-DR in resting DCs (Fig. 7 A, time point 0), the TNF/IL-1–induced upregulation of total cellular HLA-DR (Fig. 7 B), and the stimulation-induced downregulation of macropinocytotic Ag uptake (data not shown). Reduced HLA-DR surface expression seen in IL-10–treated DCs most likely involves an export defect since internalization of class II from the cell surface was not enhanced by IL-10 or leupeptin (Fig. 7 C, and data not shown). These results strengthen the interpretation that IL-10 affects class II trafficking by regulating lysosomal protease function and not simply by preventing TNF/IL-1–induced activation of DCs.
Figure 7.
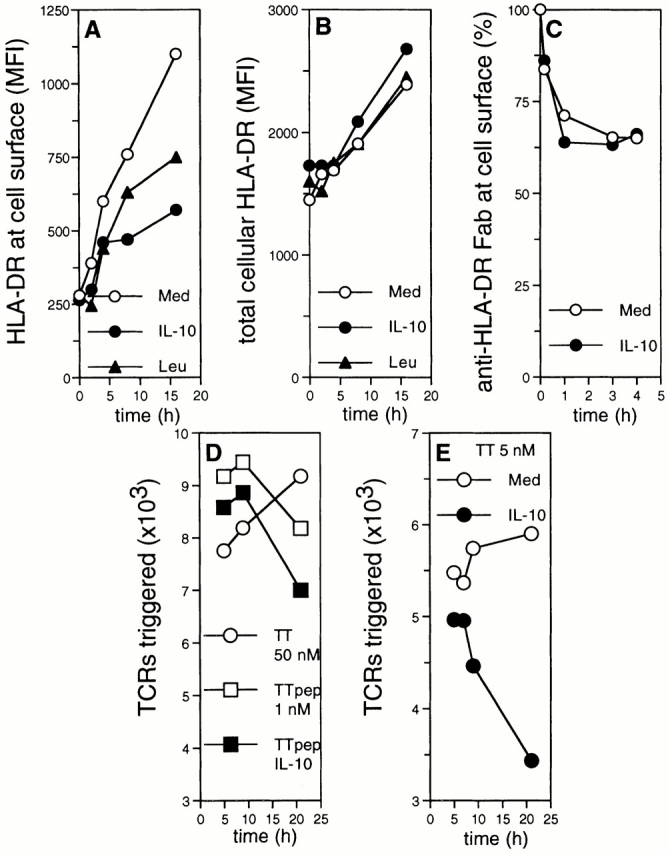
IL-10 inhibits export and display of class II–peptide complexes. (A and B) IL-10 inhibits export but not synthesis of class II. DCs were cultured overnight in the presence of IL-10 (•), leupeptin (▴), or medium only (○), and then stimulated with TNF/IL-1. Intact (A) and permeabilized cells (B) were subjected to anti–HLA-DR immunolabeling. Specific MFI (ordinate) are plotted against the time of TNF/IL-1 stimulation (abscissa). (C) Internalization of class II from the cell surface is not altered by IL-10. DCs cultured in the presence (•) or absence of IL-10 (○) were exposed to TNF/IL-1 for 4 h. Cells were labeled with biotinylated anti–HLA-DR Fab and chased under prelabeling culture conditions. The percentage of biotinylated mAb remaining at the cell surface is shown (ordinate) as the function of time (abscissa). (D and E) IL-10 inhibits the long-term display of full protein-derived, class II–associated peptides. DCs cultured in the presence (closed symbols) or absence of IL-10 (open symbols) were exposed to TNF/IL-1 for 4 h. Cells were pulsed with TT (50 and 5 nM; circles in D and E, respectively) or 1 nM TT peptide (TTpep; squares in D) and chased under prepulsing culture conditions. During the last 4 h, cells were cocultured with TT-specific T cells. The absolute numbers of triggered TCRs (ordinate) are plotted against the time of processing (abscissa). Representative experiment (n = 4).
To analyze the impact of IL-10 on the surface display of class II–bound peptides, we exploited internalization of newly engaged TCRs as a measure of specific class II–peptide display 43. Activated DCs were pulsed with TT or TT peptides and analyzed for their capacity to trigger TCRs of TT-specific TCCs. The kinetics of peptide-induced TCR triggering by IL-10–treated DCs is comparable to untreated cells (Fig. 7 D), yet the extent to which downregulation of the TCR occurs is markedly less. The lower level of TCR triggering by IL-10–treated DCs must correspond to their reduced display of HLA-DR loaded with TT peptides at the cell surface. As expected, TCR downregulation by peptide-pulsed DCs occurs instantaneously and decays during the chase. In contrast, TCR triggering by TT-pulsed DCs requires >1 h of processing of TT, but thereafter increases constantly over hours to days (Fig. 7 D, and data not shown). The level and kinetics of processing-dependent presentation of TT are significantly altered by IL-10 exposure of DCs (Fig. 7 E). Until 7 h after the pulse, similar numbers of TCRs are triggered by IL-10–treated and control DCs. Thereafter, the TCR-triggering capability of IL-10–exposed DCs drops. No additive defect in peptide presentation was observed when DCs were exposed to IL-10 and catB inhibitors simultaneously (data not shown), supporting the role of IL-10 in regulation of catB activity.
To quantify the IL-10 effect on class II–peptide display, DCs were pulsed with various concentrations of TT or TT peptides and the numbers of TCRs triggered by these cells were measured. We observed a strictly linear correlation between the numbers of triggered TCRs and the logarithm of the concentrations of intact protein Ag as well as peptide used during the pulse (Fig. 8 A). The two regression curves are parallel, indicating that synthetic peptides and the peptides generated from TT protein by DCs are incorporated into class II complexes of comparable TCR triggering capacity. A linear correlation exists between the logarithm of the absolute number of class II–peptide complexes displayed and the number of TCRs triggered 33. Therefore, we conclude that a linear correlation exists also between the Ag concentration encountered by the DC and the absolute number of MHC class II–peptide complexes transported to the cell surface. Consequently, when the measured numbers of triggered TCRs (ordinate; Fig. 8 A) are projected onto the TT regression curve, the value obtained on the abscissa is a direct measure of the number of MHC class II–peptide complexes displayed by the DC.
Figure 8.

Quantification of the TCR signaling deficit imposed by IL-10. (A) The numbers of triggered TCRs and the logarithm of the concentration of pulsed Ag are correlated in a linear fashion. Short-term TNF/IL-1–stimulated DCs were pulsed with TT (▪) or TT peptide (▴) at the indicated concentrations (abscissa). Cells were cultured for 8 h under prepulsing conditions and TT-dependent TCR triggering (ordinate) was assessed. The linear regression analysis for TT and TT peptide is shown. (B) IL-10 modulates the magnitude and duration of the TCR signal. DCs either exposed to IL-10 (closed symbols) or not exposed (open symbols) were pulsed with 5 nM (circles) or 50 nM TT (squares), and chased for the indicated time periods (abscissa). The ordinate shows the display of MHC class II–peptide complexes by IL-10-modified DCs (DC10; mean % ± SEM, n = 3) relative to control DCs (DCCO). The relative numbers of MHC class II–peptide complexes transported to the cell surface was calculated using the formula: relative class II–peptide display = [e(TCRs triggered by DC10)/e(TCRs triggered by DCCO)] 1/K. K is the constant defining the slope of the regression curve describing the correlation between the concentration of pulsed Ag and the number of triggered TCRs. K is not influenced by IL-10 (data not shown).
IL-10–exposed and control DCs were pulsed with 5 or 50 nM TT and assayed for their TCR triggering capacity after various chase periods. IL-10 strikingly reduces the t 1/2, but less so the amplitude, of the signal delivered by DCs to the TCR (Fig. 8 B). Importantly, the inhibitory effect of IL-10 on class II-peptide display was equally pronounced at 5 and 50 nM TT. The peptide-bound class II αβ complexes formed initially disappear from the cell surface with a t 1/2 of 12–15 h (Fig. 8 B) and with kinetics strikingly similar to those of class II molecules loaded with synthetic peptide (Fig. 7 D, and data not shown). In summary, IL-10 prevents the continuous formation of peptide–class II complexes and/or their export from the endo/lysosomal system and, as a result, directly affects T cell activation.
Discussion
For DCs to evoke a primary T cell response, processing of internalized Ag and proper maturation of MHC class II complexes are essential. We have examined the nature and function of cats capable of mediating these events in mdDCs as examples of professional APCs. This choice is validated by our observation that the cat expression pattern of mdDCs is representative of other types of DCs. We show that Ag processing and class II maturation are controlled by at least two proteases with discrete functions, catS and catB. DCs almost instantaneously upregulate the activity of both enzymes in response to proinflammatory cytokines, an effect counteracted by the antiinflammatory cytokine IL-10. Based on the use of specific inhibitors we conclude that catS is one of the major enzymes that generates SDS stable class II dimers in human DCs. The catS-dependent pathway of class II dimer formation operates efficiently when DCs encounter proinflammatory cytokines and is inhibited by IL-10. Class II SDS stable dimer formation in DCs is sensitive to catS inhibition by LHVS, but only early in the course of biosynthesis. Furthermore LHVS-induced accumulation of SLIP and catS-dependent dimer formation show strikingly similar kinetics.
In the absence of proinflammatory stimuli, DCs display baseline catS activity and do not accumulate class II–SLIP complexes. This situation differs from that described for immature murine bone marrow–derived DCs, which accumulate SLIP and are therefore thought to be devoid of catS activity 21. In this regard, our observation underscores the differences between human and murine APCs. Active catS mediates SLIP degradation in resting human DCs, as seen from the immediate accumulation of SLIP induced by LHVS treatment. Nonetheless LHVS-exposed, cytokine-activated DCs still show SLIP degradation and SDS stable dimer formation, but at a reduced rate, suggesting the involvement of other unidentified proteases. catF, a SLIP degrading enzyme in mouse macrophages 17, is an obvious candidate for this phenomenon. LHVS at 20 nM, a concentration shown to interfere with catF activity 17, was unable to abolish SLIP degradation in our experimental system (data not shown). The lack of cell-permeable, catF-specific probes renders functional studies on a possible contribution of catF difficult at the moment. Our data clearly show that catS is used preferentially when DCs are activated. Then its activity and importance for SDS stable dimer formation clearly exceeds that of the other presumably less efficient enzymes.
Proinflammatory stimuli evoke rapid formation of peptide-loaded class II dimers by upregulating cat activity, whereas antiinflammatory stimuli like IL-10 counteract this. The fast increase (within 30 min) in protease activity in response to TNF/IL-1 rather excludes transcriptional regulation as the underlying mechanism. Although still to be proven experimentally, it is likely that relocalization of (pro)enzymes into compartments with pH levels that favor enzymatic activity occurs in a cell activation–dependent fashion. According to the literature 21, Cy C is involved in the inhibition of cat activity in murine DCs. Thus, we investigated whether cytokines that modulate cat activity also regulate the expression or the subcellular distribution of this endogenous cat inhibitor. However, neither immunoblotting nor confocal laser scanning microscopy revealed significant changes in Cy C levels or localization in response to any of the applied cytokines (data not shown). In summary, our data argue against the possibility that Cy C is involved in cytokine-mediated cat regulation in human DCs.
The decrease in cat activity by IL-10 is physiologically relevant, as demonstrated by the reduced ability of IL-10–treated DCs to activate T cells. catB's major enzymatic targets are Ags that enter DCs via macropinocytosis (mannose receptor dependent) or via coated pits and vesicles (FcγRII mediated). IL-10 inhibits the degradation of both full-length protein Ags and Ag fragments. Pharmacologic inhibition of catB, but not of catS or catL activity, similarly inhibits Ag degradation. Some Ag breakdown products appear early after Ag loading in IL-10–treated and pharmacologically catB-depleted DCs. Enzymes that may attack complex protein Ag include asparaginyl endopeptidase, a protease implicated in TT cleavage 6 44. Our observation that full protein Ag persists while the Ag fragments formed initially decay in IL-10–treated DCs shows that the activity of these proteases is attenuated by IL-10.
The alteration of the intracompartmental pH may contribute to the inhibition of cat activity by IL-10. IL-10 can influence the pH of Ag-loading compartments, as demonstrated by increased acidification of mycobacterial phagosomes in macrophages from IL-10 knockout mice and, vice versa, decreased acidification upon exposure of susceptible cells to this cytokine 45. We show that internalized Ags experience a less acidic milieu in DCs exposed to IL-10. Pharmacological inhibition of acidification mimics the IL-10–induced defect in Ag degradation. Whereas the expression of proteases that are more stable at a pH close to neutral is hardly affected, IL-10 treatment downregulates the mature form of those proteases that require acidic pH for their stability (catD, catB; reference 41). Thus, inhibition of enzymatic activities induced by IL-10 most likely includes pH-regulated maturation and activation, pH-dependent autocatalytic degradation, and, for some proteases, the release into extracellular space 46. IL-10 could additionally affect cellular functions not yet addressed, i.e., the trafficking of Ags or proteases towards class II loading compartments. Moreover, it is expected that the functional program activated by exposure of DCs to IL-10 is highly complex. Array-based transcriptional profiling may be helpful in defining this program, and in turn, may allow a more directed cell biological analysis of IL-10's inhibitory effects on Ag presentation.
We used the TCR triggering assays for a semiquantitative estimate of peptide display by cytokine-modified DCs. Titration and kinetics revealed that pro and antiinflammatory cytokines regulate the levels of surface class II peptide display by DCs in a differential manner. Remarkably, a simple mathematical term describes the relationship between the concentration of Ag/peptide pulsed onto the DC and the number of TCRs engaged during a cognate DC–T cell interaction. The logarithm of the Ag and peptide concentration and the number of triggered TCRs correlate in linear fashion. The number of class II–peptide complexes on the APC surface and the number of engaged TCRs are also correlated in semilogarithmic fashion 43. Therefore DCs convert extracellular Ag into surface-disposed class II peptide complexes with constant molar efficacy. The fact that serial triggering of TCRs is most efficient when the APC expresses one or only few class II complexes containing the relevant peptide renders the class II display measurement extremely sensitive. The linear regression calculated for the display of peptides derived from TT intersects the abscissa at an Ag concentration of <10−10 M. Thus, on average, each DC displays one TT peptide at an Ag concentration of ∼10−10 M. DCs internalize extracellular fluid equal to their own volume (∼2.5 × 10⁻¹³ l) in ∼1 h 36. Based on the assumption that the major internalization mechanism for TT by DCs is fluid-phase uptake 47, we calculate that a DC pulsed with 10−10 M TT (i.e., 6.023 × 10¹³ molecules/liter) for 30 min internalizes 1.3 × 10⁻¹³ liter of the solute, equivalent to ∼8 TT molecules. The internalization of this small number of intact Ag molecules suffices to trigger several hundred Ag-specific TCRs. We observed that TNF/IL-1–stimulated DCs express approximately twice the amount of TT peptide–bearing class II complexes when compared with unstimulated controls after a short Ag pulse (data not shown). The ability of unstimulated DCs to display TT peptide in the context of class II was described previously 1. In contrast, others observed that stimulated but not unstimulated murine DCs can present a peptide derived from a hen egg lysozyme 48 49. In summary, these findings support previous suggestions that human DCs and murine bone marrow–derived DCs differ in terms of their Ag processing and presentation machinery 16 50. IL-10 causes a dramatic change in peptide–class II display on the surface of DCs. Whereas peptide–class II display is only partially reduced during the first hours after the Ag pulse, long-term display of the complexes is essentially aborted in IL-10–exposed cells. The decay of peptide presentation by protein Ag-pulsed, IL-10–treated DCs equals peptide-pulsed DCs. The Ag presentation defect imposed by IL-10 therefore results from inhibition of formation or export, and not destabilization, of peptide–class II complexes. Thus, we, attribute limited peptide availability during the late phase of Ag presentation to IL-10–mediated protease inhibition.
Immunologically naive T cells require TCR stimulation at suprathreshold intensity for >30 h before they become committed to proliferation and cytokine production 43 51. Our findings suggest that the suppressive action of IL-10 on T cell activation may result in premature termination of TCR signals. Ag-specific tolerization of T cells by IL-10 has been attributed mainly to suppression of costimulation. When costimulation is limited, as found in connection with exposure to IL-10, the magnitude and duration of signals via the TCR decide whether Ag-specific T cell anergy or activation occurs 52. Thus, naive T cells that receive a TCR signal at subthreshold intensity or duration too short to induce their functional commitment may become anergic. If this interpretation of the effects of IL-10 were correct, then indeed manipulating protease activities could be useful to paralyze pathogenic T cells.
Acknowledgments
B. Reininger is gratefully acknowledged for technical help.
This work was supported by the Interdisciplinary Cooperation Project, a program of the Austrian Ministry for Science and a grant from Novartis Ltd., Basel, Switzerland. E. Fiebiger is supported by an Erwin-Schrödinger Fellowship from the Austrian Science Foundation.
Footnotes
E. Fiebiger and P. Meraner contributed equally to this work.
Abbreviations used in this paper: cat, cathepsin; CLIP, class II–associated Ii-derived peptide; Cy C, cystatin C; DC, dendritic cell; HLA, histocompatibility leukocyte antigen; Ii, invariant chain; LHVS, N-morpholinurea-leucine-homophenylalanine-vinylsulfone-phenyl; LIP, leupeptin-induced Ii peptide; md, monocyte-derived; MFI, mean fluorescence intensity; OG, oregon green; SLIP, small leupeptin-induced Ii peptide; TCC, T cell clone; TT, tetanus toxoid.
References
- Cella M., Engering A., Pinet V., Pieters J., Lanzavecchia A. Inflammatory stimuli induce accumulation of MHC class II complexes on dendritic cells. Nature. 1997;388:782–787. doi: 10.1038/42030. [DOI] [PubMed] [Google Scholar]
- Cella M., Sallusto F., Lanzavecchia A. Origin, maturation and antigen presenting function of dendritic cells. Curr. Opin. Immunol. 1997;9:10–16. doi: 10.1016/s0952-7915(97)80153-7. [DOI] [PubMed] [Google Scholar]
- Banchereau J., Steinman R.M. Dendritic cells and the control of immunity. Nature. 1998;392:245–252. doi: 10.1038/32588. [DOI] [PubMed] [Google Scholar]
- Morel A.S., Quaratino S., Douek D.C., Londei M. Split activity of interleukin-10 on antigen capture and antigen presentation by human dendritic cellsdefinition of a maturative step. Eur. J. Immunol. 1997;27:26–34. doi: 10.1002/eji.1830270105. [DOI] [PubMed] [Google Scholar]
- Villadangos J.A., Ploegh H.L. Proteolysis in MHC class II antigen presentationwho's in charge? Immunity. 2000;12:233–239. doi: 10.1016/s1074-7613(00)80176-4. [DOI] [PubMed] [Google Scholar]
- Manoury B., Hewitt E.W., Morrice N., Dando P.M., Barrett A.J., Watts C. An asparaginyl endopeptidase processes a microbial antigen for class II MHC presentation. Nature. 1998;396:695–699. doi: 10.1038/25379. [DOI] [PubMed] [Google Scholar]
- Authier F., Posner B.I., Bergeron J.J. Endosomal proteolysis of internalized proteins. FEBS Lett. 1996;389:55–60. doi: 10.1016/0014-5793(96)00368-7. [DOI] [PubMed] [Google Scholar]
- Mort J.S., Buttle D.J. Cathepsin B. Int. J. Biochem. Cell. Biol. 1997;29:715–720. doi: 10.1016/s1357-2725(96)00152-5. [DOI] [PubMed] [Google Scholar]
- Authier F., Metioui M., Bell A.W., Mort J.S. Negative regulation of epidermal growth factor signaling by selective proteolytic mechanisms in the endosome mediated by cathepsin B. J. Biol. Chem. 1999;274:33723–33731. doi: 10.1074/jbc.274.47.33723. [DOI] [PubMed] [Google Scholar]
- Cresswell P. Assembly, transport, and function of MHC class II molecules. Annu. Rev. Immunol. 1994;12:259–293. doi: 10.1146/annurev.iy.12.040194.001355. [DOI] [PubMed] [Google Scholar]
- Watts C. Capture and processing of exogenous antigens for presentation on MHC molecules. Annu. Rev. Immunol. 1997;15:821–850. doi: 10.1146/annurev.immunol.15.1.821. [DOI] [PubMed] [Google Scholar]
- Riese R.J., Wolf P.R., Bromme D., Natkin L.R., Villadangos J.A., Ploegh H.L., Chapman H.A. Essential role for cathepsin S in MHC class II-associated invariant chain processing and peptide loading. Immunity. 1996;4:357–366. doi: 10.1016/s1074-7613(00)80249-6. [DOI] [PubMed] [Google Scholar]
- Villadangos J.A., Riese R.J., Peters C., Chapman H.A., Ploegh H.L. Degradation of mouse invariant chainroles of cathepsins S and D and the influence of major histocompatibility complex polymorphism. J. Exp. Med. 1997;186:549–560. doi: 10.1084/jem.186.4.549. [DOI] [PMC free article] [PubMed] [Google Scholar]
- Shi G.P., Villadangos J.A., Dranoff G., Small C., Gu L., Haley K.J., Riese R., Ploegh H.L., Chapman H.A. Cathepsin S required for normal MHC class II peptide loading and germinal center development. Immunity. 1999;10:197–206. doi: 10.1016/s1074-7613(00)80020-5. [DOI] [PubMed] [Google Scholar]
- Nakagawa T.Y., Brissette W.H., Lira P.D., Griffiths R.J., Petrushova N., Stock J., McNeish J.D., Eastman S.E., Howard E.D., Clarke S.R. Impaired invariant chain degradation and antigen presentation and diminished collagen-induced arthritis in cathepsin S null mice. Immunity. 1999;10:207–217. doi: 10.1016/s1074-7613(00)80021-7. [DOI] [PubMed] [Google Scholar]
- Chapman H.A. Endosomal proteolysis and MHC class II function. Curr. Opin. Immunol. 1998;10:93–102. doi: 10.1016/s0952-7915(98)80038-1. [DOI] [PubMed] [Google Scholar]
- Shi G.P., Bryant R.A., Riese R., Verhelst S., Driessen C., Li Z., Bromme D., Ploegh H.L., Chapman H.A. Role for cathepsin F in invariant chain processing and major histocompatibility complex class II peptide loading by macrophages. J. Exp. Med. 2000;191:1177–1186. doi: 10.1084/jem.191.7.1177. [DOI] [PMC free article] [PubMed] [Google Scholar]
- Nakagawa T., Roth W., Wong P., Nelson A., Farr A., Deussing J., Villadangos J.A., Ploegh H., Peters C., Rudensky A.Y. Cathepsin Lcritical role in Ii degradation and CD4 T cell selection in the thymus. Science. 1998;280:450–453. doi: 10.1126/science.280.5362.450. [DOI] [PubMed] [Google Scholar]
- Li Q., Bever C.T., Jr. Modulation of interferon γ induced increases in cathepsin B in THP-1 cells by adrenergic agonists and antagonists. Cell. Biol. Int. 1998;22:13–20. doi: 10.1006/cbir.1997.0209. [DOI] [PubMed] [Google Scholar]
- Sukhova G.K., Shi G.P., Simon D.I., Chapman H.A., Libby P. Expression of the elastolytic cathepsins S and K in human atheroma and regulation of their production in smooth muscle cells. J. Clin. Invest. 1998;102:576–583. doi: 10.1172/JCI181. [DOI] [PMC free article] [PubMed] [Google Scholar]
- Pierre P., Mellman I. Developmental regulation of invariant chain proteolysis controls MHC class II trafficking in mouse dendritic cells. Cell. 1998;93:1135–1145. doi: 10.1016/s0092-8674(00)81458-0. [DOI] [PubMed] [Google Scholar]
- de Waal Malefyt R., Yssel H., de Vries J.E. Direct effects of IL-10 on subsets of human CD4+ T cell clones and resting T cells. Specific inhibition of IL-2 production and proliferation. J. Immunol. 1993;150:4754–4765. [PubMed] [Google Scholar]
- Willems F., Marchant A., Delville J.P., Gerard C., Delvaux A., Velu T., de Boer M., Goldman M. Interleukin-10 inhibits B7 and intercellular adhesion molecule-1 expression on human monocytes. Eur. J. Immunol. 1994;24:1007–1009. doi: 10.1002/eji.1830240435. [DOI] [PubMed] [Google Scholar]
- Koppelman B., Neefjes J.J., de Vries J.E., de Waal Malefyt R. Interleukin-10 down-regulates MHC class II αβ peptide complexes at the plasma membrane of monocytes by affecting arrival and recycling. Immunity. 1997;7:861–871. doi: 10.1016/s1074-7613(00)80404-5. [DOI] [PubMed] [Google Scholar]
- Enk A.H., Angeloni V.L., Udey M.C., Katz S.I. Inhibition of Langerhans cell antigen-presenting function by IL-10. A role for IL-10 in induction of tolerance. J. Immunol. 1993;151:2390–2398. [PubMed] [Google Scholar]
- Xing R., Addington A.K., Mason R.W. Quantification of cathepsins B and L in cells. Biochem. J. 1998;332:499–505. doi: 10.1042/bj3320499. [DOI] [PMC free article] [PubMed] [Google Scholar]
- Charbonnier A.S., Kohrgruber N., Kriehuber E., Stingl G., Rot A., Maurer D. Macrophage inflammatory protein 3α is involved in the constitutive trafficking of epidermal Langerhans cells. J. Exp. Med. 1999;190:1755–1768. doi: 10.1084/jem.190.12.1755. [DOI] [PMC free article] [PubMed] [Google Scholar]
- Kohrgruber N., Halanek N., Gröger M., Winter D., Rappersberger K., Schmitt-Egenolf M., Stingl G., Maurer D. Survival, maturation, and function of CD11c− and CD11c+ peripheral blood dendritic cells are differentially regulated by cytokines. J. Immunol. 1999;163:3250–3259. [PubMed] [Google Scholar]
- Jaksits S., Kriehuber E., Charbonnier A.S., Rappersberger K., Stingl G., Maurer D. CD34+ cell-derived CD14+ precursor cells develop into Langerhans cells in a TGF-β1-dependent manner. J. Immunol. 1999;163:4869–4877. [PubMed] [Google Scholar]
- Ebner C., Szepfalusi Z., Ferreira F., Jilek A., Valenta R., Parronchi P., Maggi E., Romagnani S., Scheiner O., Kraft D. Identification of multiple T cell epitopes on Bet v I, the major birch pollen allergen, using specific T cell clones and overlapping peptides. J. Immunol. 1993;150:1047–1054. [PubMed] [Google Scholar]
- Maurer D., Fiebiger E., Reininger B., Wolff-Winiski B., Jouvin M.-H., Kilgus O., Kinet J.-P., Stingl G. Expression of functional high affinity IgE receptors (FcεRI) on monocytes of atopic individuals. J. Exp. Med. 1994;179:745–750. doi: 10.1084/jem.179.2.745. [DOI] [PMC free article] [PubMed] [Google Scholar]
- Diwu Z., Chen C.S., Zhang C., Klaubert D.H., Haugland R.P. A novel acidotropic pH indicator and its potential application in labeling acidic organelles of live cells. Chem. Biol. 1999;6:411–418. doi: 10.1016/s1074-5521(99)80059-3. [DOI] [PubMed] [Google Scholar]
- Viola A., Lanzavecchia A. T cell activation determined by T cell receptor number and tunable thresholds. Science. 1996;273:104–106. doi: 10.1126/science.273.5271.104. [DOI] [PubMed] [Google Scholar]
- Valitutti S., Muller S., Dessing M., Lanzavecchia A. Different responses are elicited in cytotoxic T lymphocytes by different levels of T cell receptor occupancy. J. Exp. Med. 1996;183:1917–1921. doi: 10.1084/jem.183.4.1917. [DOI] [PMC free article] [PubMed] [Google Scholar]
- Geissmann F., Revy P., Regnault A., Lepelletier Y., Dy M., Brousse N., Amigorena S., Hermine O., Durandy A. TGF-β1 prevents the noncognate maturation of human dendritic Langerhans cells. J. Immunol. 1999;162:4567–4575. [PubMed] [Google Scholar]
- Sallusto F., Cella M., Danieli C., Lanzavecchia A. Dendritic cells use macropinocytosis and the mannose receptor to concentrate macromolecules in the major histocompatibility complex class II compartmentdownregulation by cytokines and bacterial products. J. Exp. Med. 1995;182:389–400. doi: 10.1084/jem.182.2.389. [DOI] [PMC free article] [PubMed] [Google Scholar]
- Bogyo M., Verhelst S., Bellingard-Dubouchaud V., Toba S., Greenbaum D. Selective targeting of lysosomal cysteine proteases with radiolabeled electrophilic substrate analogs. Chem. Biol. 2000;7:27–38. doi: 10.1016/s1074-5521(00)00061-2. [DOI] [PubMed] [Google Scholar]
- Buttle D.J., Murata M., Knight C.G., Barrett A.J. CA074 methyl estera proinhibitor for intracellular cathepsin B. Arch. Biochem. Biophys. 1992;299:377–380. doi: 10.1016/0003-9861(92)90290-d. [DOI] [PubMed] [Google Scholar]
- Palmer J.T., Rasnick D., Klaus J.L., Bromme D. Vinyl sulfones as mechanism-based cysteine protease inhibitors. J. Med. Chem. 1995;38:3193–3196. doi: 10.1021/jm00017a002. [DOI] [PubMed] [Google Scholar]
- Deussing J., Roth W., Saftig P., Peters C., Ploegh H.L., Villadangos J.A. Cathepsins B and D are dispensable for major histocompatibility complex class II-mediated antigen presentation. Proc. Natl. Acad. Sci. USA. 1998;95:4516–4521. doi: 10.1073/pnas.95.8.4516. [DOI] [PMC free article] [PubMed] [Google Scholar]
- McGrath M.E. The lysosomal cysteine proteases. Annu. Rev. Biophys. Biomol. Struct. 1999;28:181–204. doi: 10.1146/annurev.biophys.28.1.181. [DOI] [PubMed] [Google Scholar]
- Drakesmith H., O' Neil D., Schneider S.C., Binks M., Medd P., Sercarz E., Beverley P., Chain B. In vivo priming of T cells against cryptic determinants by dendritic cells exposed to interleukin 6 and native antigen. Proc. Natl. Acad. Sci. USA. 1998;95:14903–14908. doi: 10.1073/pnas.95.25.14903. [DOI] [PMC free article] [PubMed] [Google Scholar]
- Lanzavecchia A., Lezzi G., Viola A. From TCR engagement to T cell activationa kinetic view of T cell behavior. Cell. 1999;96:1–4. doi: 10.1016/s0092-8674(00)80952-6. [DOI] [PubMed] [Google Scholar]
- Antoniou A.N., Blackwood S.L., Mazzeo D., Watts C. Control of antigen presentation by a single protease cleavage site. Immunity. 2000;12:391–398. doi: 10.1016/s1074-7613(00)80191-0. [DOI] [PubMed] [Google Scholar]
- Via L.E., Fratti R.A., McFalone M., Pagan-Ramos E., Deretic D., Deretic V. Effects of cytokines on mycobacterial phagosome maturation. J. Cell. Sci. 1998;111:897–905. doi: 10.1242/jcs.111.7.897. [DOI] [PubMed] [Google Scholar]
- Claus V., Jahraus A., Tjelle T., Berg T., Kirschke H., Faulstich H., Griffiths G. Lysosomal enzyme trafficking between phagosomes, endosomes, and lysosomes in J774 macrophages. Enrichment of cathepsin H in early endosomes. J. Biol. Chem. 1998;273:9842–9851. doi: 10.1074/jbc.273.16.9842. [DOI] [PubMed] [Google Scholar]
- Davidson H.W., Reid P.A., Lanzavecchia A., Watts C. Processed antigen binds to newly synthesized MHC class II molecules in antigen-specific B lymphocytes. Cell. 1991;67:105–116. doi: 10.1016/0092-8674(91)90575-j. [DOI] [PubMed] [Google Scholar]
- Inaba K., Turley S., Iyoda T., Yamaide F., Shimoyama S., Reis e Sousa C., Germain R.N., Mellman I., Steinman R.M. The formation of immunogenic major histocompatibility complex class II–peptide ligands in lysosomal compartments of dendritic cells is regulated by inflammatory stimuli. J. Exp. Med. 2000;191:927–936. doi: 10.1084/jem.191.6.927. [DOI] [PMC free article] [PubMed] [Google Scholar]
- Turley S.J., Inaba K., Garrett W.S., Ebersold M., Unternaehrer J., Steinman R.M., Mellman I. Transport of peptide-MHC class II complexes in developing dendritic cells. Science. 2000;288:522–527. doi: 10.1126/science.288.5465.522. [DOI] [PubMed] [Google Scholar]
- Watts C. Immunology. Inside the gearbox of the dendritic cell. Nature. 1997;388:724–725. doi: 10.1038/41900. [DOI] [PubMed] [Google Scholar]
- Iezzi G., Karjalainen K., Lanzavecchia A. The duration of antigenic stimulation determines the fate of naive and effector T cells. Immunity. 1998;8:89–95. doi: 10.1016/s1074-7613(00)80461-6. [DOI] [PubMed] [Google Scholar]
- Kündig T.M., Shahinian A., Kawai K., Mittrucker H.W., Sebzda E., Bachmann M.F., Mak T.W., Ohashi P.S. Duration of TCR stimulation determines costimulatory requirement of T cells. Immunity. 1996;5:41–52. doi: 10.1016/s1074-7613(00)80308-8. [DOI] [PubMed] [Google Scholar]