

Abstract
The expanding genus Bartonella includes zoonotic and human-specific pathogens that can cause a wide range of clinical manifestations. A productive infection allowing bacterial transmission by blood-sucking arthropods is marked by an intraerythrocytic bacteremia that occurs exclusively in specific human or animal reservoir hosts. Incidental human infection by animal-adapted bartonellae can cause disease without evidence for erythrocyte parasitism. A better understanding of the intraerythrocytic lifestyle of bartonellae may permit the design of strategies to control the reservoir and transmittable stages of these emerging pathogens. We have dissected the process of Bartonella erythrocyte parasitism in experimentally infected animals using a novel approach for tracking blood infections based on flow cytometric quantification of green fluorescent protein–expressing bacteria during their interaction with in vivo–biotinylated erythrocytes. Bacteremia onset occurs several days after inoculation by a synchronous wave of bacterial invasion into mature erythrocytes. Intracellular bacteria replicate until reaching a stagnant number, which is sustained for the remaining life span of the infected erythrocyte. The initial wave of erythrocyte infection is followed by reinfection waves occurring at intervals of several days. Our findings unravel a unique bacterial persistence strategy adapted to a nonhemolytic intracellular colonization of erythrocytes that preserves the pathogen for efficient transmission by blood-sucking arthropods.
Keywords: Bartonella, erythrocyte parasitism, flow cytometry, GFP, whole blood biotinylation
Introduction
The genus Bartonella comprises a unique group of facultative intracellular bacteria that employs hemotropism and arthropod-mediated transmission as common parasitic strategies. The widespread occurrence and diversity of these bacteria has been increasingly recognized in recent years. This resulted in a dramatic expansion of the genus Bartonella to 16 currently described species, among which at least 7 have been associated with human disease (for reviews, see references 1 and 2). Each Bartonella species (spp.) appears to be highly adapted to one or few mammalian reservoir hosts, in which Bartonella causes a long-lasting intraerythrocytic bacteremia as a hallmark of infection. In contrast, incidental infection of a nonreservoir host does not seem to lead to erythrocyte parasitism but can cause various clinical manifestations, as in the case of the zoonotic Bartonella henselae. Cats are the natural reservoir of cat flea–borne B. henselae and usually develop an asymptomatic intraerythrocytic bacteremia, which may persist for months or years 3. However, human infection with B. henselae via a cat bite or scratch or the bite of an infected cat flea results in clinical entities such as cat scratch disease, bacillary angiomatosis, or endocarditis, without signs of erythrocyte parasitism 4. Analogously, rat-adapted B. elizabethae, cat-adapted B. clarridgeiae, and mouse-adapted B. grahamii are zoonotic pathogens that naturally cause a hemotropic infection in their respective animal reservoirs, whereas incidental human infection has a different clinical outcome 5 6 7 8. Notably, humans are the only known reservoir hosts for B. bacilliformis and B. quintana. B. bacilliformis appears in endemic regions of South America as the agent of Carrion's disease transmitted by the sandfly Lutzomyia verrucarum 9 10. In the acute phase of this biphasic disease, most erythrocytes become infected, resulting in a hemolytic anemia with fever (referred to as Oroya fever) that may cause up to 80% mortality. After resolution, the chronic second phase (referred to as Verruga Peruana) is characterized by hemangiomatous eruptions of the skin as a result of vascular proliferation (11 12; for a review, see reference 13). B. quintana became known during World War I as the agent of trench fever, which plagued more than one million soldiers at both front lines in many European countries. Also known as five day fever, this bacteremic disease was recognized because of the periodic relapses of fever often associated with leg and back pain 14. Today, in the Western hemisphere, homeless people and individuals suffering from drug and alcohol addiction with poor hygienic conditions are susceptible to infection by B. quintana 15 16, probably because they are more likely to be infested by body lice that transmit the pathogen from human to human.
While hemolytic activity in B. bacilliformis seems to be unique among Bartonella spp. 17, prolonged courses of intracellular erythrocyte parasitism appear to be a crucial aspect of the pathogenesis of all Bartonella spp. Investigating the bacterial dynamics in the peripheral blood by using a suitable experimental animal infection model would provide insight into the unique pathogenic strategy of erythrocyte parasitism employed by these emerging pathogens.
Recently, we have described the isolation of a new species, B. tribocorum (Btr), from the blood of wild rats 18. Using a recombinant Btr strain expressing a constitutive level of green fluorescent protein (GFP; Btr–gfp), we performed a detailed study of the hemotropic infection course in experimentally infected rats. Fluorescent tracing of the GFP-expressing bacteria by flow cytometry in combination with whole blood biotinylation experiments revealed a synchronous invasion of mature erythrocytes followed by a short period of intraerythrocytic replication. Subsequently, an extended period of intraerythrocytic colonization with an essentially invariant number of intracellular bacteria demonstrated for the first time bacterial persistence in erythrocytes. Moreover, recurrent waves of erythrocyte infection were found to occur in time patterns similar to the feverish relapses of trench fever, establishing an experimental model for this human infection by B. quintana.
Materials and Methods
Bacterial Strains.
The Escherichia coli strain DH5α and SURE were used for the cloning of plasmids. E. coli β2155 19 served as a mobilization strain in two parental matings. E. coli was grown at 37°C overnight in Luria-Bertani broth. When needed, Luria-Bertani broth was supplemented with 50 mg/liter kanamycin, 10 mg/liter gentamicin or 100 mg/liter ampicillin, and 1 mM diaminopimelinic acid in the case of E. coli β2155. Btr 506T 18 and its derivative were grown routinely for 3–5 d on Columbia agar containing 5% defibrinated sheep blood (CSB–agar) in a water-saturated atmosphere with 5% CO2 at 35°C. Btr transconjugants were selected using 30 mg/liter kanamycin.
Animals.
Female Wistar rats were obtained at the age of 6 wk from Harlan and Winkelmann. All animal studies were approved by the authors' institutional review boards.
Plasmids and Their Construction.
DNA manipulations were carried out using standard procedures 20. The gfp expression vector pCD351 was constructed by insertion of a 773-bp BamHI–HindIII fragment containing the gfp-mut3 gene 21 into the corresponding restriction sites of the expression vector pCD341 22. Subsequently, the 1.62-kb SspI fragment containing gfp-mut3 was excised from pCD351 and cloned into the SmaI site of pJQ200uc1 23 to yield the plasmid pCD360. Finally, a 1.65-kb NotI fragment from pCD360 was cloned into the NotI site of Mini-Tn5-Km2 24, resulting in the gfp-transposon vector pCD361.
GFP-expressing Btr.
The plasmid pCD361, containing a transposable kanamycin-gfp cassette, was introduced into Btr as a suicide vector via two-parental mating as described 19. Transconjugants displayed a light green colony phenotype, which was stable during at least 10 subsequent passages in the absence of antibiotics as demonstrated for the Btr–gfp clone 2 (data not shown). Southern blot analysis of this clone revealed the integration of pCD361 into the chromosome of Btr by a single crossover event rather than by transposition (data not shown). Btr–gfp clone 2 was used in all subsequent experiments reported in this study, although similar results were obtained in preliminary experiments with six additional Btr–gfp transconjugants (data not shown).
Rat Infection with Btr–gfp.
Bacteria harvested in PBS were injected into rat tail veins in a volume of 0.3 ml containing ∼3.5 × 10⁷ CFUs. Venous blood samples were taken and diluted 9:1 in PBS containing 3.8% sodium citrate. To lyse the erythrocytes for blood cultures, citrate blood samples were subjected to freezing at −80°C and, when needed, diluted in PBS before plating on CSB–agar. CFUs were examined after 5–6 d of growth. Btr–gfp recovered from the blood of individual rats displayed in up to 20% white and kanamycin-sensitive CFUs; this frequency was stable during the entire bacteremic phase in each individual animal (data not shown).
In Vivo Whole Blood Biotinylation and Staining of Biotinylated RBCs.
Whole blood biotinylation in rats was performed by injecting 2.8-mg doses of N-hydroxysuccinimidyl-biotin into the rat tail vein for three subsequent days as described previously for mice 25. In brief, 2.8 mg N-hydroxysuccinimidyl-biotin (Pierce Chemical Co.) was dissolved in 60 μl of dimethylformamide at 50°C for 2 min before addition of 240 μl of PBS and injection of the mixture into the rat tail vein. For staining of biotinylated RBCs for flow cytometric analysis, 50 μl of peripheral rat blood was washed once with PBS. RBCs were adjusted to 6 × 10⁷ cells/ml PBS, and 980 μl of this dilution was incubated with 20 μl of PE-conjugated streptavidin (Becton Dickinson) for 30 min at room temperature. After staining, RBCs were washed twice with PBS. Washes were performed by centrifugation at 1,400 g for 5 min.
Flow Cytometric Analysis.
Citrate blood samples were diluted in PBS, and a total of 2 × 10⁷ events was evaluated using a FACSort™ (Becton Dickinson) flow cytometer. Measurements were performed daily over a period of 31 d postinoculation (d.p.i.), followed by weekly investigations. Data were analyzed using the software WinMDI 2.8 developed by Joseph Trotter (http://www.scripps.edu). For data presentation, all measurements of infected erythrocyte numbers were normalized to 6 × 10⁹ RBCs/ml blood and expressed as the number of infected erythrocytes per milliliter of blood.
Differential Intra- and Extracellular Staining of Btr–gfp.
50 μl of infected peripheral rat blood was washed once in PBS before RBCs were resuspended in 495 μl PBS and incubated for 30 min at room temperature together with 5 μl of rat anti-Btr immune serum. The RBCs were washed twice with PBS, resuspended in 495 μl PBS, and incubated for 30 min at room temperature together with 5 μl of Cy5-conjugated goat anti–rat IgG (Jackson ImmunoResearch Laboratories). RBCs were washed twice in PBS and resuspended in decomplemented FCS to prepare smears. Washes were performed by centrifugation at 1,400 g for 5 min.
Confocal Microscopy.
Smears of citrate blood or immunocytochemically stained RBCs were viewed with a Leica TCS NT confocal laser scanning microscope (Leica Lasertechnik) at original magnification ×100 with detection in channel 1 (GFP fluorescence), channel 3 (Cy5 fluorescence), and the transmission channel (differential interference contrast).
Gentamicin Protection Assay.
Peripheral rat blood was washed once in PBS. Cells were resuspended in PBS and split into two equal aliquots. One aliquot was treated with 150 μg/ml gentamicin sulfate, and the other remained untreated. After gentamicin treatment for 2 h at 37°C, RBCs were washed once with PBS to remove residual antibiotic. The PBS-diluted samples were frozen at −80°C to achieve cell lysis; aliquots were subsequently plated on CSB–agar to determine CFUs. As a control for the bactericidal effect of gentamicin, RBCs were lysed before incubation for 2 h at 37°C. Washing steps were performed by centrifugation at 2,100 g for 5 min. All experiments were performed in triplicate.
Transmission Electron Microscopy.
Citrate blood was fixed in 4% formaldehyde and 2% glutaraldehyde and postfixed for 1 h in PBS containing 1% OsO4 (Science Service). After dehydration through a graded series of ethanol, samples were embedded in Durcupan ACM. Ultrathin sections, produced using an ultramicrotome (LBK), were stained with 2.5% uranyl acetate and lead citrate. Samples were viewed using a ZEISS electron microscope (model EM 109) at 80 kV.
Results
Construction of Btr–gfp for Tracking Bacterial Blood Infection In Vivo.
The insertion of a gfp expression cassette into the chromosome of Btr resulted in constitutive GFP expression, which was stable during multiple in vitro passages (>10) even in the absence of antibiotic selection for the kanamycin gene physically linked to gfp. This prompted us to explore the use of GFP-mediated fluorescence for tracking bacteria in the blood of experimentally infected rats. Fluorescence detection and quantification by means of flow cytometry and/or confocal microscopy were used to complement bacterial quantification by the conventional blood culture method employed in earlier studies of hemotropic Bartonella spp. infections 26 27 28 29 30 31.
Experimental Btr–gfp Bacteremia in Rats Quantified by Conventional Blood Culture.
Blood cultures on petri dishes were used to quantify CFUs of Btr–gfp in the peripheral blood of rats after intravenous injection of 3.5 × 10⁷ bacteria. All culturable organisms were cleared from the circulating blood within hours after inoculation (data not shown), and blood remained sterile for 3–4 d (Fig. 1). Bacteremia began at 4 or 5 d.p.i. and peaked between 10 and 14 d.p.i. with up to 107 CFUs/ml blood. After a persistent bacteremic period with declining bacterial titers, the number of hemotropic bacteria dropped in weeks 9 and 10 p.i. below a detectable level (<100 CFUs/ml blood). The observed bacteremia is indistinguishable from the infection course of wild-type Btr 506T (unpublished results) and appears to correspond to the bacteremic course of other Bartonella spp. in their respective animal reservoirs 26 27 28 29 30 31.
Figure 1.

Course of Btr–gfp bacteremia in experimentally infected rats. The level of bacteremia of six rats was determined by counting CFUs on CS–agar inoculated with dilutions of lysed blood.
Dissection of the Course of Erythrocyte Parasitism by Btr–gfp Using Flow Cytometry and Confocal Microscopy.
During the bacteremic phase as resolved by positive blood culture, Btr–gfp could be detected at any time by flow cytometry of citrate blood. The populations of both free bacteria and erythrocyte-associated bacteria are fully separated in side scatter (SSC) versus forward scatter (FSC) dot blots localizing to gate 1 or 2, respectively (Fig. 2 A). Events contained in gates 1 and 2 were analyzed in fluorescence channel (FL)-1 versus FL-2 dot blots (Fig. 2B and Fig. C, respectively), which allowed distinction of fluorescence resulting from GFP-expressing bacteria (positive in FL-1 but negative in FL-2) from the few autofluorescent events inherently present in blood (positive in both FL-1 and FL-2). Flow cytometric analysis of the infected erythrocyte population revealed an increase in the mean fluorescence on succeeding d.p.i. (Fig. 3 B). Confocal microscopy of corresponding blood smears demonstrated that this increase in RBC fluorescence is a result of bacterial multiplication in association with individual erythrocytes (Fig. 3 A). Daily quantification of RBC-associated bacteria by confocal microscopy revealed that bacterial replication started on either day 4 or 5 p.i., when infected erythrocytes appear in peripheral blood as having one or two bacteria associated with each infected erythrocyte. At day 11 or 12, a plateau with an average of eight intracellular bacteria is reached (Fig. 3 C, • with error bars), although individual erythrocytes may contain up to 15 intracellular pathogens (data not shown). This growth kinetic correlated well to the course of the mean fluorescence of infected erythrocytes measured by flow cytometry (Fig. 3 C, □), while the fluorescence intensity of individual bacteria released from infected RBCs was virtually invariant during the entire course of infection (Fig. 3 C, ▵). Thus, the mean fluorescence of the infected RBC population determined by flow cytometry of 2 × 10⁷ events (corresponding to ∼103–104 infected erythrocytes) appears to be an accurate measure for the mean number of accommodated bacteria per erythrocyte. Simultaneously, this flow cytometric analysis allowed the precise quantification of infected erythrocytes in the total RBC population. Both of these highly sensitive and statistically significant measures enabled us to further dissect the course of erythrocyte parasitism (Fig. 4) to what had been concluded from conventional blood cultures (Fig. 1).
Figure 2.

Flow cytometric detection of free and erythrocyte-associated Btr–gfp in peripheral rat blood. (A) SSC versus FSC dot blot analysis allowed the separation of populations of free bacteria (contained in gate 1) and RBC-associated bacteria (contained in gate 2). Dot blots of FL-1 versus FL-2 of events contained in gate 1 allowed distinction of free bacteria (gate 3) from debris (B), whereas (C) events in gate 2 could be separated into infected RBCs (gate 4), uninfected RBCs, and autofluorescent particles. The data presented were obtained with blood of rat no. 117 at 18 d.p.i.
Figure 3.
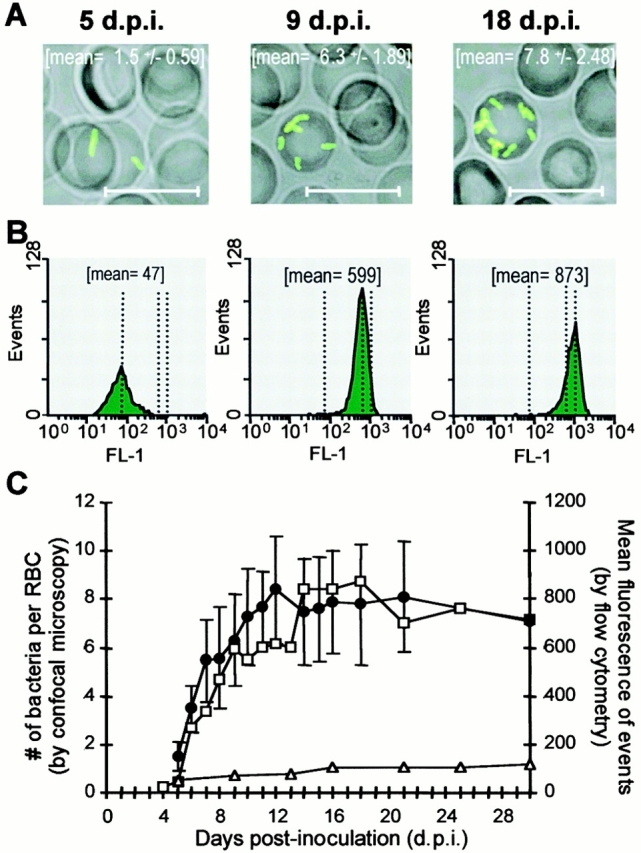
Quantitative analysis of intraerythrocytic replication of Btr–gfp by flow cytometry and confocal microscopy. (A) Confocal images of representative infected erythrocytes and the mean ± SD of bacteria counted per infected erythrocyte (n > 20). Scale bars correspond to 10 μm. (B) Fluorescence intensity histograms (FL1-H) and mean fluorescence (mean) of the infected RBC population in 2 × 10⁷ events. (C) The mean fluorescences of the colonized RBCs (□) and the single bacteria released from lysed RBCs (▵) were determined by flow cytometry. On the same blood samples, the bacteria per colonized RBC (•) were enumerated by confocal microscopy (n > 20; mean ± SD). The data presented were obtained from rat no. 117.
Figure 4.

Flow cytometric analysis of the course of erythrocyte colonization by Btr–gfp. Kinetics of the number of infected erythrocytes (♦) and their mean fluorescence (○) of (A) rat no. 111 and (B) rats no. 123–126. The specification of axes in B is the same as in A. Note the temporal increases in the number of infected erythrocytes resulting from recurrent reinfection waves (marked by arrows).
After intravenous infection of rats with Btr–gfp, no bacteria were detectable in blood during an eclipse phase of 3–4 d. Fluorescent RBCs could first be observed on day 4 or 5 p.i., and their number had already peaked on the subsequent day, marking a highly synchronized onset of bacteremia. The number of infected erythrocytes per milliliter of blood was in the range of 1.0–3.6 × 10⁶ (0.017–0.059% of total RBCs). The number of fluorescent RBCs decreased from day 6 (Fig. 4, ♦), while their mean fluorescence increased because of replication of erythrocyte-associated bacteria (Fig. 4, ○). In consequence, the total number of bacteria per milliliter of blood continued to increase until the peak of bacteremia was reached around days 10–12 p.i. (Fig. 1).
Interestingly, the otherwise steady decrease in the number of infected erythrocytes was interrupted by marked increases that occurred at intervals of typically 3–6 d (Fig. 4A and Fig. B; marked by arrows). These periodic increases in the number of infected erythrocytes indicated the existence of recurrent infection waves after the initial infection wave at day 5.
In addition to erythrocyte-associated bacteria, free bacteria could be detected by flow cytometry during the entire bacteremic phase (Fig. 2 B and data not shown). The average number of free bacteria fluctuated between 3 and 20% of the total number of fluorescent events (corresponding to infected erythrocytes and free bacteria) during the first 30 d.p.i., whereas no correlation of the dynamic changes of colonized erythrocytes was observed in any of the six rats analyzed. It is uncertain whether this rather small number of free bacteria was released from erythrocytes or from a different bacterial reservoir in vivo or resulted from the lysis of colonized erythrocytes during blood collection and handling.
Time Point of Invasion into RBCs.
The antibiotic gentamicin, which cannot penetrate intact eukaryotic cell membranes, was used to determine the proportions of extra- versus intracellular Btr–gfp present during the course of erythrocyte parasitism in two rats (nos. 166 and 167). Fluorescent RBCs could be detected at the earliest on day 5 p.i., and gentamicin protection assays were performed from this day on for four subsequent days (Fig. 5). While no significant protection of bacteria (<5%) occurred during the first three hemotropic days (5–7 d.p.i.), this changed dramatically on the fourth bacteremic day (day 8 p.i.), with 59 and 53% gentamicin-protected bacteria recovered from rats no. 166 and 167, respectively. A similar proportion of protected bacteria was observed on the following days.
Figure 5.

Course of erythrocyte invasion by Btr–gfp in peripheral rat blood analyzed by the gentamicin protection assay. Equal volumes of rat blood drawn at various d.p.i. with Btr–gfp were incubated with and without gentamicin and then washed, lysed, and plated on CBS–agar for the determination of CFUs. The percentage of gentamicin-protected bacteria is presented for rats no. 166 and 167. To verify the bactericidal effect of gentamicin for intracellular bacteria, RBCs of rat no. 167 at 25 d.p.i. were lysed before gentamicin treatment (rat no. 167, lysed RBCs).
Immunocytochemical staining was used as a complementary approach to gentamicin protection assays to distinguish between epicellular and intraerythrocytic bacteria. On the second bacteremic day (6 d.p.i.), approximately half of the bacteria found in singular association to RBCs could be stained (Fig. 6 A), suggesting that their extracellular localization or an intracellular localization associated with an antibody-permeable state of the erythrocyte membrane. On the third day of bacteremia (7 d.p.i.), most singularly associated organisms (Fig. 6 B) and all replicating bacteria (more than one bacterium per erythrocyte; Fig. 6 C) were no longer stained by immunocytochemical methods and thus appear to reside within the intracellular spaces of erythrocytes. Ultrastructural analysis of Btr–gfp-infected rat blood cells on day 14 p.i. by transmission electron microscopy (TEM) confirmed the intracellular localization of bacteria at this stage (Fig. 7 A). TEM analysis further indicated that intraerythrocytic bacteria may reside within a vacuolar compartment, which eventually may enclose several organisms (Fig. 7 B; marked by an arrow).
Figure 6.

Differential intra- and extracellular staining of erythrocyte-associated Btr–gfp. Intact RBCs from infected rat no. 167 were immunocytochemically stained for extracellular bacteria by rat anti-Btr antiserum and Cy5-conjugated anti–rat secondary antibodies. Stained RBC smears were analyzed by confocal microscopy using GFP fluorescence (GFP) to visualize bacteria, differential interference contrast (DIC) to visualize RBCs, and Cy5 fluorescence to visualize adherent bacteria. An overlay of all three channels is also shown. Representative infected erythrocytes obtained from blood on day 6 (A and B) or day 7 p.i. (C) are shown. Arrows indicate the position of RBC-associated bacteria. The scale bar corresponds to 5 μm.
Figure 7.

Electron micrographs of rat erythrocytes parasitized by Btr–gfp. (A) Cross-section of an erythrocyte showing several intracellular bacteria. Original magnification ×12. (B) Two intracellular bacteria presumably surrounded by one vacuolar membrane (arrows). Original magnification ×30. Scale bars correspond to 1 μm. Data presented were obtained with rat no. 111 at 14 d.p.i.
Taken together, the gentamicin protection assays, differential immunocytochemical staining, and TEM analysis consistently indicate a predominately intraerythrocytic lifestyle for Btr–gfp during rat erythrocyte parasitism, with the invasion process taking place shortly after infected RBCs appear in the bloodstream. It should be noted that the experiments described as of yet do not allow distinction between mature erythrocytes and reticulocytes as the initially infected cell type.
Btr–gfp Invades Mature Erythrocytes.
In vivo whole blood biotinylation serves to trace aging erythrocyte populations by the introduced biotin label without affecting the life span of the labeled erythrocytes 25. This technique should be ideal for addressing the following still elusive aspects of Bartonella erythrocyte parasitism: (a) a possible age or differentiation stage specificity in the invasion process of erythrocytes or erythroid precursor cells; and (b) the life span of the infected erythrocytes in comparison to uninfected RBCs. For this purpose, rats were infected with Btr–gfp before or after whole blood biotinylation. By staining biotinylated blood cells with PE-conjugated streptavidin, the population of biotinylated versus nonbiotinylated erythrocytes could be separated in FL-2, while the erythrocyte-associated bacteria were quantified in FL-1 as outlined before. Fig. 8 shows the data of two rats each subjected to whole blood biotinylation on days 2, 3, and 4 p.i., which represent infection courses with (Fig. 8A and Fig. B, rat no. 191) or without (Fig. 8 C, rat no. 192) recurrent erythrocyte reinfection waves subsequent to the initial infection wave. Fig. 8 A, top, shows a dot blot analysis (FL-1 versus FL-2) of the RBC gate for several days in the infection course with the representation of 103 events, which illustrates the continuous replacement of the aging biotinylated RBC population (high in FL-2) by unlabeled RBCs resulting from erythropoesis (population low in FL-2; the percentages of both populations are given in the respective sectors). Daily measurements of the percentages of biotinylated RBCs are plotted in Fig. 8 B (○, left). Displaying 107 events in FL-1 versus FL-2 dot blots also illustrates the infected RBC populations (Fig. 8 A, bottom). The initial erythrocyte infection wave appears at 6 d.p.i. (corresponding to 2 d after biotinylation) in gates R1 (biotinylated RBCs) and R2 (nonbiotinylated RBCs). The level of ∼95% biotinylation for the infected RBC population reflects the level of biotinylation of the total RBC population at the day of bacteremic onset or shortly before. In subsequent days, this infected RBC population shifts because of intracellular bacterial replication to gates R3 and R4, while the percentage of biotinylation remains constant (∼95% at 9 d.p.i.). As a result of a reinfection wave on day 11 p.i., a new population of infected erythrocytes appears at gates R1 and R2 that is clearly distinguishable from the infected RBC population of the initial wave localizing at gates R3 and R4. Strikingly, the percentage of biotinylation in this newly infected RBC population (∼57%) is again representative of the percentage of biotinylation in the total RBC population (∼59%) at the day of appearance, whereas the percentage of biotinylation in the initial wave remained essentially unchanged (∼93%). Thus, Btr–gfp can invade mature erythrocytes of different ages with similar efficiency. This important observation has been further substantiated in rats subjected to whole blood biotinylation several days before infection in which invasion of aged RBCs has been observed to have efficiency similar to the invasion of young erythrocytes (data not shown).
Figure 8.

Whole blood bio-tinylation experiments for studying differentiation/age dependency of RBC invasion by Btr–gfp and measuring the life span of infected erythrocytes. (A) Demonstration of the invasion of Btr–gfp into mature rat erythrocytes by the analysis of fluorescence dot blots for GFP fluorescence (FL-1) versus fluorescent biotin staining (FL-2) in the erythrocyte gate at critical days of the initial (5, 6, and 9 d.p.i.) and the subsequent infection wave (11 and 13 d.p.i.). Biotinylation was performed in three doses at 2, 3, and 4 d.p.i. The percentage of bio- tinylated versus nonbiotinylated RBCs decreasing over time is shown at top (103 events in the RBC gate are shown). The percentage of biotinylation in freshly invaded RBCs (low GFP fluorescence; gate R1 versus R2) or RBCs colonized for several days (high GFP fluorescence; gate R3 versus R4) is indicated on the bottom (107 events from the RBC gate are shown in each dot blot) when appropriate. The data presented were obtained with rat no. 191. (B and C) Graphs of the biotinylation state (left) and col-onization state (right) of infected RBCs. As in A, the data presented in B were obtained from rat no. 191. Note the extensive reinfection wave on days 11 and 12 p.i. (C) In the absence of reinfection waves in rat no. 192 (left, indicated by the constant high percentage of biotinylated RBCs in the infected RBC population; ▵), the life span of infected erythrocytes could be analyzed in comparison to the total RBC population. Note the initially more rapid then comparable decline of biotinylated RBCs in the infected (▪) versus the total RBC population (○), demonstrating that the intracellular colonization reduces the life span of the RBC only moderately. Damage of erythrocytes attributable to intracellular colonization appears to be prevented by the stationary cell density reached after the initial intracellular replication (right; ⋄).
The Intracellular Colonization of Erythrocytes by Btr–gfp Is Nonhemolytic.
In contrast to the prominent reinfection wave in rat no. 191 (a graph of daily measurements for the number of infected RBCs is plotted as ▪ in Fig. 8 B, left; arrows mark the recurrent infection waves), rat no. 192 did not display any measurable reinfection after the synchronous onset of bacteremia on day 5 p.i. (Fig. 8 C, left). This is evident from both the graph of the number of infected RBCs, which steadily slopes down after the initial infection wave on day 5 p.i. (Fig. 8 C, ▪, left), and the constantly high proportion of biotinylation in the infected RBC population (∼99%, Fig. 8 C, ▵, left; compare with corresponding graph of rat no. 191 in Fig. 8 B, which denotes a reduction of the percentage of biotinylation of infected RBCs coincidentally with each reinfection wave). Thus, in rat no. 192, the population of infected RBCs synchronously appearing on day 5 p.i. could be traced during at least 24 d without interference by subsequent reinfection waves. Considering that ∼99% of the infected RBCs were biotinylated (Fig. 8 C, ▵, left) and the infected biotinylated RBC population represents only a minority (<0.03%) of the total biotinylated RBC population (data not shown), we could compare the clearance of infected versus noninfected RBCs by directly comparing the graphs for the number of infected RBCs (Fig. 8 C, ▪, left) with the percentage of total RBCs (Fig. 8 C, ○, left), respectively. In the first days of bacteremia (5–7 d.p.i.), the clearance of infected erythrocytes is elevated compared with uninfected RBCs, whereas in subsequent days this early clearance of infected RBCs appears to be compensated. Between days 19 and 30 p.i., both graphs are essentially superimposable, indicating that clearance of RBCs occurs at a similar level regardless of infection (∼90% of erythrocytes are cleared within 24 d in each case). No obvious difference in the life span of infected versus noninfected RBCs could be detected from this experiment, indicating that the intracellular colonization by Btr–gfp is innocuous for the infected RBCs allowing bacterial persistence in this intracellular niche.
Course of Intracellular Replication of Btr–gfp.
As the intracellular space of erythrocytes is limited, a persistent intracellular infection would require a control of bacterial replication. Indeed, the course of intracellular multiplication in rat no. 192 demonstrated that after an initial rapid intracellular multiplication, the number of intraerythrocytic bacteria reaches a plateau (Fig. 8 C, □, right). However, similar courses of intracellular replication have also been observed in animals displaying reinfection waves that may delay the plateau (open symbols in Fig. 4 A and 8 B, right). In conclusion, after limited intracellular replication, intraerythrocytic Btr–gfp reaches a state of nonreplicated persistence.
Discussion
Previous studies aiming to characterize the course of hemotropic Bartonella infections have employed blood culture on petri dishes (to determine CFUs) and/or light microscopy or ultrastructural analysis of RBCs 3 29 30. These established techniques revealed a typically prolonged course of bacteremia in association with intraerythrocytic bacterial inclusions. In this study, we have dissected the in vivo course of Bartonella erythrocyte parasitism in considerable detail by using an appropriate animal model in combination with a novel approach for tracking blood infections. We have used a GFP-expressing strain of the rat-adapted species Btr (Btr–gfp) in an experimental rat infection model. Importantly, the expression of GFP did not alter bacterial infectivity (unpublished results) but enabled us to trace individual bacteria within the blood of infected rats by means of flow cytometry. As validated by confocal microscopy and conventional blood cultures, this powerful fluorescence-based in vivo detection method for bacterial infections allowed a precise quantification of both the number of infected erythrocytes and the number of bacteria colonizing individual erythrocytes. Moreover, in vivo whole blood biotinylation before or after Btr–gfp infection allowed (by staining with fluorescent streptavidin conjugates) to trace the aging erythrocyte population for studying the course of intraerythrocytic replication and the resulting effect on the life span of infected erythrocytes. A model of erythrocyte colonization by Bartonella as deduced from these extensive studies is depicted in Fig. 9.
Figure 9.

Model of erythrocyte parasitism by Bartonella spp.
After intravenous inoculation, Btr–gfp was rapidly cleared (within a few hours) from circulating blood, which thereafter remained sterile for 3–4 d. This eclipse phase indicates the colonization of a primary niche by Btr–gfp before the onset of hemotropic infection. Given the marked tropism of bartonellae for vascular endothelial cells (12 15; for a review, see reference 13), we could speculate that this cell type may represent the primary niche without discounting the possibility that other cell types or organs may also contribute. Eventually, the competence for the erythrocyte invasion process that follows has to be acquired by an adaptation process (i.e., via transcriptional reprogramming) during infection of this primary niche.
The bacteremic phase of Btr–gfp synchronously began at 4–5 d.p.i. with a single bacteria found in association with circulating RBCs. In vivo biotinylation experiments allowed us to demonstrate without ambiguity that infected and subsequently invaded cells are mature erythrocytes. This finding is remarkable considering that in contrast to erythroid precursor cells, the mature erythrocyte is devoid of any endocytic activity, thus leaving the active part of cell entry to the invading bacterium.
To test for the time point of erythrocyte invasion, we have used in parallel two complementary assays based on the impermeability of the intact erythrocyte membrane to either antibodies (differential immunocytochemical staining) or the antibiotic gentamicin (gentamicin protection assay). Both assays indicate an extracellular localization of erythrocyte-associated bacteria at the onset of bacteremia. However, by differential immunocytochemical staining, the invasion process was completed within 2 d, while in gentamicin protection assays bacteria required an additional day before becoming gentamicin protected. Based on ultrastructural analysis, a pore-like structure has been described for B. henselae–invaded cat erythrocytes 3. Moreover, it has been suggested that the partially characterized lipophilic erythrocyte membrane–deforming protein deformin secreted by B. bacilliformis and B. henselae can insert itself as a pore-like structure into the erythrocyte membrane 32 33. This presumable pore may account for the observed differential permeability for antibodies and gentamicin during erythrocyte invasion.
Invasion into mature erythrocytes is immediately proceeded by intracellular replication. TEM indicated that the replicating bacteria are surrounded by a presumable vacuolar membrane. A similar observation has been reported for the invasion of human erythrocytes by B. bacilliformis 34. Interestingly, bacterial replication slowed after several days, reaching a plateau at approximately eight intracellular bacteria on average per infected erythrocyte. This plateau was maintained for the remaining life span of the infected erythrocytes. Cessation of bacterial replication may result from the deprivation of either essential nutrients or growth factors or may indicate an active mechanism of growth control (i.e., by quorum sensing; for a review, see reference 35). Strikingly, whole blood biotinylation in a rat devoid of any reinfection wave revealed that during the period of invasion and intracellular replication, the clearance of the infected erythrocytes was moderately increased compared with uninfected erythrocytes. However, after cessation of bacterial replication, clearance of infected erythrocytes was indistinguishable from that of uninfected erythrocytes. To our knowledge, we provide the first example of a pathogen capable of persistently colonizing the limited intracellular spaces of erythrocytes (until the infected cells are cleared by normal turnover), which is clearly distinguished from the typically hemolytic infection cycle of other erythrocytic parasites, such as the malaria parasite Plasmodium (for a review, see reference 36). Bartonellae thus persist for weeks within the immunologically privileged intracellular niche of erythrocytes, thereby increasing their chances for transmission by blood-sucking arthropods. This unique pathogenic strategy certainly contributes to the remarkable epidemiological success of bartonellae in their reservoir hosts with prevalences of bacteremia typically ranging from 15 to 95% (for reviews, see references 1 and 2). While most known bartonellae may behave similarly to Btr–gfp in their respective reservoir hosts, the human-adapted species B. bacilliformis appears to provide an exception, as it can trigger massive hemolysis after intraerythrocytic infection 11 12. A contact-dependent hemolytic activity has been identified recently in B. bacilliformis 17, which may account for this striking difference in the course of erythrocyte infection.
After the synchronous onset of erythrocyte-associated bacteremia on day 4 or 5 p.i. (<106 afflicted cells/ml of blood), the number of infected erythrocytes decreased on subsequent days due to erythrocyte turnover. However, in the majority of infected animals we noticed recurrent erythrocyte infection waves of variable amplitude that had not been detected before by any other method. The recurrence of these reinfection waves typically ranged from 3 to 6 d, which is in accordance with the variable time intervals of the feverish relapses in human trench fever (five day fever) caused by B. quintana 14. B. quintana bacteremia in humans may have an asymptomatic course as well 14 15, like erythrocyte infection waves observed in our rat model, which were not associated with fever nor any other obvious clinical manifestations (data not shown). Experimental infection of cats as the reservoir host of B. henselae indicated that, depending on the bacterial strain used for inoculation, the clinical outcome of bacteremia ranged from no symptoms to fever in conjunction with other manifestations 28 29 37. While the principle process of intraerythrocytic Bartonella infection may occur similarly in any infected reservoir host, the severity of clinical presentations may inversely reflect the level of adaptation of the pathogen to its specific reservoir host, eventually allowing Bartonella to cause an extended, high-titer bacteremia with little or no harm.
While the synchronous “lytic” erythrocytic cycle of Plasmodium liberates parasites, causing the subsequent erythrocyte infection wave, the recurrent infection waves by Btr–gfp should be of a different origin, considering the nonhemolytic erythrocyte infection process by these bacteria. We propose that the recurrent erythrocyte infection waves are seeded from the same primary niche as the initial infection wave (Fig. 9). The observed recurrence may result from a lytic infection cycle that lasts ∼5 d in this primary niche, liberating bacteria that coincidentally infect erythrocytes as well as reinfect this primary niche (Fig. 9).
It will be intriguing to identify the yet elusive primary niche of bartonellae in the reservoir hosts and to study how the recurrent intraerythrocytic infection waves are seeded. A molecular understanding of the mechanisms of forced entry into mature erythrocytes and of growth control allowing the persistent intraerythrocytic colonization will be both scientifically compelling and important for developing strategies to control or prevent human infection by bartonellae as important emerging pathogens.
Acknowledgments
We are grateful to Dr. Remy Heller for helpful suggestions and discussions. We would like to thank B. Pichler-Brand for her excellent assistance in electron microscopy. We also thank Christopher Snyder and Drs. Michaela Dehio and Terry Kwok for their critical reading of the manuscript.
This work was supported by Deutsche Forschungsgemeinschaft grant DE 539/3-1 and Swiss National Science Foundation grant 31-61777.00 (both to C. Dehio).
Footnotes
Abbreviations used in this paper: Btr, Bartonella tribocorum; d.p.i., days post-inoculation; FL, fluorescence channel; GFP, green fluorescent protein; TEM, transmission electron microscopy.
R. Schülein and A. Seubert contributed equally to this work.
References
- Dehio C., Sander A. Bartonella as emerging pathogens. Trends Microbiol. 1999;7:226–228. doi: 10.1016/s0966-842x(99)01523-1. [DOI] [PubMed] [Google Scholar]
- Breitschwerdt E.B., Kordick D.L. Bartonella infection in animalscarriership, reservoir potential, pathogenicity, and zoonotic potential for human infection. Clin. Microbiol. Rev. 2000;13:428–438. doi: 10.1128/cmr.13.3.428-438.2000. [DOI] [PMC free article] [PubMed] [Google Scholar]
- Kordick D.L., Breitschwerdt E.B. Intraerythrocytic presence of Bartonella henselae . J. Clin. Microbiol. 1995;33:1655–1656. doi: 10.1128/jcm.33.6.1655-1656.1995. [DOI] [PMC free article] [PubMed] [Google Scholar]
- Anderson B.E., Neuman M.A. Bartonella spp. as emerging human pathogens. Clin. Microbiol. Rev. 1997;10:203–219. doi: 10.1128/cmr.10.2.203. [DOI] [PMC free article] [PubMed] [Google Scholar]
- Daly J.S., Worthington M.G., Brenner D.J., Moss C.W., Hollis D.G., Weyant R.S., Steigerwalt A.G., Weaver R.E., Daneshvar M.I., O'Connor S.P. Rochalimaea elizabethae sp. nov. isolated from a patient with endocarditis. J. Clin. Microbiol. 1993;31:872–881. doi: 10.1128/jcm.31.4.872-881.1993. [DOI] [PMC free article] [PubMed] [Google Scholar]
- Kordick D.L., Hilyard E.J., Hadfield T.L., Wilson K.H., Steigerwalt A.G., Brenner D.J., Breitschwerdt E.B. Bartonella clarridgeiae, a newly recognized zoonotic pathogen causing inoculation papules, fever, and lymphadenopathy (cat scratch disease) J. Clin. Microbiol. 1997;35:1813–1818. doi: 10.1128/jcm.35.7.1813-1818.1997. [DOI] [PMC free article] [PubMed] [Google Scholar]
- Ellis B.A., Regnery R.L., Beati L., Bacellar F., Rood M., Glass G.G., Marston E., Ksiazek T.G., Jones D., Childs J.E. Rats of the genus Rattus are reservoir hosts for pathogenic Bartonella speciesan Old World origin for a New World disease? J. Infect. Dis. 1999;180:220–224. doi: 10.1086/314824. [DOI] [PubMed] [Google Scholar]
- Kerkhoff F.T., Bergmans A.M., van Der Zee A., Rothova A. Demonstration of Bartonella grahamii DNA in ocular fluids of a patient with neuroretinitis. J. Clin. Microbiol. 1999;37:4034–4038. doi: 10.1128/jcm.37.12.4034-4038.1999. [DOI] [PMC free article] [PubMed] [Google Scholar]
- Garcia-Caceres U., Garcia F.U. Bartonellosis. An immunodepressive disease and the life of Daniel Alcides Carrion. Am. J. Clin. Pathol. 1991;95:S58–S66. [PubMed] [Google Scholar]
- Weinman D., Pinkerton H. Carrion's disease. IV. Natural sources of Bartonella in the endemic zone. Proc. Soc. Exp. Biol. Med. 1937;37:596–598. [Google Scholar]
- Raynafarje C., Ramos J. The hemolytic anemia of human bartonellosis. Blood. 1961;17:562–578. [PubMed] [Google Scholar]
- Schultz M.G. A history of bartonellosis (Carrion's disease) Am. J. Trop. Med. Hyg. 1968;17:503–515. doi: 10.4269/ajtmh.1968.17.503. [DOI] [PubMed] [Google Scholar]
- Dehio C. Interactions of Bartonella henselae with vascular endothelial cells. Curr. Opin. Microbiol. 1999;2:78–82. doi: 10.1016/s1369-5274(99)80013-7. [DOI] [PubMed] [Google Scholar]
- Bass J.W., Vincent J.M., Person D.A. The expanding spectrum of Bartonella infections. I. Bartonellosis and trench fever. Pediatr. Infect. Dis. J. 1997;16:2–10. doi: 10.1097/00006454-199701000-00003. [DOI] [PubMed] [Google Scholar]
- Brouqui P., Lascola B., Roux V., Raoult D. Chronic Bartonella quintana bacteremia in homeless patients. N. Engl. J. Med. 1999;340:184–189. doi: 10.1056/NEJM199901213400303. [DOI] [PubMed] [Google Scholar]
- Jackson L.A., Spach D.H., Kippen D.A., Sugg N.K., Regnery R.L., Sayers M.H., Stamm W.E. Seroprevalence to Bartonella quintana among patients at a community clinic in downtown Seattle. J. Infect. Dis. 1996;173:1023–1026. doi: 10.1093/infdis/173.4.1023. [DOI] [PubMed] [Google Scholar]
- Hendrix L.R. Contact-dependent hemolytic activity distinct from deforming activity of Bartonella bacilliformis . FEMS Microbiol. Lett. 2000;182:119–124. doi: 10.1111/j.1574-6968.2000.tb08884.x. [DOI] [PubMed] [Google Scholar]
- Heller R., Riegel P., Hansmann Y., Delacour G., Bermond D., Dehio C., Lamarque F., Monteil H., Chomel B., Piemont Y. Bartonella tribocorum sp. nov., a new Bartonella species isolated from the blood of wild rats. Int. J. Syst. Bacteriol. 1998;48:1333–1339. doi: 10.1099/00207713-48-4-1333. [DOI] [PubMed] [Google Scholar]
- Dehio C., Meyer M. Maintenance of broad-host-range incompatibility group P and group Q plasmids and transposition of Tn5 in Bartonella henselae following conjugal plasmid transfer from Escherichia coli . J. Bacteriol. 1997;179:538–540. doi: 10.1128/jb.179.2.538-540.1997. [DOI] [PMC free article] [PubMed] [Google Scholar]
- Sambrook J., Fritsch E.F., Maniatis T. Molecular CloningA Laboratory Manual 1989. Cold Spring Harbor Laboratory Press, ; Cold Spring Harbor, NY: 1.3–6.60. [Google Scholar]
- Cormack B.P., Valdivia R.H., Falkow S. FACS®-optimized mutants of the green fluorescent protein (GFP) Gene. 1996;173:33–38. doi: 10.1016/0378-1119(95)00685-0. [DOI] [PubMed] [Google Scholar]
- Dehio M., Knorre A., Lanz C., Dehio C. Construction of versatile high-level expression vectors for Bartonella henselae and the use of green fluorescent protein as a new expression marker. Gene. 1998;215:223–229. doi: 10.1016/s0378-1119(98)00319-9. [DOI] [PubMed] [Google Scholar]
- Quandt J., Hynes M.F. Versatile suicide vectors which allow direct selection for gene replacement in gram-negative bacteria. Gene. 1993;127:15–21. doi: 10.1016/0378-1119(93)90611-6. [DOI] [PubMed] [Google Scholar]
- de Lorenzo V., Herrero M., Jakubzik U., Timmis K.N. Mini-Tn5 transposon derivatives for insertion mutagenesis, promoter probing, and chromosomal insertion of cloned DNA in gram-negative eubacteria. J. Bacteriol. 1990;172:6568–6572. doi: 10.1128/jb.172.11.6568-6572.1990. [DOI] [PMC free article] [PubMed] [Google Scholar]
- Hoffmann-Fezer G., Maschke H., Zeitler H.J., Gais P., Heger W., Ellwart J., Thierfelder S. Direct in vivo biotinylation of erythrocytes as an assay for red cell survival studies. Ann. Hematol. 1991;63:214–217. doi: 10.1007/BF01703446. [DOI] [PubMed] [Google Scholar]
- Regnery R.L., Rooney J.A., Johnson A.M., Nesby S.L., Manzewitsch P., Beaver K., Olson J.G. Experimentally induced Bartonella henselae infections followed by challenge exposure and antimicrobial therapy in cats. Am. J. Vet. Res. 1996;57:1714–1719. [PubMed] [Google Scholar]
- Kordick D.L., Breitschwerdt E.B. Relapsing bacteremia after blood transmission of Bartonella henselae to cats. Am. J. Vet. Res. 1997;58:492–497. [PubMed] [Google Scholar]
- Guptill L., Slater L., Wu C.C., Lin T.L., Glickman L.T., Welch D.F., HogenEsch H. Experimental infection of young specific pathogen-free cats with Bartonella henselae . J. Infect. Dis. 1997;176:206–216. doi: 10.1086/514026. [DOI] [PubMed] [Google Scholar]
- O'Reilly K.L., Bauer R.W., Freeland R.L., Foil L.D., Hughes K.J., Rohde K.R., Roy A.F., Stout R.W., Triche P.C. Acute clinical disease in cats following infection with a pathogenic strain of Bartonella henselae (LSU16) Infect. Immun. 1999;67:3066–3072. doi: 10.1128/iai.67.6.3066-3072.1999. [DOI] [PMC free article] [PubMed] [Google Scholar]
- Kosoy M.Y., Regnery R.L., Kosaya O.I., Childs J.E. Experimental infection of cotton rats with three naturally occurring Bartonella species. J. Wildl. Dis. 1999;35:275–284. doi: 10.7589/0090-3558-35.2.275. [DOI] [PubMed] [Google Scholar]
- Guptill L., Slater L., Wu C.C., Glickman L.T., Lin T.L., Welch D.F., Crippen J.T., HogenEsch H. Immune response of neonatal specific pathogen-free cats to experimental infection with Bartonella henselae . Vet. Immunol. Immunopathol. 1999;71:233–243. doi: 10.1016/s0165-2427(99)00104-x. [DOI] [PubMed] [Google Scholar]
- Xu Y.H., Lu Z.Y., Ihler G.M. Purification of deformin, an extracellular protein synthesized by Bartonella bacilliformis which causes deformation of erythrocyte membranes. Biochim. Biophys. Acta. 1995;1234:173–183. doi: 10.1016/0005-2736(94)00271-p. [DOI] [PubMed] [Google Scholar]
- Iwaki-Egawa S., Ihler G.M. Comparison of the abilities of proteins from Bartonella bacilliformis and Bartonella henselae to deform red cell membranes and to bind to red cell ghost proteins. FEMS Microbiol. Lett. 1997;157:207–217. doi: 10.1111/j.1574-6968.1997.tb12775.x. [DOI] [PubMed] [Google Scholar]
- Benson L.A., Kar S., McLaughlin G., Ihler G.M. Entry of Bartonella bacilliformis into erythrocytes. Infect. Immun. 1986;54:347–353. doi: 10.1128/iai.54.2.347-353.1986. [DOI] [PMC free article] [PubMed] [Google Scholar]
- Bassler B.L. How bacteria talk to each otherregulation of gene expression by quorum sensing. Curr. Opin. Microbiol. 1999;2:582–587. doi: 10.1016/s1369-5274(99)00025-9. [DOI] [PubMed] [Google Scholar]
- Sinnis P., Sim B.K. Cell invasion by the vertebrate stages of Plasmodium . Trends Microbiol. 1997;5:52–58. doi: 10.1016/s0966-842x(97)84657-4. [DOI] [PMC free article] [PubMed] [Google Scholar]
- Abbott R.C., Chomel B.B., Kasten R.W., Floyd-Hawkins K.A., Kikuchi Y., Koehler J.E., Pedersen N.C. Experimental and natural infection with Bartonella henselae in domestic cats. Comp. Immunol. Microbiol. Infect. Dis. 1997;20:41–51. doi: 10.1016/s0147-9571(96)00025-2. [DOI] [PubMed] [Google Scholar]