Abstract
Antiviral roles of natural killer (NK) cell subsets were examined in C57BL/6 mice infected with murine cytomegalovirus (MCMV) and other viruses, including lymphocytic choriomeningitis virus (LCMV), vaccinia virus (VV), and mouse hepatitis virus (MHV). Each virus vigorously induced an NK cell infiltrate into the peritoneal cavity and liver, causing some redistributions of NK cell subsets defined by monoclonal antibody (mAb) directed against Ly49A, C/I, D, and G2. Striking results were seen with a mAb (1F8) reactive with the positively signaling molecule Ly49H, present in MCMV-resistant C57BL/6 mice. mAb 1F8 also stains Ly49 C and I, but exclusion of those reactivities with mAb 5E6, which recognizes Ly49 C and I, indicated that Ly49H+ cells infiltrated the peritoneal cavity and liver and were particularly effective at synthesizing interferon γ. Depletion of 1F8+ but not 5E6+ cells in vivo by mAb injections enhanced MCMV titers by 20-1,000-fold in the spleen and approximately fivefold in the liver. Titers of LCMV or VV were not enhanced. These anti-MCMV effects were attributed to prototypical NK1.1+CD3− NK cells and not to NK1.1+CD3+ “NK/T” cells. This is the first evidence that control of a virus infection in vivo is mediated by a distinct NK cell subset.
Keywords: NK cells, NK receptors, Ly49, murine cytomegalovirus, IFN-γ
Introduction
NK cells represent up to 15% of peripheral blood lymphocytes and can reach high concentrations at sites of inflammation, but despite their discovery 25 yr ago, convincing evidence for their importance has only been established in a limited number of systems 1. Although proposed to mediate immunoregulatory and tumor surveillance functions, their primary role, like that of the rest of the immune system, is most likely to combat infectious agents. To do so, they may need the capacity to selectively recognize and attack infected host cells or else to nonselectively respond to stimuli and mediate effector function by the nonspecific release of cytokines. An understanding of the molecular mechanisms of NK cell recognition of target cells has been developed after the identification of a series of families of NK cell receptor (NKR) molecules that can deliver either negative or positive signals to NK cells on encounter with a target 2 3 4. Many of these receptor molecules recognize MHC class I antigens, but the possibility remains that some might also recognize other cell surface structures.
One family of mouse NKR molecules is the Ly49 group, which now consists of a variety of C-type lectin molecules, designated A through W. The Ly49 gene family maps near the positive-triggering molecule NKR-P1 (defined by mAb NK1.1) in the area of chromosome 6, known as the NK cell complex 5 6. Of note is that genetic resistance and susceptibility to murine cytomegalovirus (MCMV) maps within this region at a locus designated Cmv-1 7. The evidence implicating NK cells in the control of MCMV infection is stronger than for any other infectious agent. Suckling mice are very sensitive to MCMV infection, but a level of resistance develops at about the third week of age, correlating not only with the development of NK cell activity but also with the expression of Ly49 molecules on a high frequency of NK cells 8 9. Reconstitution of suckling mice with NK cells in adult splenocytes or with IL-2–activated, cultured lymphokine-activated NK cells confers resistance to infection 10 11. Depletion of NK cells with anti-NK cell Abs in normal, athymic nude, or severe combined immunodeficiency mice results in substantially elevated titers of MCMV early in infection 12 13 14 15 16. Mice with genetic deficiencies in NK cell function are very sensitive to MCMV 17. Together these experiments indicate that classically defined CD3− NK cells, as opposed to NK/T cells, provide innate immunity to MCMV.
NK cells regulate MCMV infection by different preferred mechanisms in different organs. In the liver, MCMV is controlled by IFN-γ, possibly acting through a nitric oxide synthase intermediate 18 19. The chemokine MIP-1α attracts NK cells into the liver 20. MCMV induces relatively high levels of IL-12, which serves to induce secretion of IFN-γ from the highly activated NK cells 18. In the spleen, the NK cell–mediated control of MCMV is less dependent on IFN-γ and more dependent on perforin 19. The presumption is that a cytotoxic mechanism regulates MCMV in the spleen, but it is not known why these organs differ mechanistically in their control of MCMV. Of note is that the Cmv-1 locus appears to regulate MCMV synthesis more in the spleen than in the liver, suggesting that it might relate to a cytotoxic mechanism 7.
The mapping of the Cmv-1 gene in proximity to the Ly49 loci in C57BL/6 mice has previously led us to question whether NK cell subsets expressing a distinct Ly49 molecule might mediate resistance to MCMV. No NK cell subset has ever been shown to selectively regulate the synthesis of a virus or any other pathogen in vivo. Analyses of cells expressing different Ly49 molecules have been complicated by the fact that each NK cell expresses several different types of Ly49 molecules and that some of the Abs directed against one molecule cross-react with other molecules. To date, Ly49 molecules defined by four different commercially available Abs have been examined in the MCMV system: Ly49A, D, G2, and C and I, which is a pair detected by the same mAb (5E6; reference 21). No selective role for either subset could be shown in the control of infection 22. Mice depleted of NK subsets in vivo with mAb to Ly49 A, D, C/I, or G2, or with combinations of two or three anti-Ly49 mAbs tended to be just as resistant to MCMV as untreated mice. Adoptive transfers of any of these subsets into suckling mice protected them against MCMV 22. This indicated that neither of these Ly49 molecules defined a subset of NK cells required for resistance to MCMV.
We report here that an NK cell subset detected by the anti-Ly49 mAb 1F8 is essential for resistance to MCMV in C57BL/6 mice. This mAb was generated against Ly49H, a positively signaling Ly49 molecule 4. It cross-reacts with Ly49C and I, which is detected by the 5E6 mAb. We report here that the 1F8+(C/I/H) 5E6−(C/I) NK cell subset is essential for control of MCMV infection in C57BL/6 mice.
Materials and Methods
Mice.
Most experiments used 5–10-wk-old C57BL/6J (H2b) male mice; some experiments used Balb/cByJ (H2d) mice or C57BL/6 mice lacking all T cells as a consequence of genetic recombination deleting the TCR-â and ä genes (T cell knockout [KO] mice). All mice were purchased from The Jackson Laboratory.
Viruses.
The Smith strain of MCMV was propagated in vivo in salivary glands of Balb/c mice 14. Infected salivary gland homogenates were diluted in HBSS (Life Technologies) and, depending on the experiment, mice were inoculated intraperitoneally with 3 × 10³ to 2 × 10⁴ plaque-forming units (PFUs) of MCMV, as titrated on mouse embryonic fibroblast monolayers. The Armstrong strain of lymphocytic choriomeningitis virus (LCMV) and its more widely disseminating clone 13 variant were propagated in baby hamster kidney cells, and ∼5 × 10⁴ PFUs, as titrated on vero cell monolayers, were used for inoculations 23. Vaccinia virus (VV), WR strain, was propagated in L929 cells, purified over sucrose gradients, and inoculated at doses of 106 PFUs, as titrated on vero cells 24. Mouse hepatitis virus (MHV), strain A-59, was propagated in L929 cells and, unless otherwise stated, was inoculated into mice at doses of 7 × 10⁵ PFUs, as assayed on L929 cell monolayers 25.
Preparation of mAb 1F8 to Ly49H.
The amino acid sequences of Ly49 C, I, and H are very similar to each other and differ significantly from other Ly49 molecules 26. mAb 1F8, a rat IgG2a with high reactivity to Ly49H, was prepared while attempting to generate an Ly49C-specific mAb. F334 rats were inoculated intrasplenically with 100 mg of a KLH-bound Ly49C amino acid sequence (CRPSNETLEYIKREQDRWDSKTKTVLD) that differed from Ly49I by a few amino acids. 1 mo later equal volumes of CFA and 100 mg of the peptide KLH were injected subcutaneously, followed by three additional injections at biweekly intervals. Spleen cells were removed and fused with SP2/0 myeloma cells to make mAbs. mAb specificity was screened on Bw5147 cells transfected with Ly49C or Ly49I or on RNK-16 cells transfected with Ly49H. All of the Ly49-specific mAb generated cross-reacted with Ly49 C, I, and H, but mAb 1F8 was the most potent and was useful for depletions in vivo. mAb 1F8 does not recognize Ly49 A, D, or G2. Limitations of this mAb are its cross-reactivity with Ly49 C and I, but it can be used to measure Ly49H by using it in concert with mAb 5E6, which reacts with Ly49 C and I, but not H. Another recently published mAb to Ly49H cross-reacts with Ly49I 27. To date there is no available mAb that exclusively recognizes Ly49H.
Depletion of NK Cells In Vivo.
Mice were depleted of NK cells by a single intraperitoneal inoculation of 25–200 μg of column-purified mAb 1F8 6–24 h before infection with virus. As controls, mice were inoculated with 100 μl PBS containing 200 μg of mAb 5E6, which recognizes Ly49 C/I, or with a dose of mAb to NK1.1 (PK136) titrated to eliminate LCMV-induced NK cell but not CTL activity 12. Some control mice were inoculated with PBS which, as we showed previously, results in MCMV titers indistinguishable from inoculations with mAb to Ly49A, D, G2, or C/I 22.
Isolation of Leukocytes.
Spleens were ground between glass microscope slides, and spleen leukocytes were isolated by treatment with 0.84% NH4Cl to lyse erythrocytes. Peritoneal cells were isolated by lavaging the peritoneal cavity with 10 ml of RPMI 1640 (Life Technologies). Liver leukocytes were isolated by flushing blood from the liver by injecting media through the portal vein, crushing the liver in a tissue grinder, treating with type II collagenase (Sigma-Aldrich) and type I DNase (Sigma-Aldrich), and harvesting the leukocyte layer from a metrizamide (Sigma-Aldrich) density gradient, as described previously 28.
Immunofluorescence Staining and Intracellular IFN-γ Assay.
Leukocytes were isolated and stained for the intracellular accumulation of IFN-γ using reagents and the protocol of BD PharMingen. One million cells were cultured in Falcon 96-well U-bottomed plates (Becton Dickinson) with RPMI media (Life Technologies) containing GolgiPlug (BD PharMingen) at 0.2 μl per sample in the presence or absence of 50 ng/ml PMA (Sigma-Aldrich) and 500 ng/ml ionomycin (Sigma-Aldrich) for 4 h at 37°C. Unless otherwise stated, data are shown for samples incubated in the absence of PMA and ionomycin. Cells were washed using FACS® buffer (PBS with 2% FCS and 0.02% sodium azide) and incubated for 15 min at 4°C in 100 μl of FACS® buffer plus 9 μl normal mouse serum and 1 μl of anti-FcγII receptor Ab to block nonspecific staining. Cells were washed and incubated at 4°C for 30 min with combinations of anti-NK1.1-PE (BD PharMingen), anti-CD3-PerCP (BD PharMingen), and various anti-Ly49 mAb or isotype controls. These were isotype control mouse (m) IgG2a-FITC (BD PharMingen), isotype control rat (r) IgG2a-FITC (BD PharMingen), anti-Ly49D-FITC (a gift from Dr. John Ortaldo, National Cancer Institute, Frederick, MD), anti-Ly49G2-FITC (BD PharMingen), anti-Ly49C-biotin (BD PharMingen), and anti-Ly49H (1F8)-FITC produced by us. Samples were washed twice and, if necessary, were incubated with SA-PerCP (BD PharMingen) for 30 min at 4°C. Otherwise they were fixed and permeabilized using 100 μl of cytofix/cytoperm solution for 20 min at 4°C. After fixation the samples were washed twice using perm/wash solution (200 μl per sample) and stained with rat IgG1-APC mAb to mouse IFN-γ (BD PharMingen) or with a control rat IgG1-APC (BD PharMingen) for 30 min at 4°C. Samples were then washed two times using perm/wash and once using FACS® buffer before being transferred to tubes (model 2008; Falcon) for analysis on either a FACS® 440 (Becton Dickinson) or a FACStar™ Plus (Becton Dickinson). For these analyses, 60–80,000 events were calculated, ensuring a sizable NK cell population for a valid analysis of NK subsets. All experiments used relevant control mAbs with isotypes equivalent to the anti-Ly49 and anti–IFN-γ mAb, but in some figures the negative isotype control plots are not shown to maintain clarity and simplicity of the figure.
Results
NK Cell Subset Distribution during Viral Infections.
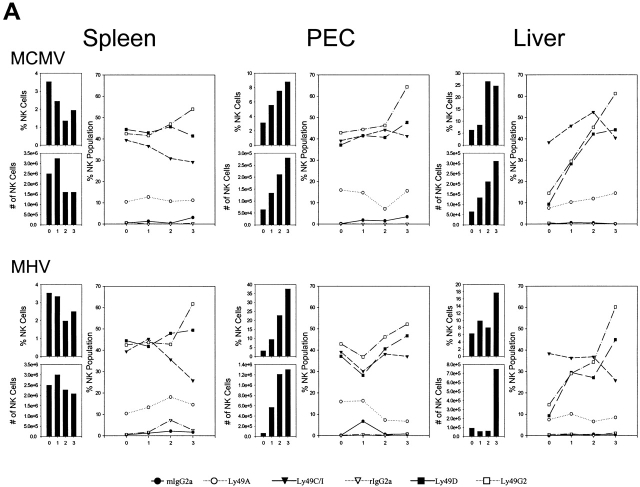
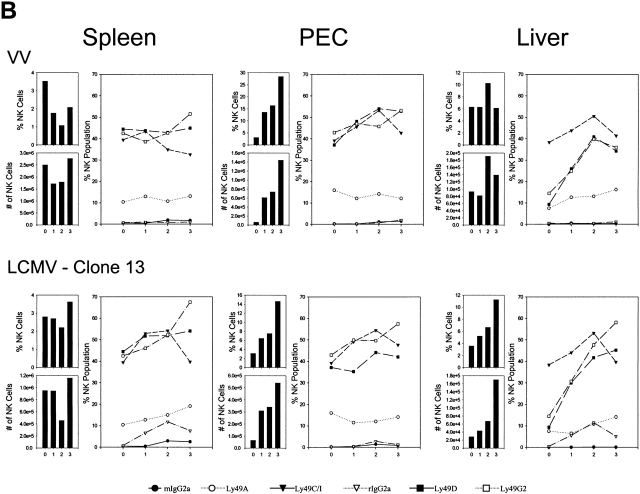
The NK cell response against MCMV (Fig. 1 A), MHV (Fig. 1 A), VV (Fig. 1 B), and a disseminating strain of LCMV (clone 13) (Fig. 1 B) was examined initially during the first 3 d of infection of C57BL/6 mice. Here spleen, peritoneal cavity, and liver NK cells, defined as NK1.1+CD3−, were quantified, and their total numbers and percentages within lymphocyte-gated populations were enumerated, as shown in the vertical bars in Fig. 1. Each virus infection initially caused a slight transient decrease in NK cell number and percent in the spleen, but each virus induced a substantial increase in NK cell number and percent in the peritoneal cavity, which was the site of viral inoculation. This increase in NK cells in the peritoneal exudate cells (PECs) with all of these viruses had been reported by us in the 1980s, when large granular lymphocyte morphology and Ab to asialo GM1 was used to define NK cells 29 30. NK 1.1 is a more specific NK cell marker, particularly when used on lymphocyte-gated cells that fail to stain with anti-CD3. It is now known that there are significant populations of “NK/T” cells that costain with anti-NK1.1 and anti-CD3, and it is important to make those distinctions. In addition, we have found that VV induces a strong γδ T cell response and that ∼1/3 of those γδ T cells stain with anti-NK1.1 31. Each virus also stimulated an increase in the total number and percentage of NK cells in the liver, a result also previously noted by us using less definitive techniques 28. These increases in NK cell numbers and percentages are very reproducible findings, though the degree and kinetics of the responses vary somewhat with virus dose. We have previously shown that NK cells migrate into areas of virus infection and undergo division in those areas 28 29 30.
Figure 1.
Dynamics of the NK cell response to virus infections. Spleen, PECs, and liver leukocyte populations were isolated and examined daily after infections of C57BL/6 mice with MCMV (A), MHV (A), VV (B), and LCMV clone 13 (B). Line diagrams depict the percentage of gated NK1.1+CD3− NK cells reacting with mAb to Ly49A, C/I, D, or G2, or with appropriate isotype control Abs. To the left of each line diagram are vertical bars depicting the percentage of NK1.1+CD3− cells in lymphocyte-gated fractions (top) and the total number of NK1.1+CD3− cells per organ (bottom).
We questioned whether commercially available Abs to Ly49 molecules (A, C/I, D, G2) could detect qualitative differences in NK cell responses between organs and between viruses. These experiments showed a great deal of animal-to-animal variability, but some conclusions could be drawn. The first conclusion is that only a low percentage of resident NK cells in the liver before infection expressed these Ly49 antigens, with the exception of Ly49 C/I, which was lower but in the range of spleen and PEC percentages. A much higher frequency of the infiltrating NK cell population in the liver after virus infection expressed other Ly49 markers, in particular Ly49 D and G2, at frequencies more in line with other compartments. A second major conclusion is that within a mouse the relative frequencies of NK cells coexpressing Ly49 molecules change in relation to each other in different organs and at different times after infection. This indicates that these NK cell subsets are responding to signals induced by the viral infections differently, though it is less clear how different one virus was from the other at inducing these changes in NK cell distribution. In this experiment it appeared that all four viruses induced drops in Ly49C percentages in the spleen and rises in the PECs. Ly49G2 percentages rose in every organ with every infection. These observations were previously noted by us in more extensive analyses with MCMV 22. A consistent result seen by us in three experiments was that the ratio of Ly49G2+ to Ly49C/I+ liver NK cells at 3 d after infection was high (often >2:1) after infection with MCMV, LCMV, or MHV, but the frequencies of Ly49G2+ and Ly49C/I+ liver NK cells were about equal after VV infection (Fig. 1, and data not shown). These subtle differences suggest some selectivity in the NK cell responses to different viruses.
Although each of these viruses activated NK cell populations and stimulated their redistribution, it is only MCMV that has been consistently shown to be highly regulated by NK cells 12 13 14 16 17 32. Inoculation of mice with Ab to NK1.1 results in significantly higher titers of MCMV in the spleen and liver by 3 d after infection 15 16. We previously showed that depletion of any one or two NK cell subsets by inoculating mice with Abs to Ly49A, C/I, D, or G2 had no effect on MCMV synthesis, even though some of these mAb combinations reacted with >70% of the NK cells before infection 22. This indicates that, while viral infections induce redistributions of NK cell subsets, no subset defined by the commercially available Abs is essential for the control of MCMV infection. Therefore, we questioned whether other Ly49 molecules might be of unique significance in controlling viral infections and report below on studies with mAb 1F8, recognizing Ly49H, but cross-reacting with Ly49 C and I, molecules detected by the 5E6 mAb.
Strain Distribution of 1F8 Reactivity.
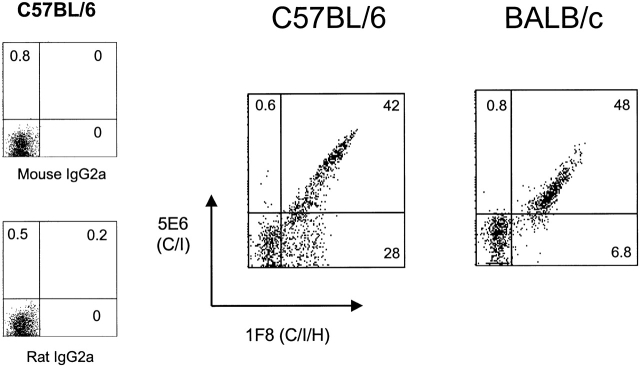
The resistance of mice to MCMV is very dependent on their genetic background 7. Balb/c mice are highly susceptible, and C57BL/6 mice are resistant. In this study we found that by day 4 after infection the Balb/c mice had >100-fold more MCMV PFUs in their spleens than did the C57BL/6 strain. Fig. 2 shows the expression of antigens detected by mAb 1F8 (C/I/H) and 5E6 (C/I) on splenocytes of these mice, all gated on cells expressing the pan NK cell marker DX-5. NK cells from the highly sensitive Balb/c strain stained with 5E6, but did not express the Ly49H subset, as defined by 1F8+5E6−cells. In contrast, NK cells from C57BL/6 mice had sizable proportions of both 1F8+5E6+ and 1F8+5E6− populations. Thus, the expression of Ly49H (defined as 1F8+5E6−) on NK cells appeared to correlate with the resistance of mice to MCMV.
Figure 2.
Expression of Ly49H on NK cells from different strains of mice. C57BL/6 and Balb/c splenocytes were stained with mAb DX-5 (as a pan NK cell marker that would recognize cells from each strain), anti-CD3, and mAb 1F8 (anti-Ly49 C/I/H) and mAb 5E6 (anti-Ly49 C/I). Diagrams depict the staining of gated DX-5+CD3− lymphocytes and isotype controls for mAb 5E6 and 1F8.
Accumulation of Ly49H+ Cells at Sites of MCMV Infection.
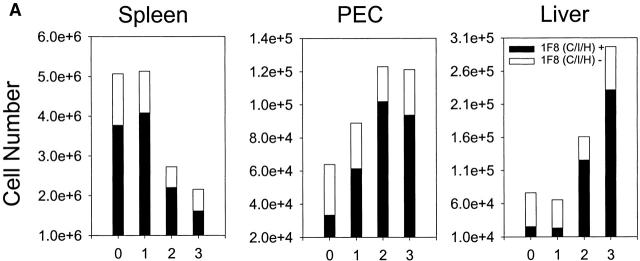
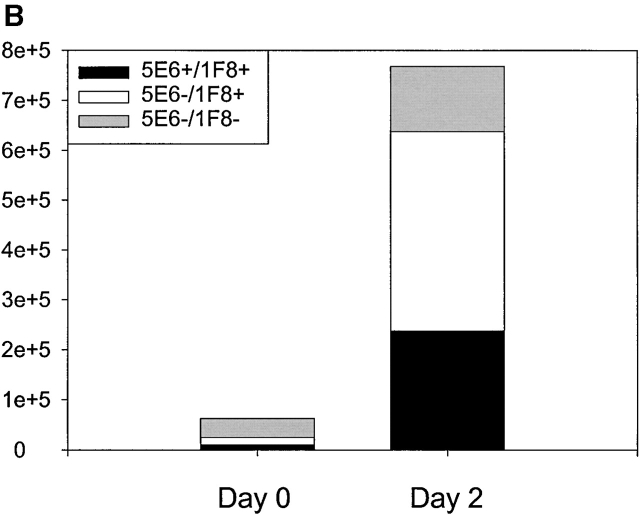
Mice were inoculated intraperitoneally with MCMV and examined for the accumulation of NK cell subsets costaining with mAb 1F8. Fig. 3 A shows that MCMV induced a substantial increase in the number of NK1.1+CD3− NK cells and that there was a substantial total number and proportional increase in the 1F8+ NK cell subset in the liver and PECs at days 2 and 3 after infection. Fig. 3 B shows that a high proportion of the NK cells infiltrating the MCMV-infected liver by day 2 stained with mAb 1F8 but not 5E6, suggesting that this was indeed an infiltration by Ly49H+ cells. There also was a significant increase in 1F8+5E6+ cells, but it is not possible to determine whether these cells also coexpressed Ly49H.
Figure 3.
Reactivity of leukocytes with mAb 1F8 after MCMV infection. (A) C57BL/6 mice were inoculated intraperitoneally with MCMV and the total number of gated NK1.1+CD3− NK cells costaining with mAb 1F8 was monitored by multiplying the percentage of positively staining cells by the total number or organ lymphocytes. (B) The experiment was designed as in A, except that at day 2 after infection, NK1.1+CD3−–gated liver NK cells were stained with both mAb 5E6 (anti-Ly49C/I) and 1F8 (anti-Ly49C/I/H). The 5E6−1F8+ cells are presumed to express Ly49H but not Ly49 C or I.
Selective Synthesis of IFN-γ by Ly49H+ Cells.
We noted that, in the presence of brefeldin A, substantial proportions (i.e. >25%) of the NK cells from MCMV-infected mice spontaneously produce intracellular IFN-γ if allowed to incubate in the milieu of leukocytes from virus-infected tissue. For these assays to be optimal, the cells were quickly harvested and incubated without being put on ice. Usually this intracellular IFN assay is done with lymphocytes receiving an in vitro stimulus with immunogenic peptides (for T cells) or with nonspecific stimulators, such as PMA and ionomycin 24 33; this may mean that something in this cellular milieu continued to stimulate the NK cells. Because of the unusual nature of this assay, several controls, in addition to the isotype controls for the anti–IFN-γ mAb used in every assay, were run to ensure that synthesis of IFN-γ was being observed. Using splenocytes from day 2 MCMV-infected mice as a source of IFN-γ–producing cells, threefold molar excess of unlabeled anti-IFN-γ mAb reduced the frequency of anti–IFN-γ–staining NK cells from 23 to 7.6%, and the mean fluorescent intensity of the remaining and very weakly staining positive cells was reduced from 638 to 120. This mAb did not block the ability of (nonNK cell) splenocytes to synthesize intracellular TNF-α (positive control = 0.8%; anti–IFN-γ mAb-blocked = 0.7%). Similarly, incubation of the anti–IFN-γ mAb with 0.8 μg/ml IFN-γ during the IFN-γ assay reduced the frequency of IFN-γ staining from 20 to 7.5, and reduced the mean fluorescent intensity of the remaining positive cells from 736 to 473, without reducing the staining against TNF-α. We conclude that this assay is indeed detecting IFN-γ synthesis and that it is revealing a high frequency of NK cells that produce IFN-γ when kept in the milieu of leukocytes from virus-infected mice. We examined IFN-γ–producing NK cells over the first 3 d of MCMV infection and found a sharp peak of production at 2 d after infection, in agreement with other publications using different types of techniques 18.
NK1.1+CD3− Lymphocytes Were Analyzed for IFN-γ Production in Different Ly49 Subsets.
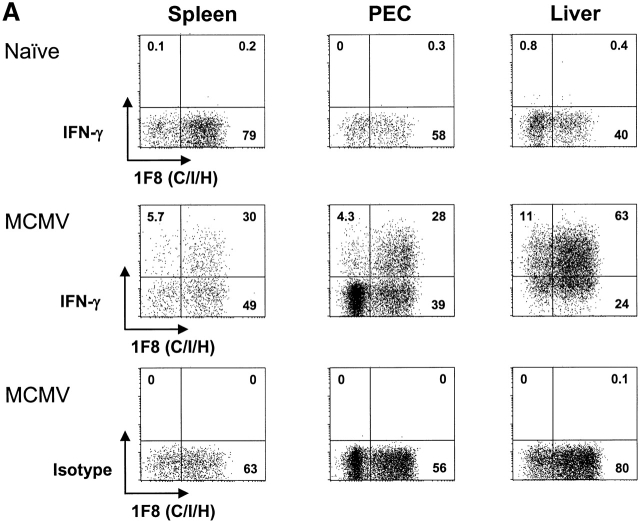
Fig. 4 shows that, whereas no spontaneous IFN-γ production was made by uninfected splenocytes, PECs, or liver leukocytes, substantial levels were made in all compartments 2 d after MCMV infection. Substantially higher proportions of NK cells made IFN-γ in the liver and PECs, in comparison to the spleen, perhaps because the liver is a site for substantial MCMV replication and the peritoneal cavity was the initial site of inoculation, and these sites may be enriched for IFN-γ–promoting factors, such as IL-12 34. In 17 experiments the average percent of NK1.1+CD3− splenocytes spontaneously producing IFN-γ after MCMV infection was 34 ± 16%; in 16 experiments the average in the PECs was 35 ± 13%; in six experiments with liver leukocytes the average number was 42 ± 14%.
Figure 4.
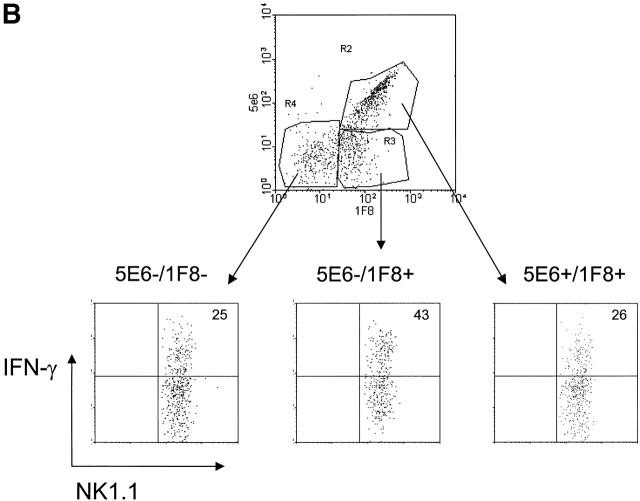
Pronounced IFN-γ production by NK cells reacting with mAb 1F8. (A) Spleen, PECs, or liver lymphocytes were monitored for spontaneous IFN-γ production before or 2 d after intraperitoneal infection with MCMV. The plots show NK1.1+CD3−–gated NK cells reacting with mAb 1F8 and producing intracellular IFN-γ in the presence of brefeldin A. Isotype control mAbs for IFN-γ showed virtually no (<1%) reactivity for any of the samples and are displayed for the MCMV-infected group. (B) NK1.1+–gated spleen NK cells 2 d after MCMV infection were costained with mAb 5E6 and 1F8 and tested for IFN-γ production.
Cells staining with mAb 1F8 accounted for much higher proportions of IFN-γ–producing cells than cells not reacting with mAb 1F8 in either the spleen or PECs (Fig. 4 A and 5); in fact, 1F8− cells tend to be very poor at IFN-γ production in those compartments. It is also noteworthy, as shown in Fig. 3, that the proportion of NK cells in the PECs and liver expressing the 1F8 antigens increased dramatically after infection. Thus, >80% of the IFN-γ–producing cells from these sites stained with mAb 1F8. Fig. 4 B shows IFN-γ production by spleen NK cell subsets stained with the 5E6 and 1F8 Abs. It shows that the 5E6−1F8+ staining population, presumably those expressing Ly49 H, were preferentially enriched in their production of IFN-γ. In about half of the experiments 5E6+ cells or 5E6+1F8+ cells were somewhat enriched for IFN-γ production, particularly from the PECs, but it is not possible to know if those cells coexpressed Ly49H. In all technically satisfactory experiments studied, however, IFN-γ production was substantially enriched in the 1F8+ (seven experiments) and in the 1F8+5E6− (five experiments) NK cell populations, particularly in contrast to the populations not staining with 5E6 or 1F8.
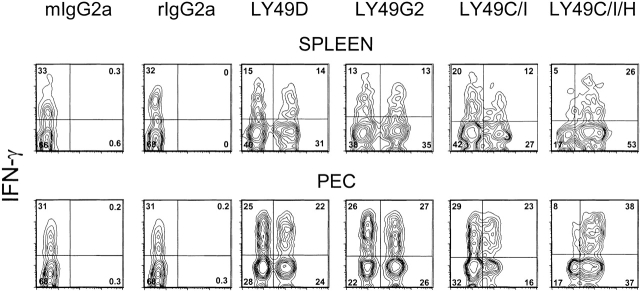
Additional experiments were done to determine whether there was enrichment for IFN-γ production in NK cells expressing other Ly49 antigens. Fig. 5 shows that similar proportions of Ly49D+ and Ly49D− cells made IFN-γ and similar proportions of Ly49G2+ and Ly49G2− cells made IFN-γ, indicating no enrichment in IFN-γ production in cells expressing those Ly49 markers. In other experiments we tested Ly49A+ and A− cells, finding no proportional differences in those populations either (data not shown). Fig. 5 also shows that splenocytes staining with mAb 5E6 (Ly49C/I) produced similar levels of IFN-γ as those not expressing that marker, but in the PECs, 5E6+ cells tend to have increased proportions of IFN-γ–producing cells. Over 80% of the IFN-γ–producing splenocytes and PECs in this experiment expressed reactivity with the 1F8 mAb. These experiments suggest that the Ly49H subset may be particularly effective at making IFN-γ after MCMV infection.
Figure 5.
Lack of selective IFN-γ production by Ly49D- or Ly49G2-expressing NK cells. Gated NK1.1+CD3− NK cells from the spleens and PECs of 2-d MCMV-infected C57BL/6 mice were stained with Abs to Ly49D, G2, C/I (mAb 5E6), or C/I/H (mAb 1F8) and tested for spontaneous IFN-γ production. Isotype controls for the Ly49 mAb are displayed. Isotype controls for the IFN-γ Ab were <1%, as seen in Fig. 4.
Stimulation of 1F8+ Cells by Other Viruses.
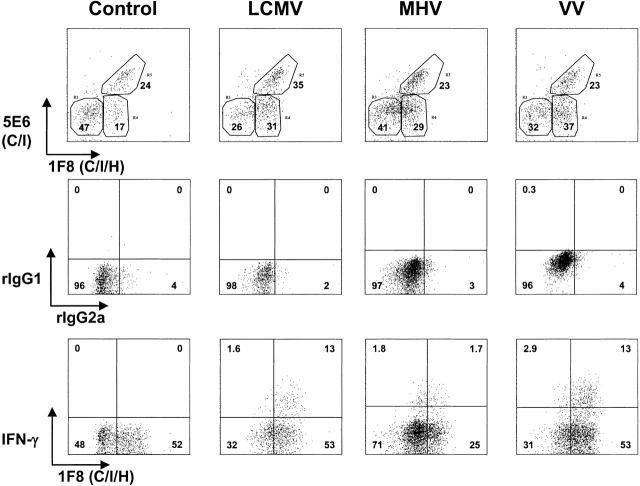
We tested whether the profound stimulation of Ly49H+ NK cells was unique to MCMV or whether it was a general property of viral infections. As with MCMV infection, the proportions of 1F8+ NK cells and of Ly49H+ (1F8+, 5E6−) NK cells increased in the organs of mice infected with LCMV clone 13, MHV, or VV. In one experiment, 17% of the resident PEC NK cells were 1F8+ 5E6−, and this increased to 31, 29, and 37% 2 d after infection with LCMV, MHV, and VV, respectively (Fig. 6); 6.7% of the resident NK cells in the liver were 1F8+5E6−, and this, respectively, increased to 36, 35, and 40% by 2 d after infection. LCMV and MHV were also examined at 3 d after infection and similarly induced higher levels of 1F8+5E6− (Ly49H)-positive cells in the PECs and liver by 3 d after infection (data not shown). Thus, this NK cell subset, presumed to be Ly49H+, appeared to respond well to all tested virus infections.
Figure 6.
Involvement of 1F8+ NK cells in the response to LCMV, MHV, and VV. (Top) Reactivity with mAb 5E6 and 1F8 on gated NK1.1+CD3− lymphocytes isolated from the peritoneal cavity of C57BL/6 control mice or mice 2 d after intraperitoneal infection with LCMV clone 13, MHV, or VV. (Middle and bottom rows) Staining after incubation in an intracellular IFN-γ assay. (Middle) Isotype control mAb staining for mAb to IFN-γ (rIgG1-APC) and mAb 1F8 (rIgG2a-FITC) for NK1.1+CD3−–gated lymphocytes from the same mice. (Bottom) Reactivity of NK1.1+CD3− lymphocytes with mAb to IFN-γ and to 1F8.
IFN-γ Production Was Examined in NK Cells Elicited by the Different Viruses.
Under these conditions of infection, MCMV elicited more spontaneous IFN-γ production from spleen, PECs, and liver NK cells at 2 d after infection than did the other viruses, as discussed earlier, presented in Fig. 4 A, and as shown in a control representative experiment for MCMV in Table . We did not systematically analyze whether these other viruses would induce substantially higher levels of IFN-γ from NK cells under conditions of different doses or times of infection, but it is noteworthy that none induced as high a proportion of NK cells producing IFN-γ as MCMV under the tested conditions, which, as shown in Fig. 1, stimulated strong NK cell responses. Nevertheless, all viruses did stimulate spontaneous IFN-γ production from some of the NK cells. Of note is that we did not observe spontaneous IFN-γ production by NK cells from mice treated with the type I IFN inducer and NK cell activator poly I:C (data not shown). It has been published previously that NK cells from MCMV-infected but not LCMV-infected mice produce IFN-γ, and this has been linked to differences in IL-12 production 35. Here we do see quantitative differences between the MCMV- and LCMV-induced NK cells, but substantial numbers of LCMV-induced NK cells clearly synthesized IFN-γ.
Table 1.
Proportion of NK Cell IFN-γ Response Mediated by 1F8+ or 5E6+ Cells in C57BL/6 Mice Infected with Different Viruses
| Percentage of total NK cells synthesizing IFN-γ | ||||||||
|---|---|---|---|---|---|---|---|---|
| Virus | Organ | 1F8+ | IF8− | (%) | 5E6+ | 5E6− | (%) | |
| Exp. 1 | MCMV | Spleen | 34 | 21 | (62) | 27 | 28 | (49) |
| PECs | 25 | 8.8 | (74) | 16 | 19 | (46) | ||
| LCMV-C113 | Spleen | 6.7 | 1.2 | (85) | 3.8 | 3.2 | (54) | |
| PECs | 13 | 0.9 | (94) | 9.4 | 3.6 | (72) | ||
| LCMC-Arm | Spleen | 6.2 | 2.0 | (76) | 3.6 | 3.4 | (51) | |
| PECs | 12 | 1.2 | (91) | 11 | 5.5 | (67) | ||
| Exp. 2 | LCMV-C114 | Spleen | 2.2 | 0.5 | (81) | 1.7 | 0.7 | (71) |
| PECs | 13 | 1.5 | (90) | 11 | 4.1 | (73) | ||
| Liver | 4.5 | 1.7 | (73) | 3.0 | 5.2 | (37) | ||
| MHV | Spleen | 4.5 | 0.8 | (85) | 1.3 | 2.2 | (37) | |
| PECs | 1.7 | 1.8 | (49) | 1.8 | 2.1 | (46) | ||
| Liver | 12 | 9.2 | (57) | 2.9 | 12 | (19) | ||
| VV | Spleen | 3.1 | 1.7 | (65) | 3.7 | 5.8 | (39) | |
| PECs | 13 | 2.9 | (82) | 8.4 | 4.9 | (63) | ||
| Liver | 7.5 | 3.8 | (66) | 3.0 | 8.3 | (27) | ||
C57BL/6 mice were infected with MCMV, LCMV-clone 13, the parent LCMV Armstrong strain, MHV, or VV. At 2 d after infection leukocytes isolated from the different tissues were examined for spontaneous synthesis of IFN-γ. Data shown are percentage of the NK1.1+CD3− cells that were 1F8+IFN-γ+ and 1F8−IFN-γ1, or, in the second group, that were 5E6+IFN-γ+ and 5E6-IFN-γ+. The percentage of cells synthesizing IFN-γ within the total NK cell population can be calculated by summing the values of each of the paired samples; minor variations in these sums between the mAb 1F8 paired groups and the mAb 5E6 paired groups are due to flow cytometric compensation differences. Exp., experiment.
We questioned whether the IFN-γ–producing NK cells elicited by these different viruses were also biased in their expression of 1F8. Experiment 1 in Table compares IFN-γ production in response to either of the two LCMV strains with MCMV, and even though the total IFN-γ response was much lower, the LCMV-induced NK cells had a similar if not greater skewing of the IFN-γ response within the NK cell population defined by mAb 1F8, and less so in that defined by mAb 5E6. A second experiment (Table , Exp. 2) with LCMV, MHV, and VV similarly showed a preponderance in IFN-γ responsiveness within the cell populations defined by mAb 1F8; the peritoneal cell data from this experiment are depicted in Fig. 6, which shows a predominant skewing of the IFN-γ response to 1F8+ cells, particularly for the LCMV and VV infections. These results suggest that the propensity of the 1F8+ cells to proportionally dominate the IFN-γ response of NK cells is profound but not specific to a given virus. It should also be noted that 5E6+ cells, which may or may not express Ly49H, had relatively high expression of IFN-γ in some of the samples (Table ).
Selective Depletion of NK Cell Subsets In Vivo.
To address the role of Ly49 subsets in regulating MCMV infection in vivo, mice were inoculated with mAb to Ly49 molecules in order to deplete various NK cell subsets. Our previous studies with in vivo–depleting doses of mAb to Ly49A, D, C/I, and G2 indicated that no one or two of them had any effect on MCMV synthesis, and combinations of three of them had little effect 22. As shown in Fig. 4, a substantial proportion of the spleen NK cells initially react with mAb 1F8 before infection, but this is no higher than those expressing Ly49G2 or combinations of two of the other Abs. Of note is that a substantial number of liver and PEC NK cells do not react with 1F8 before infection. Treatment of four naive mice in two experiments with 200 μg of mAb 1F8 resulted in ∼50% reduction in spleen NK cell–mediated cytotoxicity against YAC-1 activity when measured 1 d later. Immunofluorescent studies showed that mAb 1F8 treatment caused only a marginal (<30%) reduction in total spleen NK cell number 1 d after treatment, even though 1F8+ NK cells could not be found (data not shown). NK cells usually rapidly compensate for the lack of an NK cell subset. Mice treated with mAb 1F8 and then infected with LCMV had nearly identical levels of NK cell cytotoxicity against YAC-1 cells as untreated mice 3 d after LCMV infection, and mice treated with mAb to 1F8 and challenged with the IFN-inducer poly I:C had levels of NK cell activity similar to poly I:C–injected control mice at 2 d after treatment (data not shown).
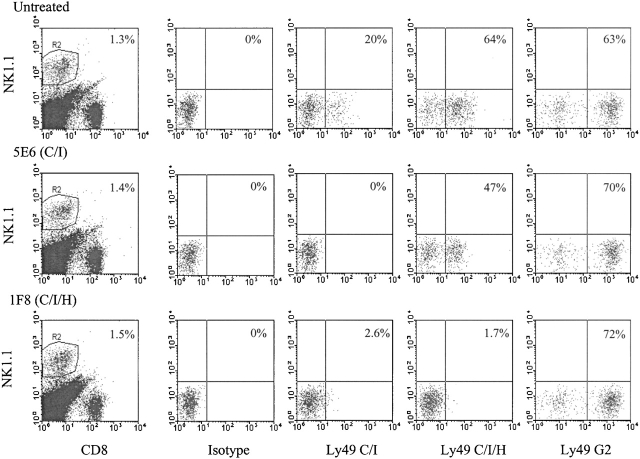
The above experiments indicated that residual NK cells rapidly compensated for the deletion of the 1F8+ NK cell subset, so we examined this depletion in the context of an MCMV infection. Fig. 7 shows the total NK cell percentage and the proportional distribution of NK cell subsets after mice were treated in vivo with mAb 1F8 (C/I/H) or 5E6 (C/I), infected with MCMV, and examined 4 d later. A substantial portion of NK1.1+ cells remained after treatment with either of the Abs. mAb 5E6 eliminated the 5E6+1F8+ NK cell subset, but enriched for the 5E6−1F8+ and Ly49G2+ subsets. mAb 1F8 eliminated both the 5E6+ and 1F8+ cells, but enriched for the G2+ cells. The fact that in vivo administration of mAb 1F8 eliminates cells staining with mAb 5E6 indicates that the loss of 1F8 reactive cells is due to their deletion and not to a masking of the 1F8 epitope with unlabeled mAb, because mAb 1F8 does not interfere with staining with mAb 5E6. Further, the enrichment in the Ly49G2 subset is another indicator that the 1F8+ subset is lost and not just obscured by mAb. This figure does illustrate how different NK cell subsets compensate for the deletion of others.
Figure 7.
C57BL/6 mice (n = 5 per group) were inoculated with HBSS (untreated), 200 μg mAb 5E6, or 200 μg mAb 1F8 and infected with MCMV 6 h later. 4 d later splenocytes were isolated. NK1.1+CD8− cells were costained with mAb 5E6 (Ly49C/I), 1F8 (Ly49C/I/H), anti-Ly49G2, or a mAb isotype control. In this case they were also costained with mAb to CD8 (as part of an experiment examining both T and NK cell functions), so the NK1.1+ cells may include both NK and NK/T cells. This figure shows selective depletions of some of the Ly49 subsets due to this mAb treatment. These same mice were examined for viral load, and those data are listed in experiment 1 (Table ).
In an additional control experiment, mAb 1F8 inoculation into irradiated (C57BL/6 × DBA/2) F1 hybrid host mice did not inhibit their ability to reject C57BL/6 bone marrow cell grafts, even though there was a loss in host NK cells expressing Ly49 C, I, and H (unpublished observations). This means that many NK cell functions remain intact in mice depleted of NK cell subsets with this mAb.
MCMV Titers in Mice Depleted of 1F8+ NK Cells.
Depletion of the 1F8+ but not the 5E6+ NK cell population before infection with MCMV led to 20–1,000-fold increases in spleen MCMV titers by day 3 or 4 after infection. Five experiments, one with T cell KO mice, are shown in Table , illustrating this important point. Experiment 1 shows the titers in the same mice portrayed in Fig. 7. Here treatment with mAb 1F8 resulted in >100-fold increases in MCMV titers in the spleen and eightfold increases in the liver. Treatment with mAb 5E6 did not significantly elevate spleen titers, confirming our previous report 22. In fact, we previously showed that treatment of mice with mAb 5E6 in combination with mAb to Ly49D or Ly49G2 also did not enhance MCMV titers in comparison to mice treated only with the HBSS vehicle (these experiments also serve as good Ab injection controls; reference 22). In experiment 2, treatment with mAb 1F8 is compared with mAb to NK 1.1, which depletes virtually all NK cells. MCMV titers were slightly but not substantially higher in anti-NK1.1 treated– versus mAb 1F8-treated mice. In experiment 4, mice were inoculated with only 50 μg of mAb 1F8, which still manifested a profound effect, and in experiment 5 T cell KO mice were inoculated with 25 μg of mAb and developed 100-fold increases in spleen titers. In all, a total of seven experiments showed elevated MCMV titers in mAb 1F8-treated mice.
Table 2.
Enhanced MCMV Synthesis on In Vivo Depletion of 1F8+ Cells
| Titer (log10 PFUs per organ) | ||||
|---|---|---|---|---|
| Exp. | Virus | Treatment | Spleen | Liver |
| 1 | MCMV | Control Day 4 | <1.0 ± 0.0 | <2.1 ± 0.2 |
| mAb 5E6 (C/I) | <1.2 ± 0.3 | 2.5 ± 0.2 | ||
| mAb 1F8 (C/I/H) | 4.1 ± 0.5 | 3.5 ± 0.5 | ||
| 2 | MCMV | Control Day 3 | <1.1 ± 0.0 | 3.0 ± 0.4 |
| mAb NK1.1 | 2.9 ± 0.3 | 3.7 ± 0.6 | ||
| mAb 1F8 (C/I/H) | 2.3 ± 1.0 | 3.3 ± 0.7 | ||
| 3 | MCMV | Control Day 4 | <2.3 ± 0.0 | 3.2 ± 0.3 |
| mAb 1F8 (C/I/H) | 4.4 ± 0.6 | 3.9 ± 1.0 | ||
| 4 | MCMV | Control Day 4 | <1.0 ± 0.0 | <2.0 ± 0.0 |
| maB 1F8 (C/I/H) | 3.8 ± 0.2 | 4.2 ± 0.2 | ||
| 5 | MCMV | T cell KO | 1.9 ± 0.9 | <2.7 ± 0.7 |
| T cell plus mAb 1F8 | 3.8 ± 0.4 | 3.2 ± 0.2 | ||
| 6 | Vaccinia | Control Day 4 | <1.0 ± 0.0 | 2.6 ± 0.5 |
| mAb 1F8 (C/I/H) | <1.0 ± 0.0 | 2.5 ± 0.4 | ||
| 7 | LCMV | Control Day 4 | 4.8 ± 0.1 | not done |
| mAb 1F8 (C/I/H | 4.5 ± 0.5 | not done | ||
C57BL/6 mice were treated with mAb in HBSS or HBSS control, infected with virus, and examined for PFUs in spleen or liver 3 or 4 d later. PFUs represent either the titers per whole organ or per half organ, as in some experiments the spleens were cut in half in order to do analyses on the leukocytes. Each experiment had a n = 4 or 5 per group, except for Exp. 5, which used T cell KO mice and n = 3.
The NK-resistant Armstrong strain of LCMV, which replicates poorly in liver, was used in these experiments, and for that reason liver titers were not assessed. The dosage of mAb was 200 μg of mAb 1F8 in each experiment except for experiments 4, where 50 μg was used and 5, where 25 μg was used. mAb 5E6 was used at a concentration of 200 μg. mAb to NK1.1 was used at dose previously determined to deplete NK cell but not CTL activity. Results presented are geometric mean titers, that is the arithmetic averages of the log values. The limits of detection were 1 log10 PFUs in the spleen and 2 log10 PFUs in the liver; these minimum detection values were entered into the calculations when no virus was found, and the (<) designation means that at least one mouse had undetectable viral titers. Exp., experiment.
In each of the seven experiments, elevated pathology was observed in MCMV-infected mice depleted of 1F8+ cells, in comparison to infected, nondepleted controls. Spleens from mAb 1F8-treated mice were smaller in size and had lower cell counts than in MCMV-infected control mice, typical of enhanced MCMV pathology. In three experiments harvested at day 3 after infection, half spleen (the other half was used for viral titrations) leukocyte counts in control-infected mice were 6.6 ± 1.3 × 10⁷ (n = 15), whereas those in infected mAb 1F8-treated mice were 3.8 ± 1.5 × 10⁷ (n = 15), P = .000007, by Student's two-tailed t test. In three experiments harvested at day 4 after infection, (experiments 1, 3, and 4; Table ), half spleen leukocyte counts for infected-control mice were 7.0 ± 1.3 × 10⁷ (n = 13), whereas the counts in mAb 1F8-treated infected mice were 3.2 ± 1.3 × 10⁷ (n = 14), P = .0000002. Infected mice treated with mAb 5E6 (Exp. 1, Table ) did not have reduced leukocyte counts when compared with infected controls. These dramatic and highly significant reductions in spleen leukocyte count in the mAb 1F8-treated mice are consistent with the dramatic elevations in spleen MCMV titers observed in those mice.
Livers from mAb 1F8-treated mice displayed a greater number of white necrotic foci on their surfaces, which is characteristic of severe MCMV infection. Fig. 8 shows liver sections from infected control (A and B) or mAb 1F8-treated (C and D) mice. MCMV-infected control mice tended to have mostly discrete small inflammatory infiltrates around hepatocytes displaying pyknotic nuclei and cell-rounding characteristic of MCMV infection (Fig. 8A and Fig. B). In contrast, large areas of necrosis, particularly near the surface of the liver and easily distinguished by the naked eye, were characteristic of the MCMV infection in mAb 1F8-treated mice (Fig. 8C and Fig. D). Similar increases in pathology have been reported in mice depleted of NK cells with pan NK cell reagents 14 36.
Figure 8.
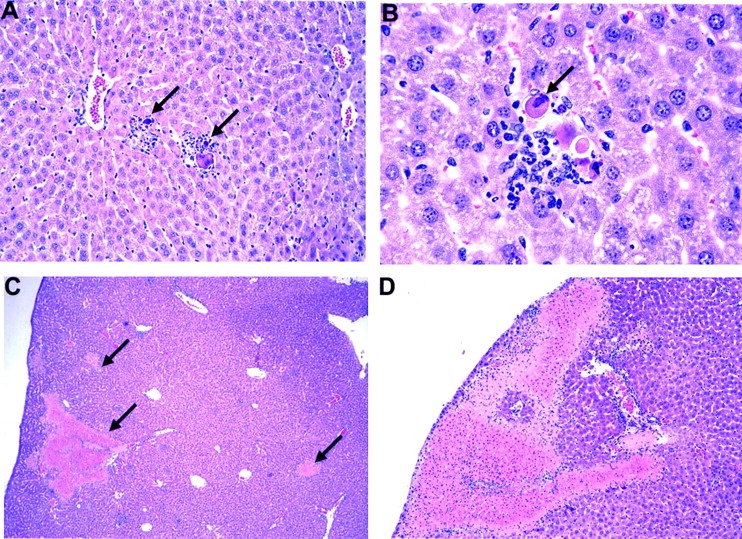
Hematoxylin and eosin staining of MCMV-infected liver sections. (A and B) C57BL/6 liver 4 d after MCMV infection. A, original magnification: 20×; B, original magnification: 60×. Note the discrete inflammatory foci (A) around hepatocytes showing MCMV-induced cytopathology (B). (C and D) Livers from mAb 1F8-treated MCMV-infected mice. Note the absence of discrete inflammatory foci and the presence of large necrotic areas shown by arrows in C and sometimes near the surface (D) of the liver. C, original magnification: 4×; D, original magnification: 10×.
Viral Specificity of the NK Cell Response.
Mice treated with mAb 1F8 were also infected with LCMV or VV as specificity controls and to ensure that the 1F8 mAb (which was column purified) was not contaminated with an antiviral agent or an agent that induces an antiviral effect, such as type I IFN. In contrast to the results with MCMV, this treatment did not elevate the titers of either of those viruses. This is not very surprising, as LCMV is very resistant to NK cells 36, and the sensitivity of VV to NK cells can be obscured by the presence of γδ T cells or by rapid stimulation of memory αβ T cells 24 31. Infectivity studies with these viruses were therefore not continued.
In six experiments with MHV, using virus inoculum doses ranging from 5 × 10⁴ to 106 PFUs, treatment with anti-NK1.1 only led to small increases in the titers of MHV in the liver; average titers in control groups ranged from 3.8 to 4.9 log10 PFUs per organ, and average increase in titer in paired groups treated with anti-NK1.1 was 0.28 ± 0.3. Spleen titers were all <103 PFUs, and in three of six experiments viral titers were beneath the 2 log10 detection limit. For those reasons MHV titers were not examined in mAb 1F8-treated mice.
Ly49 Expression on and Fate of NK/T Cells during the Host Response to Viruses.
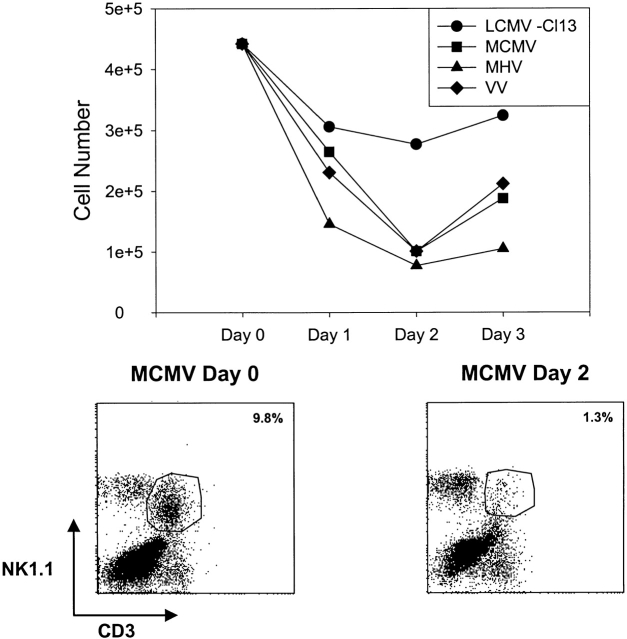
There recently has been considerable interest in the potential role of T cells expressing NKRs in controlling infections and modulating host responses 33 37 38 39. Any experiments done using Abs to NKRs in vivo must be carefully interpreted due to the possibility of reactions with NK/T cells rather than “true” NK cells, which lack CD3 and T cell receptor expression. In the aforementioned experiments, where we examined NK1.1+CD3− NK cell populations, we also routinely monitored the NK1.1+CD3+ NK/T populations. During MCMV infection, the proportions of these NK/T cell populations dropped dramatically in the liver, where they were relatively high before infection (Fig. 9, bottom). Similar drops in percents and total cell numbers of liver NK/T cells were seen with MHV and VV, though less so with LCMV (Fig. 9, top). Thus, while prototypical NK cell numbers were rising dramatically in infection (Fig. 1), NK/T cells were declining dramatically. Few NK/T cells were found in the peritoneal cavity either before or after infection. Although some of this apparent decline could be an artifact due to downmodulation of NK1.1 and CD3, our data, and those of others (R. Brutkiewitz, University of Indiana, personal communication), to be published elsewhere, indicate that this NK/T cell population undergoes apoptosis and declines in number at early stages of infection and under conditions of strong IFN-inducing stimuli.
Figure 9.
Reduction in NK/T cell numbers in livers of virus-infected mice. (Top) This represents the total NK1.1+CD3+ (NK/T) cell numbers isolated from the livers of C57BL/6 mice at different days after infection with either of several viruses. This representative experiment shows data from pooled livers from at least three mice per group. (Bottom) This shows NK1.1+CD3+ liver leukocytes from uninfected control mice (Day 0) and mice 2 d after MCMV infection (Day 2).
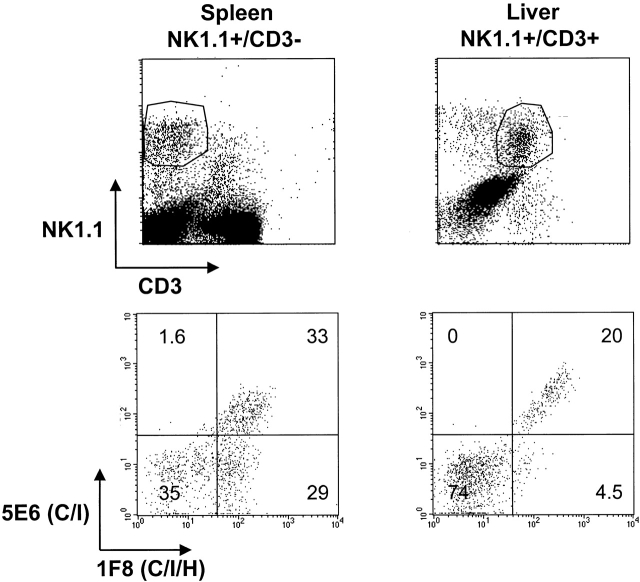
NK1.1+CD3+ (NK/T) lymphocytes were analyzed for coexpression of Ly49 molecules before and after infection. Monitoring Ly49 expression on these populations was sometimes difficult during infection because of high background staining with isotype-control Abs, perhaps due to the fact that many of these cells were undergoing apoptosis. Nevertheless, it was clear that a substantial proportion of the NK/T cells reacted with mAb 5E6 (Ly49 C/I) and mAb 1F8 (Ly49 C/I/H), but very few NK/T cells displayed the Ly49H phenotype of 1F8+5E6−. This pattern was seen in spleen, PECs, and liver from both uninfected and infected mice. Displayed in Fig. 10 are data for NK1.1+CD3− NK cells from uninfected spleens, where there is very little contamination from NK/T cells, and data for NK1.1+CD3+ NK/T cells from uninfected liver, where the highest numbers of NK/T cells are found, making them easier to unambiguously discriminate from prototypical NK cells. This shows that few if any of the NK/T cells have a characteristic Ly49H phenotype and are likely not to express this positively signaling ligand. In general we have noted that some T cells, even those not expressing NK1.1, occasionally stain with Abs to the negatively signaling Ly49 molecules (Ly49 A, C/I, G2) but not to the positively signaling molecules (Ly49 D and H; reference 37). These experiments mean that any viral enhancement effects due to administration of the 1F8 mAb in vivo are likely a consequence of its action on true NK cells, not NK/T cells, as the 5E6 mAb, which has no affect on MCMV replication, should deplete virtually all of the 1F8+ NK/T cells in vivo.
Figure 10.
Low frequency of mAb 1F8+5E6− NK/T cells. Prototypical NK1.1+CD3− NK cells from the spleens of uninfected mice and NK1.1+CD3+ NK/T cells from the livers of uninfected mice (top) were costained with mAb to 1F8 (Ly49C/I/H) or 5E6 (Ly49C/I) (bottom). These leukocyte sources were selected to give the most unambiguous data with the least amount of cellular cross-contamination.
NK/T cells were also monitored for their abilities to spontaneously synthesize IFN-γ at 2 d after infection with MCMV. These NK1.1+CD3+ cells accounted for <5% of the IFN-γ–producing NK1.1+ cells in the spleen, PECs, or liver 2 d after MCMV infection; prototypical NK1.1+CD3− true NK cells accounted for >95% of the IFN-γ production within the NK1.1+ population, and most of the IFN-γ–producing cells within the entire leukocyte population at 2 d after infection were NK cells, e.g., at 2 d after infection, 90% of the total IFN-γ–producing peritoneal lymphocytes were NK1.1+CD3− NK cells. Similar dramatic enrichments in IFN-γ production by the true NK cell population were also noted in LCMV, VV, and MHV infections. Therefore, we conclude that prototypical NK cells are the major IFN-γ–producing cells early in infection and that they are mediating the effects seem with the 1F8 mAb. The experiment showing enhanced MCMV synthesis in mAb 1F8-treated T cell KO mice (Table ) is consistent with this conclusion.
Discussion
This is the first demonstration that the antiviral properties of NK cells in vivo can be mediated by discrete NK cell subsets but not by others. Our results show that the NK cell subsets defined by mAb 1F8 substantially increase at sites of MCMV infection and account for >80% of the IFN-γ–producing cells. mAb depletion of this subset in vivo resulted in substantially higher titers of MCMV (but not LCMV or VV); depletion of no other two or even four Ly49-expressing subsets gave comparable results 22. The importance of different subsets in mediating other NK cell–dependent functions, in particular that of bone marrow allograft rejection, has been shown previously 21 40. The mechanism of NK cell subset recognition of allografts is clarifying, at least in some aspects. NK cell subsets displaying Ly49 receptors that are negatively signaled by MHC class I displayed by the graft are ineffective at mediating rejection. However, recently we have shown that NK cells lacking inhibitory receptors but expressing allo-MHC positive-signaling receptors, such as Ly49D, are most effective at eliciting graft rejection 40. mAb 1F8 cross-reacts between the very closely related Ly49 C, I, and H, but costaining and in vivo depletion experiments with mAb 5E6, which recognizes Ly49C/I, indicated that those reactivities did not account for the efficacy of the Ab. Hence, it is noteworthy that the presence of a positively signaling ligand, Ly49H, may be necessary for anti-viral activity, just as a positive-signaling Ly49 is crucial for bone marrow rejection.
It had not been clear whether NK subset distinctions really mattered in the control of viral infections in vivo. Bone marrow transplants display the types of molecules (class I) known to be ligands for Ly49 molecules and other NKRs, but virus infections are entirely different entities, and viral replication could well be controlled by purely nonspecific inflammatory mechanisms that have nothing to do with NK subsets or NK cell recognition. For instance, relatively nonspecific inflammatory mediators such as type I IFN, TNF-α, IL-2, IL-12, IL-15, and MIP-1α can contribute to the activation and proliferation of NK cells and their infiltration into tissues 41. Those NK cells may be highly cytolytic and be nonspecifically producing copious amounts of IFN-γ, which could control infection without any form of recognition. In fact, it had been suggested that a reason why MCMV but not LCMV is susceptible to NK cells is that MCMV induces more IL-12, which in turn, enables NK cells to produce more IFN-γ 35 41. This hypothesis is challenged by the fact that in mice dually infected with both MCMV and LCMV, only MCMV is controlled by NK cells 42. Alternatively, NK cell subsets could matter, if the virus changes the expression level of MHC class I antigens on infected cells 43, if it qualitatively alters the nature of a class I molecule by the insertion of a virus-encoded peptide 44 45, or if the virus encodes its own class I molecule 46. MCMV indeed does downregulate host MHC expression and does encode a class I molecule, m144; experiments to date, however, have indicated that its class I homologue may make MCMV more resistant, rather than sensitive to NK cells, perhaps by interacting with a negatively signaling NKR 46. The possibility also exists that a virus might encode a surface glycoprotein that directly triggers an NK cell subset, and a substantial amount of work done before the discovery of NKRs had indicated that many purified viral glycoproteins can trigger NK cells 47 48.
A strong indicator that an NK cell subset may be important in a viral infection in vivo has been the mapping of genetic resistance to the Cmv-1 locus, which lies within the NKR region of mouse chromosome 6 somewhere between Ly49D and Prp-1 49. It is therefore possible that the putative Cmv-1 protein is an Ly49 molecule. This locus controls the replication of MCMV mostly in the spleen but less so in the liver 7. NK cells mediate control of MCMV by different mechanisms in these two organs. Replication in the liver is controlled by IFN-γ, whereas replication in the spleen is controlled primarily by a perforin-dependent mechanism, suggesting cytotoxicity 18 19. Our assays in this study focused only on IFN-γ production, but we presume that those 1F8+ NK cells also have cytolytic activity. Indeed, our preliminary data with IFN-γ–deficient mice show that mAb 1F8 dramatically elevates spleen viral titers, consistent with an additional mechanism such as perforin being involved in control of MCMV. Depletion of the 1F8+ subset in normal C57BL/6 mice affected viral titers and enhanced pathology in both spleen and liver, an observation that may be inconsistent with the effects of Cmv-1, which are noted mostly in the spleen. However, the effects on viral titers were much greater in the spleen than in the liver, possibly consistent with the Cmv-1 phenotype. It is ironic that the effects of mAb 1F8 are so profound in the spleen when, if anything, the 1F8+ NK cells appear to be recruited away from the spleen and into other sites of infection. It of course is not clear whether the reductions in viral titers within the spleen are due to NK cells acting within the spleen or to NK cells controlling virus before it can get into the spleen. The relationship between Cmv-1 and the studies presented here is unclear. The Ly49H gene lies slightly outside the area in chromosome six mapped for the Cmv-1 locus 49 50. Thus, it may represent another factor of resistance. However, it remains possible given the complexities of the Ly49 family of related genes that the mapping is not completely accurate or that the 1F8 mAb cross-reacts with another as yet undefined Ly49 molecule mapping within the region where Cmv-1 may lie. Of note is that the influence of Cmv-1 is not strongly dependent on an MHC allotype, as this C57BL/6 (H2b) mouse locus has been bred into a normally sensitive Balb/c (H2d) background and still manifests antiviral activity 51. Balb/c mice do not normally express Ly49H, so it would be interesting to selectively introduce this gene into the Balb/c background and determine whether it promotes resistance to MCMV.
Of all systems studied, MCMV remains, at least in our hands, the virus whose control is most dependent on NK cells. It is noteworthy that three other viruses, LCMV, MHV, and VV, that are less sensitive to control by NK cells also induced substantial infiltrates of 1F8+ NK cells, many of which could be shown to spontaneously produce IFN-γ on direct isolation ex vivo. High levels of IFN-γ production by NK cells in MCMV-infected mice have been linked to the ability of MCMV to induce high levels of IL-12 early in infection 18 35. However, why 1F8+ NK cells are so good at producing IFN-γ after viral infections does not seem to be associated with any selective sensitivity to IL-12, as they are the major IFN-γ–producing cells even in mice lacking IL-12 p40 receptor (unpublished observations). The total number of NK cells and the percent of NK cells producing IFN-γ is lower in IL-12R KO mice, but the 1F8+ cells remain the predominant IFN-γ–producing cell population, accounting for >75% of the IFN-γ–producing cells. It is possible that the positively signaling Ly49H responds to a common property of virus-infected cells or, alternatively, may be primed by positively stimulating ligands in the environment even before virus infection takes place.
Why are these NK cells so important for control of MCMV, but less so for the other viruses? This might relate to the fact that MCMV seemed to provide a much greater IFN-γ–producing stimulus than the other viruses under the conditions tested, but there is little question that highly active IFN-γ–producing 1F8+ NK cell populations were at the sites of infection of all of those viruses. Either the other viruses are relatively resistant to the antiviral effects of NK cells, or else, in the absence of NK cells, the control of those infections is efficiently compensated for by another effector system providing innate immunity. We now know that VV can be effectively controlled by an early γδ T cell response and by memory αβ T cells cross-reactive with other antigens 24 31. Redundancy in antiviral functions would clearly be to the advantage of the host. The mechanism of the unique susceptibility of MCMV and perhaps some other herpes viruses to control by NK cells is still in need of resolution.
Acknowledgments
We thank Hong Chen and Isabel Joris for assistance with the histology, and Susan Stepp for sharing preliminary data.
This work was supported by National Institutes of Health research grants CA36922 to M. Bennett and CA34461 to R.M. Welsh. The contents are solely the responsibility of the authors and do not necessarily represent the official views of the National Cancer Institute of the National Institutes of Health.
Note Added in Proof: Two recent publications (Nat. Genet. 2001. 28:42–45 and Science. 2001. 292:934–937) have concluded that Ly49H may be Cmv-1.
Footnotes
Abbreviations used in this paper: KO, knockout; LCMV, lymphocytic choriomeningitis virus; MCMV, murine cytomegalovirus; MHV, mouse hepatitis virus; NKR, NK cell receptor; PEC, peritoneal exudate cell; PFU, plaque-forming unit; VV, vaccinia virus.
References
- Tay C.-H., Szomolanyi-Tsuda E., Welsh R.M. Control of infections by NK cells. Curr. Top. Microbiol. Immunol. 1998;230:193–220. doi: 10.1007/978-3-642-46859-9_12. [DOI] [PubMed] [Google Scholar]
- Lanier L.L. NK cell receptors. Annu. Rev. Immunol. 1998;16:359–393. doi: 10.1146/annurev.immunol.16.1.359. [DOI] [PubMed] [Google Scholar]
- Yokoyama W.M. What goes up must come downthe emerging spectrum of inhibitory receptors. J. Exp. Med. 1997;186:1803–1808. doi: 10.1084/jem.186.11.1803. [DOI] [PMC free article] [PubMed] [Google Scholar]
- Gosselin P., Mason L.H., Willette-Brown J., Ortaldo J.R., McVicar D.W., Anderson S.K. Induction of DAP12 phosphorylation, calcium mobilization, and cytokine secretion by Ly49H. J. Leuk. Biol. 1999;66:165–171. doi: 10.1002/jlb.66.1.165. [DOI] [PubMed] [Google Scholar]
- Yokoyama W.M., Ryan J.C., Hunter J.J., Smith H.R.C., Stark M., Seaman W.E. DNA cloning of mouse NKR-1 and genetic linkage with Ly-49. Identification of a natural killer gene complex on mouse chromosome 6. J. Immunol. 1991;147:3229–3236. [PubMed] [Google Scholar]
- Karlhofer F.M., Ribaudo R.K., Yokoyama W.M. MHC class I alloantigen specificity of Ly-49+ IL-2-activated natural killer cells. Nature. 1992;358:66–70. doi: 10.1038/358066a0. [DOI] [PubMed] [Google Scholar]
- Scalzo A.A., Fitzgerald N.A., Simmons A., La Vista A.B., Shellam G.R. Cmv-1, a genetic locus that controls murine cytomegalovirus replication in the spleen. J. Exp. Med. 1990;171:1469–1483. doi: 10.1084/jem.171.5.1469. [DOI] [PMC free article] [PubMed] [Google Scholar]
- Boos J., Wheelock E.F. Correlation of survival from MCMV infection with spleen cell responsiveness to concanavalin A. Proc. Soc. Exp. Biol. Med. 1971;149:443–446. doi: 10.3181/00379727-149-38824. [DOI] [PubMed] [Google Scholar]
- Williams N.S., Kubota A., Bennett M., Kumar V., Takei F. Clonal analysis of NK cell development from bone marrow progenitors in vitroorderly acquisition of receptor gene expression. Eur. J. Immunol. 2000;30:2074–2082. doi: 10.1002/1521-4141(200007)30:7<2074::AID-IMMU2074>3.0.CO;2-#. [DOI] [PubMed] [Google Scholar]
- Bukowski J.F., Warner J.R., Dennert G., Welsh R.M. Adoptive transfer studies demonstrating the antiviral effect of natural killer cells in vivo. J. Exp. Med. 1985;161:40–52. doi: 10.1084/jem.161.1.40. [DOI] [PMC free article] [PubMed] [Google Scholar]
- Bukowski J.F., Yang H., Welsh R.M. Antiviral effect of lymphokine-activated killer cellscharacterization of effector cells mediated prophylaxis. J. Virol. 1988;62:3642–3648. doi: 10.1128/jvi.62.10.3642-3648.1988. [DOI] [PMC free article] [PubMed] [Google Scholar]
- Welsh R.M., O'Donnell C.L., Shultz L.D. Antiviral activity of NK 1.1+ natural killer cells in C57BL/6 scid mice infected with murine cytomegalovirus. Nat. Immunity. 1994;13:239–245. [PubMed] [Google Scholar]
- Welsh R.M., Brubaker J.O., Vargas-Cortes M., O'Donnell C.L. Natural killer (NK) cell response to virus infections in mice with severe combined immunodeficiency. The stimulation of NK cells and the NK cell-dependent control of virus infections occur independently of T and B cell function. J. Exp. Med. 1991;173:1053–1063. doi: 10.1084/jem.173.5.1053. [DOI] [PMC free article] [PubMed] [Google Scholar]
- Bukowski J.F., Woda B.A., Welsh R.M. Pathogenesis of murine cytomegalovirus infection in natural killer cell-depleted mice. J. Virol. 1984;52:119–128. doi: 10.1128/jvi.52.1.119-128.1984. [DOI] [PMC free article] [PubMed] [Google Scholar]
- Welsh R.M., Dundon P.L., Eynon E.E., Brubaker J.O., Koo G.C., O'Donnell C.L. Demonstration of the antiviral role of natural killer cells in vivo with a natural killer cell-specific monoclonal antibody (NK1.1) Nat. Immun. 1990;9:112–120. [PubMed] [Google Scholar]
- Shanley J.D. In vivo administration of monoclonal antibody to NK1.1 antigen of natural killer cellseffect on acute murine cytomegalovirus infection. J. Med. Virol. 1990;30:58–60. doi: 10.1002/jmv.1890300113. [DOI] [PubMed] [Google Scholar]
- Shellam G.R., Allan J.E., Papadimitriou J.M., Bancroft G.J. Increased susceptibility to cytomegalovirus infection in beige mutant mice. Proc. Natl. Acad. Sci. USA. 2000;78:5104–5108. doi: 10.1073/pnas.78.8.5104. [DOI] [PMC free article] [PubMed] [Google Scholar]
- Orange J.S., Wang B., Terhorst C., Biron C.A. Requirement for natural killer cell-produced interferon γ in defense against murine cytomegalovirus infection and enhancement of this defense pathway by interleukin 12 administration. J. Exp. Med. 1995;182:1045–1056. doi: 10.1084/jem.182.4.1045. [DOI] [PMC free article] [PubMed] [Google Scholar]
- Tay C.H., Welsh R.M. Distinct organ-dependent mechanisms for the control of murine cytomegalovirus infection by natural killer cells. J. Virol. 1997;71:267–275. doi: 10.1128/jvi.71.1.267-275.1997. [DOI] [PMC free article] [PubMed] [Google Scholar]
- Salazar-Mather T.P., Orange J.S., Biron C.A. Early murine cytomegalovirus (MCMV) infection induces liver natural killer (NK) cell inflammation and protection through macrophage inflammatory protein 1α (MIP-1α)-dependent pathways. J. Exp. Med. 1998;187:1–14. doi: 10.1084/jem.187.1.1. [DOI] [PMC free article] [PubMed] [Google Scholar]
- Yu L.Y.Y., George T., Dorfman J.R., Roland J., Kumar V., Bennett M. The role of Ly49A and 5E6 (Ly49C) molecules in hybrid resistance mediated by murine natural killer cells against normal T cell blasts. Immunity. 1996;4:67–76. doi: 10.1016/s1074-7613(00)80299-x. [DOI] [PubMed] [Google Scholar]
- Tay C.H., Yu L.Y.Y., Kumar V., Mason L., Ortaldo J.R., Welsh R.M. The role of LY49 natural killer cell subsets in the regulation of murine cytomegalovirus infections. J. Immunol. 1999;162:718–726. [PubMed] [Google Scholar]
- Ahmed R., Salmi A., Butler L.D., Chiller J.M., Oldstone M.B.A. Selection of genetic variants of lymphocytic choriomeningitis virus in spleens of persistently infected micerole in suppression of cytotoxic T lymphocyte response and viral persistence. J. Exp. Med. 1984;160:521–540. doi: 10.1084/jem.160.2.521. [DOI] [PMC free article] [PubMed] [Google Scholar]
- Selin L.K., Varga S.M., Wong I.C., Welsh R.M. Protective heterologous antiviral immunity and enhanced immunopathogenesis mediated by memory T cell populations. J. Exp. Med. 1998;188:1705–1715. doi: 10.1084/jem.188.9.1705. [DOI] [PMC free article] [PubMed] [Google Scholar]
- Welsh R.M., Haspel M.V., Parker D.C., Holmes K.V. Natural cytotoxicity against mouse hepatitis virus infected cells. II. A cytotoxic cell with a B lymphocyte phenotype. J. Immunol. 1986;136:1454–1460. [PubMed] [Google Scholar]
- Brennan J., Lemieux S., Freeman J.D., Mager D.L., Takei F. Heterogeneity among Ly-49C natural killer (NK) cellscharacterization of highly related receptors with different functions and expression patterns. J. Exp. Med. 1996;184:2085–2090. doi: 10.1084/jem.184.6.2085. [DOI] [PMC free article] [PubMed] [Google Scholar]
- Smith H.R.C., Chuang H.H., Wang L.L., Salcedo M., Heusel J.W., Yokoyama W.M. Nonstochastic coexpression of activation receptors on murine natural killer cells. J. Exp. Med. 2000;191:1341–1354. doi: 10.1084/jem.191.8.1341. [DOI] [PMC free article] [PubMed] [Google Scholar]
- McIntyre K.W., Welsh R.M. Accumulation of natural killer and cytotoxic T large granular lymphocytes in the livers of virus-infected mice. J. Exp. Med. 1986;164:1667–1681. doi: 10.1084/jem.164.5.1667. [DOI] [PMC free article] [PubMed] [Google Scholar]
- McIntyre K.W., Natuk R.J., Biron C.A., Kase K., Greenberger J., Welsh R.M. Blastogenesis and proliferation of large granular lymphocytes in non-lymphoid organs. J. Leuk. Biol. 1988;43:492–501. doi: 10.1002/jlb.43.6.492. [DOI] [PMC free article] [PubMed] [Google Scholar]
- Natuk R., Welsh R. Accumulation and chemotaxis of natural killer/large granular lymphocytes during virus infection. J. Immunol. 1987;138:877–883. [PubMed] [Google Scholar]
- Selin L.K., Santolucito P.A., Pinto A.K., Szomolanyi-Tsuda E., Welsh R.M. Innate immunity to virusescontrol of vaccinia virus infection by γδ T cells. J. Immunol. 2001;166:6784–6794. doi: 10.4049/jimmunol.166.11.6784. [DOI] [PubMed] [Google Scholar]
- Wang B., Biron C., She J., Higgins K., Sunshine M.J., Lacy E., Lonberg N., Terhorst C. A block in both early T lymphocyte and natural killer cell development in transgenic mice with high-copy numbers of the human CD3E gene. Proc. Natl. Acad. Sci. USA. 1994;91:9402–9406. doi: 10.1073/pnas.91.20.9402. [DOI] [PMC free article] [PubMed] [Google Scholar]
- Slifka M.K., Pagarigan R.R., Whitton J.L. NK markers are expressed on a high percentage of virus-specific CD8+ and CD4+ T cells. J. Immunol. 2000;164:2009–2015. doi: 10.4049/jimmunol.164.4.2009. [DOI] [PubMed] [Google Scholar]
- Magram J., Connaughton S.E., Warrier R.R., Carvajal D.M., Wu C., Ferranta J., Stewart C., Sarmiento U., Faherty D.A., Gately M.K. IL-12-deficient mice are defective in IFNγ production and type 1 cytokine responses. Immunity. 1996;4:471–481. doi: 10.1016/s1074-7613(00)80413-6. [DOI] [PubMed] [Google Scholar]
- Orange J.S., Wolf S.F., Biron C.A. Effects of IL-12 on the response and susceptibility to experimental viral infections. J. Immunol. 1994;152:1253–1264. [PubMed] [Google Scholar]
- Bukowski J.F., Woda B.A., Habu S., Okumura K., Welsh R.M. Natural killer cell depletion enhances virus synthesis and virus induced hepatitis in vivo. J. Immunol. 1983;131:1531–1538. [PubMed] [Google Scholar]
- Peacock C.D., Lin M.Y., Ortaldo J.R., Welsh R.M. The virus-specific and allospecific cytotoxic T lymphocyte response to lymphocytic choriomeningitis virus is modified in a subpopulation of CD8+ T cells co-expressing the inhibitory major histocompatibility complex Class I receptor LY49G2. J. Virol. 2000;74:7032–7038. doi: 10.1128/jvi.74.15.7032-7038.2000. [DOI] [PMC free article] [PubMed] [Google Scholar]
- Zajac A.J., Vance R.E., Held W., Sourdive D.J.D., Altman J.D., Raulet D.H., Ahmed R. Impaired anti-viral T cell responses due to expression of Ly49A inhibitory receptor. J. Immunol. 1999;163:5526–5534. [PubMed] [Google Scholar]
- Kambayashi T., Assarsson E., Michaelsson J., Berglund P., Diehl A.D., Chambers B.J., Ljunggren H.G. Emergence of CD8+ T cells expressing NK cell receptors in influenza A virus-infected mice. J. Immunol. 2000;165:4964–4969. doi: 10.4049/jimmunol.165.9.4964. [DOI] [PubMed] [Google Scholar]
- George T.C., Mason L.H., Ortaldo J.R., Kumar V., Bennett M. Positive recognition of MHC class I molecules by the Ly49D receptor of murine NK cells. J. Immunol. 1999;162:2035–2043. [PubMed] [Google Scholar]
- Biron C.A. Cytokines in the generation of immune responses to, and resolution of virus infection. Curr. Opin. Immunol. 1995;6:530–538. doi: 10.1016/0952-7915(94)90137-6. [DOI] [PubMed] [Google Scholar]
- Bukowski J.F., Welsh R.M. Inability of interferon to protect virus-infected cells against lysis by natural killer (NK) cells correlates with NK cell-mediated antiviral effects in vivo. J. Immunol. 1985;135:3537–3541. [PubMed] [Google Scholar]
- Campbell A.E., Slater J.S. Down-regulation of major histocompatibility complex class I synthesis by murine cytomegalovirus early gene expression. J. Virol. 1994;68:1805–1811. doi: 10.1128/jvi.68.3.1805-1811.1994. [DOI] [PMC free article] [PubMed] [Google Scholar]
- Brutkiewicz R.R., Klaus S.J., Welsh R.M. Window of vulnerability of vaccinia virus-infected cells to natural killer cell-mediated cytolysis correlates with enhanced NK cell triggering and is concomitant with a decrease in H-2 Class I antigen expression. Nat. Immun. 1992;11:203–214. [PubMed] [Google Scholar]
- Long E.O. Regulation of immune responses through inhibitory receptors. Annu. Rev. Immunol. 1999;17:875–904. doi: 10.1146/annurev.immunol.17.1.875. [DOI] [PubMed] [Google Scholar]
- Farrell H.E., Vally H., Lynch D.M., Fleming P., Shellam G.R., Scalzo A.A., Davis-Poynter N.J. Inhibition of natural killer cells by cytomegalovirus MHC class I homologue in vivo. Nature. 1997;386:510–514. doi: 10.1038/386510a0. [DOI] [PubMed] [Google Scholar]
- Casali P., Sissons J.G.P., Buchmeier M.J., Oldstone M.B.A. In vitro generation of human cytotoxic lymphocytes by virus. Viral glycoproteins induce nonspecific cell-mediated cytotoxicity without release of interferon. J. Exp. Med. 1981;154:840–855. doi: 10.1084/jem.154.3.840. [DOI] [PMC free article] [PubMed] [Google Scholar]
- Harfast B., Orvell C., Alsheikhly A., Andersson T., Perl-mann P., Norrby E. The role of viral glycoproteins in mumps virus-dependent lymphocyte-mediated cytotoxicity in vitro. Scand. J. Immunol. 1980;11:391–400. doi: 10.1111/j.1365-3083.1980.tb00005.x. [DOI] [PubMed] [Google Scholar]
- Scalzo A.A., Lyons P.A., Fitzgerald N.A., Forbes C.A., Yokoyama W.M., Shellam G.R. Genetic mapping of Cmv-1 in the region of mouse chromosome 6 encoding NK gene complex-associated loci Ly49 and musNKR-P1. Genomics. 1995;27:435–441. doi: 10.1006/geno.1995.1074. [DOI] [PubMed] [Google Scholar]
- Brown M.G., Zhang J., Du Y., Stoll J., Yokoyama W.M., Scalzo A.A. Localization on a physical map of the NKC-linked Cmv-1 locus between Ly49b and Prp gene cluster on mouse chromosome 6. J. Immunol. 1999;163:1991–1999. [PubMed] [Google Scholar]
- Scalzo A.A., Lyons P.A., Fitzgerald N.A., Forbes C.A., Shellam G.R. The BALB.B6-Cmv-1r mousea strain congenic for Cmv-1 and the NK gene complex. Immunogenetics. 1995;41:148–151. doi: 10.1007/BF00182328. [DOI] [PubMed] [Google Scholar]


