

Abstract
Macrophage activation determines the outcome of infection by Mycobacterium tuberculosis (Mtb). Interferon-γ (IFN-γ) activates macrophages by driving Janus tyrosine kinase (JAK)/signal transducer and activator of transcription–dependent induction of transcription and PKR-dependent suppression of translation. Microarray-based experiments reported here enlarge this picture. Exposure to IFN-γ and/or Mtb led to altered expression of 25% of the monitored genome in macrophages. The number of genes suppressed by IFN-γ exceeded the number of genes induced, and much of the suppression was transcriptional. Five times as many genes related to immunity and inflammation were induced than suppressed. Mtb mimicked or synergized with IFN-γ more than antagonized its actions. Phagocytosis of nonviable Mtb or polystyrene beads affected many genes, but the transcriptional signature of macrophages infected with viable Mtb was distinct. Studies involving macrophages deficient in inducible nitric oxide synthase and/or phagocyte oxidase revealed that these two antimicrobial enzymes help orchestrate the profound transcriptional remodeling that underlies macrophage activation.
Keywords: gene expression, microarray analysis, macrophage activation, innate immunity, phagocytosis
Introduction
Mycobacterium tuberculosis (Mtb) is one of the most successful pathogens of human hosts, judging by the infectious dose (1–10 inhaled organisms), proportion of the species infected (about one-third), duration of infection (lifelong), incidence of death (the most for any one bacterium), and induction of pathology that promotes dissemination (liquefaction of lung and provocation of cough to generate infectious aerosols). In the host, the tubercle bacillus dwells chiefly within macrophages. The activation state of macrophages determines whether Mtb proliferates or lies dormant. Mtb initially encounters “resting” macrophages, in which it is thought to replicate with little restriction for several weeks, leading to spread through the blood and uptake into macrophages throughout the body. With the onset of cell-mediated immunity, macrophages acquire the capacity to kill most of the bacteria and restrict the replication of the remainder, usually for the lifetime of the host. IFN-γ, the principal macrophage activating factor 1 2, is required in vivo for macrophages to attain a tuberculostatic or tuberculocidal state, as judged by the exuberant growth and early lethality of mycobacteria in mice 3 4 and people 5 who are deficient in IFN-γ or its receptor. Moreover, administration of recombinant IFN-γ in vivo activates macrophages in mice 6 and humans 7 and confers clinically significant antimycobacterial effects 8 9.
The IFN-γ receptor signals through associated Janus tyrosine kinases (JAK)that phosphorylate the receptor and signal transducer and activator of transcription (STAT)-1 recruited to the receptor 10. Phosphorylated STAT-1 homodimerizes, moves to the nucleus, and activates GAS-containing promoters 11. A second facet of the action of IFN-γ is suppression of the synthesis of many proteins 12 via protein kinase R–dependent phosphorylation of eukaryotic initiation factor 2 13, rendering the cytosol inimical to viral replication. Signal transduction in macrophages responding to Mtb involves Toll-like receptor 2 14 recruiting the adaptor protein MyD88, which binds IL-1 receptor-associated kinase, leading via a phosphorylation cascade to the activation of NF-κB 15. All three of these signaling scenarios are based on protein-protein relays. They stand as paradigms for how signal transduction can achieve specificity without small, diffusible molecules as messengers 11 16.
Among the genes induced by IFN-γ is the Ca2+-independent nitric oxide (NO) synthase (iNOS; NOS2; reference 17). Expression of iNOS is essential for control of several experimental infections 18. IFN-γ also induces the phagocyte oxidase (phox; reference 1), the major source of reactive oxygen intermediates (ROI) in macrophages. To date, iNOS and phox are the only enzymes known in tissue macrophages whose products have antimicrobial activity in vitro and that provide essential, nonredundant protection against infectious disease in vivo 18, although other macrophage antimicrobial mechanisms exist 19. In addition, iNOS and phox play an essential, mutually redundant role in host defense against a variety of commensal organisms 19. With respect to experimental tuberculosis, iNOS 20 but not phox 18 is required for host survival.
This study used high-density oligonucleotide arrays to analyze gene expression in primary macrophages derived from wild-type (wt) mice and mice selectively deficient in iNOS, phox, or both as the macrophages encountered IFN-γ, live Mtb, killed Mtb, inert polystyrene particles, or combinations of these stimuli. The observed results markedly enlarge our views of transcriptional remodeling and the signal transduction that brings it about, as macrophages respond to a major infectious challenge.
Materials and Methods
Activation and Infection of Macrophages
wt macrophages were collected in four independent experiments with 8–10-wk-old C57BL/6 mice and two with C57BL/6 × 129Sv mice (six mice per experiment). Basal levels of gene expression in these two strains differed by ≥1.8-fold in only 24 of 13,029 genes 21. Macrophages were also collected in two independent experiments from iNOS-deficient mice 22, phox91-deficient mice 23, and mice deficient in both enzymes 19, all on the C57BL/6 background, and studied side-by-side with wt macrophages. Marrow cells flushed from femurs differentiated into macrophages over 6–8 d in DMEM containing 0.58 g/liter l-glutamine, 1 mM Na-pyruvate, 10% FBS, 10 mM Hepes buffer, 100 U/ml penicillin G, 100 μg/ml streptomycin, and 20% L929 cell-conditioned medium 24. 48 h before infection, the monolayers were washed with PBS and fresh medium (DMEM, 0.58 g/liter l-glutamine, 1 mM Na-pyruvate, 10% FBS, 10 mM Hepes buffer, and 10% L929 cell-conditioned medium) containing 0 or 100 U/ml recombinant mouse IFN-γ (Genentech). 2 × 10⁵ macrophages per well in 24-well plates or 2 × 10⁷ macrophages in 175 cm2 flasks were infected or not with 106 (plates) or 108 (flasks) CFUs of Mtb from early log phase cultures of a low-passage clinical isolate (strain 1254; American Type Culture Collection 51910).
Assessment of Macrophage Activation
Intracellular Survival of Mtb.
4 h after infection, monolayers were washed twice with PBS to remove extracellular bacteria. Fresh complete medium was added; to wells that had been pretreated with IFN-γ, the cytokine was added again. At 4, 24, 72, and 120 h after infection monolayers were lysed with 0.5% Triton X-100. Serial dilutions were plated on agar plates (Middlebrook 7H11, 10% OADC enrichment; Difco). CFUs were evaluated after 2–3 wk at 37°C. All assays were done with three wells per condition in over three independent experiments.
Release of Reactive Nitrogen Intermediates and H 2 O 2.
Conditioned medium was mixed with an equal volume of Griess's reagent (1% sulfanilamide, 0.1% naphthylethylenediamine dihydrochloride, 2.5% H3PO4). Absorbance at 550 nm was recorded with sodium nitrite as standard. Nitrite content of cell-free medium was subtracted. Separate monolayers in 96-well plates (4 × 10⁴ cells per well) were washed and assayed for the stoichiometric oxidation of scopoletin by H2O2 to a nonfluorescent product 25. Fluorescence was monitored every 30 min for up to 3 h. Cells were then solubilized in 1N NaOH and protein determined 26 to normalize for the amount of cells at the start of the assay.
Nuclear Run Ons
Macrophages were homogenized in cold lysis buffer (3 mM MgCl2, 0.1% Triton X-100, 10 mM TrisHCl, 10 mM NaCl, 0.5 mM DTT, 0.5 mM PMSF, 0.1 M sucrose, pH 8.0). Nuclei were sedimented through a sucrose gradient, suspended in 100 μl storage buffer (5 mM MgCl2, 50 mM Tris, pH 8.0, 0.1 mM EDTA, 40% glycerol) and frozen in liquid N2. For the transcription assay 107 nuclei were thawed and incubated in 10 mM Tris, pH 8.0, 75 mM KCl, 2.5 mM MgCl2, 1 mM DTT, 0.5 mM ATP, 0.25 mM CTP, 0.25 mM GTP, and 125 μCi [32P]UTP (800 Ci/mmol) at 30°C for 30 min. Labeled nascent transcripts were isolated. cDNA probes were immobilized onto nylon membranes. The cDNAs were supplied by colleagues, cloned after reverse transcription (RT)-PCR amplification from macrophages, or purchased from Incyte Genomics with the following I.M.A.G.E. Consortium Clone IDs 27: 2811843 (macrophage mannose receptor); 693354 (preproinsulin-like growth factor); 331263 (platelet factor 4 precursor [prec]); 1294589 (IL-1β); and 1264951 (serum amyloid A-3). Prehybridization was performed at 65°C for 24 h in 50% formamide, 5× Denhardt's solution, 5XSSC, 50 mM phosphate buffer, 0.5% SDS, 5 mM EDTA, and 250 μg/ml denatured salmon sperm DNA (Ambion). Hybridization (65°C, 48 h) used equal cpm/ml of labeled RNA for each treatment in 20 mM Tris, pH 7.5, 600 mM NaCl, 20 mM EDTA, 1× Denhardt's, 1% Na4P2O7, 1% SDS, and 1 mg/ml tRNA. Membranes were washed twice at RT in 2XSSC and then treated with 100 ng/ml RNaseA (QIAGEN) for 30 min at 37°C in 2XSSC. Membranes were washed for 30 min each at 50°C in 2XSSC, 0.1% SDS and 0.1XSSC, 0.1% SDS, then in 2XSSC at RT for 5 min, and exposed to film.
Array Hybridization
24 h after infection monolayers were lysed with Trizol (GIBCO BRL) and total RNA isolated. After treatment with DNase I (Ambion) and purification (QIAGEN RNAeasy) RNA (2–3 ug) was reverse transcribed (Superscript II; GIBCO BRL) with a T7-polyT primer and cDNA transcribed in the presence of biotinylated UTP and CTP (Enzo). Hybridization to GeneChip oligonucleotide arrays (Mu11KsubA, B) and scanning (Gene-Array Scanner) followed Affymetrix protocols.
Data Processing
Normalization.
For each 16- or 20-membered probe set, fluorescence values were collected for tiled 25-mer oligonucleotides perfectly matched to the target sequence, and for corresponding 25-mers singly mismatched at the central base. The latter values were subtracted from the former and the differences averaged (Ave Diff). The mean Ave Diff for all probe sets on each chip was determined after excluding negative values for Ave Diff as well as the highest and lowest 2% of positive values. Each Ave Diff was scaled for a given chip by dividing the target intensity by that chip's average Ave Diff. Scaled Ave Diffs were log (base e) transformed and averaged for replicates, effectively taking geometric means, denoted by brackets < >.
Detection of Outliers.
For the baseline and treatments that were replicated six times (application of IFN-γ, Mtb, or both to wt macrophages), we filtered outliers by an approach suited for relatively small data sets 28, as follows. We calculated the lower fourth, F_L, and the upper fourth, F_U, both of which are a form of quartile. From these “quartiles” we calculated the fourth spread, d_F = F_U − F_L. Then the upper cut-off for outliers was F_U + 1.5d_F and the lower cut-off was F_L − 1.5d_F. Outliers were flagged so that they may be inspected further. We calculated averages and SDs of the remaining replicated data points.
Noise Analysis.
We used the noise, Q, calculated by the Affymetrix software for each probe array, where 2Q ∼1 SD of background intensities, to calculate the scaled average noise for each set of replicates, <Q>. Averaging scaled replicates can be viewed as effectively scaling and averaging the original image files into one averaged image file with a Q-eff ∼<Q>/(n)1/2 where n is the number of replicates. Consequently, for “treatments” with two replicates (exposure of wt macrophages to heat-killed Mtb ± IFN-γ or to latex particles ± IFN-γ; or use of cells from knockout mice), we designated a replicated set of probes as being within the noise if the geometric mean of the set was <2 SD of background or 4<Q>. For treatments with six replicates, where the effective noise distribution was narrower, we simply used a noise cutoff of 2<Q>. Probe sets with one value (baseline or treated) in the noise are starred in the tables and figures. Numerically, the starred ratios are underestimates, since the actual value of the term represented as the denominator was lower than the assigned limit value, and imprecise, since the actual value of the denominator could vary widely. Biologically, the starred values may be exaggerated, since the limit of assay sensitivity may account for expression of the gene falling into the undetectable zone.
Statistical Analysis and Calculation of Fold Change
In the cases with six replicates for baseline and treatment, we performed a Student's t test (two-tailed) for each gene and calculated the P value using the R programming environment (http://www.R-project.org/) where it is not assumed that the SDs of the baseline and treatment replicates were the same. A gene was considered “regulated” compared with the baseline if P ≤ 0.05 and >40% of the probe pairs in the probe set hybridized with significantly higher intensity in the matched probe than in the mismatched probe (positive fraction [PF] > 0.4). The PF criterion was used to weed out signals that while consistent, likely arose from cross-hybridization; its application reduced the apparent number of regulated genes in wt cells by 15%. Where there were six replicates for the baseline and two for the treatment, we calculated a 99.5% confidence interval for the baseline mean and required that both treatment values either lie above the upper confidence limit or below the lower confidence limit and that PF > 0.4 for that gene to be considered regulated. We used the t-distribution to calculate the confidence interval, which for six replicates corresponds to the mean ± 1.95 SD. When both the baseline and treatment geometric means were in the noise, we classified that gene as unregulated and assigned it a fold change of 1. If the baseline was in the noise and the treatment was above the noise or vice versa, we replaced the geometric mean of the noisy value by 1.4<Q> and 2.8<Q> for six and two replicates, respectively (i.e., the tail of the noise distribution). We took an average of the SD/mean for genes within the noise and multiplied this by 1.4<Q> and 2.8<Q> for six and two replicates respectively to arrive at an estimate of the SD of a typical noisy gene. Since ∼20% of the Ave Diff values were negative, variation in intensities due to noise would otherwise be effectively lost for many probe sets. This approach also ensured that a value must be significantly above the noise to be considered regulated. We calculated the log of the fold change by subtracting the average of the log transformed treatment Ave Diff values from that of the baseline Ave Diff values. Thus, the fold change corresponds to the ratio of the geometric mean of the treatment Ave Diff values divided by the geometric mean of the baseline Ave Diff values (for primary data, see online supplemental material at http://arrays.rockefeller.edu/murtb/).
Results
Functional Evidence of Macrophage Activation.
By biochemical and functional criteria, the combination of IFN-γ and Mtb fully activated bone marrow–derived macrophages from wt mice. The cells produced NO2 −, an oxidation product of NO, and H2O2, a reduction product of superoxide, and they killed Mtb. In contrast, nonactivated macrophages produced much less NO2 − and H2O2 and exerted a bacteriostatic effect. IFN-γ–treated bone marrow–derived macrophages from iNOS-deficient mice failed to produce NO2 − but had a supranormal respiratory burst, like peritoneal macrophages from these mice 22, and only restricted the growth of Mtb without killing the pathogen. IFN-γ–treated phox-deficient macrophages failed to produce H2O2 but released NO2 − normally and did kill Mtb. Doubly deficient macrophages (NOS2−/− gp91phox−/−) released neither NO2 − nor H2O2 and were bacteriostatic (Fig. 1). Thus, as in human macrophages 14, mycobacteriostasis did not require iNOS, nor did mycobacteriostasis require phox. In contrast, mycobactericidal activity was iNOS dependent. Macrophages prepared under the same conditions as in Fig. 1 provided the RNA used for microarray analysis.
Figure 1.

Functional and biochemical criteria for activation of macrophages from wt, phox-deficient, iNOS-deficient, and doubly deficient mice by IFN-γ and Mtb. (A) Control of viability of intracellular Mtb. (B) Respiratory burst triggered by phorbol myristate acetate (100 ng/ml), a surrogate for ingested bacteria. (C) Secretion of NO2 −, an accumulating oxidation product of NO. Bars are depicted in the following order: no stimulus; IFN-γ; Mtb; and IFN-γ plus Mtb. Data are means ± SD of triplicates in one experiement representative of three to five.
A Statistical Definition of Gene Regulation based on Experimental Reproducibility.
The high-density oligonucleotide arrays used in this study reported the expression status of 10,703 probe sets based on cDNAs and ESTs, a representation of perhaps one-fourth to one-third of the mouse genome. For simplicity of discussion, we treat each probe set as if it represents a different gene, since the extent of overlap of ESTs with genes cannot be fully evaluated until sequencing of the mouse genome is completed. No function-based selection was applied in collecting genes for this representation. In untreated wt macrophages, 60% of the monitored genome appeared to be transcribed based on the noise threshold and positive fraction criterion we used. Because a substantial subset of the genome was represented on the array, the represented genes were selected in an unbiased manner and a large proportion of these genes was transcribed, we have assumed that the expression data provide a representative picture of the macrophage transcriptome.
To determine whether expression of a given gene was regulated in macrophages after exposure to IFN-γ and/or ingestion of Mtb, we chose a statistical criterion based on reproducibility. Reproducibility was taken to be a composite of all three major sources of variability, biological, experimental, and technical, in six independently replicated experiments with wt mice. Student's t test was used to assess the significance of the hypothesis that expression of a given gene differed after treatment. Below, genes whose expression was altered with P ≤ 0.05 are termed “regulated” without implying that their response was direct or indirect or that the mechanism was transcriptional.
Fold-change criteria are used to detect regulated genes more often than Student's t-tests. The two approaches have been compared in bacteria 29. We began by comparing the two analytic approaches in macrophages (Fig. 2). For clarity, genes with fold change >20 are not shown. The statistical approach generated a list of regulated genes that differed markedly in number and nature from all lists that could be generated by application of any fold-change cut-off. For example, for cells treated with IFN-γ plus Mtb (bottom), the application of a conventional fold-change cut-off of 2 would designate 667 genes as regulated whose induction or suppression by greater than or equal to twofold was not statistically significant (black bars in right panels). Conversely, a twofold cut-off would describe 1,139 genes as unregulated whose change in expression by greater than or equal to twofold was statistically significant (black bars in left panels). While statistical significance need not imply biological significance, others have attributed biological significance to changes in expression of some eukaryotic genes as low as 1.1-fold 30.
Figure 2.

Criteria for gene regulation: reproducibility compared with fold-change cut-off. The histograms bin genes according to the fold change in their expression in response to IFN-γ, Mtb, or both. Suppression (fold change <1) is represented as the negative inverse. Genes with fold change >20 or <(−)20 are omitted. P values were determined separately for each gene based on replication of results for that gene in six independent experiments. The left column tallies genes whose expression changed with P ≤ 0.05. The right column tallies genes whose expression changed (or not) with P > 0.05. Bars are black or white according to the twofold cut-off criterion typically used to identify regulated genes in microarray experiments that have been performed once or twice, but calculated here for 6 experiments. Black bars indicate genes that would be miscounted by this fold-change cut-off.
Gene Induction and Suppression in Response to IFN-γ and/or Mtb.
1,299 genes were responsive to IFN-γ, 678 to Mtb, and 1,976 to their combination. Counting individual genes only once if they responded to more than one treatment produced a nonredundant tally of 2,664 regulated genes. This suggested that 25% of the monitored genome was redirected in response to one or both of these stimuli, corresponding to ∼40% of the monitored transcriptome with the computational parameters used.
As shown in Fig. 3, the sets of genes regulated individually by IFN-γ and Mtb overlapped. However, to a greater extent, the genes regulated by IFN-γ were distinct from those regulated by Mtb. The greatest number of genes was regulated only by the combination of IFN-γ and Mtb, demonstrating an unanticipated extent of synergy between cytokine and bacillus.
Figure 3.
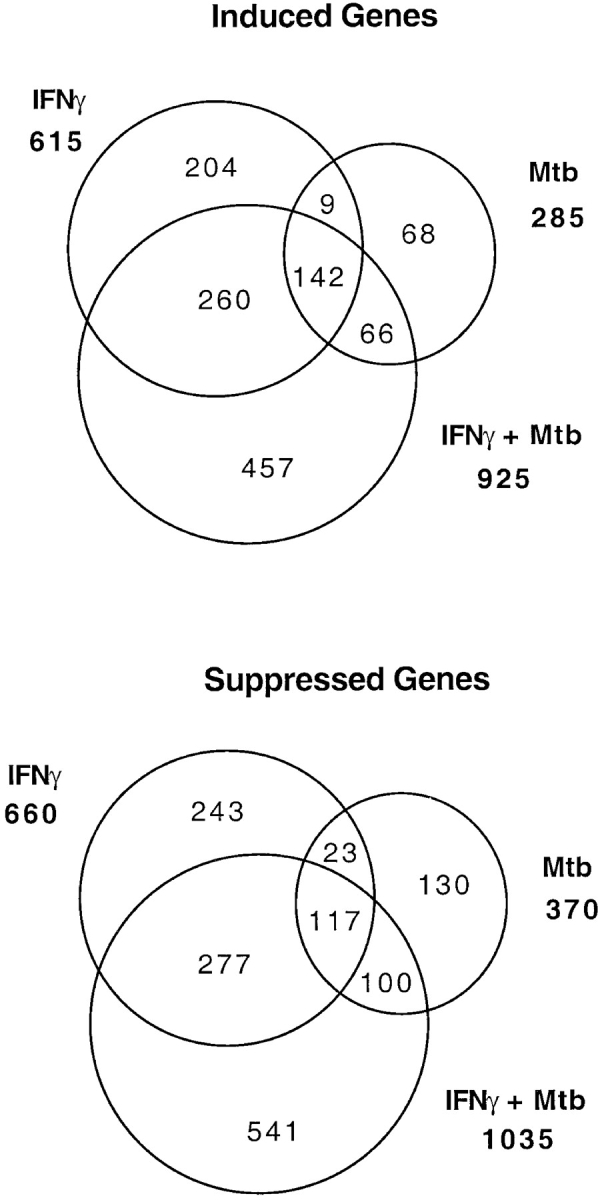
Extensive gene regulation in wt macrophages by IFN-γ and Mtb: extent of synergy. Numbers in bold face to the sides of the Venn diagrams report the total number of genes induced or suppressed (P ≤ 0.05) by IFN-γ, Mtb, or their combination. Numbers within the sectors tally the genes regulated uniquely or in common by these stimuli. The largest subsets of regulated genes were those that were only induced or suppressed by IFN-γ and Mtb acting synergistically. Instances in which IFN-γ and Mtb had opposite effects are omitted for clarity.
Equally surprising, IFN-γ, which has been considered almost exclusively a transcriptional inducer, led to suppression of more genes than it induced. The ratio of induced:suppressed genes was 49:51 for IFN-γ, 43:57 for Mtb, and 47:53 for IFN-γ plus Mtb. We considered that the appearance of a suppressive effect on many genes might be a numerical artifact arising from the application to the chips of equal amounts of mRNA, among which some transcripts were increased in abundance, diluting the rest. This concern could be rejected, because 70–90% of transcripts did not change significantly in concentration with the three treatments. If increased expression of some transcripts imposed an important compensatory dilution on the others, this would be manifest by a relatively small and proportionally equivalent reduction in abundance of all the other mRNAs, not a large reduction in a few.
Although there was near symmetry in the number of genes whose expression was increased and the number whose expression was suppressed, genes were asymmetrically distributed by functional category. Based on our current understanding of functional attributes of the genes represented on the array, genes directly related to immunity and inflammation comprised 31% of the subset induced by IFN-γ as the sole stimulus, but they constituted only 7% of the subset suppressed by IFN-γ. Results were similar for Mtb as sole stimulus (32 and 6%, respectively) and for IFN-γ plus Mtb in combination (25 and 4%). Overall, genes responsive to IFN-γ and/or Mtb were fivefold more likely to be induced than suppressed when they were identifiable as involved in immunity and inflammation.
As shown in Fig. 4, the more markedly the expression of a given gene was altered by IFN-γ and/or Mtb, the greater the likelihood that the gene was functionally related to immunity and inflammation. This relationship held not only for the majority of immunity- and inflammation-related genes that were induced, but also for the minority of such genes that were suppressed.
Figure 4.

Genes directly related to inflammation or immunity are overrepresented among induced genes and among highly regulated genes. Genes regulated (P ≤ 0.05) in response to the stimuli named at the top of each graph were classified according to whether their products are directly related to immunity and inflammation (e.g., cytokines, chemokines, and metalloelastases versus ribosomal proteins, homeobox factors, and unannotated sequences), then binned according to the fold change in their expression. Black circles correspond to genes with fold change values >1. White squares indicate genes with fold change values <1 (suppression), represented as the inverse.
Fig. 5 illustrates these points for the 10 genes most strongly responsive to IFN-γ, to Mtb, or to their combination.
Figure 5.

Ten most highly induced and suppressed genes in wt macrophages responding to IFN-γ, Mtb, or both. Genes directly related to inflammation and immunity are depicted by black bars, others by white bars. Suppression (fold change <1) is represented as the negative inverse on a linear scale, while induction is shown on a log scale. Probe sets with one value (baseline or treated) in the noise are starred. Online supplemental material (http://arrays.rockefeller. edu/murtb/) supplies Genbank accession numbers.
Candidate Genes for Pathophysiological Involvement.
Among the highly responsive genes were many that are plausibly related to the pathogenesis of tuberculosis. The examples in Table illustrate that Mtb did not so often antagonize the actions of IFN-γ as mimic them (induce a change in the same direction) or synergize with them (fold change in response to the combination of IFN-γ plus Mtb more than the sum of fold changes in response to each stimulus alone). Synergistic induction was striking for iNOS and the chemokines MIG and RANTES.
Table 1.
Genes Regulated in Response to IFN-γ and Mtb in wt Macrophages: Examples with Potential Relevance to Tuberculosis
| Family | Gene product | Expression: fold-change in response to | ||
|---|---|---|---|---|
| IFN-γ | Mtb | IFN-γ plus Mtb | ||
| iNOS | iNOS | 28 | ns | 423 |
| GTPases | IGTP | 24 | 4.0 | 27 |
| Irg-47 | 7.1 | ns | 6.5 | |
| LRG-47 | 3.6 | 2.0 | 3.7 | |
| GBP2 | 127 | 5.5 | 146 | |
| Protease inhibitor | secretory leukocyte protease inhibitor | ns | 21 | 43 |
| Chemokines | MIG | 223 | ns | 432 |
| RANTES | 137 | 20 | 322 | |
| IP-10 | 32 | 5.7 | 83 | |
| KC | ns | ns | 20 | |
| JE | ns | 6.3 | 17 | |
| MIP2 | 0.5 | 12 | 12 | |
| MCP-5 prec | 5.7 | 5.1 | 8.8 | |
| MIP-1β | ns | 2.1 | 2.0 | |
| MIP-1α | ns | 2.0 | 2.0 | |
| C10-like chemokine | 0.16 | 1.9 | 0.27 | |
| platelet factor 4 prec | 0.04 | ns | 0.05 | |
| Chemokine receptors | CC CKR1 | 3.6 | 3.7 | 8.3 |
| putative β chemokine receptor (E01) | ns | ns | 7.1 | |
| β CKR-5 | 6.9 | ns | 4.5 | |
| CXCR4 | 0.22 | ns | 0.15 | |
CKR, chemokine receptor; LRG-47, large G protein–related protein of 47 kDa; MCP, monocyte chemoattractant protein; MIP, macrophage inflammatory protein; ns, regulation not statistically significant.
IGTP, a 47-kD IFN-γ–induced GTPase, controls the ability of the mouse to survive infection by Toxoplasma gondii 31 and GBP-1, a related protein, has antiviral activity 32. In the present experiments, four members of the high-Mr GTPase family were induced by IFN-γ, and three of these were also induced by Mtb. GBP-2 was the most responsive. It will be of interest to study the course of tuberculosis in mice in which GBP-2 and other members of the high-Mr GTPase family are disrupted.
We were surprised to find marked upregulation of secretory leukocyte protease inhibitor (SLPI), a product of epithelial cells and phagocytes that is present in blood and bronchial secretions. IFN-γ does not induce the expression of this protease inhibitor in peritoneal macrophages 33, a finding extended here to bone marrow–derived macrophages. However, Mtb induced SLPI gene expression by 21-fold, and the combination of IFN-γ and Mtb induced it by 43-fold. Because SLPI has antiinflammatory 33 and antibacterial effects 34, we will investigate the course of tuberculosis in SLPI-deficient mice 35.
Of the >60 known chemokine and chemokine receptor genes, expression of at least 15 responded to IFN-γ and/or Mtb. These did not fall into a recognizable subset. Nonetheless, the prominent responsiveness of chemokine-related genes suggests that a profound impact on immune and inflammatory cell migration and activation may be both exerted by and perceived by IFN-γ–activated, Mtb-infected macrophages. In particular, the massive induction of MIG, RANTES, and γ-IP-10 may contribute to the formation of granulomas, a histologic hallmark of tuberculosis 36.
Confirmation of Transcriptional Suppression and Stimulation.
IFN-γ has only occasionally been reported to induce transcriptional suppression 37 38. However, investigators studying the impact of IFN-γ on individual genes focused mostly on those that were immunity related. In this study, where potential targets of IFN-γ were unselected among the genes interrogated by the microarrays, we found that IFN-γ suppressed the expression of more genes than it induced. To learn whether reduced mRNA levels for many genes seen in IFN-γ–treated cells resulted at least in part from suppression of transcription as opposed to the exclusive acceleration of mRNA degradation, we performed nuclear run-on analysis. Fig. 6 presents examples of genes whose expression increased (five genes), did not significantly change (four genes), or decreased (seven genes) in response to IFN-γ according to microarray analysis. For all 16 genes, transcription rate correlated qualitatively (but not quantitatively) with microarray results. Transcription of IL-1β, TNF, and IL-12 p40 was increased, and their mRNA levels as assessed by microarray were elevated, but because the P values for the latter responses were 0.10–0.19, we classified these genes as nonregulated. Given that microarray and run-on analyses report different phenomena (steady-state mRNA levels and transcription rates, respectively), the qualitative correspondence between the two assays is noteworthy. In sum, transcriptional regulation appeared to play a substantial part in both increased and decreased expression of the many of the genes studied.
Figure 6.

IFN-γ causes both transcriptional induction and suppression. Transcriptional run-ons were performed with nuclei from macrophages that had been treated with 0 or 100 U/ml IFN-γ for 48 h. Fold-change results by microarray analysis are indicated. Genes were selected based on high signal intensity on microarrays. Plasmid DNA (pBR322) served as a control.
Dependence on Viability of Mtb.
The remaining experiments were performed to learn more about the stimulatory characteristics of Mtb and the pathways mediating macrophage responses. We first asked whether the effects of Mtb on gene expression required that the bacteria be viable. Mtb that had been heated to 80°C for 60 min lost replicative potential on agar and were considered killed. Heat-killed Mtb as sole stimulus led to the response of 65% as many genes as viable Mtb. Polystyrene latex beads (3 μm diameter, added in a 4:1 ratio, beads:macrophages) triggered regulation of 32% as many genes as viable Mtb. Thus, numerically speaking, some of the impact of Mtb might be attributable to the act of phagocytosis, some to features of the organism not shared by latex beads but preserved in dead bacilli, and some to molecules produced or released only by living bacteria.
When the identity of the regulated genes was taken into account, it became apparent that the transcriptional response to viable Mtb was distinctive. That is, the individual genes responsive to ingestion of viable Mtb, heat-killed Mtb, and latex particles belonged to extensively noncongruent sets (Fig. 7). Table gives examples of genes uniquely induced or suppressed by one of the particulate stimuli, as well as examples of genes collectively induced or suppressed by all three of them. Many of these effects are potentially relevant to the pathophysiology of tuberculosis. For example, only viable Mtb induced IGTP, which appears to play a role in antimicrobial activity. Only viable Mtb induced JAK-binding protein/suppressor of cytokine synthesis 1, which blocks the JAK–STAT pathway. Moreover, viable Mtb avoided inducing phox and C/EBP-β, a transcription factor that controls an unidentified antimicrobial mechanism 39, even though heat-killed Mtb induced both. In the presence of IFN-γ, all three particles served as a costimulus for the massive (172–670-fold) induction of iNOS, prostaglandin synthase, and chemokines MIG and RANTES. All three particles also helped IFN-γ induce CD1, which presents mycobacterial lipids to T cells, and CD40, through which T cells can activate macrophages independently of IFN-γ.
Figure 7.

Differential regulation of macrophage gene expression by viable Mtb versus heat-killed Mtb or polystyrene beads. Numbers in bold face to the sides of the Venn diagrams report the total number of genes induced (A and C) or suppressed (B and D) (P ≤ 0.05) by each of the three particles alone (A and B) or in the presence of IFN-γ (C and D). Numbers within the sectors tally the genes regulated uniquely by a given particle or in common with one or both of the others. The largest subsets of regulated genes were those that were only induced or suppressed by viable Mtb alone or with IFN-γ.
Table 2.
Examples of Genes Regulated by Viable Mtb, Heat-killed Mtb, and Polystyrene Particles
| Type of response | Gene product | Impact of IFN-γ (fold change) | Impact of particle(fold change) |
|---|---|---|---|
| Induction only by viable Mtb | MHC class III complement factor B | NA | 11 |
| IFN-induced Mx protein | 9.4 | ||
| Intercrine | 7.7 | ||
| IFN regulatory factor 7 (mirf7) | 6.9 | ||
| JE chemokine | 6.2 | ||
| IP-10 chemokine | 5.7 | ||
| IGTP | 4.0 | ||
| JAK-binding protein (JAB, SOCS1) | 3.5 | ||
| Induction only by heat-killed Mtb | KC chemokine | 96 | |
| ASS | 14 | ||
| Integrin α5 subunit | 13 | ||
| gp91component of phox | 5.1 | ||
| C/EBPβ | 4.5 | ||
| TNF | 4.1 | ||
| HIF-1α | 3.7 | ||
| IL-2 receptor γ | 2.6 | ||
| Antioxidant protein 2 (peroxiredoxin) | 2.5 | ||
| Induction only by polystyrene beads | Annexin III (lipocortin III) | 8.1 | |
| Induction by all three particles | MIP2 chemokine | 43 | |
| Suppression only by heat-killed Mtb | MCP-1 (chemokine) receptor | 0.24 | |
| IFN-α1 | 0.45 | ||
| Suppression only by polystyrene beads | Irg-47 | 0.28 | |
| MAP kinase (ERK-1) | 0.47 | ||
| Suppression by all three particles | CTLA-2β | 0.26 | |
| Induction by the combination of IFN-γ only with viable Mtb | CD44 | 3.7 | 11 |
| Fractalkine (chemokine) | ns | 3.9 | |
| Induction by the combination of IFN-γ only with heat-killed Mtb | IL-12 p40 | ns | 16 |
| HIF-1α | ns | 6.1 | |
| FcγRIIB | ns | 4.0 | |
| Induction by the combination of IFN-γ with any of the particles | MIG (chemokine) | 223 | 670 |
| RANTES | 137 | 578 | |
| NOS2 | 28 | 568 | |
| Prostaglandin synthase | 6.9 | 172 | |
| IP-10 chemokine | 32 | 83 | |
| CD1.1 | 6.6 | 28 | |
| CD40 | 5.6 | 21 | |
| C-C CKR-1 | 3.6 | 18 | |
| Suppression by the combination of IFN-γ only with viable Mtb | Scavenger receptor class B type I | ns | 0.12 |
| Suppression by the combination of IFN-γ only with heat-killed Mtb | Plasma glutathione peroxidase | 0.48 | 0.06 |
CKR, chemokine receptor; HIF, hypoxia-inducible factor; MAP, monocyte activating peptide; MCP, monocyte chemoattractant protein; NA, not applicable; ns, regulation not statistically significant.
Mediation of Stimulation and Suppression by iNOS and/or Phox.
Both reactive nitrogen intermediates (RNI) and ROI can affect cell signaling reactions, including transcriptional responses 40 41 42. However, no such role for either class of small, diffusible, reactive molecules has been described in the signaling reactions mediated by IFN-γ. Nor has the extent of RNI or ROI signaling been assessed at a genomic level. Much of the evidence for signaling by RNI and ROI has rested on the provision of agents that produce RNI or ROI, inhibit their generation, or catabolize them. There has been little use of genetic approaches to probe the contribution of endogenous sources of RNI and ROI as signaling molecules in physiologic circumstances.
Accordingly, we repeated the gene expression analysis described above, simultaneously testing wt macrophages and macrophages genetically deficient in iNOS (one major source of RNI), phox (one major source of ROI), or both. As summarized in Table , deletion of one or both of these antimicrobial enzymes caused 514 genes to be expressed significantly differently in the presence of IFN-γ than the same genes were expressed in wt macrophages. Viewed from another perspective, deletion of iNOS affected the response of 874 genes to IFN-γ and/or Mtb. The impact of phox deficiency was substantial but less marked than iNOS deficiency. Simultaneous deficiency of both enzymes had a less than additive impact (Table ). Altogether, a nonredundant tally indicated that expression of 1,550 genes in the presence of IFN-γ and/or Mtb was dependent on or significantly affected by deficiency of iNOS, phox, or both. This amounts to 58% of the genes regulated by IFN-γ and/or Mtb in wt macrophages. By inference, the transcriptional program of wt macrophages undergoing immunologic activation was substantially shaped by iNOS and phox, directly or indirectly.
Table 3.
Deficiency of iNOS and Phox: Overall Impact on Gene Regulation by IFN-γ and Mtb
| Genes differentially regulatedas a result of deficiency in | Macrophages treated with | Nonredundant totalfor all stimuli | ||
|---|---|---|---|---|
| IFN-γ | Mtb | IFN-γ plus Mtb | ||
| iNOS | 317 | 155 | 441 | 874 |
| phox | 136 | 159 | 220 | 484 |
| iNOS plus phox | 160 | 290 | 319 | 724 |
| Nonredundant total for all knock-out macrophages | 514 | 480 | 718 | 1,550 |
Underlying the net impact of iNOS and/or phox deficiency were examples of the following: (i) genes that responded to IFN-γ and/or Mtb in wt macrophages did not respond in the context of deficiency of iNOS and/or phox; (ii) genes that did not respond to IFN-γ and/or Mtb in wt macrophages did respond in the knockout cells; (iii) genes that IFN-γ and/or Mtb regulated in wt macrophages were induced or suppressed to a greater degree in the face of deficiency of iNOS and/or phox; and (iv) genes that were regulated in wt macrophages in response to IFN-γ and/or Mtb switched polarity in the face of deficiency of iNOS and/or phox (those that had been induced became suppressed, while those that had been suppressed became induced). Because all possible patterns of impact were represented, because many of the effects attributable to iNOS and phox were stimulatory, and because the macrophages remained adherent and morphologically normal while restricting the growth of Mtb, it appears that nonspecific toxicity cannot account for the impact of iNOS and phox on gene expression.
Although many genes responding to IFN-γ were related to immunity and inflammation, the vast majority of the genes whose expression was affected by iNOS and/or phox were not in this category. This may suggest the existence of regulatory mechanisms to insulate most immunity- and inflammation-related genes from the influences of iNOS and phox. Nonetheless, as illustrated in Table , there were genes of pathophysiologic relevance whose full induction by IFN-γ did require iNOS and/or phox. Among these gene products were IFN-β, JAK2, which mediates IFN-γ signaling, the chemoattractant proteins RANTES and MRP-8, and arginosuccinate synthetase, an enzyme that helps sustain NO synthesis by regenerating L-arginine from the NOS product, L-citrulline. Expression of other potentially relevant genes in response to IFN-γ was suppressed by iNOS and/or phox. Among these were IGTP and TGF-β3, an antagonist of the induction of iNOS and phox 43 44.
Table 4.
Examples of the Impact of Deficiency of iNOS and Phox on Regulation of Gene Expression by IFN-γ and Mtb
| Knockout | Stimulus | iNOS and/or phox help mediate induction or resist suppression by IFN-γ and/or Mtb | iNOS and/or phox antagonize induction by IFN-γ and/or Mtb | ||
|---|---|---|---|---|---|
| Gene | Relative impact | Gene | Relative impact | ||
| iNOS | IFN-γ | ASS | 0.08 | MHC class I Qa | 40 |
| IFN-β | 0.18 | EMAP | 16 | ||
| TIMP-3 | 0.18 | p68 lipocortin | 2.9 | ||
| DAF | 2.6 | ||||
| G-CSF | 2.2 | ||||
| IGTP | 2.0 | ||||
| Mtb | MHC class I Qa | 62 | |||
| PIRB1 | 2.1 | ||||
| IFN-γ plus Mtb | CD53 ho | 0.13 | MHC class I Qa | 46 | |
| RANTES | 0.16 | p68 lipocortin | 4.4 | ||
| PC4 ho | 0.21 | IAP | 2.4 | ||
| Integrin α4 | 2.3 | ||||
| phox | IFN-γ | ASS | 0.13 | ||
| Mtb | IFI 204 ho | 1.8 | |||
| IFN-γ plus Mtb | ASS | 0.16 | Leu 13 (9–27) ho | 4.2 | |
| JAK2 | 0.43 | PIRAI | 3.0 | ||
| MMP1 | 0.46 | CD97 prec ho | 2.6 | ||
| MCP-5 prec | 1.7 | ||||
| IL-15 | 1.6 | ||||
| LRG-47 | 1.6 | ||||
| iNOX plus phox | IFN-γ | ASS | 0.04 | Mannose R | 2.4 |
| IκB-β | 0.45 | SHP | 2.3 | ||
| Irg-1 | 0.46 | ||||
| Mtb | JAK3 | 4.1 | |||
| PIRB1 | 2.8 | ||||
| TGF-β3 | 2.8 | ||||
| PIRA6 | 2.6 | ||||
| IFI 204 ho | 2.5 | ||||
| Galectin 3 | 2.3 | ||||
| IFN-γ plus Mtb | MRP-8 | 0.13 | Integrin α6 | 11 | |
| ASS | 0.13 | Leu 13 (9–27) ho | 4.0 | ||
| H2-M | 3.3 | ||||
| p68 lipocortin | 2.6 | ||||
| MCP-5 prec | 2.4 | ||||
ASS, argininosuccinate synthetase; CD97, leukocyte marker and DAF-binding protein; DAF, decay accelerating factor (complement regulator; CD55); EMAP, endothelial monocyte activating peptide; H2-M, MHC class II-like molecule that facilitates peptide loading onto class II; IAP, integrin-associated protein (CD47); IFI, IFN-induced nuclear phosphoprotein; IκB, inhibitor of NF-κβ; Leu 13, IFN-inducible leukocyte and endothelial protein involved in adhesion; LRG-47, large G protein-related protein of 47 kDa; MMP, matrix metalloproteinase; PC4, immediate early gene induced by IFN-γ in various cells; SHP, src homology domain-containing tyrosine phosphatase; TIMP, tissue inhibitor of metalloproteinases.
For some genes, iNOS and phox acted separately to comediate induction by IFN-γ. For example, argininosuccinate synthetase could not be fully induced if iNOS was absent, even though phox was present, and it could not be fully induced if phox was absent, even though iNOS was present. This suggested that iNOS and phox each contributed something nonredundant to the transcriptional activity of IFN-γ. For other genes, iNOS and phox acted in a mutually redundant manner to exert a coinducing effect. For example, IFN-γ and Mtb could fully induce the chemoattractant protein MRP-8 when either iNOS or phox was absent, but not when both were knocked out (Table ).
Discussion
Extent of Regulation.
The use of different criteria to classify a given gene as “regulated” complicates comparison of microarray results among laboratories. Although the statistical approach used here was found to be more robust than a fold-change cut-off 29, it remains sensitive to positive probe fraction and noise thresholds and significance levels. Despite these caveats, a major message to emerge from the present study is that IFN-γ and Mtb triggered changes in the expression of an extraordinarily large proportion (25%) of the monitored genome of wt macrophages. The proportion of the monitored genome responding to these stimuli would remain remarkably high (14%) if “regulation” were assessed instead by a fold-change of ≥2, as in many reports. The proportion of genes deemed regulated by a statistical criterion during the activation of wt macrophages in the present experiments is comparable to the proportion (22%) of all genes in C. elegans whose expression varied across the lifespan of the organism from oocyte to senescent adult 45.
Although direct numerical comparisons are impossible, it helps put these findings in perspective to consider four other sets of results: gene expression during extensive physiologic activation of two other immune cells: the T lymphocyte responding to superantigen 46 and the B lymphocyte responding to an antigen for which all B cells bore the receptor 47; a nonimmune cell responding to IFN-γ 48; and various cells responding to infection by pathogens other than Mtb. The latter included macrophage cell lines infected with Listeria monocytogenes 49 or Salmonella enterica 50, epithelial cell lines with Bordetella pertussis 51 or Pseudomonas aeruginosa 52, fibroblasts with cytomegalovirus 53, T cells with HIV 54, and hearts with Coxsackie virus 55. In the studies cited, fold-change cut-offs ranging from 1.5 to 4 were used to identify regulated genes. The proportion of genes meeting these criteria ranged from 0.3 to 7.7%. 45
The large number of genes regulated in these experiments may reflect the relatively long period of stimulation by a cytokine (72 h) and a microbe (24 h), allowing for recruitment of genes regulated in a ripple effect by mediators produced earlier, such as the products of iNOS and phox. Whether the resulting snapshot of gene regulation is considered a “response” to IFN-γ and Mtb is a matter of perspective. From a strictly reductionist stance, one might only regard as “responses” to a stimulus those phenomena whose mechanisms involve a small number of discrete steps, each of which is accessible to precise definition, for example, induction of genes by IFN-γ in an “immediate early” fashion. A criterion this restrictive would exclude the induction of iNOS and MHC class II as “responses” to IFN-γ, along with other hallmarks of macrophage activation. In contrast, a goal from an integrationist perspective is to describe the overall metabolic and functional state of the activated macrophage while it is engaged in executing some of its primary functions, and to discern some of the major forces that shape that state, even if the mechanisms involved are too complex to define fully at present. For all its limitations, global analysis of gene regulation is currently the technique that most closely approaches the goal of comparing quantitatively the overall metabolic and functional states of the same cell population under diverse conditions. The fact that different pictures of IFN-γ action arise from reductionist and integrationist perspectives does not pit one view against the other. The present results provide an overarching picture of genomic plasticity and its contributory influences in macrophage activation which can serve as a biologic context for mechanistic studies of individual genes.
The plasticity of the macrophage transcriptome while the cell was engaged in killing a major pathogen raises two questions: (i) is there a benefit to the organism in programming the macrophage to undergo such a drastic shift in gene expression? and (ii) how is this shift brought about? One speculative answer to the first question is based on a view that the macrophage is designed for two temporally incompatible tasks 56. One task is to destroy pathogens and to evoke immune and inflammatory responses toward the same goal, at the risk of collateral damage. A distinct task, best executed before and after the foregoing, is to scavenge effete erythrocytes and apoptotic or necrotic cells without damaging bystanders, and to furnish trophic support to healing tissues 44. The activated phenotype associated with antimicrobial activity may be so inimical to homeostasis that these two differentiation states are separated by a requirement for extensive transcriptional remodeling.
Mechanism of Regulation: Roles of iNOS and phox.
By what mechanism was the pattern of gene expression revised so profoundly in response to IFN-γ? IFN-γ's major actions are understood to consist in the transcriptional induction of many immune-response related genes 37 57, accompanied by the translational silencing of many other genes 12 57. Transcriptional suppression by IFN-γ has been observed occasionally 37 38. In contrast, we found that IFN-γ, alone or in combination with Mtb, induced a nearly balanced program of activation and suppression of gene expression. Nuclear run-on analysis demonstrated that the microarray results were generally indicative of effects on transcription.
The mechanisms that account for suppression by IFN-γ in these experiments are unknown. STAT-1 38 and some transcription factors STAT-1 induces, such as IRF2 and ICSBP, can act as transcriptional suppressors 58. The promoters of the vast majority of the genes whose expression was suppressed have not been characterized, and it is unknown if they contain elements that bind STAT-1, IRF2, or ICSBP.
We hypothesize that a self-induced state of metabolic stringency within the activated, infected macrophage may necessitate suppression of the expression of those genes not essential to the emergency at hand. RNI can impair cellular ATP synthesis by inhibiting glyceraldehyde 3-phosphate dehydrogenase 59, cis-aconitase 60, and NADH:ubiquinone and succinate:ubiquinone oxidoreductases 61. RNI can inhibit nucleic acid synthesis by inactivating the rate-limiting enzyme, ribonucleotide reductase 62, and can draw down pools of reduced pyridine nucleotides through DNA damage, which activates poly-ADP-ribose polymerase 63; through the synthesis of RNI and ROI, for which NADPH is a substrate; and through activation of the glutathione and thioredoxin redox cycles as they detoxify RNI and ROI and repair their damage. Such effects exerted on the effector cell during the course of its own antimicrobial activities may necessitate conservation of metabolic energy in general and nucleotide pools in particular.
While induction and suppression of gene expression were nearly balanced in terms of numbers of genes affected, genes with functions related to immunity and inflammation were fivefold enriched in the induced set compared with the suppressed set. What mechanism accounts for this asymmetric response? Programs of selective gene expression in microorganisms are well described in response to oxidative stress 64 65 66 67, nitrosative stress 68, and competition for iron 69. In yeast, specific transcription factors help mediate a stress response that recruits an estimated 14% of the genome 67. The selective transcriptional reprogramming accompanying macrophage activation may depend in part on the relative susceptibility of Cys-dependent transcription factors to nitrosation or oxidation. Transcription factors that depend on Cys residues include NF-κB, AP-1, p53, and the most numerous family in the genome, zinc finger proteins 41 70.
Consistent with the concept of a selective mechanism for transcriptional remodeling set in motion by nitrosative or oxidative stress, this work identified iNOS and phox as modulating the expression of more than half the genes induced and suppressed by IFN-γ and Mtb. Until now, iNOS and phox have been regarded mainly as engines of toxicity. Without diminishing that role, these results suggest that a second role is to mediate, however indirectly, a substantial portion of the signaling triggered by IFN-γ and Mtb. That RNI and ROI participate in cell signaling is richly documented 16 40 41 70 71 72 73 74 75. However, with rare exceptions 42, the participation of RNI and ROI in cell signaling had been viewed as pertaining to low-level production of these compounds by the constitutively expressed, Ca2+-activated isoforms of NOS and by the novel orthologs of phox expressed in nonphagocytic cells 76 77. It had not been anticipated that transcriptional regulation can be so extensively modulated by RNI and ROI, nor that this takes place in phagocytes as they cope with a pathogen. In these experiments, 14% of the monitored genome was differentially regulated by IFN-γ and/or Mtb as a result of deleting iNOS and/or phox.
With respect to comediating the induction of gene expression by IFN-γ and Mtb, the effect of individually deleting either phox or iNOS indicated that the two enzymes sometimes played mutually nonredundant roles. This would be expected if they each contributed to the joint formation of a common product that helped enhance gene expression. Peroxynitrite (OONO−) is the only product known to arise jointly from precursors (NO and O2 −) that are generated by iNOS and phox. Although peroxynitrite can be toxic 78, the frequently coinductive impact of iNOS and phox, along with the adherence, spreading, morphologic integrity and bactericidal activity of the macrophages, exclude that the cells were suffering from toxicity. A cell-signaling role for peroxynitrite has been suggested 79, along with a possible mechanism, the reversible oxidation of acidic, active-site cysteine residues to the sulfenic acid 80. However, some transcription-modulating effects of iNOS and phox were revealed only when both enzymes were simultaneously deleted. In these cases, iNOS and phox appeared to be mutually redundant.
There have apparently been no previous genomic analyses of cells responding to endogenously generated oxidant or nitrosative stresses. Genomic analyses of eukaryotic cells responding to exogenous oxidant stress 81 82 gave less striking results, perhaps because the oxidant stress was the sole stimulus, rather than an accompaniment to treatment with a cytokine or bacterium.
Relevance to Tuberculosis.
Mtb lipoarabinomannan can block the activation of macrophages by IFN-γ 83, and the whole bacterium can block IFN-γ–induced transcriptional responses 84. On a genomic scale, however, Mtb much more often mimicked than blocked the actions of IFN-γ. The greatest impact of Mtb on macrophage gene expression was to synergize with IFN-γ for the induction and suppression of genes that were not regulated by either stimulus alone. We exposed macrophages to IFN-γ before Mtb. Earlier studies used the opposite sequence 83 84. Both sequences are physiologic, depending on the points in time and space under consideration during the course of this chronic disease.
Nonmicrobial particles and nonviable microbes were powerful stimuli for altering gene expression in macrophages. However, the genes responding to ingestion of heat-killed Mtb overlapped only to a small extent with the larger set responding to viable Mtb. Heat-killed mycobacteria are likely to present carbohydrates, glycolipids, and DNA sequences that can be powerful stimuli for innate immunity. However, our findings direct attention to those molecules whose production or release by mycobacteria requires their viability. These include secreted proteins and lipids 85, heat-labile proteins and lipopeptides on the surface, and substances synthesized after the adaptation of Mtb to the phagosomal environment. A companion study will document that while macrophage gene expression was responsive to Mtb, Mtb gene expression was responsive to macrophages. In fact, regulation of gene expression in the host cell and its parasite may be interactive.
The present studies should prompt further research to study genes induced by IFN-γ and Mtb that are relevant to the pathophysiology of tuberculosis, but which were not known to be regulated by this combination of stimuli. We called attention to SLPI and high molecular weight GTPases, but there are more examples.
Statistical Considerations.
By what criterion should a gene be classified as “regulated” in microarray experiments in response to a given stimulus? The fold-change cut-off is an analysis strategy used to distinguish signals from noise and thus minimize “false-positive” determinations while accepting some level of “false-negative” determinations. In using such an approach, there is no experimental basis for ascribing nonsignificance to changes in expression of all genes falling below a given numerical value. In some studies, regulation has been identified based on statistical analysis of data within individual chips. A gene was deemed regulated if its expression changed significantly more than the expression of most others. The implicit premise was that the vast majority of genes are not regulated. When regulation is defined as an outlier response, the opportunity of any given gene to be considered regulated is inversely proportional to the proportion of genes that actually are regulated. Many studies relied on data from one experiment. This entailed the premise that technical, experimental, and biological variability was low enough to dispense with replication. Other studies replicated experiments but only required that genes appear to be regulated in some of them. This implied that technical variability was too high to average results, and that positive results were more valid than negative ones. In fact, the impact of interexperiment variability on microarray analysis can be considerable: up to 79% of “calls” of genes as being regulated by infection of a macrophage cell line were reversed when the same experiment was repeated once 49. We used a criterion for gene regulation that minimized arbitrary or constraining premises. Instead of comparing one gene's response with all others', we compared expression of each gene before and after a biological intervention in multiple, independent experiments. The fold-change associated with statistical significance varied for each gene according to the reproducibility of the data pertaining to it.
Conclusion.
The macrophage drastically reshapes its transcriptome in response to IFN-γ and the tubercle bacillus. Two of its major antimicrobial enzymes help orchestrate this response. Our findings in macrophages may reveal a phenomenon that occurs to some extent in many cells. Nucleated cells of metazoans often contain an isoform of NOS. Flavoprotein-mediated ROI production by orthologs of phox has been identified in normal and transformed fibroblasts, smooth muscle, endothelial cells, and epithelial cells of diverse anatomic origin 76 77 86 87. That small, reactive, diffusible molecules like NO, O2 − and their products help shape a cell's transcriptional response to a cytokine and a bacterium suggests a modified view of signal transduction by protein–protein relays.
Acknowledgments
We thank Carsten Meyer, Jamie Bean, and Jie Qin for help with this work; David Denhardt, Andrew Luster, and Derek Sant' Angelo for clones; and Genentech for IFN-γ.
Supported by National Institutes of Health grants HL61241-02 (to C. Nathan) and AI44826 (G. Schoolnik), the Action TB Program of GlaxoWellcome (to G. Schoolnik), and a fellowship from the Deutsche Forschungsgemeinschaft (to D. Schnappinger). The Department of Microbiology and Immunology acknowledges the support of the William Randolph Hearst Foundation.
Footnotes
Abbreviations used in this paper: ho, homologous to; IGTP, IFN-induced GTPase; Irg, immune responsive gene; JAK, Janus tyrosine kinase; MRP, myeloid related protein; NO, nitric oxide; phox, phagocyte oxidase; prec, precursor; RANTES, regulated in activated normal T cells, expressed and secreted; RNI, reactive nitrogen intermediates; ROI, reactive oxygen intermediates; SLPI, secretory leukocyte protease inhibitor; STAT, signal transducer and activator of transcription; wt, wild-type.
D. Schnappinger and S. Bekiranov contributed equally to this paper.
References
- Nathan C.F., Murray H.W., Wiebe M.E., Rubin B.Y. Identification of interferon-γ as the lymphokine that activates human macrophage oxidative metabolism and antimicrobial activity. J. Exp. Med. 1983;158:670–689. doi: 10.1084/jem.158.3.670. [DOI] [PMC free article] [PubMed] [Google Scholar]
- Schreiber R.D., Pace J.L., Russell S.W., Altman A., Katz D.H. Macrophage-activating factor produced by a T cell hybridomaphysiochemical and biosynthetic resemblance to γ-interferon. J. Immunol. 1983;131:826–832. [PubMed] [Google Scholar]
- Cooper A.M., Dalton D.K., Stewart T.A., Griffin J.P., Russell D.G., Orme I.M. Disseminated tuberculosis in interferon-γ gene-disrupted mice. J. Exp. Med. 1993;178:2243–2247. doi: 10.1084/jem.178.6.2243. [DOI] [PMC free article] [PubMed] [Google Scholar]
- Flynn J.L., Chan J., Triebold K.J., Dalton D.K., Stewart T.A., Bloom B.R. An essential role for interferon γ in resistance to Mycobacterium tuberculosis infection. J. Exp. Med. 1993;178:2249–2254. doi: 10.1084/jem.178.6.2249. [DOI] [PMC free article] [PubMed] [Google Scholar]
- Jouanguy E., Lamhamedi-Cherradi S., Lammas D., Dorman S.E., Fondaneche M.C., Dupuis S., Doffinger R., Altare F., Girdlestone J., Emile J.F. A human IFNGR1 small deletion hotspot associated with dominant susceptibility to mycobacterial infection. Nat. Genet. 1999;21:370–378. doi: 10.1038/7701. [DOI] [PubMed] [Google Scholar]
- Murray H.W., Spitalny G.L., Nathan C.F. Activation of mouse peritoneal macrophages in vitro and in vivo by interferon-γ. J. Immunol. 1985;134:1619–1622. [PubMed] [Google Scholar]
- Nathan C.F., Horowitz C.R., de la Harpe J., Vadhan-Raj S., Sherwin S.A., Oettgen H.F., Krown S.E. Administration of recombinant interferon γ to cancer patients enhances monocyte secretion of hydrogen peroxide. Proc. Natl. Acad. Sci. USA. 1985;82:8686–8690. doi: 10.1073/pnas.82.24.8686. [DOI] [PMC free article] [PubMed] [Google Scholar]
- Condos R., Rom W.N., Schluger N.W. Treatment of multidrug-resistant pulmonary tuberculosis with interferon-γ via aerosol. Lancet. 1997;349:1513–1515. doi: 10.1016/S0140-6736(96)12273-X. [DOI] [PubMed] [Google Scholar]
- Nathan C.F., Kaplan G., Levis W.R., Nusrat A., Witmer M.D., Sherwin S.A., Job C.K., Horowitz C.R., Steinman R.M., Cohn Z.A. Local and systemic effects of intradermal recombinant interferon-γ in patients with lepromatous leprosy. N. Engl. J. Med. 1986;315:6–15. doi: 10.1056/NEJM198607033150102. [DOI] [PubMed] [Google Scholar]
- Leonard W.J., O'Shea J.J. Jaks and STATsbiological implications. Annu. Rev. Immunol. 1998;16:293–322. doi: 10.1146/annurev.immunol.16.1.293. [DOI] [PubMed] [Google Scholar]
- Darnell J.E., Jr., Kerr I.M., Stark G.R. Jak-STAT pathways and transcriptional activation in response to IFNs and other extracellular signaling proteins. Science. 1994;264:1415–1421. doi: 10.1126/science.8197455. [DOI] [PubMed] [Google Scholar]
- Weil J., Epstein C.J., Epstein L.B., Sedmak J.J., Sabran J.L., Grossberg S.E. A unique set of polypeptides is induced by γ interferon in addition to those induced in common with α and β interferons. Nature. 1983;301:437–439. doi: 10.1038/301437a0. [DOI] [PubMed] [Google Scholar]
- Williams B.R. PKRa sentinel kinase for cellular stress. Oncogene. 1999;18:6112–6120. doi: 10.1038/sj.onc.1203127. [DOI] [PubMed] [Google Scholar]
- Thoma-Uszynski S., Stenger S., Takeuchi O., Ochoa M.T., Engele M., Sieling P.A., Barnes P.F., Rollinghoff M., Bolcskei P.L., Wagner M. Induction of direct antimicrobial activity through mammalian toll-like receptors. Science. 2001;291:1544–1547. doi: 10.1126/science.291.5508.1544. [DOI] [PubMed] [Google Scholar]
- Medzhitov R., Preston-Hurlburt P., Kopp E., Stadlen A., Chen C., Ghosh S., Janeway C.A., Jr. MyD88 is an adaptor protein in the hToll/IL-1 receptor family signaling pathways. Mol. Cell. 1998;2:253–258. doi: 10.1016/s1097-2765(00)80136-7. [DOI] [PubMed] [Google Scholar]
- Schlessinger J. Cell signaling by receptor tyrosine kinases. Cell. 2000;103:211–225. doi: 10.1016/s0092-8674(00)00114-8. [DOI] [PubMed] [Google Scholar]
- Xie Q.W., Cho H.J., Calaycay J., Mumford R.A., Swiderek K.M., Lee T.D., Ding A., Troso T., Nathan C. Cloning and characterization of inducible nitric oxide synthase from mouse macrophages. Science. 1992;256:225–228. doi: 10.1126/science.1373522. [DOI] [PubMed] [Google Scholar]
- Nathan C., Shiloh M.U. Reactive oxygen and nitrogen intermediates in the relationship between mammalian hosts and microbial pathogens. Proc. Natl. Acad. Sci. USA. 2000;97:8841–8848. doi: 10.1073/pnas.97.16.8841. [DOI] [PMC free article] [PubMed] [Google Scholar]
- Shiloh M.U., MacMicking J.D., Nicholson S., Brause J.E., Potter S., Marino M., Fang F., Dinauer M., Nathan C. Phenotype of mice and macrophages deficient in both phagocyte oxidase and inducible nitric oxide synthase. Immunity. 1999;10:29–38. doi: 10.1016/s1074-7613(00)80004-7. [DOI] [PubMed] [Google Scholar]
- MacMicking J.D., North R.J., La Course R., Mudgett J.S., Shah S.K., Nathan C.F. Identification of nitric oxide synthase as a protective locus against tuberculosis. Proc. Natl. Acad. Sci. USA. 1997;94:5243–5248. doi: 10.1073/pnas.94.10.5243. [DOI] [PMC free article] [PubMed] [Google Scholar]
- Sandberg R., Yasuda R., Pankratz D.G., Carter T.A., Del Rio J.A., Wodicka L., Mayford M., Lockhart D.J., Barlow C. Regional and strain-specific gene expression mapping in the adult mouse brain. Proc. Natl. Acad. Sci. USA. 2000;97:11038–11043. doi: 10.1073/pnas.97.20.11038. [DOI] [PMC free article] [PubMed] [Google Scholar]
- MacMicking J.D., Nathan C., Hom G., Chartrain N., Fletcher D.S., Trumbauer M., Stevens K., Xie Q.W., Sokol K., Hutchinson N. Altered responses to bacterial infection and endotoxic shock in mice lacking inducible nitric oxide synthase. Cell. 1995;81:641–650. doi: 10.1016/0092-8674(95)90085-3. [DOI] [PubMed] [Google Scholar]
- Pollock J.D., Williams D.A., Gifford M.A., Li L.L., Du X., Fisherman J., Orkin S.H., Doerschuk C.M., Dinauer M.C. Mouse model of X-linked chronic granulomatous disease, an inherited defect in phagocyte superoxide production. Nat. Genet. 1995;9:202–209. doi: 10.1038/ng0295-202. [DOI] [PubMed] [Google Scholar]
- Rhoades E.R., Orme I.M. Similar responses by macrophages from young and old mice infected with Mycobacterium tuberculosis . Mech Ageing Dev. 1998;106:145–153. doi: 10.1016/s0047-6374(98)00113-4. [DOI] [PubMed] [Google Scholar]
- De la Harpe J., Nathan C.F. A semi-automated micro-assay for H2O2 release by human blood monocytes and mouse peritoneal macrophages. J. Immunol. Methods. 1985;78:323–336. doi: 10.1016/0022-1759(85)90089-4. [DOI] [PubMed] [Google Scholar]
- Bradford M.M. A rapid and sensitive method for the quantitation of microgram quantities of protein utilizing the principle of protein-dye binding. Anal. Biochem. 1976;72:248–254. doi: 10.1016/0003-2697(76)90527-3. [DOI] [PubMed] [Google Scholar]
- Hillier L.D., Lennon G., Becker M., Bonaldo M.F., Chiapelli B., Chissoe S., Dietrich N., DuBuque T., Favello A., Gish W. Generation and analysis of 280,000 human expressed sequence tags. Genome Res. 1996;6:807–828. doi: 10.1101/gr.6.9.807. [DOI] [PubMed] [Google Scholar]
- Hoaglin D.C. Letter valuesa set of selected order statistics. In Understanding Robust and Exploratory Data Analysis. In: Mosteller F., Tukey J.W., editors. Wiley Series in Probability and Mathematical Statistics. Wiley and Sons; New York, NY: 1983. pp. 33–41. [Google Scholar]
- Long A.D., Mangalam H.J., Chan B.Y.P., Tolleri L., Hatfield G.W., Baldi P. Global gene expression profiling in Escherichia coli K12improved statistitical inference from DNA microarray data using analysis of variance and a Bayesian statistical framework. J. Biol. Chem. 2001;276:19937–19944. doi: 10.1074/jbc.M010192200. [DOI] [PubMed] [Google Scholar]
- Hughes T.R., Marton M.J., Jones A.R., Roberts C.J., Stoughton R., Armour C.D., Bennett H.A., Coffey E., Dai H., He Y.D. Functional discovery via a compendium of expression profiles. Cell. 2000;102:109–126. doi: 10.1016/s0092-8674(00)00015-5. [DOI] [PubMed] [Google Scholar]
- Taylor G.A., Collazo C.M., Yap G.S., Nguyen K., Gregorio T.A., Taylor L.S., Eagleson B., Secrest L., Southon E.A., Reid S.W. Pathogen-specific loss of host resistance in mice lacking the IFN-γ-inducible gene IGTP. Proc. Natl. Acad. Sci. USA. 2000;97:751–755. doi: 10.1073/pnas.97.2.751. [DOI] [PMC free article] [PubMed] [Google Scholar]
- Anderson S.L., Carton J.M., Lou J., Xing L., Rubin B.Y. Interferon-induced guanylate binding protein-1 (GBP-1) mediates an antiviral effect against vesicular stomatitis virus and encephalomyocarditis virus. Virology. 1999;256:8–14. doi: 10.1006/viro.1999.9614. [DOI] [PubMed] [Google Scholar]
- Jin F.Y., Nathan C., Radzioch D., Ding A. Secretory leukocyte protease inhibitora macrophage product induced by and antagonistic to bacterial lipopolysaccharide. Cell. 1997;88:417–426. doi: 10.1016/s0092-8674(00)81880-2. [DOI] [PubMed] [Google Scholar]
- Singh P.K., Tack B.F., McCray P.B., Welsh M.J. Synergistic and additive killing by antimicrobial factors found in human airway surface liquid. Am. J. Physiol. Lung Cell. Mol. Physiol. 2000;279:L799–L805. doi: 10.1152/ajplung.2000.279.5.L799. [DOI] [PubMed] [Google Scholar]
- Ashcroft G.S., Lei K., Jin W., Longenecker G., Kulkarni A.B., Greenwell-Wild T., Hale-Donze H., McGrady G., Song X.Y., Wahl S.M. Secretory leukocyte protease inhibitor mediates non-redundant functions necessary for normal wound healing. Nat. Med. 2000;6:1147–1153. doi: 10.1038/80489. [DOI] [PubMed] [Google Scholar]
- Sadek M.I., Sada E., Toossi Z., Schwander S.K., Rich E.A. Chemokines induced by infection of mononuclear phagocytes with mycobacteria and present in lung alveoli during active pulmonary tuberculosis. Am. J. Respir. Cell. Mol. Biol. 1998;19:513–521. doi: 10.1165/ajrcmb.19.3.2815. [DOI] [PubMed] [Google Scholar]
- Boehm U., Klamp T., Groot M., Howard J.C. Cellular responses to interferon-γ. Annu. Rev. Immunol. 1997;15:749–795. doi: 10.1146/annurev.immunol.15.1.749. [DOI] [PubMed] [Google Scholar]
- Ramana C.V., Chatterjee-Kishore M., Nguyen H., Stark G.R. Complex roles of Stat1 in regulating gene expression. Oncogene. 2000;19:2619–2627. doi: 10.1038/sj.onc.1203525. [DOI] [PubMed] [Google Scholar]
- Tanaka T., Akira S., Yoshida K., Umemoto M., Yoneda Y., Shirafuji N., Fujiwara H., Suematsu S., Yoshida N., Kishimoto T. Targeted disruption of the NF-IL6 gene discloses its essential role in bacteria killing and tumor cytotoxicity by macrophages. Cell. 1995;80:353–361. doi: 10.1016/0092-8674(95)90418-2. [DOI] [PubMed] [Google Scholar]
- Bae Y.S., Sung J.Y., Kim O.S., Kim Y.J., Hur K.C., Kazlauskas A., Rhee S.G. Platelet-derived growth factor-induced H2O2 production requires the activation of phosphatidylinositol 3-kinase. J. Biol. Chem. 2000;275:10527–10531. doi: 10.1074/jbc.275.14.10527. [DOI] [PubMed] [Google Scholar]
- Bogdan C. Nitric oxide and the regulation of gene expression. Trends Cell Biol. 2001;11:66–75. doi: 10.1016/s0962-8924(00)01900-0. [DOI] [PubMed] [Google Scholar]
- Diefenbach A., Schindler H., Rollinghoff M., Yokoyama W.M., Bogdan C. Requirement for type 2 NO synthase for IL-12 signaling in innate immunity. Science. 1999;284:951–955. doi: 10.1126/science.284.5416.951. [DOI] [PubMed] [Google Scholar]
- Ding A., Nathan C.F., Graycar J., Derynck R., Stuehr D.J., Srimal S. Macrophage deactivating factor and transforming growth factors-β1, -β2, and -β3 inhibit induction of macrophage nitrogen oxide synthesis by IFN-γ. J. Immunol. 1990;145:940–944. [PubMed] [Google Scholar]
- Tsunawaki S., Sporn M., Ding A., Nathan C. Deactivation of macrophages by transforming growth factor-β. Nature. 1988;334:260–262. doi: 10.1038/334260a0. [DOI] [PubMed] [Google Scholar]
- Hill A.A., Hunter C.P., Tsung B.T., Tucker-Kellogg G., Brown E.L. Genomic analysis of gene expression in C. elegans . Science. 2000;290:809–812. doi: 10.1126/science.290.5492.809. [DOI] [PubMed] [Google Scholar]
- Teague T.K., Hildeman D., Kedl R.M., Mitchell T., Rees W., Schaefer B.C., Bender J., Kappler J., Marrack P. Activation changes the spectrum but not the diversity of genes expressed by T cells. Proc. Natl. Acad. Sci. USA. 1999;96:12691–12696. doi: 10.1073/pnas.96.22.12691. [DOI] [PMC free article] [PubMed] [Google Scholar]
- Glynne R., Akkaraju S., Healy J.I., Rayner J., Goodnow C.C., Mack D.H. How self-tolerance and the immunosuppressive drug FK506 prevent B-cell mitogenesis. Nature. 2000;403:672–676. doi: 10.1038/35001102. [DOI] [PubMed] [Google Scholar]
- Der S.D., Zhou A., Williams B.R., Silverman R.H. Identification of genes differentially regulated by interferon α, β, or γ using oligonucleotide arrays. Proc. Natl. Acad. Sci. USA. 1998;95:15623–15628. doi: 10.1073/pnas.95.26.15623. [DOI] [PMC free article] [PubMed] [Google Scholar]
- Cohen P., Bouaboula M., Bellis M., Baron V., Jbilo O., Poinot-Chazel C., Galiegue S., Hadibi E.H., Casellas P. Monitoring cellular responses to Listeria monocytogenes with oligonucleotide arrays. J. Biol. Chem. 2000;275:11181–11190. doi: 10.1074/jbc.275.15.11181. [DOI] [PubMed] [Google Scholar]
- Detweiler C.S., Cunanan D.B., Falkow S. Host microarray analysis reveals a role for the Salmonella response regulator phoP in human macrophage cell death. Proc. Natl. Acad. Sci. USA. 2001;98:5850–5855. doi: 10.1073/pnas.091110098. [DOI] [PMC free article] [PubMed] [Google Scholar]
- Belcher C.E., Drenkow J., Kehoe B., Gingeras T.R., McNamara N., Lemjabbar H., Basbaum C., Relman D.A. From the coverthe transcriptional responses of respiratory epithelial cells to Bordetella pertussis reveal host defensive and pathogen counter-defensive strategies. Proc. Natl. Acad. Sci. USA. 2000;97:13847–13852. doi: 10.1073/pnas.230262797. [DOI] [PMC free article] [PubMed] [Google Scholar]
- Ichikawa J.K., Norris A., Bangera M.G., Geiss G.K., van't Wout A.B., Bumgarner R.E., Lory S. Interaction of Pseudomonas aeruginosa with epithelial cellsidentification of differentially regulated genes by expression microarray analysis of human cDNAs. Proc. Natl. Acad. Sci. USA. 2000;97:9659–9664. doi: 10.1073/pnas.160140297. [DOI] [PMC free article] [PubMed] [Google Scholar]
- Zhu H., Cong J.P., Mamtora G., Gingeras T., Shenk T. Cellular gene expression altered by human cytomegalovirusglobal monitoring with oligonucleotide arrays. Proc. Natl. Acad. Sci. USA. 1998;95:14470–14475. doi: 10.1073/pnas.95.24.14470. [DOI] [PMC free article] [PubMed] [Google Scholar]
- Geiss G.K., Bumgarner R.E., An M.C., Agy M.B., van't Wout A.B., Hammersmark E., Carter V.S., Upchurch D., Mullins J.I., Katze M.G. Large-scale monitoring of host cell gene expression during HIV-1 infection using cDNA microarrays. Virology. 2000;266:8–16. doi: 10.1006/viro.1999.0044. [DOI] [PubMed] [Google Scholar]
- Taylor L.A., Carthy C.M., Yang D., Saad K., Wong D., Schreiner G., Stanton L.W., McManus B.M. Host gene regulation during coxsackievirus B3 infection in miceassessment by microarrays. Circ. Res. 2000;87:328–334. doi: 10.1161/01.res.87.4.328. [DOI] [PubMed] [Google Scholar]
- Nathan C., Muller W.A. Putting the brakes on innate immunitya regulatory role for CD200? Nat. Immunol. 2001;2:17–19. doi: 10.1038/83124. [DOI] [PubMed] [Google Scholar]
- Balachandran S., Roberts P.C., Brown L.E., Truong H., Pattnaik A.K., Archer D.R., Barber G.N. Essential role for the dsRNA-dependent protein kinase PKR in innate immunity to viral infection. Immunity. 2000;13:129–141. doi: 10.1016/s1074-7613(00)00014-5. [DOI] [PubMed] [Google Scholar]
- Mamane Y., Heylbroeck C., Genin P., Algarte M., Servant M.J., LePage C., DeLuca C., Kwon H., Lin R., Hiscott J. Interferon regulatory factorsthe next generation. Gene. 1999;237:1–14. doi: 10.1016/s0378-1119(99)00262-0. [DOI] [PubMed] [Google Scholar]
- Brune B., Lapetina E.G. Glyceraldehyde-3-phosphate dehydrogenasea target for nitric oxide signaling. Adv. Pharmacol. 1995;34:351–360. doi: 10.1016/s1054-3589(08)61097-2. [DOI] [PubMed] [Google Scholar]
- Drapier J.C., Hibbs J.B., Jr. Aconitasesa class of metalloproteins highly sensitive to nitric oxide synthesis. Methods Enzymol. 1996;269:26–36. doi: 10.1016/s0076-6879(96)69006-5. [DOI] [PubMed] [Google Scholar]
- Stuehr D.J., Nathan C.F. Nitric oxide. A macrophage product responsible for cytostasis and respiratory inhibition in tumor target cells. J. Exp. Med. 1989;169:1543–1555. doi: 10.1084/jem.169.5.1543. [DOI] [PMC free article] [PubMed] [Google Scholar]
- Kwon N.S., Stuehr D.J., Nathan C.F. Inhibition of tumor cell ribonucleotide reductase by macrophage-derived nitric oxide. J. Exp. Med. 1991;174:761–767. doi: 10.1084/jem.174.4.761. [DOI] [PMC free article] [PubMed] [Google Scholar]
- Szabo C., Zingarelli B., O'Connor M., Salzman A.L. DNA strand breakage, activation of poly (ADP-ribose) synthetase, and cellular energy depletion are involved in the cytotoxicity of macrophages and smooth muscle cells exposed to peroxynitrite. Proc. Natl. Acad. Sci. USA. 1996;93:1753–1758. doi: 10.1073/pnas.93.5.1753. [DOI] [PMC free article] [PubMed] [Google Scholar]
- Choi H., Kim S., Mukhopadhyay P., Cho S., Woo J., Storz G., Ryu S. Structural basis of the redox switch in the OxyR transcription factor. Cell. 2001;105:103–113. doi: 10.1016/s0092-8674(01)00300-2. [DOI] [PubMed] [Google Scholar]
- Godon C., Lagniel G., Lee J., Buhler J.M., Kieffer S., Perrot M., Boucherie H., Toledano M.B., Labarre J. The H2O2 stimulon in Saccharomyces cerevisiae . J. Biol. Chem. 1998;273:22480–22489. doi: 10.1074/jbc.273.35.22480. [DOI] [PubMed] [Google Scholar]
- Gonzalez-Flecha B., Demple B. Genetic responses to free radicals. Homeostasis and gene control. Ann. NY Acad. Sci. 2000;899:69–87. doi: 10.1111/j.1749-6632.2000.tb06177.x. [DOI] [PubMed] [Google Scholar]
- Sutton M.D., Smith B.T., Godoy V.G., Walker G.C. The SOS responserecent insights into umuDC-dependent mutagenesis and DNA damage tolerance. Annu. Rev. Genet. 2000;34:479–497. doi: 10.1146/annurev.genet.34.1.479. [DOI] [PubMed] [Google Scholar]
- Hausladen A., Privalle C.T., Keng T., De Angelo J., Stamler J.S. Nitrosative stressactivation of the transcription factor OxyR. Cell. 1996;86:719–729. doi: 10.1016/s0092-8674(00)80147-6. [DOI] [PubMed] [Google Scholar]
- Ratledge C., Dover L.G. Iron metabolism in pathogenic bacteria. Annu. Rev. Microbiol. 2000;54:881–941. doi: 10.1146/annurev.micro.54.1.881. [DOI] [PubMed] [Google Scholar]
- Kroncke K.D., Carlberg C. Inactivation of zinc finger transcription factors provides a mechanism for a gene regulatory role of nitric oxide. FASEB J. 2000;14:166–173. doi: 10.1096/fasebj.14.1.166. [DOI] [PubMed] [Google Scholar]
- Dalton T.P., Shertzer H.G., Puga A. Regulation of gene expression by reactive oxygen. Annu. Rev. Pharmacol. Toxicol. 1999;39:67–101. doi: 10.1146/annurev.pharmtox.39.1.67. [DOI] [PubMed] [Google Scholar]
- Griendling K.K., Sorescu D., Ushio-Fukai M. NAD(P)H oxidaserole in cardiovascular biology and disease. Circ. Res. 2000;86:494–501. doi: 10.1161/01.res.86.5.494. [DOI] [PubMed] [Google Scholar]
- Sen C.K. Cellular thiols and redox-regulated signal transduction. Curr. Top. Cell. Regul. 2000;36:1–30. doi: 10.1016/s0070-2137(01)80001-7. [DOI] [PubMed] [Google Scholar]
- Smith J., Ladi E., Mayer-Proschel M., Noble M. Redox state is a central modulator of the balance between self-renewal and differentiation in a dividing glial precursor cell. Proc. Natl. Acad. Sci. USA. 2000;97:10032–10037. doi: 10.1073/pnas.170209797. [DOI] [PMC free article] [PubMed] [Google Scholar]
- Xu W., Liu L., Smith G.C., Charles l G. Nitric oxide upregulates expression of DNA-PKcs to protect cells from DNA-damaging anti-tumour agents. Nat. Cell Biol. 2000;2:339–345. doi: 10.1038/35014028. [DOI] [PubMed] [Google Scholar]
- Lambeth J.D., Cheng G., Arnold R.S., Edens W.A. Novel homologs of gp91phox. Trends Biochem. Sci. 2000;25:459–461. doi: 10.1016/s0968-0004(00)01658-3. [DOI] [PubMed] [Google Scholar]
- Yang S., Madyastha P., Bingel S., Ries W., Key L. A new superoxide-generating oxidase in murine osteoclasts. J. Biol. Chem. 2001;276:5452–5458. doi: 10.1074/jbc.M001004200. [DOI] [PubMed] [Google Scholar]
- Beckman J.S., Koppenol W.H. Nitric oxide, superoxide, and peroxynitritethe good, the bad, and ugly. Am. J. Physiol. 1996;271:C1424–C1437. doi: 10.1152/ajpcell.1996.271.5.C1424. [DOI] [PubMed] [Google Scholar]
- Kamisaki Y., Wada K., Bian K., Balabanli B., Davis K., Martin E., Behbod F., Lee Y.C., Murad F. An activity in rat tissues that modifies nitrotyrosine-containing proteins. Proc. Natl. Acad. Sci. USA. 1998;95:11584–11589. doi: 10.1073/pnas.95.20.11584. [DOI] [PMC free article] [PubMed] [Google Scholar]
- Bryk R., Griffin P., Nathan C. Peroxynitrite reductase activity of bacterial peroxiredoxins. Nature. 2000;407:211–215. doi: 10.1038/35025109. [DOI] [PubMed] [Google Scholar]
- Cho R.J., Huang M., Dong H., Steinmetz L., Sapinoso L., Hampton G., Elledge S.J., Davis R.W., Lockhart D.J., Campbell M.J. Transcriptional regulation and function during the human cell cycle. Nat. Genet. 2001;27:48–54. doi: 10.1038/83751. [DOI] [PubMed] [Google Scholar]
- Zou S., Meadows S., Sharp L., Jan L.Y., Jan Y.N. Genome-wide study of aging and oxidative stress response in Drosophila melanogaster . Proc. Natl. Acad. Sci. USA. 2000;97:13726–13731. doi: 10.1073/pnas.260496697. [DOI] [PMC free article] [PubMed] [Google Scholar]
- Sibley L.D., Adams L.B., Krahenbuhl J.L. Inhibition of interferon-γ-mediated activation in mouse macrophages treated with lipoarabinomannan. Clin. Exp. Immunol. 1990;80:141–148. doi: 10.1111/j.1365-2249.1990.tb06454.x. [DOI] [PMC free article] [PubMed] [Google Scholar]
- Ting L.M., Kim A.C., Cattamanchi A., Ernst J.D. Mycobacterium tuberculosis inhibits IFN-γ transcriptional responses without inhibiting activation of STAT1. J. Immunol. 1999;163:3898–3906. [PubMed] [Google Scholar]
- Glickman M.S., Jacobs W.R., Jr. Microbial pathogenesis of Mycobacterium tuberculosisdawn of a discipline. Cell. 2001;104:477–485. doi: 10.1016/s0092-8674(01)00236-7. [DOI] [PubMed] [Google Scholar]
- Meier B., Jesaitis A.J., Emmendorffer A., Roesler J., Quinn M.T. The cytochrome b-558 molecules involved in the fibroblast and polymorphonuclear leucocyte superoxide-generating NADPH oxidase systems are structurally and genetically distinct. Biochem. J. 1993;289:481–486. doi: 10.1042/bj2890481. [DOI] [PMC free article] [PubMed] [Google Scholar]
- Szatrowski T.P., Nathan C.F. Production of large amounts of hydrogen peroxide by human tumor cells. Cancer Res. 1991;51:794–798. [PubMed] [Google Scholar]