Abstract
Sap1 is a dimeric sequence-specific DNA binding-protein, initially identified for its role in mating-type switching of the fission yeast Schizosaccharomyces pombe. The protein is relatively abundant, around 10,000 dimers/cell, and is localized in the nucleus. sap1+ is essential for viability, and transient overexpression is accompanied by rapid cell death, without an apparent checkpoint response and independently of mating-type switching. Time lapse video microscopy of living cells revealed that the loss of viability is accompanied by abnormal mitosis and chromosome fragmentation. Overexpression of the C terminus of Sap1 induces minichromosome loss associated with the “cut” phenotype (uncoupling mitosis and cytokinesis). These phenotypes are favored when the C terminus of Sap1 is overexpressed during DNA replication. Fluorescence in situ hybridization experiments demonstrated that the cut phenotype is related to precocious centromere separation, a typical marker for loss of cohesion. We propose that Sap1 is an architectural chromatin-associated protein, required for chromosome organization.
Eukaryotic chromosomes are organized into discrete domains or loops defining independent and functional units that are attached to a proteinaceous nuclear scaffold (27). This higher-order structural organization is not static but rather is dramatically remodeled during the cell cycle such as the DNA replication and mitotic phases. In addition, transcriptional regulation and site-specific recombination are also linked to modulation of the chromatin architecture during interphase (for reviews, see references 16, 24, and 38).
It is generally accepted that during DNA replication, sister chromatids are aligned and held together by a tight chromosomal connection that is conserved throughout the G2 phase, until the metaphase/anaphase transition. The beginning of the mitotic phase is accompanied by chromosome condensation, which is essential for topoisomerase II-dependent DNA decatenation of intertwined sister chromatids. It has been proposed that the disruption of both linkages between sister chromatids allows them to segregate to opposite poles of the cell (34).
The main candidate for organizing sister chromatids together is the cohesin-condensing complexes, which have also been implicated in recombination and DNA repair (36, 37) and more recently in postreplicative double-strand-break repair (48). Interestingly, Scc1p, known as Rad21 in Schizosaccharomyces pombe, was first identified as a DNA repair protein (13). Other players, not part of these complexes, interact with the replication machinery and have been proposed to participate in the establishment of cohesion between sister chromatids (for a review, see reference 14).
These recent findings indicate a direct connection between cohesion and the replication-repair machinery, supporting the notion that cohesion participates in maintaining genomic integrity and ensuring segregation of two identical copies of the genetic material into daughter cells. The result is the production of two identical cells, the basis of clonal cell growth. To achieve this fidelity, cells have evolved surveillance mechanisms to coordinate repair of natural, unavoidable errors with cell cycle progression (60).
Interestingly, the fission yeast S. pombe escapes from this clonal rule and exhibits recurrent asymmetric divisions. This organism profits from the intrinsic asymmetry of the DNA replication process to mark one of the two sister chromatids at the mating-type locus (mat1) by a single-strand DNA modification. Molecular and biochemical studies indicate that the DNA modification is a site- and strand-specific nick or an alkali-labile modification (2, 17). Furthermore, this stable DNA modification restricts mating-type switching to only one of the two sister chromatids during the subsequent round of DNA replication (3, 5). Mating-type switching consists of replacing genetic information at the transcriptionally active mat1 locus with sequences copied from one of the silent donor loci, mat1P and mat3M. The accessibility of the donor is, in part, controlled at the chromatin level, and the gene conversion process requires specific and programmed folding of chromosome II (30, 52).
cis- and trans-acting elements are essential for establishing or maintaining the single-stranded DNA lesion at mat1. A mutation in the SAS1 or SAS2 (switching activating sequence 1 or 2) cis element, located 140 or 70 bp away from mat1, respectively, significantly reduces the DNA modification level (4). Four genes, swi1+, swi3+, swi7+, and sap1+, are also involved (4, 11, 22, 31). swi1+ and swi3+ encode proteins required for pausing the DNA replication fork next to the mat1 locus, and they interact genetically with topoisomerase I (18, 19). swi7+ encodes the DNA polymerase α catalytic subunit (20, 47), required for DNA replication initiation and lagging-strand progression. Sap1 (switching activating protein 1) is a DNA-binding protein that interacts specifically with SAS1 and participates in the formation or maintenance of the single-strand DNA lesion at mat1 (4); it might be also involved in the chromosomal folding required for mating-type switching. sap1 null mutations have been shown to be essential for growth, independently of mating-type switching (7).
Despite our knowledge of numerous proteins interacting with specific DNA sequences, Sap1 constitutes a novel type of DNA-binding protein. Two dimerization interfaces flank the DNA-binding domain. The C terminus has a predicted coiled-coil structure allowing dimerization of the protein in solution, and the N terminus allows cooperative binding of two dimers on target DNA (6, 28). The last 40 residues of the protein contain the tetrapeptide GANM, repeated four times, whose function is unknown. This portion is not required for DNA binding or for self-oligomerization. We speculate that the long (12-nm) dimerization domain of Sap1 is used to separate the target DNA from its C terminus (8).
To investigate the essential role of sap1, we studied the phenotype of cells lacking or overexpressing the protein. In both cases the yeast cells die, due to abnormal chromosome segregation and loss of DNA during anaphase. Because of these complex pleiotropic phenotypes, we overexpressed the C-terminal part of Sap1 (Sap1-Cter), which is incapable of interacting with the DNA and with the endogenous Sap1 protein. Biochemical and cellular analyses indicate that Sap1-Cter induces a “cut” phenotype (septation in the absence of normal nuclear division) (35) and minichromosome loss. Cell cycle analysis indicates that the cut phenotype is induced when the C-terminal domain is expressed during S phase but not when it is expressed during the beginning of M phase. Fluorescence in situ hybridization (FISH) experiments show that abnormal anaphase is related to precocious sister chromatid separation.
MATERIALS AND METHODS
Yeast strains.
The following strains were used in this study: PB1 (h90 leu1-32 ura4D-18), PB10 (Msmt0 leu1-32 ade6-210) (23), the minichromosome-containing strain PB456 (h−) (39), the thermosensitive cdc25 (h−) mutant strain (45), the thermosensitive cut9 mutant strain (56), and the sap1+/sap1−::LEU2 heterozygote strain PB69 (h90/Msmt0) (7). Cells were grown in minimal medium complemented with adenine or uracil, depending on the auxotrophies. Rich medium (YE medium) and YES medium were supplemented with histidine, adenine, leucine, and uracil as described previously (1). Thiamine was added to a final concentration of 20 μM to repress expression of the nmt1 promoter.
Cell synchronization.
Cells were presynchronized by using lactose gradients (9). Drugs were added as follows: 12 mM hydroxyurea (HU) diluted in water and 100 μg of thiabendazole (TBZ)/ml diluted in dimethyl sulfoxide. Cells were washed after 2 or 3 h for TBZ or HU, respectively, and then allowed to restart growth in fresh medium.
Plasmids and constructions.
pREP3-Sap1 was constructed by insertion of the sap1 open reading frame by using primers BA1 (AAAAATGGCCATGGAAGCTCCCAAGATGGAACT) and BA3 (AAAAAGGATCCTTAATGGTCACCAAGATTAGG) (sequences given from 5′ to 3′). This PCR DNA fragment was digested with BalI and BamHI and inserted into pREP3 (40) at BalI/BamHI. For construction of pREP3-GFP/Sap1-Cter, green fluorescent protein (GFP) was amplified from pUC-GFPmut2 (15) by using primers GFP-XhoIF (AAAAACTCGAGCAAAGGAGAACTTTTCACTGG) and GFP-SalIR (AAAAAAGTCGACTTGTATAGTTCATCCATGCC), digested with XhoI/SalI, and inserted into pREP3 at SalI. The Sap1-Cter coding sequence was amplified by using CTER-BamHIF (TTTTTGGATCCCTCTGCTTACGCTCCCCATGGCGTTAACATGGGC) and CTER-SmaIR (AAAAACCCGGGTTAATGGTCACCAAGATTAGGAGAGATGCTAGAATGG), digested with BamHI/SmaI, and inserted into pREP3 at BamHI/SmaI. Finally, a nuclear localization signal (NLS) segment was amplified by using the complementing primers NLS2-BglIIF (GATCTTCCCAAAAAGAAACGCAAGGTCGGG) and NLS2-BamHIR (GATCCCCGACCTTGCGTTTCTTTTTGGGAA), corresponding to peptide PKKKRKV, and inserted at BamHI. pREP3-HA/Sap1-Cter was constructed in the same manner, except that for the first step we inserted a fragment, corresponding to tags comprising 6 histidines and 3 (HA) molecules, amplified from plasmid pCM262 (a gift from Enrique Herrero, University of Lleida, Lleida, Spain) by using primers TAG-XhoIF (TTTTTCTCGAGACACCATCACCATCATCACG) and TAG-SalIR (TTTTTGTCGACCCAGCGTAATCTGGAACGTCAT). The pIRT-Sap1 plasmid was constructed by insertion into pIRT1 at SmaI of a 3-kb PvuII genomic fragment containing sap1.
Proteins and DNA analysis.
Gel shift assays were performed as reported previously (4). The bacterially truncated Sap1(1-203) protein was obtained as described previously (8, 28). Standard procedures were used for Western and Southern blot analyses. Plasmid topology gel analysis was performed in the absence of ethidium bromide, by using 0.6% agarose gels.
Time lapse photography.
One milliliter of cell cultures was taken, and 1 μg of Hoechst 33342/ml was added. Cells were incubated for 2 min in the dark, spun for 1 min, resuspended in 100 μl of fresh medium, and observed microscopically at 20°C with a Zeiss Axiophot microscope. Under these conditions, mitosis takes about 30 min to be completed. Photographs were taken with a Hamamatsu charge-coupled device (CCD) camera piloted by a program developed by Serge Garbay under the Khoros developing environment, with a SunOS Sun Sparc workstation. Photographs were taken every 30 s by using 0.1-s exposure times.
PFGE.
DNA was prepared in agarose plugs (2). Pulsed-field gel electrophoresis (PFGE) was carried out as recommended by the manufacturer (Rotaphor type IV; Biometra). DNA was separated on a 0.7% agarose gel (20 mM Tris-acetate-1 mM EDTA [pH 8]) for 96 h at 13°C by using 50 V with an alternating current of 90-min intervals.
Fluorescence microscopy.
Rabbit polyclonal antibodies directed against the purified full-length Sap1 protein (residues 1 to 254), the N-terminal part (residues 1 to 136), and the C-terminal part (residues 134 to 254) were prepared. Cells were fixed by using 3.6% paraformaldehyde for immunofluorescence and 1.8% for FISH. Cells were then processed as previously described (32) for immunofluorescence, with the exception that no glutaraldehyde was added. FISH was performed as previously described (12). FISH probes were made from cenII unique cosmid sequences (26). Photographs were taken either with the same system as that for time lapse photography or with a Hammamatsu CCD device piloted with the Metaview system (Universal Imaging) on a Pentium II personal computer. Image treatment was carried out using the Gimp on a Debian GNU/Linux workstation.
Cell counting and FACS analysis.
Cell counting and viability were determined with a Coulter Counter Z1. Fluorescence-activated cell sorting (FACS) analysis was performed on a Beckman-Coulter FACS machine. For live FACS, cells were directly diluted in 50 mM sodium citrate and analyzed by FACScan. GFP signals were measured logarithmically, revealing two separate cell populations: those with and those without GFP signals. FACS analysis was performed as previously described (1).
RESULTS
Sap1 is a stable chromatin-associated protein.
We raised a polyclonal rabbit antiserum against the Sap1 protein in order to study its cellular concentration by Western blot analysis and its localization by indirect immunofluorescence. The specific antiserum reacted strongly with a polypeptide of about 30 kDa, the size expected for the Sap1 protein (Fig. 1). Under exponential cell growth conditions, 2 × 10⁷ cells contain approximately 2 ng of Sap1. With a molecular size of 30 kDa, we estimate that each cell contains about 10,000 Sap1 dimers. Since S. pombe spends 70% of its cell cycle in G2, this corresponds to 1 dimer/20 nucleosomes.
FIG. 1.
Endogenous Sap1 levels. Quantitative Western blot analysis was performed with an anti-Sap1 antibody raised against the N-terminal part of the protein. In lanes 1 to 5, crude protein whole-cell extracts corresponding to 2 × 10⁷ cells were mixed with increasing quantities of purified, truncated Sap1(1-203) protein expressed in Escherichia coli. The level of Sap1 was estimated to be 2 ng for 2 × 10⁷ cells (lanes 3 and 4). No signals are observed with the preimmune serum (data not shown).
We fixed the cells with paraformaldehyde and used rabbit anti-Sap1 antibodies and 4′,6′-diamidino-2-phenylindole (DAPI)staining for immunolocalization of Sap1. Most of the fluorescence appeared in the nucleus, with slightly more intensity at the nuclear periphery (data not shown). No major changes in localization or intensity were observed during the different stages of the cell cycle.
Mitotic sap1 loss induces abnormal mitosis.
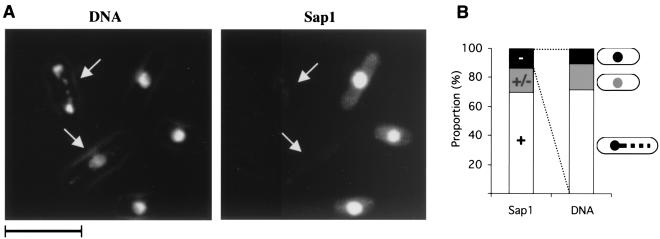
We transformed heterozygous sap1−/+ diploid cells with a full-length sap1-containing plasmid, controlled by its own promoter, and induced sporulation. sap1− germinating cells, containing a mitotically unstable plasmid, were selected, formaldehyde fixed, and analyzed by immunofluorescence with anti-Sap1 antibodies. About 20% of the cells exhibited faint or absent Sap1 nuclear staining, consistent with the plasmid loss rate. Two examples are shown in Fig. 2A, in which a reduced Sap1 signal is associated with abnormal genomic DNA staining. Quantitative analysis (Fig. 2B) indicated that the loss of Sap1 is accompanied by abnormal chromosome segregation. We also noticed that cells which were negative for Sap1 fluorescence were not elongated, indicating cell death without a significant cell cycle delay prior to mitosis. Unfortunately, the sap1− null mutation is rescued only by a plasmid expressing Sap1 from its own promoter. Therefore, Sap1 depletion using the thiamine-repressible nmt1 promoter was not possible.
FIG. 2.
Plasmid loss experiment. Haploid sap1− spores complemented by plasmid pIRT-Sap1 were selected and allowed to grow without plasmid selection. Cells that lost the plasmid died. (A) (Left) Two cells (arrows) display fragmented (upper arrow) and decondensed (lower arrow) DNA (DAPI staining). (Right) The same cells (arrows) exhibit no Sap1 staining. Bar, 10 μm. (B) The proportion of cells with no detectable level of Sap1 is 15%. Among the sap1− cells (n = 56), we observed the following phenotypes: no apparent phenotype (10%), faint DAPI staining (20%), and chromosome fragmentation (70%).
Sap1 overexpression is toxic and induces chromosome fragmentation.
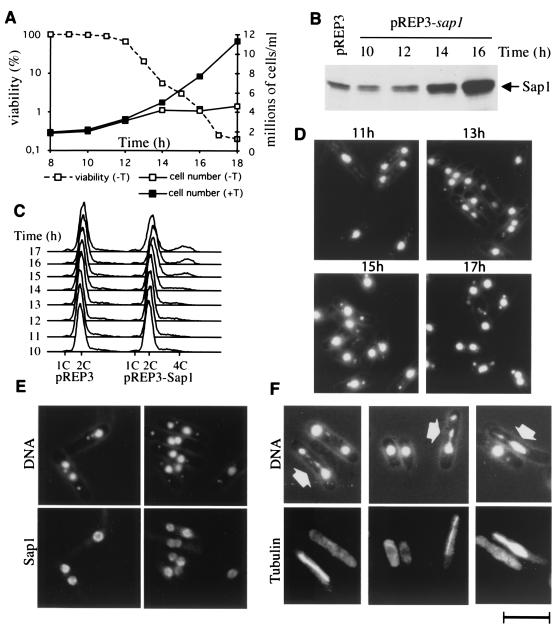
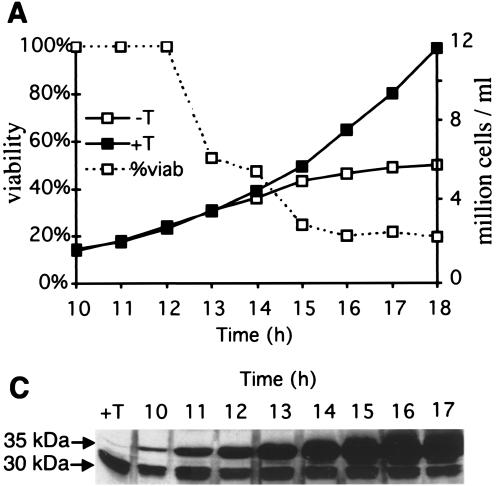
Since lack of Sap1 causes abnormal mitosis, we decided to examine the effect of overproduction of Sap1. We used the thiamine-repressible nmt1 promoter carried by plasmid pREP3 (or the attenuated plasmid pREP81 [data not shown]) to overexpress Sap1 at a high or moderate level (10, 25, 40) (see Materials and Methods for constructions). Transformed cells (wild type) were grown in thiamine-containing medium to repress ectopic sap1 overexpression and allow further investigation. Figure 3A shows that cells ceased dividing about 14 h after thiamine withdrawal and rapidly lost viability. To determine the timing and the level of expression, whole-cell extracts were prepared and analyzed by immunoblotting with the antibody against Sap1 (Fig. 3B) and by gel retardation assays using radiolabeled SAS1 as a DNA-binding target (data not shown). Sap1 products started to accumulate between 12 and 14 h after thiamine withdrawal. From these results, we conclude that an increase in the intracellular Sap1 concentration causes division arrest and cell death within one generation.
FIG. 3.
Phenotypes of sap1-overexpressing cells. PB1 h90 cells transformed with the pREP3-Sap1 plasmid were grown in repressive medium (with thiamine [+T]) or inducing medium (−T). (A) Cells were counted and plated in rich medium every hour at the indicated time points after removal of thiamine to analyze viability and growth. (B) Protein extracts were prepared from 107 cells and analyzed by Western blotting. pREP3 represents the empty control plasmid, while pREP3-sap1 carries the full-length sap1 gene. Sap1 induction occurs between 12 and 14 h after removal of thiamine, concomitant with growth arrest. (C) Culture samples were taken for FACScan analyses, which show the accumulation of a 4C population. Cells from the inducing (−T) medium were fixed and prepared for immunofluorescence. (D) DAPI staining at different time points (11, 13, 15, and 17 h), showing the phenotype of DNA dots in the cytoplasm, as well as an increase in binucleated cells (correlating with the accumulation of 4C cells in FACS analysis). (E) DAPI staining and Sap1 immunofluorescence at 15 h of Sap1 induction. (F) DAPI staining and TAT fluorescence at 15 h of Sap1 induction. Arrows indicate abnormal mitosis. Bar, 10 μm.
We next analyzed the phenotype of the dying cells by microscopy. Cell aliquots were taken at different times during sap1 induction, fixed with paraformaldehyde, and stained with the DNA-binding dye DAPI. We observed an increased proportion (>50%) of cells containing DNA spots in the cytoplasm (Fig. 3D). The number of spots per cell was consistently between 1 and 2, and their intensity appeared relatively constant. We also observed binucleated cells, which accumulate to about 20% of the dead cell population at 15 to 16 h postinduction. These phenotypes are observed in wild-type and unswitchable mutant cells and thus are not related to mating-type switching. Flow cytometry (FACScan) analysis (Fig. 3C) showed a slight increase in DNA content from 2 to 4 cell equivalents (2C to 4C) for about 20% of the cell population, consistent with DNA replication of the binucleated cells and arrest at the end of S phase or in G2. Immunofluorescence analysis showed a redistribution of Sap1 along the chromosomes, resulting in nonuniform staining of nuclei by DAPI and an absence of DNA dots (Fig. 3E). By using the TAT1 antibody directed against microtubules (55), we observed abnormal mitosis, as shown by asymmetric segregation of the genetic material (Fig. 3F). Time lapse video microscopy of living cells confirmed that more than half of the mitotic cells clearly exhibit a nonequal distribution of their chromosomes (data not shown). The kinetics of appearance of the different phenotypes are complex and indicate pleiotropic effects. All of the phenotypes described above appear within 3 h (between 12 and 15 h after induction), corresponding to a single cell generation with an overall 10-fold increase in Sap1 concentration. Interestingly, none of these phenotypes are observed when the cells are arrested at the beginning of S phase by HU, just prior to sap1 induction (data not shown). This indicates that the replication checkpoint is working during sap1 induction and that Sap1 interferes with a cellular process some time between the initiation of DNA replication and mitosis. However, the fast induction of cell death does not seem to trigger cell cycle arrest (absence of elongated cells), suggesting that checkpoint sensors detecting DNA damage between late S phase and G2 were not stimulated.
Loss of DNA in living cells.
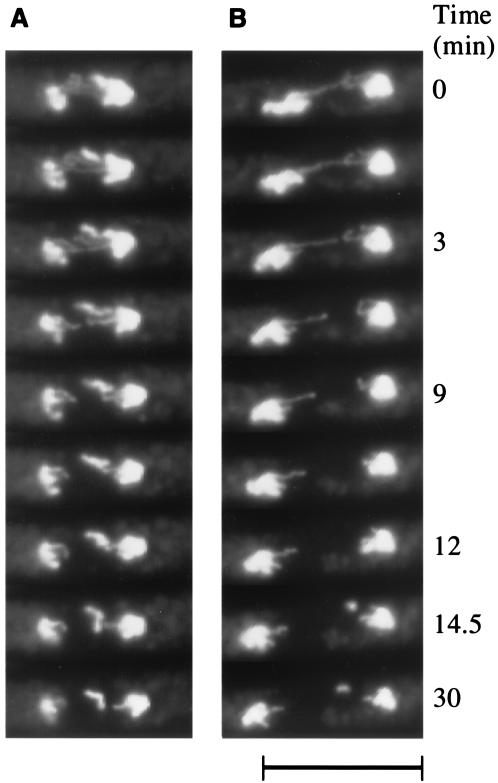
In order to precisely determine the conditions under which chromosomal DNA has been lost upon overexpression of Sap1, we used time lapse video microscopy analysis, in which the cellular DNA is stained with Hoechst 33342 (see Materials and Methods). To increase the proportion of sap1-overexpressing cells going through mitosis, the thermosensitive cdc25 mutant strain was transformed with the plasmid overexpressing sap1. Figure 4A depicts a cell undergoing unequal partitioning of the two chromosome masses at the beginning of observation (t = 0 min); 3 min later, the larger nucleus releases a broken piece of a chromosome arm, and from this point the separation of the nuclei appears to be arrested. However, the chromosome arms lagging behind are still pulled back to the main chromosome mass. A similar scenario is observed in the cell shown in Fig. 4B. For this cell, the aneuploidy is not obvious and the nuclear separation seems correct for the first 12 min, with the exception of the two lagging chromosome arms. At 14 min, a chromosome fragment is released from the right nucleus, followed by an arrest of anaphase progression. The observations from video microscopy of living cells allowed us to visualize chromosomal DNA loss in real time and indicated that at least some of the DNA dots observed during sap1 overexpression appeared during anaphase and were due to loss of chromosome pieces. Furthermore, the correlation between loss of DNA during anaphase B and arrest of mitotic segregation indicates that chromosome loss probably triggers a mitotic checkpoint apparatus. It has recently been proposed that another checkpoint control might operate during chromosome loss in anaphase (43, 57). However, the situation described here is slightly different, since only a portion of the chromosome is lost, probably due to chromatid breakage. Furthermore, the lost piece of chromatid, probably devoid of a centromere, cannot be reattached to the kinetochore, leading to cell death.
FIG. 4.
Chromosomal shearing. The thermosensitive cdc25 mutant strain, transformed with the pREP3-Sap1 plasmid and induced (with a thiamine-deficient medium) at the permissive temperature, was arrested for 4 h at the nonpermissive temperature (36°C) and then transferred at the permissive temperature (26°C) for observation of chromosome segregation. Two cells (A and B) appeared in the same camera field during time-lapsed photography. Time is indicated in minutes, and 0 min corresponds to the beginning of the observation. Bar, 10 μm.
Importantly, the presence of DNA dots is not related to mating-type switching, since very similar phenotypes are observed in switching and non-switching-proficient strains (data not shown). This conclusion was confirmed by FISH using the mat region as a probe (data not shown).
Sap1 overexpression affects plasmid supercoiling and induces chromosome breakage.
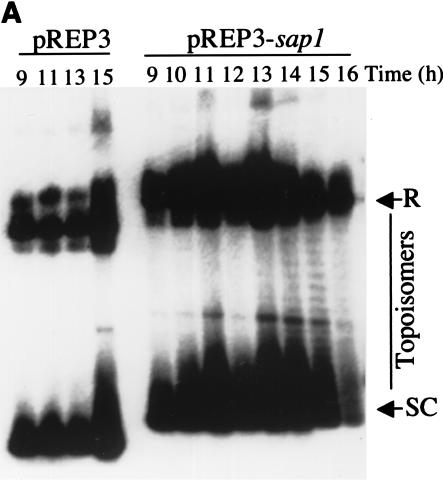
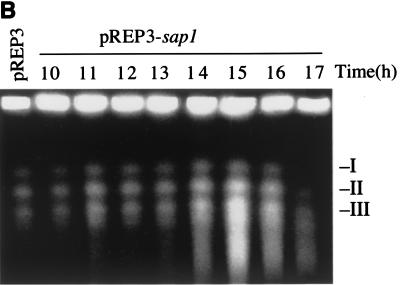
We took advantage of the sap1 overexpression plasmid to analyze its topology by Southern blot analysis during sap1 induction. We compared the plasmid topology of pREP3 with or without sap1 after thiamine removal (Fig. 5). For both plasmids, two major migrating DNA bands were observed, corresponding to supercoiled and relaxed, or dimer, plasmid forms. As expected, transcriptional induction did not change the migration pattern of pREP3 (Fig. 5A, first four lanes). In contrast, when pREP3 drove sap1 expression, new bands were observed between the supercoiled and relaxed forms during Sap1 induction, indicative of topological plasmid change. The effects were observed after 13 h of thiamine withdrawal and were concomitant with the increase in intracellular Sap1 levels. Since sap1 codes for a DNA-binding protein, it is tempting to suggest that the Sap1 protein is directly involved in this plasmid DNA relaxation. This molecular effect may explain, at least partially, the general phenotypes observed in the course of this study. We also noticed that before or after sap1 induction, the circular plasmid did not show catenated forms, suggesting no major defects of the endogenous topoisomerase II activity.
FIG. 5.
Plasmid and genomic DNA analyses during sap1 induction. pREP3 is the empty control plasmid, and pREP3-sap1 carries the full-length sap1 gene. (A) Southern blot analysis using the pUC18 plasmid as a probe. At 13 to 14 h, topoisomers accumulate in the pREP3-sap1 construct but not in the control plasmid. Positions of relaxed (R) and supercoiled (SC) forms, as well as topoisomers, are indicated. (B) PFGE analysis of genomic DNA showing chromosome shearing. Time points after removal of thiamine are given; the positions of the S. pombe chromosomes are indicated.
To confirm the chromosome breakage in sap1-overexpressing cells at the molecular level, we used PFGE. Figure 5B shows results for the three S. pombe chromosomes during Sap1 overexpression. Following sap1 induction (t = 15 h), chromosomal shearing was observed, consistent with the cellular phenotypes previously described.
The last 40 residues of Sap1 induce abnormal anaphase and chromosome instability.
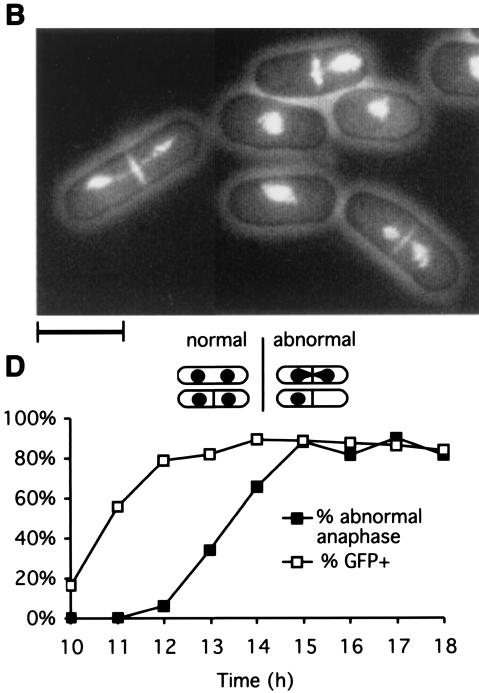
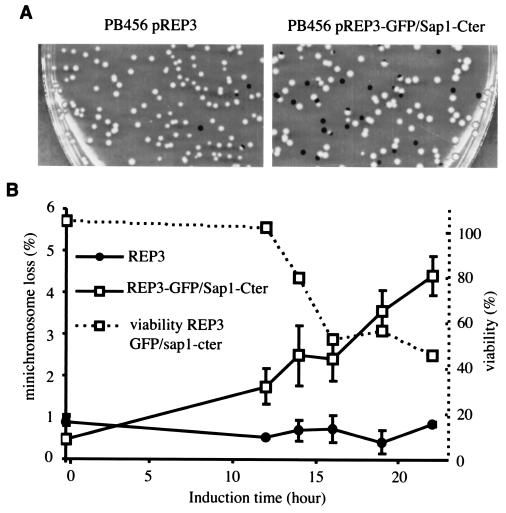
Because of the complex phenotypes described above and the oligomerization properties of Sap1, we decided to examine the phenotype induced by overexpression of Sap1-Cter. The last 40 residues were fused to GFP and to an NLS motif to restrict the localization of the protein to the nucleus. During expression of GFP-Sap1-Cter, the cells stopped dividing and partially lost viability (Fig. 6A). The same phenotype has been observed with an HA-tagged Sap1-Cter fusion protein (data not shown). Staining with the DNA-binding dye (DAPI) and a septum dye (calcofluor) indicated that overexpression of Sap1-Cter induced an abnormal mitosis and a moderate cut phenotype (uncoupling mitosis and cytokinesis) which never exceeded 40% of total cells (Fig. 6B). In order to further quantify the timing and level of the GFP-Sap1-Cter expression, Western blot (Sap1-Cter) and live flow cytometry (GFP) analyses were performed. The cut phenotype appeared 2 to 3 h after induction of the fusion protein and affected about 80% of all mitotic cells (Fig. 6C and D). FACScan analysis showed that most of the cells had a 2C DNA content during the peak of the cut phenotype (data not shown). We measured the mitotic stability of the Ch16 minichromosome carrying the ade6-216 allele trans-complementing the endogenous ade6-210 allele of the host cell. Ch16-containing cells, transformed with the GFP-Sap1-Cter vector, were grown in the absence of thiamine during GFP-Sap1-Cter induction (Fig. 7) and plated on a medium containing thiamine to repress expression of the fusion protein at limiting concentrations of adenine in order to score minichromosome loss by the appearance of red colonies. Under these conditions, a burst of GFP-Sap1-Cter expression increased the chromosome loss rate 10-fold. Because of the lethality described above, the minichromosome loss is likely to be underestimated.
FIG. 6.
Phenotypes of GFP-Sap1-Cter-overexpressing cells. PB1 h90 cells transformed with the pREP3-GFP/Sap1-Cter plasmid (see Materials and Methods) were grown in repressive (+T) or inducing (−T) medium. (A) Cells were counted and plated in rich medium every hour at the indicated time points after the removal of thiamine to analyze viability and growth. (B) The associated phenotype corresponds to a cut phenotype at 15 h of Sap1-Cter induction. Genomic DNA and the septum were stained with DAPI and calcofluor, respectively. Bar, 10 μm. (C) Protein extracts were prepared and analyzed by Western blotting. The antibody recognizes the C-terminal domain of endogenous Sap1 (30 kDa) and the ectopically expressed GFP-Sap1-Cter (35 kDa), as indicated. (D) GFP quantification and proportion of cells with abnormal anaphase. At 12 h of induction, ∼80% of cells showed a GFP signal, 3 h before the abnormal anaphase peak. The level of GFP was estimated by FACScan on living cells (see Materials and Methods).
FIG. 7.
The minichromosome strain (PB456) was transformed by the pREP3 plasmid or the pREP3-GFP/Sap1-Cter plasmid. Cells were grown in minimal medium with thiamine up to time zero; then they were washed and grown in the absence of thiamine for the following hours. Cells were plated on YE medium, and the appearance of red colonies was measured. (A) Photograph of plates at +22 h. (Left) Plasmid pREP3. (Right) pREP3-GFP/Sap1-Cter. (B) Incidence of minichromosome loss and viability during induction.
The cut phenotype appears linked to S phase.
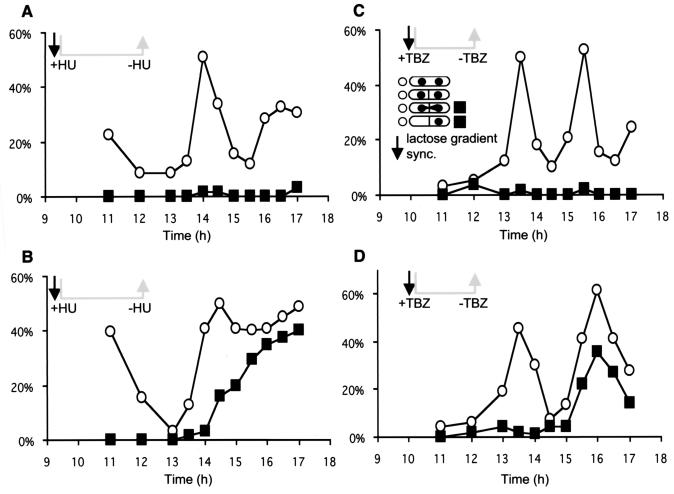
In an attempt to determine if GFP-Sap1-Cter induced the cut phenotype at a specific phase of the cell cycle, cultures were synchronized prior to expression of the fusion protein. Small, early G2 cells were isolated by centrifugation through a lactose gradient and then blocked by HU at the beginning of S phase or by TBZ in G2. We note that both drugs (HU and TBZ) are efficient, since cells stop dividing, elongate, and accumulate with 1C or 2C DNA content as determined by FACS analysis during the accumulation of the Sap1-Cter polypeptide. The cells were washed and incubated in fresh medium to enable them to resume growth, still in the absence of thiamine, maintaining the expression of the fusion protein. DAPI and calcofluor staining analysis, following drug release, indicated that cells blocked in S phase exhibited the cut phenotype mainly at the first division (Fig. 8A and B), with a 2C DNA content (data not shown). However, cells blocked in the G2 phase exhibited a cut phenotype not at the first division but only at the second (Fig. 8C and D). This result indicates that Sap1-Cter poisons a DNA replication or G2 event, which cannot be fully repaired and in turn affects faithful chromosome segregation, producing the cut phenotype and minichromosome loss.
FIG. 8.
PB1 cells were transformed with the pREP3-GFP/Sap1-Cter plasmid. During overexpression of Sap1-Cter, small G2 cells were isolated on a lactose gradient and exposed to drug treatment (HU [A and B] or TBZ [C and D]). In both cases the drug was removed by washing the cells. Cells reentered the cell cycle at either S phase (A and B) or mitosis (C and D), when the level of Sap1-Cter corresponded to the appearance of the first cuts in asynchronous cultures (the level of the GFP fusion protein was monitored by FACS for panels B and D). ▪, frequencies of cells displaying abnormal mitosis among mitotic cells; ○, total mitotic cells. Panels A and C show results for repressed controls (growth medium complemented with thiamine). The cut phenotype arises during the first mitosis for cells blocked in S phase (B) and during the second for cells blocked in G2 (D). This restricts the lethality of Sap1-Cter to S phase or G2 (but not metaphase).
The last 40 residues of Sap1 induce premature centromere separation.
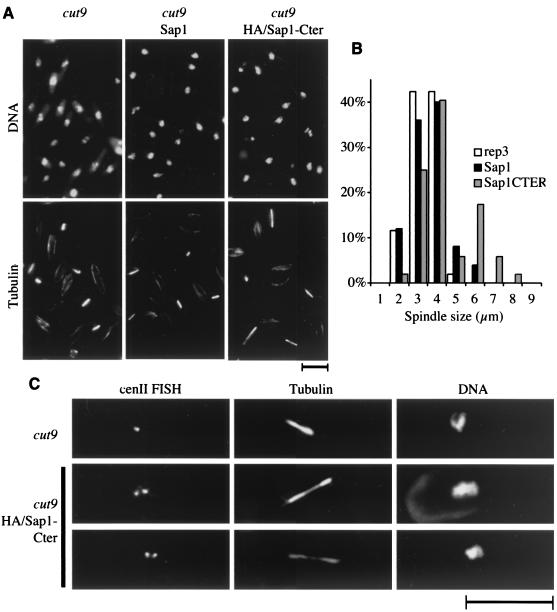
The phenotypes described above suggest that cohesion or condensation of sister chromatids might be altered by the overexpression of the last 40 residues of Sap1. To test this hypothesis, we examined the phenotype of Sap1 and Sap1-Cter overexpression in metaphase-arrested thermosensitive cut9 mutant cells (26, 56). Cut9p is an essential component of the 20S APC-cyclosome complex responsible for anaphase onset (in yeast and mammals), and it is used to block cells at the metaphase/anaphase transition at the nonpermissive temperature. The cut9ts conditional mutant strain containing either pREP3, pREP3-sap1, or pREP3-sap1-Cter was arrested in the G1 phase by nitrogen starvation and then released at the nonpermissive temperature (see Materials and Methods). After 8 h, the three transformed cut9ts cultures accumulated in metaphase with condensed chromosomes and mitotic spindles (as revealed by DAPI and microtubule antibody [TAT1] staining) (Fig. 9A). The pREP3 and pREP3-sap1 plasmids exhibited short spindles (3 to 4 μm) characteristic of metaphase-arrested cells, whereas pREP3-sap1-Cter displayed an additional population of cells (about 25%) with longer spindles (6 μm) (see distribution of spindle length in Fig. 9B). This cell population engaged the metaphase/anaphase transition, bypassing the cut9ts cell cycle arrest phenotype, but retained a second block during a later stage in anaphase (phase 3 [41]), possibly due to activation of the spindle checkpoint. A similar phenotype has been described for the Mis4/Scc2p chromatid cohesion molecule, part of the adherin family (26, 29).
FIG. 9.
cut9 cells were transformed with the pREP3, pREP3-Sap1, or pREP3-HA/Sap1-Cter plasmid. Cells were grown in repressive medium (containing thiamine) at the permissive temperature, transferred to inducing medium (lacking thiamine) for 5 h, arrested in G1 by overnight nitrogen starvation, and released in inducing medium at 36°C for 8 h. (A) Cells were fixed, analyzed by immunofluorescence using TAT antibodies (staining microtubules), and stained with DAPI. (B) Distribution of spindle length for each population. (C) Cells were subjected to FISH using cenII unique sequences. HA-tagged Sap1-Cter was used to avoid interference with FISH. Bar, 10 μm.
These observations raise the question of whether sister chromatids are prematurely separated in the presence of Sap1-Cter. To address this question, we used the FISH methodology (53) with a probe derived from the centromere II (cenII) unique sequence. Figure 9C shows an example of cut9ts arrested cells transformed with pREP3, with a typical single cenII signal, whereas two examples of cut9ts arrested cells transformed with pREP3-sap1-Cter exhibit two cenII signals. The separation of the two sister centromeres was observed in most of the elongated-spindle-containing cells and rarely in cells with typical metaphase spindle lengths. The loss of cohesion at the centromeres triggers the metaphase/anaphase transition, allowing sister chromatids to be pulled apart by the opposing forces exerted by the mitotic microtubules. This demonstrates premature loss of centromere cohesion, even though the spindle force might be responsible for the separation.
DISCUSSION
Our study introduces the sequence-specific DNA-binding protein Sap1 as a novel player in the chromosome dynamics of fission yeast. Sap1 is a relatively abundant chromatin-associated protein that is essential for viability and participates in mating-type switching. Its localization and concentration appear stable throughout the cell cycle. The connection between mating-type switching and chromosome organization is still tenuous. However, we hypothesize that mating-type switching evolved by recruiting existing cellular components used in chromosome morphogenesis. Moreover, insights into the mechanism of one process may shed light on the mechanism of the other.
Implication of Sap1 in chromosome organization.
Several lines of evidence indicate that a particular Sap1 protein concentration is essential for the maintenance of chromosomal integrity and obeys a threshold-sensing process. First, germinating sap1− spores generated from a sap1+/− heterozygote diploid strain cannot divide, indicating that Sap1 must be newly synthesized from the zygote genome early during germination. Second, plasmid loss experiments indicate that a decrease in the Sap1 concentration is associated with abnormal chromosome segregation. Third, Sap1 overexpression affects plasmid superhelicity, anaphase, and chromosomal integrity. The absence of phenotypes in HU-arrested cells during overexpression of full-length Sap1 indicates that the S-phase checkpoint is operational and suggests that cell cycle progression is required to reveal the cellular Sap1-induced cell death phenotype. Fourth, the sap1+/− heterozygote diploid has a slow growth phenotype due to an apparently extended S phase, is hypersensitive to DNA-damaging agents, and exhibits a higher rate of chromosome loss than the parental diploid (V. Ribes, B. Arcangioli, and B. Xhemalce, unpublished data). Finally, only the construction containing the endogenous sap1 promoter was able to complement the sap1− strain, while other versions, using the repressible nmt1 promoters to drive sap1 expression, failed to complement the null mutant strain. A gene dosage phenomenon has also been reported for the cohesin factor Pds5p, in which loss of function and overexpression produced the same effect with regard to the establishment of cohesion (51). The apparent sensitivity to the Sap1 dosage is consistent with the cooperative DNA-binding property of the protein (28). Biochemical and structural studies have shown that Sap1 oligomerizes and forms an unusual elongated shape in solution. This rigid structure maintains the C-terminal part of the protein 12 nm from the DNA (8) and may play an important role in Sap1 activity. Although this is speculative, we propose that excess Sap1 protein will cooperatively bind to ectopic weak DNA-binding sites along the chromosomes, interfering with normal chromosomal organization. We propose that Sap1 has a structural rather than an enzymatic function for organizing the nuclear chromatin.
The effects of Sap1 on plasmid superhelicity and genomic DNA are the early events observed following induction of the full-length protein (Fig. 3E and 5A); interestingly, these phenotypes were not observed during overexpression of Sap1-Cter, which instead induced the cut phenotype. This observation indicates that the effect on plasmid topology induced by sap1 is not due to its transcription, as was expected (42). It is conceivable that an excess of Sap1 induces a signal to remodel the chromatin, which in turn excludes Sap1 from its cognate DNA-binding sequences. The exclusion of Sap1 might be the initial event triggering abnormal anaphase. This interpretation is consistent with similarities observed during the plasmid loss experiments and overexpression. We also observed nuclear pore disorganization and nuclear envelope breakage during the accumulation of Sap1, consistent with the presence of genomic DNA in the cytoplasm. However, we cannot exclude the possibility that the spots come from clustering of the mitochondrial DNA. This phenotype was not observed with Sap1-Cter (data not shown). Chromatin compaction has been described previously for factors interacting with AT-rich scaffold-associated regions (SARs) (33, 49, 58). Similarly, the barrier-to-autointegration factor (BAF) has been shown to compact DNA and is essential for chromatin segregation (46, 59). On the other hand, the boundary of the silenced HMR domain in Saccharomyces cerevisiae (21) was shown to be sensitive to mutations in the smc1 and smc2 genes. Interestingly, the connection between insulator function and chromosome architecture proteins was also supported by a genetic study of Nipped-B (an adherin protein) in Drosophila melanogaster, which was shown to be involved in the gypsy retrotransposon insulator activity (44). In the two former cases, the interaction with DNA is nonspecific with respect to the DNA sequence, whereas in the latter case, site-specific DNA-binding proteins may be involved. Given the apparently high concentration of Sap1 and its intrinsic sequence specificity, these results are compatible with Sap1 being required for a higher-order chromosome structure participating in the functional delineation of the S. pombe chromosomes. In this context, dearth or excess of Sap1 protein can result in similar chromatin disorganization.
Expression of the last 40 residues of Sap1 in the nucleus induces an abnormal anaphase, as well as the cut phenotype, characteristic for checkpoint failure. In contrast to the extreme toxicity observed with the full-length protein, killing more than 99% of the cells in one generation, the Sap1-Cter construct killed only 60 to 80% of the cell population. Following this first wave of death, the surviving cells seemed to adapt, probably by reducing the Sap1-Cter plasmid copy number, with no effect on plasmid topology (data not shown). This intermediate toxicity allowed us to monitor the rate of minichromosome loss among the surviving cells. The minichromosome instability is consistent with the abnormal chromosome segregation observed and the sensitivity to HU (data not shown). In addition, we showed by FISH that Sap1-Cter overexpression induced premature sister chromatid separation in cut9ts metaphase-arrested cells. This result indicates that Sap1-Cter may interfere with centromere cohesion. The involvement of Sap1 in the cohesion and condensation processes is also supported by the results of a two-hybrid screen, which identified a Sap1-interacting protein (R. de Lahondès, unpublished data), an ortholog of SIZ2 from S. cerevisiae, encoding a SUMO E3 ligase and involved in a novel chromosome maintenance pathway (50). Our observations raise challenging questions about the role of sequence-specific DNA-binding proteins in sister chromatid cohesion and condensation and in chromosome stability (54).
Acknowledgments
We particularly thank J.-P. Javerzat for help with the FISH technique. We thank M. Yanagida for the cenII cosmid, minichromosome-containing strains, and the cut9 thermosensitive strain; S. Garbay for software development, help with time lapse photography, and general contributions to informatics; V. Doye and E. Herrero for providing plasmids; and A. Holmes and J. Weitzman for critical reading of the manuscript.
This work was supported in part by the Association pour la Recherche sur le Cancer and the Human Frontiers Science Program (to B.A.). R.D.L. was supported by fellowships from La Ligue Contre le Cancer.
REFERENCES
- 1.Alfa, C., P. Fantes, J. Hyams, J. McLeod, and E. Warbrick. 1993. Experiments with fission yeast. Cold Spring Harbor Laboratory Press, Cold Spring Harbor, N.Y.
- 2.Arcangioli, B. 1998. A site- and strand-specific DNA break confers asymmetric switching potential in fission yeast. EMBO J. 17:4503-4510. [DOI] [PMC free article] [PubMed] [Google Scholar]
- 3.Arcangioli, B. 2000. Fate of mat1 DNA strands during mating-type switching in fission yeast. EMBO Rep. 1:145-150. [DOI] [PMC free article] [PubMed] [Google Scholar]
- 4.Arcangioli, B., and A. J. Klar. 1991. A novel switch-activating site (SAS1) and its cognate binding factor (SAP1) required for efficient mat1 switching in Schizosaccharomyces pombe. EMBO J. 10:3025-3032. [DOI] [PMC free article] [PubMed] [Google Scholar]
- 5.Arcangioli, B., and R. de Lahondes. 2000. Fission yeast switches mating type by a replication-recombination coupled process. EMBO J. 19:1389-1396. [DOI] [PMC free article] [PubMed] [Google Scholar]
- 6.Arcangioli, B., M. Ghazvini, and V. Ribes. 1994. Identification of the DNA-binding domains of the switch-activating-protein Sap1 from S. pombe by random point mutations screening in E. coli. Nucleic Acids Res. 22:2930-2937. [DOI] [PMC free article] [PubMed] [Google Scholar]
- 7.Arcangioli, B., T. D. Copeland, and A. J. Klar. 1994. Sap1, a protein that binds to sequences required for mating-type switching, is essential for viability in Schizosaccharomyces pombe. Mol. Cell. Biol. 14:2058-2065. [DOI] [PMC free article] [PubMed] [Google Scholar]
- 8.Bada, M., D. Walther, B. Arcangioli, S. Doniach, and M. Delarue. 2000. Solution structural studies and low-resolution model of the Schizosaccharomyces pombe sap1 protein. J. Mol. Biol. 300:563-574. [DOI] [PubMed] [Google Scholar]
- 9.Barbet, N. C., and A. M. Carr. 1993. Fission yeast wee1 protein kinase is not required for DNA damage-dependent mitotic arrest. Nature 364:824-827. [DOI] [PubMed] [Google Scholar]
- 10.Basi, G., E. Schmid, and K. Maundrell. 1993. TATA box mutations in the Schizosaccharomyces pombe nmt1 promoter affect transcription efficiency but not the transcription start point or thiamine repressibility. Gene 123:131-136. [DOI] [PubMed] [Google Scholar]
- 11.Beach, D. H. 1983. Cell type switching by DNA transposition in fission yeast. Nature 305:682-688. [Google Scholar]
- 12.Bernard, P., K. Hardwick, and J. P. Javerzat. 1998. Fission yeast bub1 is a mitotic centromere protein essential for the spindle checkpoint and the preservation of correct ploidy through mitosis. J. Cell Biol. 143:1775-1787. [DOI] [PMC free article] [PubMed] [Google Scholar]
- 13.Birkenbihl, R. P., and S. Subramani. 1992. Cloning and characterization of rad21, an essential gene of Schizosaccharomyces pombe involved in DNA double-strand-break repair. Nucleic Acids Res. 20:6605-6611. [DOI] [PMC free article] [PubMed] [Google Scholar]
- 14.Carson, D. R., and M. F. Christman. 2001. Evidence that replication fork components catalyze establishment of cohesion between sister chromatids. Proc. Natl. Acad. Sci. USA 98:8270-8275. [DOI] [PMC free article] [PubMed] [Google Scholar]
- 15.Cormack, B. P., R. H. Valdivia, and S. Falkow. 1996. FACS-optimized mutants of the green fluorescent protein (GFP). Gene 173:33-38. [DOI] [PubMed] [Google Scholar]
- 16.Cremer, T., and C. Cremer. 2001. Chromosome territories, nuclear architecture and gene regulation in mammalian cells. Nat. Rev. Genet. 2:292-301. [DOI] [PubMed] [Google Scholar]
- 17.Dalgaard, J. Z., and A. J. Klar. 1999. Orientation of DNA replication establishes mating-type switching pattern in S. pombe. Nature 400:181-184. [DOI] [PubMed] [Google Scholar]
- 18.Dalgaard, J. Z., and A. J. Klar. 2000. swi1 and swi3 perform imprinting, pausing, and termination of DNA replication in S. pombe. Cell 102:745-751. [DOI] [PubMed] [Google Scholar]
- 19.Dalgaard, J. Z., and A. J. Klar. 2001. Does S. pombe exploit the intrinsic asymmetry of DNA synthesis to imprint daughter cells for mating-type switching? Trends Genet. 17:153-157. [DOI] [PubMed] [Google Scholar]
- 20.Damagnez, V., J. Tillit, A. M. de Recondo, and G. Baldacci. 1991. The POL1 gene from the fission yeast, Schizosaccharomyces pombe, shows conserved amino acid blocks specific for eukaryotic DNA polymerases alpha. Mol. Gen. Genet. 226:182-189. [DOI] [PubMed] [Google Scholar]
- 21.Donze, D., C. R. Adams, J. Rine, and R. T. Kamakaka. 1999. The boundaries of the silenced HMR domain in Saccharomyces cerevisiae. Genes Dev. 13:698-708. [DOI] [PMC free article] [PubMed] [Google Scholar]
- 22.Egel, R., D. H. Beach, and A. J. Klar. 1984. Genes required for initiation and resolution steps of mating-type switching in fission yeast. Proc. Natl. Acad. Sci. USA 81:3481-3485. [DOI] [PMC free article] [PubMed] [Google Scholar]
- 23.Engelke, U., L. Grabowski, H. Gutz, L. Heim, and H. Schmidt. 1987. Molecular characterization of h− mutants of Schizosaccharomyces pombe. Curr. Genet. 18:535-540. [Google Scholar]
- 24.Felsenfeld, G. 1996. Chromatin unfolds. Cell 86:13-19. [DOI] [PubMed] [Google Scholar]
- 25.Forsburg, S. L. 1993. Comparison of Schizosaccharomyces pombe expression systems. Nucleic Acids Res. 21:2955-2956. [DOI] [PMC free article] [PubMed] [Google Scholar]
- 26.Furuya, K., K. Takahashi, and M. Yanagida. 1998. Faithful anaphase is ensured by Mis4, a sister chromatid cohesion molecule required in S phase and not destroyed in G1 phase. Genes Dev. 12:3408-3418. [DOI] [PMC free article] [PubMed] [Google Scholar]
- 27.Gasser, S. M., and U. K. Laemmli. 1987. A glimpse at chromosomal order. Trends Genet. 3:16-22. [Google Scholar]
- 28.Ghazvini, M., V. Ribes, and B. Arcangioli. 1995. The essential DNA-binding protein Sap1 of Schizosaccharomyces pombe contains two independent oligomerization interfaces that dictate the relative orientation of the DNA-binding domain. Mol. Cell. Biol. 15:4939-4946. [DOI] [PMC free article] [PubMed] [Google Scholar]
- 29.Goshima, G., S. Saitoh, and M. Yanagida. 1999. Proper metaphase spindle length is determined by centromere proteins Mis12 and Mis6 required for faithful chromosome segregation. Genes Dev. 13:1664-1677. [DOI] [PMC free article] [PubMed] [Google Scholar]
- 30.Grewal, S. I., and A. J. Klar. 1997. A recombinationally repressed region between mat2 and mat3 loci shares homology to centromeric repeats and regulates directionality of mating-type switching in fission yeast. Genetics 146:1221-1238. [DOI] [PMC free article] [PubMed] [Google Scholar]
- 31.Gutz, H., and H. Schmidt. 1985. Switching genes in Schizosaccharomyces pombe. Curr. Genet. 9:325-331. [DOI] [PubMed] [Google Scholar]
- 32.Hagan, I. M., and J. S. Hyams. 1988. The use of cell division cycle mutants to investigate the control of microtubule distribution in the fission yeast Schizosaccharomyces pombe. J. Cell Sci. 89:343-357. [DOI] [PubMed] [Google Scholar]
- 33.Henikoff, S., and D. Vermaak. 2000. Bugs on drugs go GAGAA. Cell 103:695-698. [DOI] [PubMed] [Google Scholar]
- 34.Hirano, T. 2000. Chromosome cohesion, condensation, and separation. Annu. Rev. Biochem. 69:115-144. [DOI] [PubMed] [Google Scholar]
- 35.Hirano, T., S. C. Funahashi, T. Uemura, and M. Yanagida. 1986. Isolation and characterization of Schizosaccharomyces pombe cut mutants that block nuclear division but not cytokinesis. EMBO J. 5:2973-2980. [DOI] [PMC free article] [PubMed] [Google Scholar]
- 36.Jessberger, R., B. Riwar, H. Baechtold, and A. T. Akhmedov. 1996. SMC proteins constitute two subunits of the mammalian recombination complex RC-1. EMBO J. 15:4061-4068. [PMC free article] [PubMed] [Google Scholar]
- 37.Lehmann, A. R., M. Walicka, D. J. Griffiths, J. M. Murray, F. Z. Watts, S. McCready, and A. M. Carr. 1995. The rad18 gene of Schizosaccharomyces pombe defines a new subgroup of the SMC superfamily involved in DNA repair. Mol. Cell. Biol. 15:7067-7080. [DOI] [PMC free article] [PubMed] [Google Scholar]
- 38.Marshall, W. F., A. Straight, J. F. Marko, J. Swedlow, A. Dernburg, A. Belmont, A. W. Murray, D. A. Agard, and J. W. Sedat. 1997. Interphase chromosomes undergo constrained diffusional motion in living cells. Curr. Biol. 7:930-939. [DOI] [PubMed] [Google Scholar]
- 39.Matsumoto, T., K. Fukui, O. Niwa, N. Sugawara, J. W. Szostak, and M. Yanagida. 1987. Identification of healed terminal DNA fragments in linear minichromosomes of Schizosaccharomyces pombe. Mol. Cell. Biol. 7:4424-4430. [DOI] [PMC free article] [PubMed] [Google Scholar]
- 40.Maundrell, K. 1993. Thiamine-repressible expression vectors pREP and pRIP for fission yeast. Gene 123:127-130. [DOI] [PubMed] [Google Scholar]
- 41.Nabeshima, K., T. Nakagawa, A. F. Straight, A. Murray, Y. Chikashige, Y. M. Yamashita, Y. Hiraoka, and M. Yanagida. 1998. Dynamics of centromeres during metaphase-anaphase transition in fission yeast: Dis1 is implicated in force balance in metaphase bipolar spindle. Mol. Biol. Cell 9:3211-3225. [DOI] [PMC free article] [PubMed] [Google Scholar]
- 42.Pederson, D. S., and R. H. Morse. 1990. Effect of transcription of yeast chromatin on DNA topology in vivo. EMBO J. 9:1873-1881. [DOI] [PMC free article] [PubMed] [Google Scholar]
- 43.Pidoux, A. L., S. Uzawa, P. E. Perry, W. Z. Cande, and R. C. Allshire. 2000. Live analysis of lagging chromosomes during anaphase and their effect on spindle elongation rate in fission yeast. J. Cell Sci. 113:4177-4191. [DOI] [PubMed] [Google Scholar]
- 44.Rollins, R. A., P. Morcillo, and D. Dorsett. 1999. Nipped-B, a Drosophila homologue of chromosomal adherins, participates in activation by remote enhancers in the cut and Ultrabithorax genes. Genetics 152:577-593. [DOI] [PMC free article] [PubMed] [Google Scholar]
- 45.Russell, P., and P. Nurse. 1986. cdc25+ functions as an inducer in the mitotic control of fission yeast. Cell 45:145-153. [DOI] [PubMed] [Google Scholar]
- 46.Segura-Totten, M., A. K. Kowalski, R. Craigie, and K. L. Wilson. 2002. Barrier-to-autointegration factor: major roles in chromatin decondensation and nuclear assembly. J. Cell Biol. 158:475-485. [DOI] [PMC free article] [PubMed] [Google Scholar]
- 47.Singh, J., and A. J. Klar. 1993. DNA polymerase-alpha is essential for mating-type switching in fission yeast. Nature 361:271-273. [DOI] [PubMed] [Google Scholar]
- 48.Sjögren, C., and K. Nasmyth. 2001. Sister chromatid cohesion is required for postreplicative double-strand break repair in Saccharomyces cerevisiae. Curr. Biol. 11:991-995. [DOI] [PubMed] [Google Scholar]
- 49.Strick, R., and U. K. Laemmli. 1995. SARs are cis DNA elements of chromosome dynamics: synthesis of a SAR repressor protein. Cell 83:1137-1148. [DOI] [PubMed] [Google Scholar]
- 50.Strunnikov, A. V., L. Aravind, and E. V. Koonin. 2001. Saccharomyces cerevisiae SMT4 encodes an evolutionarily conserved protease with a role in chromosome condensation regulation. Genetics 158:95-107. [DOI] [PMC free article] [PubMed] [Google Scholar]
- 51.Tanaka, K., Z. Hao, M. Kai, and H. Okayama. 2001. Establishment and maintenance of sister chromatid cohesion in fission yeast by a unique mechanism. EMBO J. 20:5779-5790. [DOI] [PMC free article] [PubMed] [Google Scholar]
- 52.Thon, G., and A. J. Klar. 1993. Directionality of fission yeast mating-type interconversion is controlled by the location of the donor loci. Genetics 134:1045-1054. [DOI] [PMC free article] [PubMed] [Google Scholar]
- 53.Uzawa, S., and M. Yanagida. 1992. Visualization of centromeric and nucleolar DNA in fission yeast by fluorescence in-situ hybridization. J. Cell Sci. 101:267-275. [DOI] [PubMed] [Google Scholar]
- 54.van Heemst, D., E. Kafer, T. John, C. Heyting, M. van Aalderen, and D. Zickler. 2001. BimD/SPO76 is at the interface of cell cycle progression, chromosome morphogenesis, and recombination. Proc. Natl. Acad. Sci. USA 98:6267-6272. [DOI] [PMC free article] [PubMed] [Google Scholar]
- 55.Woods, A., T. Sherwin, R. Sasse, T. H. MacRae, A. J. Baines, and K. Gull. 1989. Definition of individual components within the cytoskeleton of Trypanosoma brucei by a library of monoclonal antibodies. J. Cell Sci. 93:491-500. [DOI] [PubMed] [Google Scholar]
- 56.Yamada, H., K. Kumada, and M. Yanagida. 1997. Distinct subunit functions and cell cycle regulated phosphorylation of 20S APC/cyclosome required for anaphase in fission yeast. J. Cell Sci. 110:1793-1804. [DOI] [PubMed] [Google Scholar]
- 57.Yang, S. S., E. Yeh, E. D. Salmon, and K. Bloom. 1997. Identification of a mid-anaphase checkpoint in budding yeast. J. Cell Biol. 136:345-354. [DOI] [PMC free article] [PubMed] [Google Scholar]
- 58.Zhao, K., E. Kas, E. Gonzales, and U. K. Laemmli. 1993. SAR-dependent mobilization of histone H1 by HMG-I/Y in vitro: HMG-1/Y is enriched in H1-depleted chromatin. EMBO J. 12:3237-3247. [DOI] [PMC free article] [PubMed] [Google Scholar]
- 59.Zheng, R., R. Ghirlando, M. S. Lee, K. Mizuuchi, M. Krause, and R. Craigie. 2000. Barrier-to-autointegration factor (BAF) bridges DNA in a discrete, higher-order nucleoprotein complex. Proc. Natl. Acad. Sci. USA 97:8997-9002. [DOI] [PMC free article] [PubMed] [Google Scholar]
- 60.Zhou, B. B., and S. J. Elledge. 2000. The DNA damage response: putting checkpoints in perspective. Nature 408:433-439. [DOI] [PubMed] [Google Scholar]


