

Abstract
Interferon (IFN)-α/β and interleukin (IL)-12 are cytokines critical in defense against viruses, but their cellular sources and mechanisms of regulation for in vivo expression remain poorly characterized. The studies presented here identified a novel subset of dendritic cells (DCs) as major producers of the cytokines during murine cytomegalovirus (MCMV) but not lymphocytic choriomeningitis virus (LCMV) infections. These DCs differed from those activated by Toxoplasma antigen but were related to plasmacytoid cells, as assessed by their CD8α+Ly6G/C+CD11b− phenotype. Another DC subset (CD8α2Ly6G/C−CD11b+) also contributed to IL-12 production in MCMV-infected immunocompetent mice, modestly. However, it dramatically increased IL-12 expression in the absence of IFN-α/β functions. Conversely, IFN-α/β production was greatly reduced under these conditions. Thus, a cross-regulation of DC subset cytokine responses was defined, whereby secretion of type I IFNs by CD8α+ DCs resulted in responses limiting IL-12 expression by CD11b+ DCs but enhancing overall IFN-α/β production. Taken together, these data indicate that CD8α+Ly6G/C+CD11b− DCs play important roles in limiting viral replication and regulating immune responses, through cytokine production, in some but not all viral infections. They also illustrate the plasticity of cellular sources for innate cytokines in vivo and provide new insights into the roles of IFNs in shaping immune responses to viruses.
Keywords: DC, IL-12, IFN-α/β, MCMV, LCMV
Introduction
Type I IFN-α/β and IL-12 are innate cytokines which can be induced early during certain viral infections. They play critical roles in defense against viruses through antimicrobial as well as immunoregulatory effects (1). Biologically active IL-12p70 protein is a heterodimer composed of an inducible subunit (IL-12p40) and of a subunit (IL-12p35) expressed constitutively in certain cell types but regulated in others (2). The IFN-α/β family consists of one IFN-β and multiple IFN-α cytokines that bind a unique receptor and trigger the same intracellular signaling cascades with activation of the signal transducer and activator of transcription (STAT)*-1 molecule. Early production of IFN-β and IFN-α4 can promote the subsequent expression of distinct IFN-α genes by a positive feedback mechanism (3). In contrast, high concentrations of IFN-α/β inhibit the production of IL-12 (4–8). Thus, mechanisms are in place to differentially regulate IFN-α/β and IL-12 responses.
Dendritic cells (DCs) are the most efficient APCs because they activate T lymphocytes at low concentrations of antigen and APC/lymphocyte ratios. Mouse DCs can be characterized by the expression of CD11c and divided in two major subsets: CD8α+ versus CD11b+ (9). CD8α+ and CD11b+ DCs can share a common precursor and do not necessarily belong to distinct lineages (for a review, see reference 10). However, these subsets have been reported to play different roles in the polarization of adaptive immune responses (10, 11). In addition, CD8α+ but not CD8α− DCs have been shown recently to produce IFN-α/β in vitro in response to poly(I:C) and CpG-containing oligonucleotides (12). Although a variety of cell types can be induced to express IFN-α/β, a new subset of immature DCs characterized by a plasmacytoid morphology and the expression of a specific array of membrane markers has emerged as a unique source for high level production of the cytokines upon virus-type challenges in vitro in the human (for a review, see reference 10) and in the mouse (13). DCs have been shown to be producers of IL-12 under various conditions of immune activation in vitro as well as in vivo (14), including stimulation with Toxoplasma gondii soluble tachyzoite antigen (STAg) (15). Macrophages (16–18) and neutrophils (19–21) can also produce the cytokine. Little is known, however, about the cellular sources of IFN-α/β and IL-12 and the pathways for their regulation during productive viral infections in vivo. In particular, whether plasmacytoid DCs are important for IFN-α/β responses after viral challenges is not clear, because all virus-infected cells have the potential to produce the cytokines and cell types other than DCs are primary targets for infection with many viruses.
Innate immune responses to murine cytomegalovirus (MCMV) and lymphocytic choriomeningitis virus (LCMV) are being extensively studied in our laboratory. The IFN-α/β cytokines are detected early and contribute to protection in both systems (1). In contrast, innate IL-12 responses are limited to MCMV challenges (22–24) where they are also necessary for optimal protection (1, 25, 26). The studies presented here were undertaken to characterize the cellular sources of IFN-α/β and IL-12 during infections with MCMV or LCMV, as well as the effects of IFN-α/β on their own expression and on IL-12 production during MCMV infections. CD8α+Ly6G/C+ DCs are shown to be major producers of IFN-α/β early after MCMV but not LCMV infections. The same DC subset is identified as an important contributor to IL-12 responses during MCMV infections. Interestingly, these cells differ from the DC subset producing IL-12 in response to STAg. Finally, IFN-α/β are shown to regulate DC cytokine production by enhancing their own expression while inhibiting IL-12 synthesis during MCMV infection. Taken together, these results demonstrate that DCs are an important source of IFN-α/β in some but not all viral infections, and that there is a plasticity of cellular sources for innate cytokines production. They also provide new insights into mechanisms by which IFNs regulate immune responses during viral infections.
Materials and Methods
Mice.
E26 mice (27), 129 mice deficient for the IFN-α/β receptor (IFN-α/βR−/−) and C57BL6 mice deficient for the STAT-1 molecule (STAT-1−/−) were bred under pathogen-free conditions by brother-to-sister mating in the animal care facility at Brown University, Providence, RI. They were maintained on sterile food, water, and caging. Specific pathogen free wild-type 129 (129SvEv TacFBR), 129 recombination activation gene (RAG)-2M (129S6/SvEvTac-Rag2 tm1), and 129 STAT-1−/− (129S6/SvEv-Stat tm1), mice were purchased from Taconic Farms. All mice used in experiments were 5–12 wk in age. Animals obtained from sources outside of Brown University were housed in our facility at least 1 wk before use. Handling of mice and experimental procedures were conducted in accordance with institutional guidelines for animal care and use.
In Vivo Treatments.
Infections were initiated on day 0 by intraperitoneal injection of 5 × 10⁴ or 104 plaque forming units (PFUs) of salivary gland-extracted MCMV Smith strain or 2 × 10⁴ PFUs of LCMV Armstrong clone E350. In vivo stimulations with STAg were performed by intraperitoneal injection of 20 μg of antigen in 500 μl of PBS 1×. Depletion of NK cells using anti-NK1.1 or anti–AGM-1 antibodies were performed as published elsewhere (28). The anti-Ly6G/C antibody (RB6–8C5) and the control antibody (GL113) were produced in high density culture conditions in Protein Free Medium II (Life Technologies), supplemented with 2 mM l-glutamine and 80 μg/ml gentallin. For experiments evaluating the contribution of Ly6G/C+ cells to IFN-α/β production in vivo during viral infection, mice were injected intraperitoneally with 500 μg of RB6–8C5 or GL113 (control antibody) at day 2.5 and day 0.5 before infection. Mice were anesthetized and bled before sacrifice for organ harvest, at day 1.5 after MCMV infection, at day 2 after LCMV infection, or at 6 h after STAg injection. Serum was prepared from whole blood by centrifugation at 6,000 rpm for 30 min at 4°C.
Preparation of Cell Suspensions.
Spleens were digested by collagenase (liberaseTM CI, Boehringer Mannheim) (29) and teased apart by repeating pipeting in PBS 1×, 5 mM EDTA, and 5% FCS (PBS/EDTA/FCS). Erythrocytes were osmotically lysed by ammonium chloride treatment. Thereafter, cell suspensions were kept in PBS/EDTA/FCS unless specified otherwise.
Enrichment for Specific Cell Subsets Using Magnetic Beads.
In brief, for enrichment of specific cell subsets, splenic leukocyte suspensions were pooled, resuspended at a concentration ≤2.5 × 10⁸ cells per milliliter and blocked for 15 min by incubation with 50 μg/ml of 2.4G2 antibody. For enrichment of macrophage populations, cells were further incubated for 15 min with FITC-labeled F4/80 or MOMA-1 antibodies (Serotec). Cell suspensions were enriched by using anti-CD11c, anti-CD8α, anti-CD11b, or anti-FITC magnetic beads and positive selection columns MS+ accordingly to the instructions of the manufacturer (Miltenyi Biotec). In some experiments, the flow through was also collected to retrieve cells negative for the selection marker. CD8α+ DCs were enriched from 129 RAG-2M or E26 mice by using a single step purification with CD8α magnetic beads, because these mice lack CD8 T lymphocytes. The enriched populations contained 85–95% of cells positive for the selection marker, in consistency with reports by other researchers (29).
Flow Cytometric Analyses.
Cell surface stainings were performed in PBS/EDTA/FCS unless stated otherwise, after blocking with PBS 1×, 20% FCS, 10% goat serum, and 5 μg/ml 2.4G2. A two step protocol was used involving a first incubation with a biotinylated antibody (anti-CD11c or anti-Ly6G/C) and a second incubation with streptavidin-PerCP and various combinations of directly conjugated mAbs among the following: CD8α-APC, CD8α-FITC, CD11b-APC, CD11b-FITC, CD11c-PE, F4/80-FITC, MOMA-1-FITC, Ly6G/C-APC, or corresponding isotype controls. Cells were fixed in 2% paraformaldehyde for 20 min, washed, and resuspended at ∼107 cells per milliliter before acquisition. Macrophages were defined as F4/80+CD11c− cells, CD11b+GR-1−/lowCD11c− cells, and MOMA-1+ cells, neutrophils as CD11bhighGR-1high cells, and DCs as CD11c+ CD8α+, CD11c+CD11b+, and CDL+Ly6G/C+ cells. Freshly isolated cells were evaluated for spontaneous ex vivo intracellular expression of IL-12 using an adapted protocol (30), without any culture step or brefeldin treatment, and with PBS 1×, 5 mM EDTA, 0.5% BSA, and 0.1% sodium azide as staining buffer. Briefly, cells were stained for three extracellular markers using FITC, APC, and PerCP fluorochromes. After fixation, cells were permeabilized with 1% saponin in staining buffer, blocked with 0.3 mg/ml rat IgG, and labeled with PE-conjugated anti–IL-12 antibody or control PE-conjugated rat IgG1. Acquisition was performed within 4 h of completion of the stainings.
All antibodies but F4/80 and MOMA-1 were purchased from BD PharMingen. Goat serum and rat IgG were obtained from Sigma-Aldrich. Samples were acquired using a FACSCalibur™ (Becton Dickinson), with the CELLQuest™ v3.1 software package. Laser outputs were 15 mW at 488 and 635 nm wavelengths. At least 100,000 events were collected within the leukocyte gate for analysis.
Purification of DC Subsets by FACS®.
DC subsets were purified from total CD11c+ cells by fluorescence-activated cell sorting using a FACSCalibur™ or a FACSVantage™ with a 70-μm nozzle. In brief, CD11c+ cells sorted by magnetic beads were stained with Ly6G/C-FITC, CD11c-PE, and CD8α-APC. A first gate was defined based on FSC and SSC parameters, positivity for PE signals and lack of autofluorescence (negativity for PerCP signal). Sort gates were defined within that population for FITC and/or APC positive versus negative cells. Live cells were then sorted accordingly to the recommendations of the manufacturer (Becton Dickinson). The purity and viability of the sorted population were analyzed immediately after sorting.
Quantitation of IL-12 and IFN-α/β In Sera and Conditioned Media.
Conditioned media (CM) were prepared by plating 105–106 cells per well of a 96-well flat-bottomed tissue culture plate in 10% FCS-RPMI 1640 medium. After 24-h incubation at 37°C 5% CO2, plates were centrifuged 5 min at 1,300 rpm and supernatants were harvested and tested directly in ELISA or frozen at −20°C for later titration. Commercial sandwich ELISA kits were used for both IL-12p40 and IL-12p70 (R&D Systems), as well as a custom antibody pair for IL-12p40 as described previously (24). Limits of detection were 20 pg/ml for IL-12p40 and 7 pg/ml for IL-12p70. For IFN-α ELISA, the primary antibody was a rat anti–mouse IFN-α mAb (F-18; Hycult Biotechnology, distributed by Cell Sciences), the secondary antibody a rabbit anti–mouse IFN-α polyclonal Ab (PBL Biomedical Laboratories), the tertiary antibody a horseradish peroxidase–conjugated donkey anti–rabbit F(ab′)2 Ab (Jackson ImmunoResearch Laboratories); the substrate was ABTS Peroxidase Substrate (KPL) and the standard a recombinant mouse IFN-αA from PBL Biomedical Laboratories. This IFN-α ELISA detects both recombinant mouse IFN-α (HyCult Biotechnology) and IFN-αA, but not IFN-β (PBL Biomedical Laboratories) or IFN-γ. Colorimetric changes of enzyme substrates were detected at 405 nm wavelength using a SpectraMax 250 reader (Molecular Devices). In some experiments, IFN-α/β levels in sera or CM were determined in a bioassay as published elsewhere (23). Cytokine titers were expressed as pg/ml or ng/ml for 106 cells. Limits of detection were 1,500 pg/ml for IFN-α and 8 U/ml for IFN-α/β.
RT-PCR for IFN-α/β mRNA.
Total RNA was extracted from ∼5 × 10⁶ cells as described previously (18) and subjected to DNase treatment using the “DNA-free” Kit (Ambion Inc.). After inactivation of the DNase, 1–2 μg RNA was reverse transcribed into c-DNA by using Moloney murine leukemia virus reverse transcriptase (Life Technologies). 5 μl c-DNA was used as a template for PCR amplification using primers specific for IFN-α4, IFN-αnon4, and IFN-β described in (3, 31) and synthesized by Operon. For relative quantitation, 18S rRNA were amplified together with mRNA for type I IFNs, in the same tube, using primers and competimers accordingly to recommendations from the manufacturer (Ambion Inc.) as described previously (32). Amplifications were performed in a programmable thermal cycler (PTC-200; MJ Research) with the following cycling parameters. IFN-α4 and IFN-αnon4: 32 cycles and annealing-temperature (Tann) 55°C, IFN-β: 36 cycles and Tann 56°C.
Quantitation of Viral Load.
Viral loads were quantitated in spleen and liver homogenates using NIH-3T3 cells in a standard plaque assay as described elsewhere (28).
Immunohistochemistry and Immunohistofluorescence.
Spleen sections were prepared as described previously (32) and stained for MCMV antigens, IL-12 or IFN-α/β proteins, or marginal zone macrophages. For IL-12 and IFN-α/β stainings, tissues were rehydrated in 0.1 M TRIS-buffer 0.1% Tween 20 (Sigma-Aldrich) and quenched for endogenous peroxidase. Blocking for nonspecific binding was done with normal horse serum from VECTASTAIN Quick Kit (Vector Laboratories) followed by blocking for avidin/biotin (Vector Laboratories). The primary antibodies used were polyclonal rabbit anti–mouse IFN-α/β antibody (Lee Biomolecular Research Laboratories) or the anti–IL-12 rat mAb C15.17 produced in the laboratory. Incubations were performed for 2 h at 37°C in a humidified chamber. Detection was performed using the VECTASTAIN Quick Kit followed by Vectastain substrate kit VIP (Vector Laboratories). Sections were counterstained with methyl green (Vector Laboratories). MCMV stainings were performed with the MOM fluorescein kit from Vector Laboratories, using hyperimmune serum from MCMV-infected mice as a primary antibody. Marginal zone macrophages were stained with MOMA-1-FITC. Sections were mounted with anti-fading medium Vectashield (Vector Laboratories). Images were collected digitally with a single filter cube with a Spot, RT slider camera from Diagnostics, Inc. (purchased from MVI). Images were processed for publication with AdobePhotoshop.
Statistical Analyses.
Statistical analyses were performed in Microsoft Excel 5.0 (Microsoft Corporation) using Student's two-tailed t tests. Unless otherwise indicated, mean ± standard errors (SE) are shown.
Results
Characterization of Conditions for Optimal IL-12 and IFN-α Responses to MCMV and LCMV Infections.
Peak IL-12 and IFN-α/β responses to MCMV infection are observed in the serum and spleen at 36–40 h (day 1.5) after challenge (23, 24, and data not shown). Experiments in C57BL/6 and 129 mice demonstrated that the cytokines were induced to higher levels in the 129 strain (Table I). The cytokine levels were high in E26 mice, lacking both T lymphocytes and NK cells (27) (Table I). Responses were not affected significantly in 129 mice depleted of NK cells as a result of in vivo treatment with anti-NK1.1 or anti–AGM-1 antibody treatments (data not shown) or lacking T and B lymphocytes as a result of mutation of the rag-2 gene (129 RAG-2M) (Table I). Thus, IL-12 and IFN-α/β responses to MCMV are not dependent on T, B, or NK cell functions. High viral doses (5 × 10⁴ PFUs) elicited higher levels of IL-12 but lower levels of IFN-α. Thus cytokine responses to MCMV infection can be better studied after low dose challenges in 129 mice. Peak IFN-α/β responses to LCMV infection are observed in the serum and spleen ∼48 h (day 2) after challenge (1, and data not shown). Similar levels of IFN-α were produced by 129 and C57BL/6 mice. As previously reported (5, 22), IL-12 production was not detectable after LCMV infections under these conditions. Similarly to the MCMV system, IFN-α/β responses to LCMV infections are not dependent on T or NK cell functions (Table I).
Table I.
Impact of T and NK Cell Functions on IL-12p40 and IFN-α Production in Mice Infected with MCMV or LCMV
| Treatmenta
|
Serum cytokine concentration (pg/ml)c
|
||||
|---|---|---|---|---|---|
| Strain | Virus | PFUs | n b | IL-12p40 | IFN-α |
| C57BL/6 | MCMV | 5 × 10⁴ | 7 | 1.474 ± 279 | 24,297 ± 5,742 |
| 129 | MCMV | 5 × 10⁴ | 2 | 4,314 ± 313 | 177,034 ± 28,607 |
| E26 | MCMV | 5 × 10⁴ | 3 | 3,000 ± 312 | 11,347 ± 350 |
| 129 | MCMV | 1 × 10⁴ | 17 | 2,743 ± 1,261 | 361,986 ± 110,150 |
| E26 | MCMV | 1 × 10⁴ | 8 | 2,023 ± 409 | 89,316 ± 34,985 |
| 129 RAG-2M | MCMV | 1 × 10⁴ | 7 | 1,010 ± 301 | 98,483 ± 55,425 |
| 129 | LCMV | 2 × 10⁴ | 12 | BLDd | 28,238 ± 18,742 |
| C57BL/6 | LCMV | 2 × 10⁴ | 6 | BLD | 23,934 ± 7,763 |
| E26 | LCMV | 2 × 10⁴ | 3 | BLD | 30,038 ± 4,507 |
Mice were infected intraperitoneally for 1.5 d for MCMV or 2 d for LCMV with the indicated viral dose of PFUs.
Number of mice studied.
Mean ± standard error. Cytokine titers were measured by ELISA as described in Materials and Methods.
BLD, below level of detection. Serum cytokine levels were <20 pg/ml in uninfected mice (data not shown).
Assessment of DC Contribution to IFN-α/β Production during MCMV and LCMV Infections.
To define the contribution of DCs to IFN-α/β production by hematopoietic cells from day 1.5 MCMV– or day 2 LCMV–infected mice, cytokine titers were measured in CM from total splenic leukocytes and subpopulations separated based on CD11c expression (Fig. 1 A). Cytokine production was undetectable in CM prepared with cells isolated from animals injected with vehicle only. Furthermore, although the cytokines were readily detectable in sera and in spleen homogenates (data not shown), no IFN-α/β production could be detected with any of the splenic leukocyte populations isolated from LCMV-infected mice (Fig. 1 A). In contrast, the cytokines were readily detectable by both ELISA (IFN-α) and bioassay (IFN-α/β) in the CM from total splenic leukocytes of MCMV-infected mice. The levels of cytokines produced were much higher with the populations enriched in CD11c+ cells than with total splenic leukocytes, and were greatly reduced after depletion of the CD11c+ cells. Neutrophils and macrophages enriched from day 1.5 MCMV–infected mice did not secrete detectable levels of IFN-α/β proteins (data not shown). Thus, these results show that DCs are major producers of IFN-α/β during MCMV but not LCMV infections in vivo.
Figure 1.

IFN-α/β production by DCs during MCMV versus LCMV infections. Mice were infected intraperitoneally for 1.5 d with 104 PFUs MCMV, or for 2 d with 2 × 10⁴ PFUs LCMV, or vehicle treated. The contribution of DCs to IFN-α/β production was then evaluated. (A) IFN-α/β (top graph, bioassay) and IFN-α (bottom graph, ELISA) titers in 24 h CM from CD11c-enriched (CD11c+), unfractionated (total), and CD11c-depleted (CD11c−) splenic leukocyte populations isolated from 129 mice. The data shown are representative of nine independent experiments for MCMV and three experiments for LCMV. The percentages of CD11c+ cells were generally <2% in CD11c− fractions and ranged from 3–7% in unfractionated splenic leukocytes versus 85–95% in enriched DC populations. BLD indicates below limit of detection (i.e., <1,500 pg/ml IFN-α or <8 U/ml IFN-α/β). Similar results were obtained in C57BL/6 mice (three experiments for MCMV and one for LCMV). (B) Analyses of the expression of IFN-α/β mRNA by splenic leukocytes freshly isolated from day 1.5 MCMV–infected or vehicle-treated 129 mice and fractionated for CD11c expression. (C) Levels of IFN-α/β production in 24 h CM from total CD11c-enriched (CD11c+) versus CD11c+CD8α+-enriched (CD8α+) cell populations from day 1.5 MCMV–infected 129 RAG-2M mice. Similar results were obtained with CD8α+ cells enriched from E26 mice (data not shown).
To determine whether specific genes of the IFN-α/β family were expressed preferentially in DCs from MCMV-infected mice, RNA samples extracted from total, CD11c+, and CD11c− splenic leukocyte populations were analyzed by relative RT-PCR (Fig. 1 B). Transcripts for IFN-β, IFN-α4, and non–IFN-α4 were all detectable in the samples from day 1.5 MCMV–infected mice, but not in those from vehicle-treated animals. The IFN-α/β mRNA to 18S rRNA ratio were higher in CD11c+ cells and lower in CD11c− cells as compared with total splenic leukocytes. These results show that mRNA for all three subtypes of type I IFN are expressed preferentially in DCs during MCMV infections in vivo.
To determine whether a specific subset of DCs contributed preferentially to IFN-α/β production, CD8α+ DCs were enriched from MCMV-infected RAG-2M mice, lacking other populations of CD8α+ cells (Fig. 1 B). The levels of the cytokines produced by the CD8α DCs were further increased over those produced by total CD11c+ DCs. These results demonstrated that DCs, especially of the CD8α+ subset, were the major producers of IFN-α/β in ex vivo cultures of splenic leukocytes from MCMV-infected mice. Further experiments were undertaken to determine whether the CD8α+ DCs producing IFN-α/β during MCMV infection in vivo were related to the Ly6G/C+ immature plasmacytoid DCs producing IFN-α/β in response to viral-type challenges in vitro (13). High levels of IFN-α/β were produced by Ly6G/C+ DCs (>98% CD11c+, >95% Ly6G/C+, 0.67 μg/ml IFN-α, 11,000 U/ml IFN-α/β) and CD8α+Ly6G/C+ DCs (>98% CD11c+, >95%CD8α+Ly6G/C+, 1 μg/ml IFN-α, 8,500 U/ml IFN-α/β) purified from MCMV-infected mice. In contrast no or very low levels of the cytokines were produced by Ly6G/C− DCs (>99% CD11c+, <1% Ly6G/C+, IFN-α undetectable, 123 U/ml IFN-α/β). The treatment of mice with an anti-Ly6G/C antibody before MCMV challenge depleted the majority of the CD8α+Ly6G/C+CD11b− DCs (Fig. 2 A), whereas no significant changes where observed in the percentages of CD11b+ DCs or in the staining for marginal-zone macrophages in spleen sections (data not shown). This treatment also resulted in a dramatic reduction in production of serum IFN-α/β (Fig. 2 B). The decrease in serum type I IFNs levels was at least partially due to the depletion of cytokine-producing Ly6G/C+ DCs as the in vivo antibody treatment also abrogated the ex vivo IFN-α/β production in the CM from enriched CD11c+ cells (60 ng/ml IFN-α and 3,000 U/ml IFN-α/β versus 3 ng/ml, 250 U/ml). A significant increase in viral loads was observed in mice treated with the anti-Ly6G/C antibody as compared with those injected with control antibody (4.48 versus 3.62 log PFU/g of spleen, P < 0.05). By contrast, although the anti-Ly6G/C treatment also depleted the majority of the CD8α+Ly6G/C+CD11b− DCs in LCMV-infected mice (Fig. 2 A), it did not reduce the production of serum IFN-α/β (Fig. 2 B). Taken together, these results show that Ly6G/C+CD8α+ DCs are major producers of IFN-α/β during MCMV, but not LCMV, infections in vivo, and suggest that this response is important for the control of viral replication.
Figure 2.

Impact of in vivo depletion of Ly6G/C+ cells on IFN-α/β production during MCMV versus LCMV infections. (A) Flow cytometry analysis of the percentages of CD8α+Ly6G/C+ cells within splenic DCs from mice uninfected, infected by MCMV or by LCMV, and untreated or injected with anti-Ly6G/C versus control antibody. (B) Titration of IFN-α (ELISA, black bars) and IFN-α/β (bioassay, gray bars) in the sera from the same mice. The sera of the mice injected with the antibodies but uninfected were negative for IFN-α/β (data not shown). The data shown are representative of three independent experiments in 129 mice for MCMV and one for LCMV. Similar results were obtained in C57BL6 mice (2 and 1 experiments, respectively).
Assessment of DC Contribution to IL-12 Production.
Studies evaluating IL-12p40/p70 production in culture and IL-12p40 expression intracellularly were performed to characterize the cells producing this cytokine. Cytokine production was very low to undetectable in CM prepared with cells isolated from animals injected with vehicle only. Similarly to what was observed for IFN-α/β, CD11c+ cells were major producers of IL-12p40 and IL-12p70 in ex vivo splenic leukocyte cultures from MCMV-infected mice (Fig. 3 A). Even higher levels of IL-12 were produced by CD8α+ DCs enriched from RAG-2M mice (Fig. 3 B) and by purified CD8α+Ly6G/C+ DCs (26 ng/ml). Neutrophils and macrophages enriched from d1.5 MCMV-infected mice did not secrete detectable levels of IL-12 (data not shown). These results show that DCs, especially of the CD8α+Ly6G/C+ subset, are the major producers of IL-12 in ex vivo cultures of splenic leukocytes from MCMV-infected mice.
Figure 3.
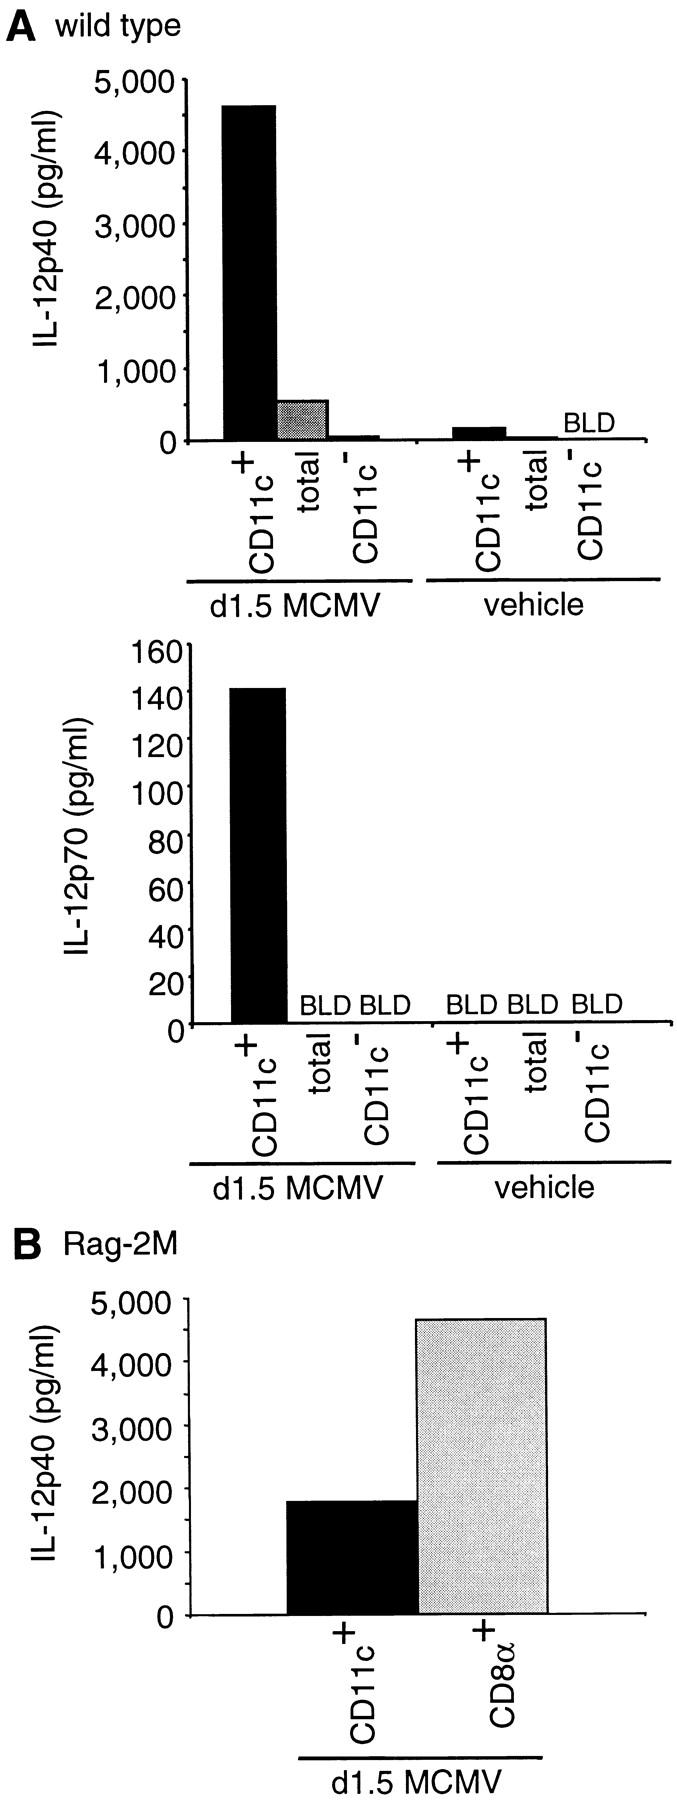
IL-12 production by DCs during MCMV infection. The samples used and number of experiments performed are identical to those of Fig. 1 A and C. (A) IL-12p40 and p70 titers in 24 h CM from splenic leukocytes sorted for CD11c expression. (B) IL-12p40 titers in 24 h CM from CD11c-enriched (CD11c+) versus CD11c+CD8α+-enriched (CD8α+) cell populations from day 1.5 MCMV–infected 129 RAG-2M mice. Limits of detection were 20 pg/ml for IL-12p40 and 7 pg/ml for IL-12p70. Similar results were obtained with CD8α+ cells enriched from E26 mice and with purified CD8α+Ly6G/C+ DCs from immunocompetent 129 mice (data not shown).
Using flow cytometry for intracellular IL-12p40 and several membrane markers, the DC subsets producing IL-12 after MCMV challenge were further characterized by comparison to those responding to STAg (15) (Fig. 4). IL-12p40 was clearly expressed in CD11c+ cells from day 1.5 MCMV–infected mice, with a staining intensity comparable to that observed in response to STAg injection but with a higher frequency of positive cells. IL-12 was not detected in macrophages or neutrophils (data not shown). After both STAg and MCMV challenges, the CD8α+ DCs were the main producers of IL-12, but the CD11b+ DCs also contributed to up to one-third of the response to MCMV. In both cases, the IL-12+ DCs expressed the class II molecules of the major histocompatibility complex (I-Ab). In contrast, the IL-12–producing DCs elicited by MCMV, but not STAg, expressed Ly6G/C and moderate levels of B220. CD8α was mostly coexpressed with Ly6G/C and to a lesser extent with B220 on IL-12+ DCs, whereas CD11b had mutually exclusive expression with CD8α and Ly6G/C. Thus, the DCs are major producers of IL-12 in response to MCMV challenge in vivo. However, the subsets elicited in response to this virus are different from those activated by STAg, with the CD8α+Ly6G/C+CD11b− DCs being responsible for most of IL-12 production but the CD8α− Ly6G/C−CD11b+ DCs contributing as well.
Figure 4.
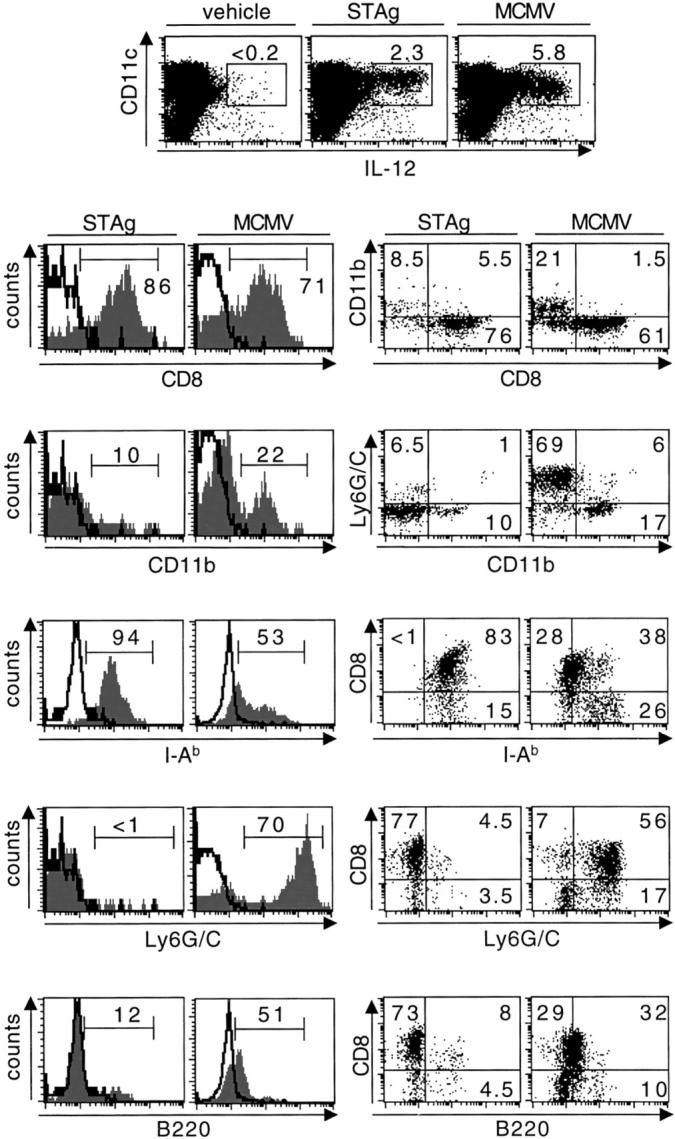
Comparative phenotypic analysis of the DC-producing IL-12 in response to STAg versus MCMV. The top dot plots show intracellular staining for IL-12p40 in CD11c-enriched cell populations from splenic leukocytes of 129 mice injected with vehicle or with STAg, or infected with MCMV. Note that IL-12 is expressed only in CD11c+ cells. Histogram plots show the stainings with antibodies specific for various membrane markers (gray area) versus isotype control (black line) within the IL-12+ DC gate. The dot plots show the relative distribution of various pairs of membrane markers within IL-12+ DC gate. Percentages of cells within IL-12 gates, histograms markers, or dot-plot quadrants are shown on the graphs. The data shown are representative of three independent experiments for MCMV infection.
IFN-α/β Regulation of IL-12 Production by DCs during MCMV Infection.
The IFN-α/β cytokines have been previously reported to inhibit IL-12 production (4–8). To characterize the cellular site of this regulation during MCMV infection, the nature of the cells producing IL-12 was examined in 129 mice deficient for IFN-α/β functions as a result of either IFN-α/β receptor mutation (IFN-α/βR−/−), STAT-1 mutation (STAT-1−/−), or IFN-α/β-producing cell depletion by anti-Ly6G/C antibody treatment. Higher levels of IL-12p40 and IL-12p70 were produced in vivo in the sera and ex vivo in DC CM from IFN-α/βR−/− as compared with IFN-α/βR+/+ mice early after MCMV infection (Table II and data not shown). This correlated with increased percentages of DCs producing IL-12 as assessed by intracellular staining (Table II), whereas the cytokine could still not be detected in neutrophils and macrophages (data not shown). The higher IL-12 production by DCs from IFN-α/βR−/− mice resulted from an enhanced recruitment of the CD11b+ subset for this function, with dramatic increases both in the percentages of CD11b+ DCs producing IL-12 (Fig. 5 A and Table II) and in the mean fluorescence intensity (MFI) for IL-12 staining in these cells (Fig. 5 B). Disruption of IFN-α/β functions had smaller effects on the production of IL-12 by CD8α+ DCs (Fig. 5 and Table II). As a result, CD11b+ DCs became a major population for IL-12 production in IFN-α/βR−/− mice, with an overall contribution equal to, or higher than, CD8α+ DCs (Fig. 5). Similar results were obtained in STAT-1−/− mice (Fig. 5 and Table II), showing that the inhibition of IFN-α/β on IL-12 production was mediated downstream of STAT-1–dependent events. Hence, during MCMV infection, IFN-α/β responses limit IL-12 production by DCs, with preferential regulation on the CD11b+ subset. The recruitment of cell types for IL-12 production is restricted to DC subsets as other splenic leukocyte populations do not appear to express the cytokine even in the absence of IFN-α/β functions.
Table II.
Impact of IFN-α/β Functions on IL-12 Production by DC Subsetsf
| Stain or treatment | n a | IL-12p40 (pg/ml)
|
Percentage of IL-12+ cells within DC subsetsb
|
|||
|---|---|---|---|---|---|---|
| Serab | DC CMc | CD11c+ | CD8α1 | CD11b+ | ||
| IFN-α/βR+/+ | 4 | 2,821 ± 288 | 2,222 | 13.5 ± 0.7 | 28.8 ± 0.8 | 5.2 ± 0.5 |
| IFN-α/βR−/− | 4 | 7,975 ± 1,034d | 8,285 | 20.4 ± 2.6e | 39.9 ± 1.8d | 14.3 ± 2.4d |
| STAT-1+/+ | 3 | 2,211 ± 508 | ND | 6.7 ± 1.9 | 24.4 ± 3.7 | 5.5 ± 0.7 |
| STAT-1−/− | 3 | 4,060 ± 152 | ND | 10.5 ± 1.1g | 27.4 ± 1.5g | 13.7 ± 1.9e |
| Control Ab | 4 | 2,121 ± 498 | 13,064 | 3.8 ± 0.7 | 16.1 ± 3.0 | 2.8 ± 1.1 |
| Anti-Ly6G/C | 4 | 2,878 ± 226g | 6,240 | 5.3 ± 0.6h | 8.1 ± 1.3e | 9.2 ± 1.1d |
Mice were infected intraperitoneally for 1.5 d with 104 PFUs MCMV.
Data from IFN-α/βR+/+ versus IFN-α/βR−/− are from one representative experiment out of three.
Number of mice per group.
Mean ± standard error.
24-h CM from enriched DCs.
P < 0.001.
P < 0.005.
P < 0.01.
NS.
P < 0.05.
Figure 5.

Impact of IFN-α/β functions on IL-12 production by DCs in vivo during MCMV infection. IFN-α/βR+/+, IFN-α/βR−/−, STAT-1+/+, STAT-1−/−, untreated, control antibody-treated, or anti-Ly6G/C-treated 129 mice were infected intraperitoneally for 1.5 d with 104 PFUs MCMV. The percentages and phenotypes of the DCs expressing IL-12p40 were then evaluated by flow cytometry. (A) Percentages of IL-12+ cells within DCs (CD8α+CD11b− DCs: gray bars; CD8α−CD11b+ DCs: black bars; and CD8α−CD11b− DCs: white bars). (B) MFI for IL-12 staining in CD8α+CD11b− DCs (gray bars) versus CD8α−CD11b+ DCs (black bars). The data shown are representative of three independent experiments for IFN-α/βR−/−. Similar results were obtained in STAT-1−/− mice on the C57BL6 genetic background (data not shown). CD8α and CD11b were consistently found to have mutually exclusive expression on IL-12+ DCs in the experimental systems described here.
The differences in the production of IL-12 by DC subsets were not due to an intrinsic increased reactivity of CD11b+ DCs from mice deficient in IFN-α/β responses, because STAg challenge did not induce detectable expression of type I IFNs and there were no significant differences in the levels and sources of IL-12 production after STAg stimulation of IFN-α/βR−/− mice (data not shown). They were, however, associated with elevated viral replication. Viral burdens were significantly increased in the spleen of IFN-α/βR−/− as compared with wild-type mice at day 1.5 MCMV infection (5.61 vs. 4.92 log PFU/g of spleen, P < 0.001). Immunohistofluorescence studies of splenic sections demonstrated that MCMV antigens were primarily observed in discrete foci within the marginal zone in IFN-α/βR+/+ mice (Fig. 6 A). IL-12 expression localized to the same areas (Fig. 6 B). Consistent with the increased viral burden in IFN-α/βR−/− mice, MCMV antigen expression extended through a ring encompassing the marginal zone and spreading toward both red and white pulp areas. IL-12 staining was also more intense and its pattern of distribution changed in parallel with MCMV antigens. Thus, IL-12 is produced in vivo at the local sites of MCMV antigen expression, and the enhanced recruitment of CD11b+ DCs for production of the cytokine in the absence of IFN-α/β responses is associated with local changes in viral loads or cell tropism.
Figure 6.

Localization of MCMV antigen, IFN-α/β, and IL-12 in the spleen. Immunohistochemistry or immunofluorescence were performed on spleen sections from uninfected or day 1.5–infected IFN-α/βR+/+ and IFN-α/βR−/− mice. (A) Staining for MCMV antigen by immunofluorescence (scale bars represents 1 mm for the larger photographs and 100 μm for the inserts). (B) IL-12 and (C) IFN-α/β staining by immunohistochemistry (scale bars represents 100 μm for the larger photographs and 50 μm for the insert).
Blocking endogenous IFN-α/β production during MCMV infection by in vivo depletion of the CD8α+ Ly6G/C+CD11b− DCs did not significantly affect the production of IL-12 in serum and DC CM (Table II), although these cells were a major source of IL-12 production in immunocompetent mice. IL-12 responses were maintained in mice treated with anti-Ly6G/C antibody as a result of increased production by CD11b+ DCs, compensating for the loss of CD8α+Ly6G/C+CD11b− DCs (Fig. 5 A and Table II). Taken together, these data demonstrate the plasticity of DC responses for IL-12 production and identify a new mechanism for cross-regulation between DC subsets, the CD8α+Ly6G/C+CD11b− cells limiting IL-12 production by the CD8α-Ly6G/C−CD11b+ ones through secretion of IFN-α/β.
Positive Feedback Regulation of IFN-α/β Production by DCs during MCMV Infection.
IFN-α/β have been reported to amplify their own expression by positive feedback (3). Indeed, at times when MCMV replication and viral antigen expression were increased in IFN-α/βR−/− as compared with IFN-α/βR+/+ mice (Fig. 6 A), IFN-α/β protein production was decreased in splenic sections (Fig. 6 C). Significant decreases in IFN-α/β levels were also observed in the sera and in the DC CM of IFN-α/βR−/− mice (Table III). These results show that high level production of IFN-α/β by DCs during MCMV infection in vivo are achieved partially through a positive immunoregulatory feedback at the level of DC expression and not only as a direct response to viral determinants. They also dissociate the conditions optimizing IFN-α/β versus IL-12 responses during MCMV infections.
Table III.
Impact of IFN Functions on IFN-α Production by DCs
| Strain | n a | IFN-α (pg/ml)
|
|
|---|---|---|---|
| Serab | DC CMc | ||
| IFN-α/βR+/+ | 4 | 382,270 ± 11,607 | 40,870 |
| IFN-α/βR−/− | 4 | 99,430 ± 14,181d | 12,390 |
Mice were infected intraperitoneally for 1.5 d with 104 PFUs MCMV.
Data are from one representative experiment out of three.
Number of mice per group.
Mean ± standard error.
24-h CM from enriched DCs.
P < 0.001.
Discussion
IFN-α/β and IL-12 play critical roles for defense against viral infections and are differentially regulated. Little is known, however, about the cellular sources for these cytokines and their regulation during viral infections in vivo. Here, CD8α+Ly6G/C+CD11b− DCs are shown to be major producers of both IL-12 and IFN-α/β early after MCMV, but not LCMV, challenges. The data presented extend our previous reports documenting IFN-α/β inhibition of IL-12 production, by also establishing that this regulatory mechanism can be mediated at the level of DC subpopulations, with the production of IFN-α/β by CD8α+ DCs resulting in STAT-1–dependent responses limiting IL-12 expression by CD11b+ DCs. These studies demonstrate the plasticity of innate cellular responses and characterize key events in the shaping of these during viral infections. Taken together, they also provide new insights into how these early events and innate responses may act to regulate downstream adaptive responses.
T, B, and NK cells were not required for IFN-α/β production in vivo during MCMV infection and spleen granulocytes and macrophages enriched from infected mice did not secrete detectable levels of the cytokines. In contrast, DCs, especially of CD8α+Ly6G/C+ subset, produced large amounts of IFN-α/β. Furthermore, Ly6G/C+ cells were necessary for IFN-α/β production in sera and DC CM. These results suggest that CD8α+Ly6G/C+ DCs may be the only producers of IFN-α/β in vivo. Alternatively, they may be the initial sources of the cytokines triggered directly in response to virus challenge and inducing downstream expression of IFN-α/β by other cell types in a positive immunoregulatory feedback (1, 3). Indeed, IFN-α/β functions were shown to be required for high production of the cytokines, both in vivo during MCMV challenge and ex vivo by DCs enriched from infected mice. However, the lack of requirement of T, B, and NK cells for type I IFNs production, the absence of detectable secretion of the cytokines by cell populations enriched in macrophages and neutrophils, and the decreased production by populations depleted of CD11c+ cells suggest that DCs are the major producers of IFN-α/β in response to MCMV infection in vivo and that the positive feedback mechanism for the production of the cytokines acts at the level of the DCs themselves. The major mouse cells producing IFN-α/β in response to in vitro viral challenges have been recently reported as CD11c+ CD8α−Ly6G/C+CD11b− plasmacytoid immature APC (13). These cells upregulate CD8α after 24 h of culture, particularly when exposed to viruses or other activators. Taken together with the results presented here, the studies suggest that activated CD8α+Ly6G/C+CD11b− DCs are major producers of IFN-α/β in vivo during MCMV infection and that they likely derive from plasmacytoid CD11c+CD8α−Ly6G/C+CD11b− immature APC.
Although virtually any cell type can be induced to express IFN-α/β if appropriately stimulated, MCMV infection is shown here to preferentially induce production of these cytokines in a small subset of specialized cells, the plasmacytoid DCs. Thus, during certain viral infections, plasmacytoid DCs are major contributors to global IFN-α/β production and must therefore, play an important role in any responses downstream of these cytokines (1). This may not be a universal situation, however, because the cell types infected or the nature of the stimuli delivered by microbial products may result in stimulating IFN-α/β production by other populations. Indeed, challenges with inactivated herpes simple virus have been reported to stimulate IFN-α/β production by marginal zone macrophages (33). A striking result presented here is that DCs do not contribute significantly to the IFN-α/β responses observed in the sera and spleens of mice infected with LCMV Armstrong. Because some strains of LCMV have been reported to infect DCs (34) and the in vivo targets for MCMV replication have not been clearly identified, further experiments will be needed to compare these viruses for DCs tropisms in vivo, relative to cellular sources for innate cytokine production. Nevertheless, it is interesting to note that there is low to no detectable IL-12 expression during infections with a variety of LCMV isolates, including those reported to infect DCs, under conditions inducing IFN-α/β responses (unpublished data). Thus, there are other reasons to believe that the stimulation for innate cytokine responses is delivered to different cell populations during LCMV as compared with MCMV infections.
The characterization of CD8α+ DCs as major producers of IL-12 after MCMV infection is consistent with the cell type producing IL-12 in response to STAg challenge. However, the CD8α+ DC subsets recruited in response to MCMV differ from those activated by STAg as they express a specific array of membrane markers, in particular Ly6G/C, linking them to the plasmacytoid IFN-producing DCs. Indeed, the main producers of IL-12 and IFN-α/β during MCMV infection in vivo were found to belong to the same CD8α+Ly6G/C+CD11b− subset of DCs. Although we cannot exclude the possibility that these cells correspond to a different maturation stage of the same DC populations producing IL-12 in response to STAg stimulation, we favor the hypothesis that they arose from different precursors expressing different arrays of receptors for microbial products. Future studies examining the expression of receptors, such as the Toll-like molecules, on these different DC subsets, as well as their function for innate cytokine responses to viral infections, may help to understand their functional specialization and ontogenic relationships.
A broader range of DC subsets was also induced to produce IL-12 during MCMV as compared with STAg challenges, including CD11b+ cells, and the contribution of this subset was dramatically increased in the absence of IFN-α/β functions. Although CD8α− DCs lack the ability to secrete IL-12 under various conditions in vitro and in vivo (12, 14), they were recently shown to be the main producers of this cytokine in response to heat-killed Brucella abortus, in an IL-10–regulated way (35). Here, conditions of antigenic stimulation and cytokine regulation are defined, i.e., MCMV infection in the absence of IFN-α/β functions, where CD11b+ DCs produce high levels of IL-12 in vivo. As the conditions also are associated with increased viral replication and spread through the spleen, changes may occur in viral tropism in the absence of IFN-α/β functions as reported during infections with other viruses (for a review, see reference 36). Thus, enhanced exposure to virus or virus-infected cells may have contributed to the elevated CD11b+ DC production of IL-12 in IFN-α/βR−/− mice. However, no changes in the level and sources of IL-12 production were observed in mice deficient for the IFN-γ receptor or for the STAT-4 molecule, even though viral replication was also increased in these immunodeficient animals (data not shown). Furthermore, previous studies, from our laboratory in the mouse and from others in human systems, have shown that IFN-α/β inhibit IL-12 production in vitro in response to nonreplicative stimuli such as LPS or SAC (4–8). Therefore, it is likely that IFN-α/β inhibition of IL-12 production by CD11b+ DCs in vivo during MCMV infection results at least in part from immunoregulatory mechanisms.
In summary, we have shown that CD8α+Ly6G/C+CD11b− DCs play a central role in innate immune responses to MCMV infection as major producers of IL-12 and IFN-α/β, both cytokines involved in the activation of antiviral NK and T cell immune responses (36). Moreover, our results suggest a new mechanism for cross-regulation between DC subsets, the production of IFN-α/β by the CD8α+ DCs inhibiting IL-12 expression by the CD11b+ DCs. The biological consequences of these responses are not yet completely understood but they may have multiple effects on promoting the endogenous immune responses most protective against MCMV infections while acting to limit potentially detrimental responses (37). For example, the conditions leading to high production of IL-12 by DCs are linked to decreased production of IFN-α/β and would therefore, trigger strong NK cell IFN-γ secretion but weaker cytotoxic activity. This might be detrimental to the host because NK killing has been shown to contribute to defense against MCMV-induced disease and because excess production of IL-12 can lead to cytokine-mediated disease (36). Likewise, because CD8α+ DCs have been reported to have unique capabilities for cross-priming cytotoxic T lymphocytes (38, 39) and CD11b+ DCs may be more efficient at activating CD4 T cells (39, 40), the responses may act to potentially limit IL-12– and CD4 T lymphocyte-induced immunopathology and to promote the development of strong CD8 T cell responses. Thus, these observations provide new insights into the mechanisms by which IFN-α/β may shape innate and adaptive responses to promote health over disease during certain viral infections.
Acknowledgments
The authors wish to thank Drs. Laurent Brossay and George Yap (Brown University) for reagents and critical reading of the manuscript. We are also grateful to Dr. Julio Aliberti, Aarthi Ashok, and Khuong (Ken) Nguyen for insightful discussions and/or expert assistance. Thanks to Sara Spangenberger and Dr. Paul McMillan for help with the cell sorting experiments.
This work was supported by National Institutes of Health grant CA41268. M. Dalod was supported by the French Association for Research against Cancer, the Philippe Foundation, and the Cancer Research Institute. T. Salazar-Mather was supported by National Institutes of Health grant KO1-CA79076. L. Malmgaard was supported by a fellowship from the faculty of health sciences, Aarhus University, Denmark.
T.P. Salazar-Mather and L. Malmgaard contributed equally to this work.
Footnotes
Abbreviations used in this paper: CM, conditioned media; DC, dendritic cell; LCMV, lymphocytic choriomeningitis virus; MCMV, murine cytomegalovirus; PFU, plaque-forming unit; RAG, recombination activation gene; STAg, soluble tachyzoite antigen; STAT, signal transducer and activator of transcription.
References
- 1.Biron, C.A. 1999. Initial and innate responses to viral infections: pattern setting in immunity or disease. Curr. Opin. Microbiol. 2:374–381. [DOI] [PubMed] [Google Scholar]
- 2.Hochrein, H., M. O'Keeffe, T. Luft, S. Vandenabeele, R.J. Grumont, E. Maraskovsky, and K. Shortman. 2000. IL-4 is a major regulatory cytokine governing bioactive IL-12 production by mouse and human dendritic cells. J. Exp. Med. 192:823–833. [DOI] [PMC free article] [PubMed] [Google Scholar]
- 3.Marie, I., J.E. Durbin, and D.E. Levy. 1998. Differential viral induction of distinct interferon-α genes by positive feedback through interferon regulatory factor-7. EMBO J. 17:6660–6669. [DOI] [PMC free article] [PubMed] [Google Scholar]
- 4.Nguyen, K.B., L.P. Cousens, L.A. Doughty, G.C. Pien, J.E. Durbin, and C.A. Biron. 2000. Interferon-α/β-mediated inhibition and promotion of interferon-γ: STAT1 resolves a paradox. Nat. Immunol. 1:70–76. [DOI] [PubMed] [Google Scholar]
- 5.Cousens, L.P., J.S. Orange, H.C. Su, and C.A. Biron. 1997. Interferon-α/β inhibition of interleukin 12 and interferon-γ production in vitro and endogenously during viral infection. Proc. Natl. Acad. Sci. USA. 94:634–639. [DOI] [PMC free article] [PubMed] [Google Scholar]
- 6.McRae, B.L., R.T. Semnani, M.P. Hayes, and G.A. van Seventer. 1998. Type I IFNs inhibit human dendritic cell IL-12 production and Th1 cell development. J. Immunol. 160:4298–4304. [PubMed] [Google Scholar]
- 7.Karp, C.L., C.A. Biron, and D.N. Irani. 2000. Interferon-β in multiple sclerosis: is IL-12 suppression the key? Immunol. Today. 21:24–28. [DOI] [PubMed] [Google Scholar]
- 8.Byrnes, A.A., X. Ma, P. Cuomo, K. Park, L. Wahl, S.F. Wolf, H. Zhou, G. Trinchieri, and C.L. Karp. 2001. Type I interferons and IL-12: convergence and cross-regulation among mediators of cellular immunity. Eur. J. Immunol. 31:2026–2034. [DOI] [PubMed] [Google Scholar]
- 9.Grabbe, S., E. Kampgen, and G. Schuler. 2000. Dendritic cells: multi-lineal and multi-functional. Immunol. Today. 21:431–433. [DOI] [PubMed] [Google Scholar]
- 10.Liu, Y.J., H. Kanzler, V. Soumelis, and M. Gilliet. 2001. Dendritic cell lineage, plasticity and cross-regulation. Nat. Immunol. 2:585–589. [DOI] [PubMed] [Google Scholar]
- 11.Maldonado-Lopez, R., T. De Smedt, P. Michel, J. Godfroid, B. Pajak, C. Heirman, K. Thielemans, O. Leo, J. Urbain, and M. Moser. 1999. CD8α1 and CD8α2 subclasses of dendritic cells direct the development of distinct T helper cells in vivo. J. Exp. Med. 189:587–592. [DOI] [PMC free article] [PubMed] [Google Scholar]
- 12.Hochrein, H., K. Shortman, D. Vremec, B. Scott, P. Hertzog, and M. O'Keeffe. 2001. Differential production of IL-12, IFN-α, and IFN-γ by mouse dendritic cell subsets. J. Immunol. 166:5448–5455. [DOI] [PubMed] [Google Scholar]
- 13.Asselin-Paturel, C., A. Boonstra, M. Dalod, I. Durand, N. Yessaad, C. Dezutter-Dambuyant, A. Vicari, A. O'Garra, C. Biron, and G. Trinchieri. 2001. Mouse type I interferon producing cells are immature antigen-presenting cells with plasmacytoid morphology. Nat. Immunol. 2:1144–1150. [DOI] [PubMed] [Google Scholar]
- 14.Moser, M., and K.M. Murphy. 2000. Dendritic cell regulation of TH1-TH2 development. Nat. Immunol. 1:199–205. [DOI] [PubMed] [Google Scholar]
- 15.Reis e Sousa, C., S. Hieny, T. Scharton-Kersten, D. Jankovic, H. Charest, R.N. Germain, and A. Sher. 1997. In vivo microbial stimulation induces rapid CD40 ligand-independent production of interleukin 12 by dendritic cells and their redistribution to T cell areas. J. Exp. Med. 186:1819–1829. [DOI] [PMC free article] [PubMed] [Google Scholar]
- 16.Sam, H., and M.M. Stevenson. 1999. Early IL-12 p70, but not p40, production by splenic macrophages correlates with host resistance to blood-stage Plasmodium chabaudi AS malaria. Clin. Exp. Immunol. 117:343–349. [DOI] [PMC free article] [PubMed] [Google Scholar]
- 17.Aliberti, J.C., M.A. Cardoso, G.A. Martins, R.T. Gazzinelli, L.Q. Vieira, and J.S. Silva. 1996. Interleukin-12 mediates resistance to Trypanosoma cruzi in mice and is produced by murine macrophages in response to live trypomastigotes. Infect. Immun. 64:1961–1967. [DOI] [PMC free article] [PubMed] [Google Scholar]
- 18.Malmgaard, L., S.R. Paludan, S.C. Mogensen, and S. Ellermann-Eriksen. 2000. Herpes simplex virus type 2 induces secretion of IL-12 by macrophages through a mechanism involving NF-κB. J. Gen. Virol. 12:3011–3020. [DOI] [PubMed] [Google Scholar]
- 19.Bliss, S.K., Y. Zhang, and E.Y. Denkers. 1999. Murine neutrophil stimulation by Toxoplasma gondii antigen drives high level production of IFN-γ-independent IL-12. J. Immunol. 163:2081–2088. [PubMed] [Google Scholar]
- 20.Tateda, K., T.A. Moore, J.C. Deng, M.W. Newstead, X. Zeng, A. Matsukawa, M.S. Swanson, K. Yamaguchi, and T.J. Standiford. 2001. Early recruitment of neutrophils determines subsequent T1/T2 host responses in a murine model of Legionella pneumophila pneumonia. J. Immunol. 166:3355–3361. [DOI] [PubMed] [Google Scholar]
- 21.Petrofsky, M., and L.E. Bermudez. 1999. Neutrophils from Mycobacterium avium-infected mice produce TNF-α, IL-12, and IL-1β and have a putative role in early host response. Clin. Immunol. 91:354–358. [DOI] [PubMed] [Google Scholar]
- 22.Orange, J.S., and C.A. Biron. 1996. An absolute and restricted requirement for IL-12 in natural killer cell IFN-γ production and antiviral defense. Studies of natural killer and T cell responses in contrasting viral infections. J. Immunol. 156:1138–1142. [PubMed] [Google Scholar]
- 23.Orange, J.S., and C.A. Biron. 1996. Characterization of early IL-12, IFN-α/β, and TNF effects on antiviral state and NK cell responses during murine cytomegalovirus infection. J. Immunol. 156:4746–4756. [PubMed] [Google Scholar]
- 24.Ruzek, M.C., A.H. Miller, S.M. Opal, B.D. Pearce, and C.A. Biron. 1997. Characterization of early cytokine responses and an IL-6–dependent pathway of endogenous glucocorticoid induction during murine cytomegalovirus infection. J. Exp. Med. 185:1185–1192. [DOI] [PMC free article] [PubMed] [Google Scholar]
- 25.Biron, C.A., K.B. Nguyen, G.C. Pien, L.P. Cousens, and T.P. Salazar-Mather. 1999. Natural killer cells in antiviral defense: function and regulation by innate cytokines. Annu. Rev. Immunol. 17:189–220. [DOI] [PubMed] [Google Scholar]
- 26.Pien, G.C., A.R. Satoskar, K. Takeda, S. Akira, and C.A. Biron. 2000. Cutting edge: selective IL-18 requirements for induction of compartmental IFN-γ responses during viral infection. J. Immunol. 165:4787–4791. [DOI] [PubMed] [Google Scholar]
- 27.Wang, B., C. Biron, J. She, K. Higgins, M.J. Sunshine, E. Lacy, N. Lonberg, and C. Terhorst. 1994. A block in both early T lymphocyte and natural killer cell development in transgenic mice with high-copy numbers of the human CD3ɛ gene. Proc. Natl. Acad. Sci. USA. 91:9402–9406. [DOI] [PMC free article] [PubMed] [Google Scholar]
- 28.Orange, J.S., B. Wang, C. Terhorst, and C.A. Biron. 1995. Requirement for natural killer cell-produced interferon-γ in defense against murine cytomegalovirus infection and enhancement of this defense pathway by interleukin 12 administration. J. Exp. Med. 182:1045–1056. [DOI] [PMC free article] [PubMed] [Google Scholar]
- 29.Schulz, O., D.A. Edwards, M. Schito, J. Aliberti, S. Manickasingham, A. Sher, and C. Reis e Sousa. 2000. CD40 triggering of heterodimeric IL-12 p70 production by dendritic cells in vivo requires a microbial priming signal. Immunity. 13:453–462. [DOI] [PubMed] [Google Scholar]
- 30.Nguyen, K.B., and C.A. Biron. 1999. Synergism for cytokine-mediated disease during concurrent endotoxin and viral challenges: roles for NK and T cell IFN-γ production. J. Immunol. 162:5238–5246. [PubMed] [Google Scholar]
- 31.Deonarain, R., A. Alcami, M. Alexiou, M.J. Dallman, D.R. Gewert, and A.C. Porter. 2000. Impaired antiviral response and α/β interferon induction in mice lacking β interferon. J. Virol. 74:3404–3409. [DOI] [PMC free article] [PubMed] [Google Scholar]
- 32.Salazar-Mather, T.P., T.A. Hamilton, and C.A. Biron. 2000. A chemokine-to-cytokine-to-chemokine cascade critical in antiviral defense. J. Clin. Invest. 105:985–993. [DOI] [PMC free article] [PubMed] [Google Scholar]
- 33.Eloranta, M.L., and G.V. Alm. 1999. Splenic marginal metallophilic macrophages and marginal zone macrophages are the major interferon-α/β producers in mice upon intravenous challenge with herpes simplex virus. Scand. J. Immunol. 49:391–394. [DOI] [PubMed] [Google Scholar]
- 34.Sevilla, N., S. Kunz, A. Holz, H. Lewicki, D. Homann, H. Yamada, K.P. Campbell, J.C. de La Torre, and M.B. Oldstone. 2000. Immunosuppression and resultant viral persistence by specific viral targeting of dendritic cells. J. Exp. Med. 192:1249–1260. [DOI] [PMC free article] [PubMed] [Google Scholar]
- 35.Huang, L.Y., C. Reis e Sousa, Y. Itoh, J. Inman, and D.E. Scott. 2001. IL-12 induction by a TH1-inducing adjuvant in vivo: dendritic cell subsets and regulation by IL-10. J. Immunol. 167:1423–1430. [DOI] [PubMed] [Google Scholar]
- 36.Biron, C.A., M. Dalod, and T.P. Salazar-Mather. 2001. Innate immunity and viral infections. Immunity to Infections. S.H.E. Kaufmann, A. Sher, and R. Ahmed, editors. American Society for Microbiology. 139–160.
- 37.Biron, C.A. 2001. Interferons α and β as immune regulators: a new look. Immunity. 14:661–664. [DOI] [PubMed] [Google Scholar]
- 38.den Haan, J.M., S.M. Lehar, and M.J. Bevan. 2000. CD8+ but not CD8− dendritic cells cross-prime cytotoxic T cells in vivo. J. Exp. Med. 192:1685–1696. [DOI] [PMC free article] [PubMed] [Google Scholar]
- 39.Pooley, J.L., W.R. Heath, and K. Shortman. 2001. Cutting edge: intravenous soluble antigen is presented to CD4 T cells by CD8− dendritic cells, but cross-presented to CD8 T cells by CD8+ dendritic cells. J. Immunol. 166:5327–5330. [DOI] [PubMed] [Google Scholar]
- 40.Kronin, V., C.J. Fitzmaurice, I. Caminschi, K. Shortman, D.C. Jackson, and L.E. Brown. 2001. Differential effect of CD8+ and CD8− dendritic cells in the stimulation of secondary CD4+ T cells. Int. Immunol. 13:465–473. [DOI] [PubMed] [Google Scholar]