

Abstract
Cabin1 binds calcineurin and myocyte enhancer factor 2 (MEF2) through its COOH-terminal region. In cell lines, these interactions were shown to inhibit calcineurin activity after T cell receptor (TCR) signaling and transcriptional activation of Nur77 by MEF2. The role of these interactions under physiological conditions was investigated using a mutant mouse strain that expresses a truncated Cabin1 lacking the COOH-terminal calcineurin and MEF2 binding domains. T and B cell development and thymocyte apoptosis were normal in mutant mice. In response to anti-CD3 stimulation, however, mutant T cells expressed significantly higher levels of interleukin (IL)-2, IL-4, IL-9, IL-13, and interferon γ than wild-type T cells. The enhanced cytokine gene expression was not associated with change in nuclear factor of activated T cells (NF-AT)c or NF-ATp nuclear translocation but was preceded by the induction of a phosphorylated form of MEF2D in mutant T cells. Consistent with the enhanced cytokine expression, mutant mice had elevated levels of serum immunoglobulin (Ig)G1, IgG2b, and IgE and produced more IgG1 in response to a T cell–dependent antigen. These findings suggest that the calcineurin and MEF2 binding domain of Cabin1 is dispensable for thymocyte development and apoptosis, but is required for proper regulation of T cell cytokine expression probably through modulation of MEF2 activity.
Keywords: TCR, calcium, NF-AT, Th1/Th2, apoptosis
Introduction
Calcineurin is a calcium and calmodulin-dependent serine/threonine phosphatase (1–3). It is ubiquitously expressed, but found most abundantly in the brain. Its essential role in TCR-mediated signal transduction was first recognized when it was identified as the target of the immunosuppressive drugs cyclosporin A (CsA)* and FK506 (4–11). The primary substrates of activated calcineurin were identified as the nuclear factor of activated T cells (NF-AT) family of transcription factors (12, 13). Calcineurin directly dephosphorylates NF-AT proteins in the cytosol, resulting in their translocation into the nucleus. Calcineurin remains associated with NF-AT in the nucleus, where its continued activation by elevated calcium levels is required to sustain NF-AT transcriptional activity (14, 15). NF-AT acts in cooperation with other transcription factors such as activating protein 1 (AP-1) to stimulate the transcription of many genes important for T cell activation, including several cytokine genes such as IL-2, IL-4, and IFN-γ.
As calcineurin is essential for transmitting cytosolic calcium signals into the nucleus in T cell, its activation is tightly controlled. Calcineurin is activated by intracellular calcium and calmodulin (16). In resting T cells, the level of intracellular calcium is low and the COOH-terminal autoinhibitory domain binds the catalytic domain and blocks calcineurin enzymatic activity. Upon stimulation through TCR, the level of intracellular calcium is elevated and calmodulin becomes activated. Activated calmodulin then binds to calcineurin at a site located between the catalytic and the autoinhibitory domains, thus disrupting their interaction and activating calcineurin's phosphatase activity. It is not well understood how calcineurin activity is downmodulated under physiological conditions. Although the exogenous small molecules CsA and FK506 have long been known to potently inhibit calcineurin phosphatase activity, only recently have endogenous protein inhibitors been identified. AKAP79 (17, 18), DSCR1 (18–20), and Cabin1/Cain (21–26) all inhibit calcineurin activity in transfection assays in the presence of calcium signal.
Murine Cabin1 (and its rat homologue Cain) was identified in a yeast two-hybrid screen for calcineurin-interacting proteins (23, 26). Cabin1 is a ubiquitously expressed protein of 2220 amino acids. The interacting domain in Cabin1 was mapped to 23 amino acid residues (2117–2140) in the COOH terminus (23). When the full-length Cabin1 or the COOH-terminal region was overexpressed in Jurkat T cells, it inhibited the transcriptional activation of calcineurin-responsive elements in the IL-2 promoter and blocked dephosphorylation of NF-AT upon T cell activation. The interaction between Cabin1 and calcineurin is dependent on both calcium signal and protein kinase C (PKC) activation, which results in Cabin1 hyperphosphorylation (23). As Cabin1 is found primarily in the nucleus in T cells, it may interact only with activated calcineurin that has translocated into the nucleus. Based on these results, Cabin1 was hypothesized to function in down modulating calcineurin activity during T cell activation.
In addition to binding to calcineurin, the COOH-terminal region of Cabin1 was also shown to interact with myocyte enhancer factor 2 (MEF2) and calmodulin in a mutually exclusive manner (27, 28). MEF2 is a transcription factor and is normally bound to its recognition sequence in the promoter of target genes such as the apoptosis-inducing gene Nur77 in thymocytes (27, 29). Binding of Cabin1 to MEF2 suppresses MEF2 transcriptional activity through recruitment of the mSin3 corepressor complex via the NH2-terminal region of Cabin1 (27). However, in the presence of a calcium signal, calmodulin binds to Cabin1, freeing MEF2 to recruit the coactivator p300 for transcriptional activation of MEF2 target genes. Consistent with this model, overexpression of Cabin1 in a DO11.10 T cell hybridoma prevents induction of Nur77 by MEF2 and protects the cells from TCR-mediated apoptosis (28). As MEF2 is critical for the transcription of Nur77 in thymocytes, Cabin1 may also regulate thymocyte apoptosis during early T cell development.
To examine the role of the calcineurin- and MEF2-binding domains of Cabin1 in T cell development and function under physiological conditions, we generated Cabin1ΔC mice, which produce a truncated Cabin1 lacking the last 123 amino acid residues from the C-terminus. Contrary to expectation, we found that TCR-mediated thymocyte apoptosis was unaffected by the Cabin1ΔC mutation, indicating that the interaction between Cabin1 and MEF2 is not essential for regulating thymocyte apoptosis in vivo. However, in response to anti-CD3 stimulation, mutant T cells expressed elevated levels of cytokines and a different form of MEF2D. In addition, Cabin1ΔC mice produced an enhanced T cell–dependent IgG1 antibody response. These results demonstrate that Cabin1 normally downmodulates T cell effector functions.
Materials and Methods
Targeting Construct and Generation of Cabin1ΔC Mice
A cDNA fragment encoding the COOH-terminal calcineurin binding domain of Cabin1 was used to isolate Cabin1 genomic clones from a 129/SvJ library. Sequencing of genomic clones identified the last three exons of Cabin1, 3′ untranslated sequences and polyadenylation site (Fig. 1 A). The targeting vector contained 2.5 kb of 5′ homologous sequence, a loxP-flanked, pgk promoter-driven neomycinr (neo r) cassette, 4.5 kb of 3′ homologous sequence, and the thymidine kinase gene. Homologous recombination in embryonic stem cells should result in the replacement of a 0.7 kb EcoRI-BamHI fragment with the neo r cassette. The linearized vector was transfected into J1 ES cells by electroporation and transfectants were selected with G418 and gancyclovir. Resistant clones were screened for homologous recombinants by Southern blot with various probes (data not shown). 15 homologous recombinant ES clones were obtained and two were injected into blastocysts from C57Bl/6 mice. Chimeras produced from both clones transmitted the mutant allele to their offspring. Chimeras were bred with Cre deleter mice (30) to remove the neo r cassette by Cre/loxP recombination, and heterozygous offspring were interbred to produce homozygous mutant mice (Cabin1ΔC). Offspring were genotyped by either Southern blot analysis of tail DNA or PCR assays using primers 5′-caatgtgtggacagcctggacccaggc and 5′-gcagctcccaggcggctgccaggttcc. Mice were housed in specific pathogen-free facilities.
Figure 1.
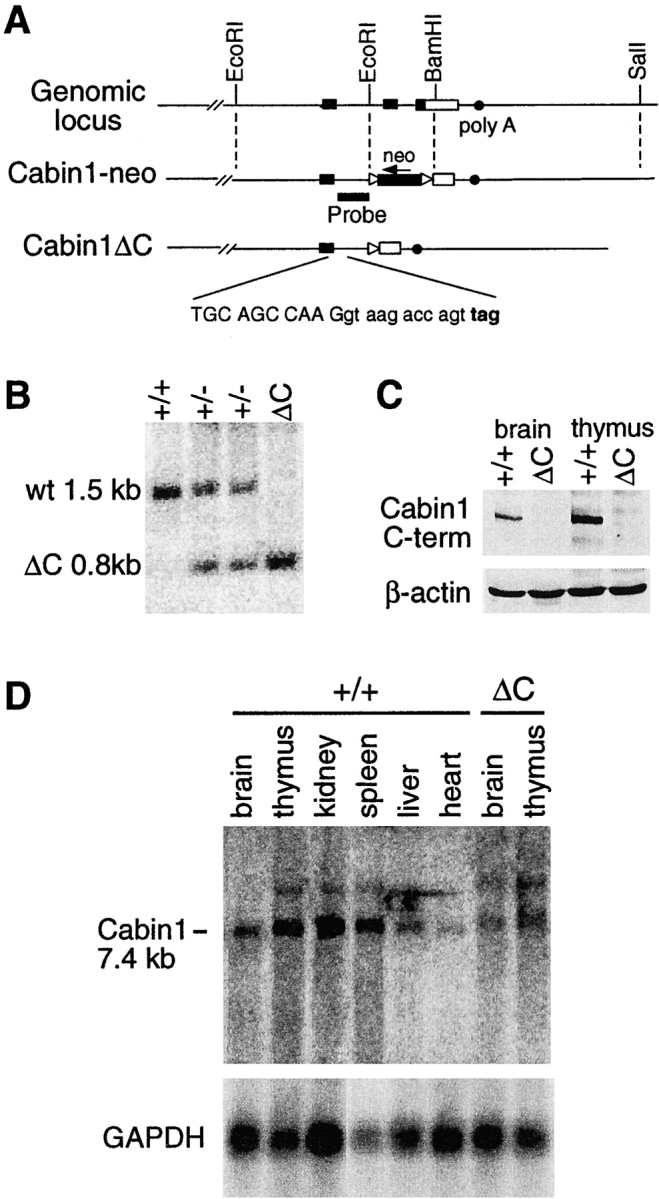
Generation of Cabin1ΔC mice. (A) Schematic diagrams of the 3′ region of the murine Cabin1 genomic locus and the Cabin1-neo and Cabin1ΔC alleles. Filled box, coding sequence; open box, 3′ untranslated region; triangle, loxP site; and filled circle, poly A site. DNA sequences at the exon-intron boundary on the Cabin1ΔC allele are shown. Capital letters refer to nucleotides from the exon and lowercase refers to nucleotides from the intron. Reading frames and the in frame stop codon (bold) 11 nucleotides into the intronic sequence are indicated. (B) Southern blot analysis for Cabin1ΔC deletion. Tail DNA was digested with BamHI and the filter was hybridized with a 0.8 kb BamHI-EcoRI probe as diagrammed in A. DNA fragments generated from the wild-type (wt) and Cabin1ΔC (ΔC) allele are indicated. (C) Western blot analysis for Cabin1 protein. Equal amount of lysates from brain and thymus of Cabin1ΔC and wild-type mice were immunoprecipitated with polyclonal antibodies specific for the COOH-terminal 77 amino acid residues of Cabin1. Precipitates were separated on SDS-PAGE, transferred to nitrocellulose membrane, and probed with the anti-Cabin1 polyclonal antibodies. Anti-actin monoclonal antibody was used for the detection of actin as a control. (D) Northern blot analysis for Cabin1 transcripts. 5 μg of poly(A)+ RNA from various tissues of wild-type and Cabin1ΔC mice were fractionated by formaldehyde-agarose gel and the filters was hybridized with a 1.2 kb Cabin1 cDNA fragment located 5′ to the deleted Cabin1 sequence. The same filter was stripped and rehybridized with a GAPDH probe.
Flow Cytometric Analysis
Single-cell suspensions of spleen, thymus, or lymph node were prepared. Erythrocytes were removed from splenocyte suspensions by lysis with 0.14 M NH4Cl and 17 mM Tris-HCl, pH 7.4. Cells were incubated on ice with FITC-, APC-, or PE-conjugated antibodies (BD PharMingen) and analyzed on a FACScalibur™ (Becton Dickinson) with CELLQuest™ software. Dead cells were gated out with propidium iodide (PI).
Thymocyte Apoptosis
Thymocytes were plated at 1.5 × 10⁶ cells/ml on plates precoated with 50 μg/ml anti-CD3 (2C11) in RPMI supplemented with 10% FBS, 10 mM HEPES, 50 μM 2-mercaptoethanol, 2 mM L-glutamine, 100 U/ml penicillin, and 100 μg/ml streptomycin. Annexin V-FITC (BD PharMingen) binding assay was performed according to manufacturer's instructions.
T Cell Purification
Total T cells were purified from spleen and lymph nodes using anti-CD4 and anti-CD8 magnetic beads on SuperMACS cell sorter or AutoMACS machine (Miltenyi Biotec). For purifying CD4 T cells, anti-CD4 magnetic beads were used. Cell purity was usually ∼95%.
Analysis of T Cell Activation
For T cell proliferation and cytokine secretion assays, 2.5 × 10⁵ purified CD4 T cells or total lymph node cells were incubated in 0.2 ml RPMI plus supplements in a 96-well plate. The cells were stimulated with plate-bound anti-CD3 antibody (2C11), or PMA plus ionomycin. CsA was added at 2 μM. Supernatants were collected for cytokine assays 48 h after stimulation. Some cultures were pulsed with [3H]thymidine at 48 h and harvested 18 h later.
ELISA Assays for Cytokines and Antibodies
IL-2 and IFN-γ in activated CD4 T cell culture supernatants were assayed using commercial kits from Biosource International and R&D Systems, respectively. Serum Ig levels of unimmunized mice were measured by coating plates with anti-IgH plus IgL antibodies (Southern Biotechnology Associates, Inc.), and developing with horseradish peroxidase (HRP)-coupled goat antibodies specific for each mouse Ig isotype. ELISA for IgE was performed by coating the plates with anti-IgE antibody (BD PharMingen) and developing with HRP-conjugated anti-IgE antibody (BD PharMingen). NP-specific antibody in serum from immunized mice was measured by coating plates with NP-BSA and developing with HRP-coupled goat antibodies specific for each mouse Ig isotype.
RNase Protection Assay
Total RNA was isolated from lymph node cells or anti-CD3 stimulated lymph node cells (Ultraspec). The levels of cytokine transcripts were measured by RNase protection assay using the Riboquant multiprobe kit (BD PharMingen) following the manufacturer's instructions. After overnight hybridization of target RNA with 32P-labeled RNA probe, the protected mRNAs were purified and resolved on a 6% denaturing polyacrylamide gel. Cytokine transcript levels were quantified on a PhosphorImager (Molecular Dynamics) using ImageQuant software.
Western Blot Analysis
The thymus and brain from wild-type and Cabin1ΔC mice were lysed in lysis buffer (50 mM Tris-HCl, pH 7.4, 150 mM NaCl, 1 mM EDTA, 1% NP-40, and protease inhibitor cocktail; Roche Molecular Biochemical) by Dounce homogenizer. Lysate containing 750 μg of proteins was immunoprecipitated with anti-Cabin1 polyclonal antibodies that specifically recognize the COOH-terminal 77 amino acid residues of Cabin1. Lysate and antibodies were incubated for 2 h at 4°C in the presence of protein A/G Sepharose beads and precipitates were washed three times with lysis buffer. Proteins in precipitates were separated on SDS-PAGE, transferred to nitrocellulose membrane, and probed with the anti-Cabin1 polyclonal antibodies.
For detection of Nur77, protein concentration of thymocyte lysates was measured by BCA protein assay (Pierce Chemical Co.), and equal amounts of wild-type and Cabin1ΔC lysate were immunoprecipitated with anti-Nur77 antibody (Santa Cruz Biotechnology, Inc.). Western blotting was performed as above except anti-Nur77 antibody was used.
For detection of NF-AT translocation and MEF2D induction, nuclear extracts were isolated from purified T cells as described (31). Protein concentration of the extracts was measured by BCA protein assay, and 50 μg of each nuclear extract was resolved by SDS-PAGE, transferred to PVDF membrane, and probed sequentially with antibodies specific for NF-ATc, NF-ATp, and MEF2D (BD PharMingen).
Ig Class Switching Assay
For B cell class switching assays, 5 × 10⁵ splenocytes were cultured in 2 ml RPMI plus supplements in 24-well plate. B cells were stimulated with 10 μg/ml LPS or with 10 μg/ml plate-bound anti-CD40 (BD PharMingen) in the presence or absence of 50 ng/ml IL-4 (R&D Systems). After 5 d, the cells were stained with antibodies to B220 (BD PharMingen) and IgG1 (Southern Biotechnology Associates, Inc.) and analyzed by flow cytometry.
Immunization
8- to 12-wk-old mice were immunized with the T cell–dependent antigen (4-hydroxyl-3-nitrophenyl) acetyl-conjugated KLH (NP-KLH). 20 μg of NP-KLH in 0.2 ml PBS were injected intravenously through the tail vein on day 0 and the mice were bled on day 14. On day 21, mice were boosted with the same amount of antigen intravenously and bled on day 28. NP-specific antibodies in the serum were measured by ELISA.
Results
Cabin1ΔC Mice
Cabin1 is a large and widely expressed protein that probably has multiple functions in different cell types. We reasoned that deleting the entire protein in mice would be likely to result in severe and pleiotropic effects, making it difficult to assess the importance of Cabin1's interactions with calcineurin and MEF2 in T cell development and function. Therefore, we targeted only the last two exons of Cabin1, which encode the COOH-terminal calcineurin, calmodulin, and MEF2 binding domains. As shown in Fig. 1 A, a 0.7-kb EcoRI-BamHI fragment containing the last two coding exons and part of the 3′ untranslated region was replaced by a neo r cassette by homologous recombination in ES cells. Chimeras derived from the targeted ES cell clones were bred with Cre deleter mice (30) to remove the loxP-flanked neo r cassette, and heterozygous mice were interbred to produce Cabin1ΔC mice homozygous for the Cabin1 truncation (Fig. 1, A and B). In the absence of the neo r cassette, transcription of the truncated allele is expected to go through the downstream intron, into the remaining 3′ untranslated region, and terminate at the normal polyadenylation site. Translation of the mutant transcript would continue into the intron until it reaches an in-frame stop codon after 11 nucleotides, producing a truncated Cabin1 protein with 4 new amino acid residues at the COOH terminus (Fig. 1 A).
Homozygous Cabin1ΔC mice were born at the expected Mendelian ratio, were healthy, and reproduced normally. Northern blotting using a cDNA probe that hybridized to a region of Cabin1 upstream of the deleted region revealed a Cabin1 transcript at the expected size in brain and thymus of Cabin1ΔC mice, although at a twofold reduced level (Fig. 1 D). Amplification of the mutant transcripts by reverse transcription (RT)-PCR and cloning and sequencing of the products confirmed that the transcripts have the expected 3′ sequence (data not shown). A Western blot analysis using antibodies specific for the COOH-terminal domain of Cabin1 readily detected Cabin1 in brain and thymus extracts of wild-type but not Cabin1ΔC mice, demonstrating the expected deletion in the mutant mice (Fig. 1 C). However, identification of the truncated Cabin1 protein by Western blotting in Cabin1ΔC mice was hampered by the lack of a good antibody specific for the NH2 terminus of Cabin1 despite our repeated attempts to generate such an antibody.
In targeting the Cabin1 locus, we inserted the neo r cassette in the opposite transcriptional orientation of the Cabin1 gene. As the neo r cassette is known to have a disruptive effect on gene expression (32), we hypothesized that the insertion could cause a more severe disruption of Cabin1 transcription, resulting in a null allele. Indeed, when heterozygous Cabin1-neo mice were interbred, no homozygous pups were obtained in over 200 offspring genotyped. Examination of embryos after timed matings revealed that homozygous Cabin1-neo mice died in utero around embryonic day 12.5. Although we cannot rule out the possibility that the embryonic lethality is caused by interference of the neo r cassette with the expression of a neighboring gene, Cabin1 is ubiquitously expressed and has no known homologs, and a Cabin1 null allele is likely to cause embryonic lethality. The dramatic difference between the phenotype of Cabin1ΔC and Cabin1-neo mice supports our assertion that Cabin1ΔC mice produce a truncated protein, while Cabin1-neo mice have a null allele.
Normal T and B Cell Development in Cabin1ΔC Mice
To determine the effect of the Cabin1ΔC mutation on lymphocyte development, the cellularity and surface phenotype of cells from various lymphoid organs were examined. The numbers of thymocytes in Cabin1ΔC mice were similar to those in wild-type littermates at various ages examined (Fig. 2). Distribution of CD4−CD8− (double negative [DN]), CD4+CD8+ (double positive [DP]), and CD4+, or CD8+ (single positive [SP]) thymocytes was also similar between the wild-type and Cabin1ΔC mice. Within the DN thymocyte population, similar proportions of cells were found to express CD25 and/or CD44 in the wild-type and Cabin1ΔC mice (data not shown). In DP thymocytes, surface expression of CD69 is transiently upregulated when the cells undergo positive selection (33) and the differentiation from DP to SP is associated with upregulation of TCRβ and downregulation of heat stable antigen (HSA). No difference was detected in TCRβ and HSA expression and in percentages of CD69+ cells in DP thymocytes between the wild-type and Cabin1ΔC mice (data not shown).
Figure 2.

T and B cell development proceeds normally in Cabin1ΔC mice. Flow cytometric analysis of lymphoid tissues from Cabin1ΔC mice (ΔC) and wild-type controls (+/+). The numbers above the plots are the average number of thymocytes in Cabin1ΔC mice (n = 5) and wild-type littermates (n = 4). Thymocytes, lymph node cells, or splenocytes were stained with the indicated antibodies, and the numbers indicate the percentages of cells within the quadrants or gated area.
The total numbers of T cells and the ratio of CD4+ and CD8+ T cells in lymph nodes and spleen did not differ significantly between wild-type and Cabin1ΔC mice (Fig. 2). There was no increase in the proportion of T cells that expressed the activation markers CD69 and CD25 in Cabin1ΔC mice compared with wild-type mice (data not shown), indicating that the Cabin1ΔC mutation does not cause spontaneous activation of T cells. We observed no gross defects in B cell development in the bone marrow (data not shown), and there was a normal proportion of B220+ and IgM+ B cells in the spleen of Cabin1ΔC mice (Fig. 2). Together, these results demonstrate that deletion of the COOH-terminal domain of Cabin1 does not apparently affect T and B cell development.
Normal Thymocyte Apoptosis in Cabin1ΔC Mice
To test whether the Cabin1ΔC mutation has an effect on TCR-mediated apoptosis of thymocytes, we treated thymocytes with plate-bound anti-CD3 antibody in vitro. As measured by propidium iodide (PI) uptake and Annexin V binding, the number of dead and apoptotic cells in the Cabin1ΔC thymocyte cultures was similar to that of wild-type at 24 or 48 h after stimulation (Fig. 3 A). Similarly, no significant difference in thymocyte apoptosis was observed between the two types of mice that were injected with anti-CD3 antibodies (data not shown). Analysis of Nur77 induction by immunoprecipitation and Western blotting showed that a similar level of Nur77 protein was induced in wild-type and Cabin1ΔC thymocytes after anti-CD3 treatment while no Nur77 protein was detected in untreated thymocytes (Fig. 3 B). Thus, the COOH-terminal MEF2- and calcineurin-binding domain of Cabin1 is not essential for proper regulation of thymocyte apoptosis.
Figure 3.

TCR-mediated apoptosis and induction of Nur77 in thymocytes of Cabin1ΔC and wild-type mice. (A) Thymocytes from 6-wk-old Cabin1ΔC mice (n = 5) and wild-type littermates (n = 4) were stimulated individually in vitro with 50 μg/ml plate-bound anti-CD3 for the indicated times. Annexin V binding of thymocytes was measured by flow cytometry. The percentages shown are after subtraction of background (Annexin V+ thymocytes in unstimulated cultures). (B) Pooled thymocytes from 6-wk-old Cabin1ΔC mice and wild-type littermates were stimulated as above for 3 h. Cell lysates containing equal amounts of protein were immunoprecipitated with anti-Nur77. Precipitates were separated by SDS-PAGE, transferred to nitrocellulose membrane, and probed with the same anti-Nur77 antibody.
Enhanced Cytokine Production by Cabin1ΔC T Cells
Next we examined the effect of the Cabin1ΔC mutation on T cell activation in vitro. Lymph node cells from Cabin1ΔC mice and wild-type controls were stimulated with an optimal amount of plate-bound anti-CD3 (10 μg/ml) or PMA (5 ng/ml) plus ionomycin (250 ng/ml). Upregulation of the activation markers CD69 and CD25 on T cells was monitored every day for 3 d, and no difference in the kinetics or the levels of induction was observed between the wild-type and Cabin1ΔC T cells (data not shown). To better detect difference in response between the mutant and wild-type T cells, purified CD4 T cells were stimulated with different concentrations of anti-CD3 antibody or an optimal concentration of PMA plus different concentrations of ionomycin. Proliferation of the stimulated T cells was measured by [3H]thymidine incorporation. Both the wild-type and Cabin1ΔC T cells proliferated vigorously to optimal concentrations of PMA and ionomycin but not much to suboptimal concentrations of ionomycin (Fig. 4 A, top panel). At different concentrations of anti-CD3, mutant CD4 T cells proliferated more extensively than wild-type cells, although in some experiments no difference was detected (data not shown).
Figure 4.

Enhanced cytokine production by Cabin1ΔC T cells. (A) Purified CD4 T cells from Cabin1ΔC (ΔC) and wild-type (+/+) mice were either not treated, or treated with indicated concentrations of anti-CD3, or 5 ng/ml of PMA plus the indicated concentrations of ionomycin for 48 h. T cell proliferation (top panel) was measured by pulsing the cultures with [3H]thymidine for 18 h after initial stimulation. The levels of IL-2 (middle panel) and IFN-γ (bottom panel) were measured in the culture supernatants after 48 h of stimulation. The assays were performed in triplicate. The proliferation and cytokine assays were also performed with total lymph node cells five and three times, respectively. Similar results were obtained except that in some experiments no difference in proliferation was observed between mutant and wild-type T cells (not shown). (B) RNase protection assay for cytokine transcripts. Lymph node cells from Cabin1ΔC and wild-type controls were stimulated for 24 and 48 h with 10 μg/ml anti-CD3, and total RNA was isolated. The levels of cytokine transcripts were assayed by RNase protection. Transcript levels were quantified by phosphorimager and normalized to the levels of transcript for the ribosomal protein L32 in each lane. The numbers indicate the fold-increase of specific cytokine transcript in Cabin1ΔC T cells over that in the wild-type T cells at 48 h. The entire assay was repeated three times with similar results.
Culture supernatants of activated CD4 T cells were analyzed for the levels of IL-2 and IFN-γ by ELISA. At different anti-CD3 concentrations, significantly higher levels of IL-2 (∼5-fold) and IFN-γ (∼2-fold) were detected in cultures of Cabin1ΔC T cells than that of wild-type T cells (Fig. 4 A, middle and bottom panels). However, after stimulation with more potent stimuli, such as anti-CD3 plus anti-CD28 or PMA plus ionomycin, the levels of IL-2 and IFN-γ produced by Cabin1ΔC T cells were similar to those of wild-type T cells (Fig. 4 A, and data not shown). In the presence of CsA, no IL-2 or IFN-γ were detected in the supernatants of either Cabin1ΔC or wild-type cultures (data not shown), indicating that the enhanced cytokine production depends on phosphatase activity of calcineurin.
To determine whether the increased levels of IL-2 and IFN-γ in the supernatants were a result of increased transcription of these genes in Cabin1ΔC T cells, we quantified cytokine transcripts in anti-CD3 stimulated lymph node T cells by RNase protection assay (Fig. 4 B). The levels of cytokine transcripts in each sample were normalized to the level of transcript of ribosomal protein L32. Transcripts for IFN-γ, IL-2, IL-9, IL-13, and IL-4 were consistently found to be two- to threefold more abundant in Cabin1ΔC T cells than in wild-type T cells at 48 h. The increase for some cytokine transcripts was already detectable at 24 h. These results clearly demonstrate that deletion of the COOH-terminal region of Cabin1 results in an enhanced cytokine gene expression in T cells after TCR-mediated activation.
Impaired MEF2D Induction in Cabin1ΔC T Cells
Of the three NF-AT family members selectively expressed in T cells, NF-ATc (NF-ATc1, NF-AT2) and NF-ATp (NF-ATc2, NF-AT1) are thought to be responsible for regulating calcineurin-dependent cytokine transcription in mature T cells (34, 35). To investigate whether the increased cytokine expression in Cabin1ΔC T cells is mediated through increased activation of NF-AT by calcineurin, we examined NF-ATc and NF-ATp translocation to the nucleus after stimulation of T cells with anti-CD3. No NF-ATc or NT-ATp was detected by Western blotting in the nucleus of unstimulated T cells (Fig. 5). After stimulation, however, several isoforms of NF-ATc and NF-ATp were detected but no significant difference in the level was detected between wild-type and Cabin1ΔC T cells. By gel mobility shift assay for total nuclear NF-AT activity, no significant difference was detected between mutant and wild-type T cells at 4, 24, or 48 h (data not shown). However, significant difference in MEF2D induction in the two types of T cells was detected (Fig. 5). Without stimulation, MEF2D was not detected in the nucleus of wild-type T cells but was readily detected 4 h after anti-CD3 stimulation. In contrast, in mutant T cells, significantly lower levels of MEF2D were detected at all three time points and the residual MEF2D migrated more slowly on the SDS-PAGE, indicating a difference in posttranslational modification. These results show that the enhanced cytokine gene expression in Cabin1ΔC T cells is correlated with alterations in MEF2D induction but not NF-AT activation.
Figure 5.

Nuclear translocation of NF-ATc and NF-ATp and induction of MEF2D. Purified T cells from Cabin1ΔC mice (ΔC) and wild-type controls (+/+) were either not stimulated or stimulated with plate-bound anti-CD3 for 4, 24, and 48 h. Nuclear extracts containing equal amounts of protein (50 μg) were separated by SDS-PAGE, transferred to membrane, and probed sequentially with antibodies specific for NF-ATc, NF-ATp, and MEF2D.
Enhanced Ig Production in Cabin1ΔC Mice
The enhanced cytokine gene expression by activated T cells could result in an enhanced T cell–dependent antibody response in Cabin1ΔC mice. We assayed the levels of the various immunoglobulin isotypes in the serum of 3-mo-old Cabin1ΔC and wild-type mice. As shown in Fig. 6, the level of IgG1, IgG2b, and IgE was three, two, and sixfold higher, respectively, in Cabin1ΔC mice than in wild-type mice. No significant difference was observed in the levels of IgM, IgG3, or IgG2a. To compare antibody response to T cell–dependent antigen between Cabin1ΔC and wild-type mice, mice were immunized with NP-KLH on day 0 and day 21 and bled on day 14 and 28. The levels of NP-specific IgG1 and IgG2b, but not IgM, IgG2a, or IgG3, were modestly, though significantly, higher in Cabin1ΔC than wild-type mice at day 14 (primary response, Fig. 7). In the secondary response (day 28), NP-specific IgG1 was still significantly higher in the mutant mice than in the wild-type mice. No difference was detected in antibody response to a T cell–independent antigen NP-Ficoll between mutant and wild-type mice (data not shown). Together, these results show that T cell–dependent IgG1 antibody response is selectively enhanced in Cabin1ΔC mice.
Figure 6.

Serum Ig levels are elevated in Cabin1ΔC mice. The levels of Ig isotypes in the serum of 3-mo-old Cabin1ΔC and wild-type mice were measured by ELISA. Each symbol represents one mouse. An unpaired Student's t test was used to determine the P values.
Figure 7.

Enhanced IgG1 antibody response to NP-KLH in Cabin1ΔC mice. Mice at 8–12 wk of age were immunized intravenously with NP-KLH in PBS on day 0 and 21 and bled on day 14 and 28. The levels of NP-specific Ig isotypes were measured by ELISA with NP-BSA coated plates. OD450nm at the linear range of serum dilutions is shown and each symbol represents one mouse. For the primary response, serum dilution of 1/750 was used for all isotypes and for secondary response, serum dilutions for IgG1, 2a, 2b, and 3 were 1/125,000, 1/25,000, 1/5,000, and 1/25,000, respectively. An unpaired Student's t test was used to determine the P values.
Normal IgG1 Class Switching in Cabin1ΔC B Cells
The enhanced IgG1 response in Cabin1ΔC mice could result from the increased cytokine production by T cells, or an alteration in B cells that favors class switching to IgG1. It is known that CD40 signaling in B cells is CsA-sensitive (36, 37) and that stimulation through CD40 strongly enhances IL-4–dependent class switching to IgG1 (38). Stimulation of B cells with LPS plus IL-4 also induces IgG1 class switching, but LPS signaling is not sensitive to CsA (37). To examine whether B cells from Cabin1ΔC mice are intrinsically more efficient in class switching, we compared IgG1 class switching between wild-type and mutant B cells in vitro under the same stimulation conditions. In the absence of IL-4, <1% of B cells from either wild-type or Cabin1ΔC mice expressed cell surface IgG1 after 5 d of stimulation with LPS or anti-CD40 (Fig. 8). In the presence of IL-4, ∼15 and 35% of B cells expressed IgG1 after LPS and anti-CD40 stimulation, respectively. However, no difference was detected in the frequency of class switching between wild-type and mutant B cells, indicating that the elevated levels of IgG1 in the serum of Cabin1ΔC mice is not due to an alteration of B cell signaling that results in more efficient class switching.
Figure 8.
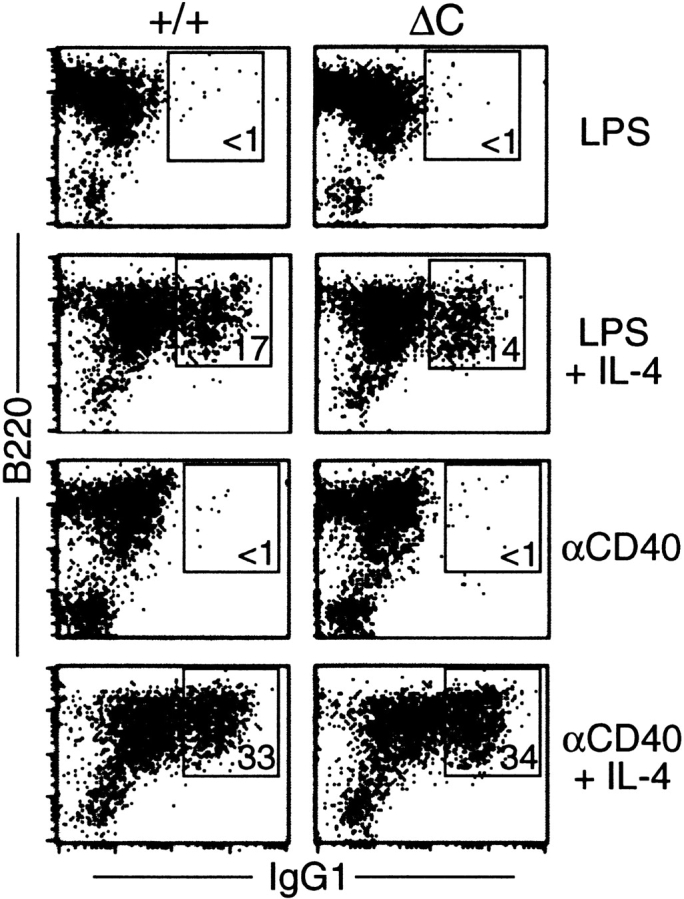
Class switching to IgG1 is unaffected in Cabin1ΔC B cells. Splenocytes from wild-type and Cabin1ΔC mice were stimulated in vitro for 5 d with LPS or anti-CD40 in the presence or absence of IL-4. Cells were stained with antibodies specific for IgG1 and B220, and analyzed by flow cytometry. Splenocytes from three wild-type and three Cabin1ΔC mice were assayed, and one representative plot for each stimulation is shown. The numbers indicate percentages of B220+ cells that are IgG1+.
Discussion
Calcineurin is critical for integrating calcium signal with the downstream effector functions in T cells, partly by regulating the activity of NF-AT family of transcription factors and therefore T cell activation and cytokine expression (3). Recently, calcineurin was also shown to modulate MEF2 activity either directly (39) or indirectly through NF-ATp, which can form a ternary complex with MEF2 (40). Cabin1 was initially identified as a calcineurin and MEF2 binding protein and was shown to suppress their activities in transfection assays in T cell lines (23, 28). To investigate the physiological role of Cabin1 interaction with calcineurin and MEF2 in developing T cells, we determined the effect of deleting the calcineurin and MEF2 binding domain of Cabin1 on T cell development and function in mice.
T and B cell development in Cabin1ΔC mice was normal (Fig. 2), indicating that the interaction between Cabin1 and calcineurin and MEF2 is not required for lymphocyte development. Based on previous studies in T cell lines (28), DP thymocytes from Cabin1ΔC mice were expected to be more susceptible to TCR-mediated apoptosis. Presumably, the truncated Cabin1 cannot bind MEF2 and recruit the mSin3 corepressor complex to inhibit MEF2 from activating the transcription of the pro-apoptotic gene Nur77. However, compared with wild-type thymocytes, Cabin1ΔC thymocytes were not more susceptible to apoptosis and were not induced to express a higher level of Nur77 after TCR stimulation (Fig. 3). Thus, while overexpression of Cabin1 or its COOH terminus in a T cell hybridoma can suppress TCR-mediated apoptosis, Cabin1's interaction with MEF2 is not uniquely required for the negative regulation of MEF2 in developing thymocytes. The lack of effect of Cabin1ΔC on thymocyte apoptosis is not surprising, however, in light of the recent reports of redundant MEF2 transcriptional corepressors including MEF2 interacting transcription repressor (MITR), histone deacetylases 4 and 5 (41–45). The inhibition of MEF2 by these corepressors is also calcium-dependent but does not require Cabin1 as an intermediary (42, 45). It is likely that the redundant MEF2 transcriptional corepressors can compensate for the Cabin1 COOH-terminal deletion.
Different from thymocytes, anti-CD3 stimulation of CD4 T cells from Cabin1ΔC mice resulted in an enhanced transcription of IL-2, IL-4, IL-9, IL-13, and IFN-γ (Fig. 4), which are all target genes of NF-AT transcription factors. These results are complementary to those observed in T cells deficient in both NF-ATc (NF-ATc1, NF-AT2) and NF-ATp (NF-ATc2, NF-AT1), in which production of many cytokines is reduced after stimulation through TCR (46). The increased cytokine gene expression was inhibited by the presence of CsA, indicating the requirement for calcineurin activity. Considering that overexpression of the COOH-terminal region of Cabin1 inhibits calcineurin activity in T cell lines, the enhanced cytokine gene transcription in Cabin1ΔC T cells seems likely to be mediated by increased calcineurin activity. However, we did not detect any increase in nuclear translocation of NF-ATc and NF-ATp in mutant T cells compared with wild-type T cells (Fig. 5). It is possible that the NF-AT assays used were not sensitive enough to detect a relatively small difference, which may be sufficient to account for the observed two- to threefold increase in cytokine gene expression. However, as NF-AT are the major downstream targets of calcineurin, the lack of detectable difference in NF-ATc and NF-ATp between wild-type and Cabin1ΔC T cells suggests that the deletion in Cabin1 may not affect calcineurin activity. Although we did not measure calcineurin activity directly, the normal T cell development in mutant mice, and the normal activation of CD69 and CD25 expression and largely normal proliferation of mutant T cells are consistent with this interpretation.
In contrast to lack of change in NF-AT nuclear translocation, the level of MEF2D induction was significantly lower in Cabin1ΔC T cells than in wild-type T cells and the residual MEF2D displayed a slower mobility on SDS-PAGE (Fig. 5). Based on the electrophoretic mobility of MEF2D and phosphorylated MEF2D (47–49), the difference in the observed MEF2D mobility between mutant and wild-type T cells is likely due to phosphorylation of MEF2D in Cabin1ΔC T cells. Thus, Cabin1-MEF2 interaction is required for proper MEF2D induction and phosphorylation after TCR signaling. Various studies have shown that different members of mitogen-activated protein (MAP) kinase phosphorylate different members of MEF2. For example, p38 preferentially phosphorylates MEF2A and 2C (47, 50) whereas big mitogen-activated protein kinase (BMK1) preferentially phosphorylates MEF2A, 2C, and 2D (49). Because calcineurin may directly dephosphorylate MEF2 (39), it appears that the interaction between Cabin1 and calcineurin and MEF2 may be required for MEF2D dephosphorylation by calcineurin in activated T cells.
The altered MEF2D induction probably contributes to the enhanced cytokine gene expression in Cabin1ΔC T cells because MEF2D is induced by TCR signaling and its induction precedes cytokine gene expression (4 h versus 24 h, Figs. 4 and 5). Most studies suggest that phosphorylation of specific sites in MEF2A and MEF2D activates their transactivating activity (47, 49, 50). Members of the MEF2 family transcription factors promote transcription of target genes by binding to the MEF2 binding site in the promoter region as homo- and heterodimers. MEF2D is also capable of enhancing NF-AT activity by forming a ternary complex with NF-ATp (40, 51). In addition, consensus MEF2 binding sites (g/t c/t t a a/t a/t a/t a t a a/g a/c/t [52]) can be identified in the promoter regions of cytokine genes such as IL-2, IL-4, IL-9, IL-13, and IFN-γ (data not shown) although none of these sites has been shown to be functional. Thus, among many possibilities, a simple mechanism can be envisioned whereby phosphorylated MEF2D can directly promote cytokine gene expression in Cabin1ΔC T cells either as homodimer or heterodimer with other MEF2 family members or NF-AT. Although the precise mechanisms have yet to be elucidated, our findings strongly suggest that Cabin1 is a negative regulator of cytokine gene expression in T cells. It appears that upon TCR ligation, activation of MAP kinases may result in the phosphorylation of MEF2D, which promotes cytokine gene expression. Interaction of Cabin1 and MEF2D may result in the dephosphorylation of MEF2D and thus the downmodulation of T cell effector function.
The Cabin1ΔC mutant mice have elevated levels of serum IgG1, IgG2b, and IgE and produce higher levels of IgG1 in response to a T cell–dependent antigen NP-KLH (Figs. 6 and 7). The enhanced antibody response is apparently not due to an intrinsic alteration of B cells in the mutant mice. After anti-IgM or LPS stimulation in vitro, B cells from Cabin1ΔC and wild-type mice expressed similar levels of activation markers CD25 and proliferated to the same extent (data not shown). Furthermore, the proportion of mutant and wild-type B cells that switched to IgG1 in response to anti-CD40 and IL-4 stimulation was the same (Fig. 8) although stimulation of IgG1 class switch through CD40 in B cells is known to involve calcineurin (36, 37). The observed elevation in serum Ig levels in Cabin1ΔC mice is likely to be promoted by the increased levels of cytokines secreted by Cabin1ΔC T cells. Class switching to IgG1 and IgE isotypes is normally induced by IL-4 secreted by Th2 cells, and class switching to IgG2a isotype is promoted by IFN-γ produced by Th1 cells. Although production of both Th2- and Th1-type cytokines were increased in Cabin1ΔC T cells after anti-CD3 stimulation in vitro, no significant increase in IgG2a was observed in the serum of nonimmunized mice or in response to NP-KLH immunization. The difference in cytokine expression in vitro and T helper cell development in vivo probably reflects differences in activation conditions during an immune response in mice and T cell activation in culture. It is also possible that cytokine production by non-T cells could be affected by the Cabin1ΔC mutation and contributed to the elevated serum Ig isotypes. However, because the increased IgG1 production was observed even when Cabin1ΔC mice were immunized with NP-KLH in the absence of adjuvant (Fig. 7), cytokines produced by non-T cells were probably not a major contributor.
The biological function of calcineurin and NF-AT was initially elucidated in lymphocytes whereas the function of MEF2 was initially identified in muscle cells. Various studies have now shown that calcineurin and NF-AT also play critical roles in muscle and neuronal cell development and function whereas MEF2 may play a role in T cell development and neuronal cell function. In this report, we examined the role of the COOH terminus of Cabin1, encompassing the calcineurin- and MEF2-binding domain, in lymphocyte development and function and our findings provide the strongest evidence to date for a role of Cabin1 and MEF2D in T cell cytokine gene expression. Cabin1 has also been implicated in regulation of neurotransmitter endocytosis in neuronal cells (25), and muscle cell development (21, 22, 24). Although the gross phenotype of the Cabin1ΔC mice gave no indication of a major defect in the development and function of muscle cells or the nervous system, we have yet to examine the effect of the mutation on these processes. Together, calcineurin, NF-AT, Cabin1, and MEF2 are a group of interacting proteins that convert calcium signal into different effector functions in diverse biological systems.
Acknowledgments
We thank Tara Schmidt for blastocyst injection for generating chimeric mice, members of the Chen lab for help and suggestions, and Dr. Anjana Rao for critical reading of the manuscript.
This work was partly supported by National Institutes of Health grants AI40146 and AI44478 (to J. Chen) and GM55783 (to J.O. Liu).
M. Boes' present address is Department of Pathology, Harvard Medical School, Boston, MA 02115.
H.-D. Youn's present address is Department of Biochemistry, Seoul National University, Seoul 110-799, Korea.
L. Tatterson's present address is Department of Microbiology and Immunology, University of Michigan, Ann Arbor, MI 48109.
J.O. Liu's present address is Department of Pharmacology and Neuroscience, Johns Hopkins University School of Medicine, Baltimore, MD 21205.
Footnotes
Abbreviations used in this paper: CsA, cyclosporin A; DP, double positive; HRP, horseradish peroxidase; MEF2, myocyte enhancer factor 2; NF-AT, nuclear factor of activated T cells; NP-KLH, (4-hydroxyl-3-nitrophenyl) acetyl-KLH.
References
- 1.Klee, C.B., H. Ren, and X. Wang. 1998. Regulation of the calmodulin-stimulated protein phosphatase, calcineurin. J. Biol. Chem. 273:13367–13370. [DOI] [PubMed] [Google Scholar]
- 2.Rusnak, F., and P. Mertz. 2000. Calcineurin: form and function. Physiol. Rev. 80:1483–1521. [DOI] [PubMed] [Google Scholar]
- 3.Crabtree, G.R. 2001. Calcium, calcineurin and the control of transcription. J. Biol. Chem. 276:2313–2316. [DOI] [PubMed] [Google Scholar]
- 4.Friedman, J., and I. Weissman. 1991. Two cytoplasmic candidates for immunophilin action are revealed by affinity for a new cyclophilin: one in the presence and one in the absence of CsA. Cell. 66:799–806. [DOI] [PubMed] [Google Scholar]
- 5.Liu, J., J.D. Farmer, Jr., W.S. Lane, J. Friedman, I. Weissman, and S.L. Schreiber. 1991. Calcineurin is a common target of cyclophilin-cyclosporin A and FKBP-FK506 complexes. Cell. 66:807–815. [DOI] [PubMed] [Google Scholar]
- 6.Clipstone, N.A., and G.R. Crabtree. 1992. Identification of calcineurin as a key signalling enzyme in T-lymphocyte activation. Nature. 357:695–697. [DOI] [PubMed] [Google Scholar]
- 7.O'Keefe, S.J., J. Tamura, R.L. Kincaid, M.J. Tocci, and E.A. O'Neill. 1992. FK-506- and CsA-sensitive activation of the interleukin-2 promoter by calcineurin. Nature. 357:692–694. [DOI] [PubMed] [Google Scholar]
- 8.Fruman, D.A., C.B. Klee, B.E. Bierer, and S.J. Burakoff. 1992. Calcineurin phosphatase activity in T lymphocytes is inhibited by FK 506 and cyclosporin A. Proc. Natl. Acad. Sci. USA. 89:3686–3690. [DOI] [PMC free article] [PubMed] [Google Scholar]
- 9.Liu, J., M.W. Albers, T.J. Wandless, S. Luan, D.G. Alberg, P.J. Belshaw, P. Cohen, C. MacKintosh, and C.B. Klee. 1992. Inhibition of T cell signaling by immunophilin-ligand complexes correlates with loss of calcineurin phosphatase activity. Biochemistry. 31:3896–3901. [DOI] [PubMed] [Google Scholar]
- 10.Swanson, S.K.-H., T. Born, L.D. Zydowsky, H. Cho, H.Y. Chang, C.T. Walsh, and F. Rusnak. 1992. Cyclosporin-mediated inhibition of bovine calcineurin by cyclophilin A and B. Proc. Natl. Acad. Sci. USA. 89:1–5. [DOI] [PMC free article] [PubMed] [Google Scholar]
- 11.Nelson, P.A., Y. Akselband, A. Kawamura, M. Su, R.D. Tung, D.H. Rich, V. Kishore, S.L. Rosborough, M.T. DeCenzo, D.J. Livingston, and M.W. Harding. 1993. Immunosuppressive activity of {MeBm2t}1, d-Diaminobutytyl-8-, and d-Diaminopropyl-8-Cyclosporin analogues correlates with inhibition of calcineurin phosphatase activity. J. Immunol. 150:2139–2147. [PubMed]
- 12.Crabtree, G.R., and N.A. Clipstone. 1994. Signal transmission between the plasma membrane and nucleus of T lymphocytes. Annu. Rev. Biochem. 63:1045–1083. [DOI] [PubMed] [Google Scholar]
- 13.Rao, A., C. Luo, and P.G. Hogan. 1997. Transcription factors of the NFAT family: regulation and function. Annu. Rev. Immunol. 15:707–747. [DOI] [PubMed] [Google Scholar]
- 14.Shibasaki, F., E.R. Price, D. Milan, and F. McKeon. 1996. Role of kinases and the phosphatase calcineurin in the nuclear shuttling of transcription factor NF-AT4. Nature. 382:370–373. [DOI] [PubMed] [Google Scholar]
- 15.Timmerman, L.A., N.A. Clipstone, S.N. Ho, J.P. Northrop, and G.R. Crabtree. 1996. Rapid shuttling of NF-AT in discrimination of Ca2+ signals and immunosuppression. Nature. 383:837–840. [DOI] [PubMed] [Google Scholar]
- 16.Klee, C.B., G.F. Draetta, and M.J. Hubbard. 1988. Calcineurin. Adv. Enzymol. Relat. Areas Mol. Biol. 61:149–200. [DOI] [PubMed] [Google Scholar]
- 17.Kashishian, A., M. Howard, C. Loh, W.M. Gallatin, M.F. Hoekstra, and Y. Lai. 1998. AKAP79 inhibits calcineurin through a site distinct from the immunophilin-binding region. J. Biol. Chem. 273:27412–27419. [DOI] [PubMed] [Google Scholar]
- 18.Coghlan, V.M., B.A. Perrino, M. Howard, L.K. Langeberg, J.B. Hicks, W.M. Gallatin, and J.D. Scott. 1995. Association of protein kinase A and protein phosphatase 2B with a common anchoring protein. Science. 267:108–111. [DOI] [PubMed] [Google Scholar]
- 19.Kingsbury, T.J., and K.W. Cunningham. 2000. A conserved family of calcineurin regulators. Genes Dev. 14:1595–1604. [PMC free article] [PubMed] [Google Scholar]
- 20.Fuentes, J.J., L. Genesca, T.J. Kingsbury, K.W. Cunningham, M. Perez-Riba, X. Estivill, and S. de la Luna. 2000. DSCR1, overexpressed in Down syndrome, is an inhibitor of calcineurin-mediated signaling pathways. Hum. Mol. Genet. 9:1681–1690. [DOI] [PubMed] [Google Scholar]
- 21.Friday, B.B., V. Horsley, and G.K. Pavlath. 2000. Calcineurin activity is required for the initiation of skeletal muscle differentiation. J. Cell Biol. 149:657–666. [DOI] [PMC free article] [PubMed] [Google Scholar]
- 22.Taigen, T., L.J.D. Windt, H.W. Lim, and J.D. Molkentin. 2000. Targeted inhibition of calcineurin prevents agonist-induced cardiomyocyte hypertrophy. Proc. Natl. Acad. Sci. USA. 97:1196–1201. [DOI] [PMC free article] [PubMed] [Google Scholar]
- 23.Sun, L., H.Y. Youn, C. Loh, M. Stolow, W. He, and J.O. Liu. 1998. Cabin 1, a negative regulator for calcineurin signaling in T lymphocytes. Immunity. 8:703–711. [DOI] [PubMed] [Google Scholar]
- 24.Delling, U., J. Tureckova, H.W. Lim, L.J. De Windt, P. Rotwein, and J.D. Molkentin. 2000. A calcineurin-NFATc3-dependent pathway regulates skeletal muscle differentiation and slow myosin heavy-chain expression. Mol. Cell. Biol. 20:6600–6611. [DOI] [PMC free article] [PubMed] [Google Scholar]
- 25.Lai, M.M., H.R. Luo, P.E. Burnett, J.J. Hong, and S.H. Snyder. 2000. The calcineurin-binding protein cain is a negative regulator of synaptic vesicle endocytosis. J. Biol. Chem. 275:34017–34020. [DOI] [PubMed] [Google Scholar]
- 26.Lai, M.M., P.E. Burnett, H. Wolosker, S. Blackshaw, and S.H. Snyder. 1998. Cain, a novel physiologic protein inhibitor of calcineurin. J. Biol. Chem. 273:18325–18331. [DOI] [PubMed] [Google Scholar]
- 27.Youn, H.D., and J.O. Liu. 2000. Cabin1 represses MEF2-dependent Nur77 expression and T cell apoptosis by controlling association of histone deacetylases and acetylases with MEF2. Immunity. 13:85–94. [DOI] [PubMed] [Google Scholar]
- 28.Youn, H.D., L. Sun, R. Prywes, and J.O. Liu. 1999. Apoptosis of T cells mediated by Ca2+-induced release of the transcription factor MEF2. Science. 286:790–793. [DOI] [PubMed] [Google Scholar]
- 29.Woronicz, J.D., A. Lina, B.J. Calnan, S. Szychowski, L. Cheng, and A. Winoto. 1995. Regulation of the Nur77 orphan steroid receptor in activation-induced apoptosis. Mol. Cell. Biol. 15:6364–6376. [DOI] [PMC free article] [PubMed] [Google Scholar]
- 30.Schwenk, F., U. Baron, and K. Rajewsky. 1995. A cre-transgenic mouse strain for the ubiquitous deletion of loxP- flanked gene segments including deletion in germ cells. Nucleic Acids Res. 23:5080–5081. [DOI] [PMC free article] [PubMed] [Google Scholar]
- 31.Dignam, J.D., R.M. Lebovitz, and R.G. Roeder. 1983. Accurate transcription initiation by RNA polymerase II in a soluble extract from isolated mammalian nuclei. Nucleic Acids Res. 11:1475–1489. [DOI] [PMC free article] [PubMed] [Google Scholar]
- 32.Pham, C.T., D.M. MacIvor, B.A. Hug, J.W. Heusel, and T.J. Ley. 1996. Long-range disruption of gene expression by a selectable marker cassette. Proc. Natl. Acad. Sci. USA. 93:13090–13095. [DOI] [PMC free article] [PubMed] [Google Scholar]
- 33.Yamashita, I., T. Nagata, T. Tada, and T. Nakayama. 1993. CD69 cell surface expression identifies developing thymocytes which audition for T cell antigen receptor-mediated positive selection. Int. Immunol. 5:1139–1150. [DOI] [PubMed] [Google Scholar]
- 34.Ranger, A.M., M.R. Hodge, E.M. Gravallese, M. Oukka, L. Davidson, F.W. Alt, F.C.d.l. Brousse, T. Hoey, M. Grusby, and L.H. Glimcher. 1998. Delayed lymphoid repopulation with defects in IL-4-driven responses produced by inactivation of NF-ATc. Immunity. 8:125–134. [DOI] [PubMed] [Google Scholar]
- 35.Yoshida, H., H. Nishina, H. Takimoto, L.E. Marengere, A.C. Wakeham, D. Bouchard, Y.Y. Kong, T. Ohteki, A. Shahinian, M. Bachmann, et al. 1998. The transcription factor NF-ATc1 regulates lymphocyte proliferation and Th2 cytokine production. Immunity. 8:115–124. [DOI] [PubMed] [Google Scholar]
- 36.Klaus, G.G., M.S. Choi, and M. Holman. 1994. Properties of mouse CD40. Ligation of CD40 activates B cells via a Ca(++)-dependent, FK506-sensitive pathway. Eur. J. Immunol. 24:3229–3232. [DOI] [PubMed] [Google Scholar]
- 37.Choi, M.S., R.D. Brines, M.J. Holman, and G.G. Klaus. 1994. Induction of NF-AT in normal B lymphocytes by anti-immunoglobulin or CD40 ligand in conjunction with IL-4. Immunity. 1:179–187. [DOI] [PubMed] [Google Scholar]
- 38.Strom, L., J. Laurencikiene, A. Miskiniene, and E. Severinson. 1999. Characterization of CD40-dependent immunoglobulin class switching. Scand. J. Immunol. 49:523–532. [DOI] [PubMed] [Google Scholar]
- 39.Mao, Z., and M. Wiedmann. 1999. Calcineurin enhances MEF2 DNA binding activity in calcium-dependent survival of cerebellar granule neurons. J. Biol. Chem. 274:31102–31107. [DOI] [PubMed] [Google Scholar]
- 40.Blaeser, F., N. Ho, R. Prywes, and T.A. Chatila. 2000. Ca(2+)-dependent gene expression mediated by MEF2 transcription factors. J. Biol. Chem. 275:197–209. [DOI] [PubMed] [Google Scholar]
- 41.Lemercier, C., A. Verdel, B. Galloo, S. Curtet, M.P. Brocard, and S. Khochbin. 2000. mHDA1/HDAC5 histone deacetylase interacts with and represses MEF2A transcriptional activity. J. Biol. Chem. 275:15594–15599. [DOI] [PubMed] [Google Scholar]
- 42.Lu, J., T.A. McKinsey, R.L. Nicol, and E.N. Olson. 2000. Signal-dependent activation of the MEF2 transcription factor by dissociation from histone deacetylases. Proc. Natl. Acad. Sci. USA. 97:4070–4075. [DOI] [PMC free article] [PubMed] [Google Scholar]
- 43.Miska, E.A., C. Karlsson, E. Langley, S.J. Nielsen, J. Pines, and T. Kouzarides. 1999. HDAC4 deacetylase associates with and represses the MEF2 transcription factor. EMBO J. 18:5099–5107. [DOI] [PMC free article] [PubMed] [Google Scholar]
- 44.Sparrow, D.B., E.A. Miska, E. Langley, S. Reynaud-Deonauth, S. Kotecha, N. Towers, G. Spohr, T. Kouzarides, and T.J. Mohun. 1999. MEF-2 function is modified by a novel co-repressor, MITR. EMBO J. 18:5085–5098. [DOI] [PMC free article] [PubMed] [Google Scholar]
- 45.Youn, H.D., C.M. Grozinger, and J.O. Liu. 2000. Calcium regulates transcriptional repression of myocyte enhancer factor 2 by histone deacetylase 4. J. Biol. Chem. 275:22563–22567. [DOI] [PubMed] [Google Scholar]
- 46.Peng, S.L., A.J. Gerth, A.M. Ranger, and L.H. Glimcher. 2001. NFATc1 and NFATc2 together control both T and B cell activation and differentiation. Immunity. 14:13–20. [DOI] [PubMed] [Google Scholar]
- 47.Yang, S.H., A. Galanis, and A.D. Sharrocks. 1999. Targeting of p38 mitogen-activated protein kinases to MEF2 transcription factors. Mol. Cell. Biol. 19:4028–4038. [DOI] [PMC free article] [PubMed] [Google Scholar]
- 48.Tamir, Y., and E. Bengal. 2000. Phosphoinositide 3-kinase induces the transcriptional activity of MEF2 proteins during muscle differentiation. J. Biol. Chem. 275:34424-34432. [DOI] [PubMed] [Google Scholar]
- 49.Kato, Y., M. Zhao, A. Morikawa, T. Sugiyama, D. Chakravortty, N. Koide, T. Uoshida, R.I. Tapping, Y. Yang, T. Yokochi, and J.-D. Lee. 2000. Big mitogen-activated kinase regulates multiple members of the MEF2 protein family. J. Biol. Chem. 275:18534–18540. [DOI] [PubMed] [Google Scholar]
- 50.Zhao, M., L. New, V.V. Kravchenko, Y. Kato, H. Gram, F. di Padova, E.N. Olson, R.J. Ultvitch, and J. Han. 1999. Regulation of the MEF2 family of transcription factors by p38. Mol. Cell. Biol. 19:21–30. [DOI] [PMC free article] [PubMed] [Google Scholar]
- 51.Youn, H.D., T.A. Chatila, and J.O. Liu. 2000. Integration of calcineurin and MEF2 signals by the coactivator p300 during T-cell apoptosis. EMBO J. 19:4323–4331. [DOI] [PMC free article] [PubMed] [Google Scholar]
- 52.Fickett, J.W. 1996. Quantitative discrimination of MEF2 sites. Mol. Cell. Biol. 16:437–441. [DOI] [PMC free article] [PubMed] [Google Scholar]