

Abstract
After accumulation of target cell human leukocyte antigen (HLA)-C at inhibitory natural killer (NK) cell immune synapses, some HLA-C transfers from target cells to NK cell plasma membranes and cytoplasm. This unexpected intercellular transfer of HLA-C is dependent on NK receptor recognition, since HLA-Cw6 or -Cw4 but not -Cw3 transfer to an NK transfectant expressing killer Ig-like receptor (KIR)2DL1. Strikingly, live-cell time-lapse laser scanning confocal microscopy shows vesicles containing target cell green fluorescent protein–tagged HLA-C migrating away from immune synapses into NK cells. Unlike clustering of HLA-C at the immune synapse, intercellular transfer of HLA-C is dependent on NK cell ATP, but not target cell ATP. However, the intercellular transfer of HLA-C is not dependent on active polymerization of the actin cytoskeleton. In addition, different arrangements of HLA-C are seen at inhibitory NK immune synapses, and these alter as NK synapses mature, but in a fashion distinct from that seen upon T cell activation.
Keywords: MHC class I, KIR, green fluorescent protein, immunosurveillance, laser scanning confocal microscopy
Introduction
As an essential component of the innate immune system, NK cells participate in cytokine production and cytotoxicity against tumor and virus-infected cells independent of prior antigen stimulation (1). One way that NK cells survey a cell's state of health is to check for expression of MHC class I protein. This strategy for detecting diseased cells, to check for an error in the expression of self-proteins rather than directly detecting nonself molecules, is called the ‘missing self’ hypothesis (2). Human NK cells detect MHC class I protein via a variety of Ig-like and C-type lectin receptors (for a review, see references 3–6). Killer Ig-like receptors (KIRs)* with two Ig domains, KIR2DL1 and KIR2DL2 recognize the MHC class I proteins, HLA-Cw4 or -Cw6, and HLA-Cw3 or -Cw7, respectively (7, 8). At intercellular contacts between NK and target cells, i.e., at NK cell immune or immunological synapses, KIRs accumulate with their cognate MHC class I ligands in membrane domains segregated from domains containing intercellular adhesion molecule 1 and lymphocyte function–associated antigen 1 (9). Oligomerization of KIRs in the presence of cobalt or zinc (10–13) may facilitate such KIR/MHC aggregation at immune synapses (9, 14, 15).
Various immune receptors redistribute at the cell surface during immunosurveillance (16–19). T cell receptors and adhesion molecules cluster in unexpectedly large segregated membrane domains, i.e., supramolecular activation clusters, at immune synapses (20). In a model system using T cells interacting with protein-rich two dimensional lipid bilayers, peptide–MHC proteins were seen to initially accumulate in a ring around adhesion proteins and then move into a central patch upon recognition by TCRs (21). These and other observations (22, 23) suggest an important role in controlling T cell signaling (24–26), though the context in which immune synapse formation is important in vivo remains to be clarified (27, 28). Interestingly, the inhibitory NK cell immune synapse has inverted arrangements of MHC, intercellular adhesion molecule 1, and lymphocyte function associated antigen 1 in comparison to the mature activating T cell synapse (9, 20, 21; for a review, see reference 26). Here, we employed live-cell time-lapse laser scanning confocal microscopy (LSCM) to visualize in greater detail, the molecular recognition of HLA-C at human NK cell immune synapses. Unexpectedly, we observed intercellular transfer and dynamic organization of HLA-C at inhibitory human NK cell immune synapses.
Materials and Methods
Cell Lines and Transfectants.
721.221, an EBV-transformed B cell line selected to lack endogenous expression of MHC class I protein (29), was transfected to express COOH-terminal green fluorescent protein (GFP; reference 30)-tagged HLA-Cw3, -Cw4, and -Cw6, as described previously (9). 721.221 transfected with COOH-terminal GFP-tagged HLA-Cw6-TMG, i.e., HLA-Cw6 with the transmembrane region from HLA-G was also described previously (9). NK transfectants, YTS/Eco and YTS/KIR2DL1, were also described previously (31).
Preparation of Peripheral Blood NK Cells.
NK cells were acquired from lymphocyte-enriched buffy coat residues derived from multiple healthy donors (National Blood Transfusion Service, London, UK). PBMCs were isolated from the buffy coat by centrifugation on Ficoll-Paque Plus (Amersham Pharmacia Biotech) according to the manufacturer's instructions. Peripheral blood lymphocytes were cultured with irradiated (20,000 rad) 721.221 cells in a 4:3 ratio (106 PBL: 7.5×10⁵ irradiated 721.221/ml) for the generation of NK lines. The culture medium consisted of RPMI 1640 (GIBCO BRL) with 10% human serum (type AB; Sigma-Aldrich) supplemented with 1 mM l-glutamine, 1 mM sodium pyruvate, 1 mM penicillin-streptomycin, 1 mM MEM nonessential amino acids, and 20 μM β-mercaptoethanol (GIBCO BRL). 6–7 d later, pure NK cell cultures were obtained by removal of contaminating T cells stained with anti-CD3 mAb (UCHT1; BD PharMingen) by FACS® (Beckman Coulter). Pure CD3−CD56+ NK lines were cultured in RPMI 1640 (GIBCO BRL) with 10% human serum (type AB; Sigma-Aldrich) supplemented with 1 mM l-glutamine, 1 mM sodium pyruvate, 1 mM penicillin-streptomycin, 1 mM MEM nonessential amino acids, 20 μM β-mercaptoethanol (GIBCO BRL), and 100 U/ml h-r-IL-2 (Roche Laboratories) and stimulated with irradiated 721.221 cells in a 4:3 ratio (106 PBL: 7.5×10⁵ irradiated 721.221 cells/ml) immediately after sorting. NK cells were restimulated every 5–6 d with fresh medium containing IL-2. NK lines were phenotyped with respect to the levels of expression of CD16 (3G8; BD PharMingen), KIR2DL1 (HP3E4; BD PharMingen), KIR2DL2 (DX27; BD PharMingen) Ig-like Transcript-2 (HP-F1, a gift from M. López-Botet, Universitat Pompeu Fabra, Barcelona, Spain) and were periodically monitored to be CD3-negative and CD56-positive by antibody staining (with mAb UCHT1 and B159; BD PharMingen).
LSCM.
For live-cell imaging, NK cells and target cells (∼106 of each) were resuspended in 1 ml tissue culture medium containing no selective antibiotics. The cells were mixed and incubated in conical end centrifuge tubes for 45 min at 37°C, 5% CO2 unless otherwise indicated. After incubation, cells had fallen under gravity to the bottom of the tube. Cells were not centrifuged together, as in previous work (9). Excess media was removed and the cells were resuspended in ∼50 μl tissue culture medium and 7 μl was sealed between a plain glass slide and cover-slip. Live cells were imaged immediately by LSM510 (Zeiss) or TCS SP2 (Leica) using a 40× oil-immersion objective (numerical aperture 1.3 or 1.25). For 3D reconstructions of interacting cells, images were taken every 0.3 μm through the axis perpendicular to intercellular contact. A composite of these images was then either color coded for depth or projected as a 3D model of the cell conjugate.
Superior images to those seen previously (9) were obtained as the designs of the microscopes used have various features ensuring maximum light yield and high quality images. This is achieved by Digital Signal Processors, accurate centration of pinholes, new scanning mirrors, Acousto-Optical Tunable Filters, and fiber optic feeds for laser excitation, short light paths with improved dichroic mirrors and highly sensitive photomultipliers.
Percentages of the total amount of MHC at the synapse and within the NK cell were obtained by calculating the mean fluorescence intensity within various regions within cell conjugates. Numbers of synapses, occurrence of intercellular transfer of HLA-C and different distributions of HLA-C were acquired by scanning samples using transmitted light views, and characterizing any conjugates seen by their distribution of fluorescence. 721.221 transfectants were easily distinguished from NK cells or NK transfectants by their size and/or their bright GFP fluorescence. In all time-lapse images, zero times are arbitrarily defined.
Western Blot Analysis.
0.5 × 10⁶ YTS/KIR2DL1 cells were previously incubated with 0.5 × 10⁶ cells of either 221/Cw6-GFP or 221/Cw3-GFP and then purified by FACS®. These were then lysed in NuPage™ sample buffer (Invitrogen) containing the reducing agent DTT and analyzed by SDS-PAGE. Proteins were transferred to nitrocellulose and the membrane blocked with 5% milk powder in 0.1% Tween 20/PBS for 1 h. The blot was stained with anti-GFP mAb (JL-8; CLONTECH) diluted 1:7,000 in blocking solution, washed three times in 0.1% Tween 20/PBS, stained for 1 h with HRP-conjugated goat anti–mouse Ig (Pierce Chemical Co.), diluted 1:50,000 in blocking solution, and finally washed five times in 0.1% Tween 20/PBS. Immunoreactive bands were visualized by chemiluminescence according to manufacturer's instructions (SuperSignal West Pico; Pierce Chemical Co.).
Depletion of ATP and Impairment of Actin Cytoskeleton.
Stock solutions of reagents (all purchased from Sigma-Aldrich unless otherwise stated) were made up as follows: 3 M sodium azide in deionized water, 13 mM antimycin-A in DMSO, 1 mM cytochalasin D in DMSO, and 200 mM 2, 3-butanedione monoxime (BDM) in PBS, pH 7.4. For the depletion of ATP, NK and target cells where preincubated separately at 37°C, 5% CO2 in tissue culture medium with 50 mM sodium azide for 2 h, or glucose-free RPMI 1640 (Sigma-Aldrich) with 13 μM antimycin-A for 1 h. Where the drug was used to deplete ATP in both cells, the NK and target cells where then mixed together and incubated for a further hour. Where the drug was only used in one population of cells (i.e., the NK or target cells), the cells were first washed and resuspended in tissue culture medium, or glucose-free RPMI 1640 (Sigma-Aldrich) if antimycin-A was used, and then mixed together. The cytoskeletal inhibitor, cytochalasin D, which caps the end of actin microfilaments (32), was used in a similar method to the other drugs but added to both cell populations at a concentration of 10 μM and incubated for 1 h before the cells were mixed. BDM, which is known to target myosin and potassium channels (33, 34), was used at a final concentration of 20 mM in tissue culture medium and the cells were incubated separately for an hour before they were mixed and incubated together for a further hour.
Staining with mAbs.
Live YTS/KIR2DL1 and 221/Cw6-GFP cells were mixed and incubated as described previously, then fixed and permeabilized with Cytofix/Cytoperm (BD PharMingen) according to manufacturer's instructions. Cells were then incubated with 0.5% Triton X-100/PBS (pH 7.4) for 15 min before blocking with 5% BSA/0.1% Tween 20/PBS for 1 h at room temperature. Cells were then labeled with HC10 (pan class I MHC mAb; American Type Collection Culture) followed by Alexa-568® conjugated goat anti–mouse Ig (Molecular Probes) in the blocking solution. After incubations with each antibody, cells were washed three times with 0.1% Tween 20/PBS. Slides were then prepared as for imaging live cells.
Flow Cytometry and FACS®.
2 × 10⁶ NK cells and 2 × 10⁶ target cells were washed and resuspended in 1 ml tissue culture medium with no selective antibiotics, mixed, and incubated at 37°C, 5% CO2 for 1 h (see Fig. 2 a, b, and d) or various times (see Fig. 2 c). Cells were then incubated on ice for 5 min and vortexed gently to split up conjugates. The samples were fixed in 4% paraformaldehyde (Sigma-Aldrich) and stained with a CyChrome™ conjugated mAb against CD56 (B159; BD PharMingen) for separation of the CD56-positive population by FACS®. Cells were analyzed by flow cytometry (CELLQuest™; Becton Dickinson).
Figure 2.


Transfer of HLA-Cw6 transfer between populations of NK and target cells analyzed by flow cytometry. YTS/KIR2DL1 cells were incubated with either (a) 221/Cw3-GFP or (b) 221/Cw6-GFP for 1 h and subsequently fixed, stained for CD56, and analyzed by flow cytometry. Plots show level of CD56 expression (y-axis) against the level of GFP fluorescence (x-axis). CD56+ YTS/KIR2DL1 cells incubated with 221/Cw6-GFP targets have brighter GFP fluorescence compared with those incubated with 221/Cw3-GFP. (c) YTS/KIR2DL1 cells were incubated for 0, 20, 40, and 60 min with 221/Cw6-GFP or 221/Cw3-GFP targets. HLA-Cw6-GFP levels within purified YTS/KIR2DL1 populations were assessed by flow cytometry. Closed circles represent YTS/KIR2DL1 cells that were incubated with 221/Cw6-GFP targets and the open circles represent those incubated with 221/Cw3-GFP. Increasing median fluorescence intensity over time was observed in the case of YTS/KIR2DL1 cells incubated with 221/Cw6-GFP targets compared with those incubated with 221/Cw3-GFP. Data are representative of three separate experiments. (d) YTS/KIR2DL1 cells were incubated with either (i) 221/Cw3-GFP, (ii) 221/Cw6-GFP, or (iii) YTS/Eco with 221/Cw6-GFP for 1 h and subsequently fixed, stained for CD56, sorted by FACS®, and analyzed by flow cytometry. Plot shows number of cells (y-axis) against the level of GFP fluorescence (x-axis). CD56+ YTS/KIR2DL1 cells incubated with 221/Cw6-GFP targets have brighter GFP fluorescence compared with those incubated with 221/Cw3-GFP or compared with YTS/Eco incubated with 221/Cw6-GFP. (e) YTS/KIR2DL1 preincubated with both 221/Cw6-GFP and 221/Cw3-GFP were isolated by FACS®, lysed, and the total protein analyzed by SDS-PAGE followed by Western blot analysis with anti-GFP mAb. Lane 1 contains 221/Cw6-GFP cell lysate to indicate the size of HLA-Cw6-GFP. Lanes 2 and 3 are YTS/KIR2DL1 preincubated with 221/Cw6-GFP and 221/Cw3-GFP, respectively. Blot shown is representative of three independent experiments.
Online Supplemental Material.
Fig1cVideo1 and Fig3bVideo2 are movies of time-lapse confocal microscopy data, individual frames of which are shown in Fig. 1 c and 3 b, respectively. Fig6bVideo3 is a 360° rotating projection around the y-axis of the cells in Fig. 6 b. Fig6cVideo4 is a 360° rotating projection of the cells at the first time point of Fig. 6 c.
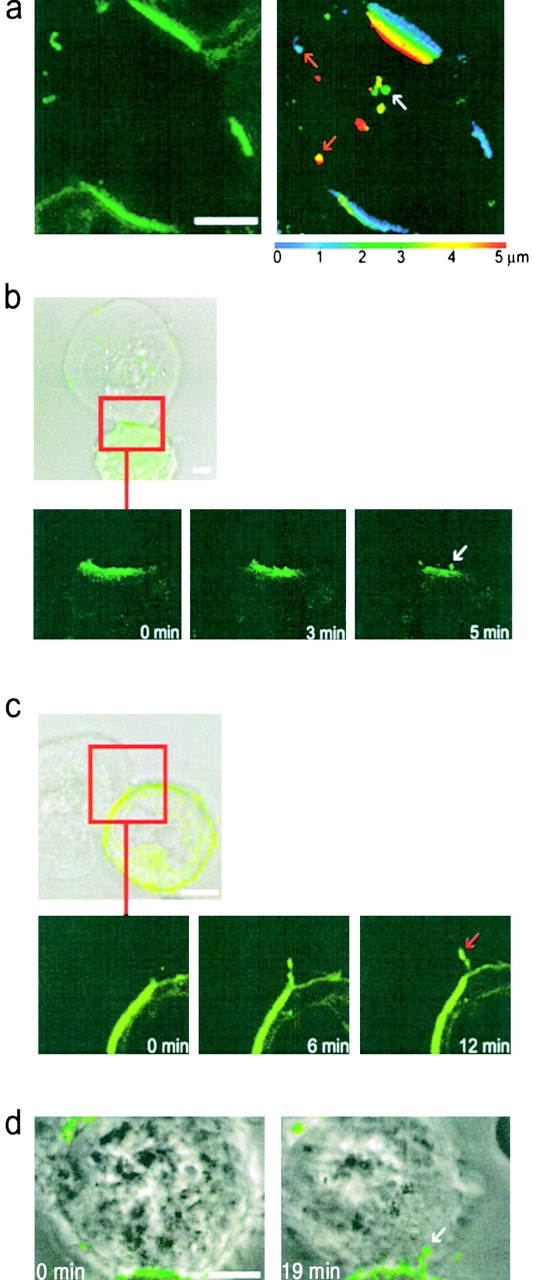
Figure 1.

HLA-Cw6-GFP transfers from target cells to NK cells at the inhibitory NK immune synapse. (a) A single 221/Cw6-GFP cell is seen interacting with two peripheral blood NK cells (NK line K010) demonstrating selective clustering and intercellular transfer of HLA-Cw6-GFP at the immune synapse. Figure shows the transmitted light overlaid with GFP fluorescence (left) and the corresponding GFP fluorescence only (right). Clustering of HLA-Cw6-GFP at the immune synapse and transferred vesicles of GFP are evident in the lower K010 NK cell only. (b) Vesicles containing HLA-Cw6-GFP, transferred from the target cell to the NK cell, are present on the NK cell surface and cytoplasm. Left panel shows a single 0.9 μm optical slice of GFP fluorescence in a K010 NK cell conjugated to a 221/Cw6-GFP target cell (bottom of the panel). HLA-Cw6-GFP is clustered at the immune synapse and there is also transfer of HLA-Cw6-GFP onto the NK cell surface. Images were taken every 0.3 μm through the cell perpendicular to the immune synapse and a composite of these images was then color coded for depth through the NK cell (right). The color scale used is below the panel; 0 μm (blue) represents the upper surface and 3.5 μm (red) the lower surface of the NK cell. Red and white arrows indicate vesicles containing HLA-Cw6-GFP on the plasma membrane and in the cytoplasm of the NK cell, respectively. (c) Top panel shows the transmitted light image overlaid with GFP fluorescence; lower three frames depict identical fields of view at different times, showing a vesicle containing HLA-Cw6-GFP moving away from the immune synapse into the NK cell. The white arrow indicates the position of the vesicle in the first frame. In all images, white scale bars represent 5 μm. Cells shown are representative of numerous cells in at least three independent experiments.
Figure 3.
HLA-C transfers from target cells to YTS/KIR2DL1 cells at the inhibitory NK immune synapse. (a) The left panel shows the GFP fluorescence of a single YTS/KIR2DL1 cell (center) conjugated to three 221/Cw6-GFP cells (top, bottom, and right), with GFP clustered at each immune synapse. As in Fig. 1 b, images were taken every 0.3 mm through the cell perpendicular to the immune synapse and a composite of these images was then color coded for depth through the YTS/KIR2DL1 cell (right). The color scale used is below the panel; 0 μm (blue) represents the upper surface and 5 μm (red) the lower surface of the YTS/KIR2DL1 cell. Red and white arrows point out vesicles containing HLA-Cw6-GFP on the plasma membrane and in the cytoplasm of the cell respectively. (b and c) Images of a single YTS/KIR2DL1 cell conjugated with 221/Cw6-GFP cells. Top panel shows the transmitted light image overlaid with GFP fluorescence; lower frames depict the field of view highlighted in red at three different times. These show a vesicle containing HLA-Cw6-GFP moving away from the immune synapse and into the NK cell. (b) The white arrow indicates the position of a vesicle containing HLA-Cw6-GFP. (c) The red arrow indicates the position of HLA-Cw6-GFP at the edge of the immune synapse. (d) Two images of a conjugate between YTS/KIR2DL1 and 221/Cw6-GFP taken at 0 and 19 min at 37°C. The white arrow points to a vesicle containing HLA-Cw6-GFP migrating from the 221/Cw6-GFP cell into the YTS/KIR2DL1 cell. In all images, white scale bars represent 5 μm. Cells shown are representative of numerous cells in at least five independent experiments.
Figure 6.
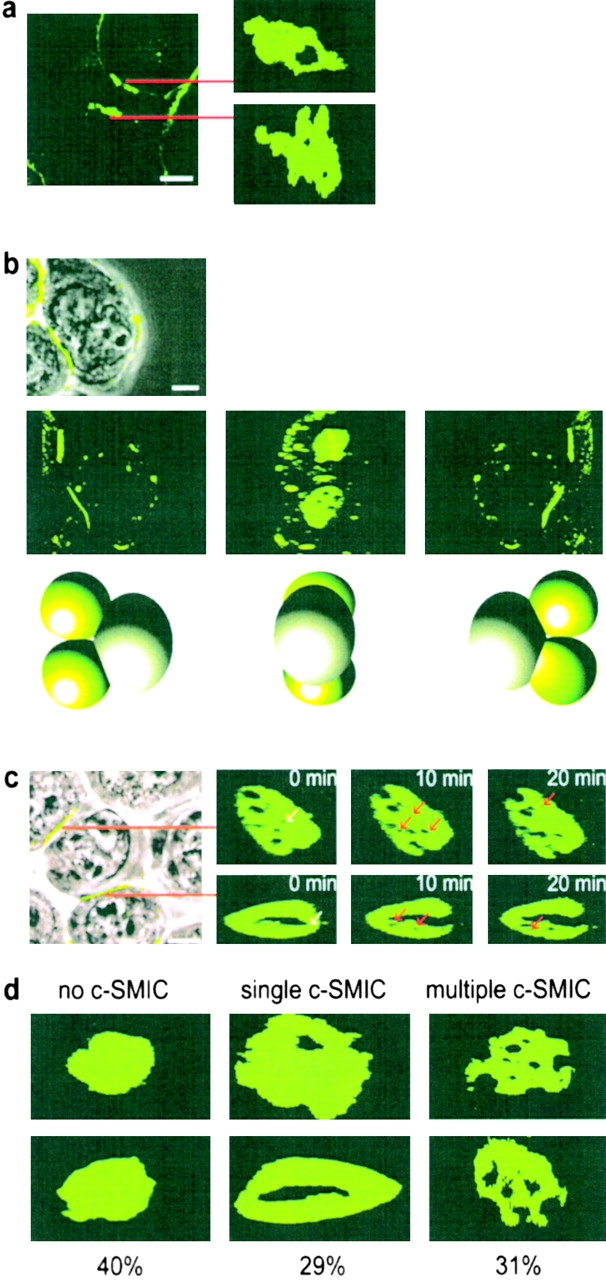
Supramolecular organization of HLA-C at inhibitory NK immune synapses. (a) Image of 221/Cw6-GFP cells surrounding a peripheral blood K010 NK cell (left) and the supramolecular organization of HLA-Cw6-GFP at the two immune synapses formed (right panels). (b) First panel shows an overlay of HLA-Cw6-GFP fluorescence and the transmitted light image of a single YTS/KIR2DL1 cell conjugated with two 221/Cw6-GFP cells (far left of frame). The next three frames depict a 3D reconstruction of the same cells, demonstrating the formation of two distinct supramolecular organizations by a single YTS/KIR2DL1 cell. Cartoons below each frame represent the orientation of the interacting cells in each frame, with green spheres representing the 221/Cw6-GFP cells. (c) Left panel shows the transmitted light image overlaid with GFP fluorescence of 221/Cw6-GFP cells surrounding a YTS/KIR2DL1 cell. The right panels show the dynamic supramolecular organization of GFP fluorescence at the two immune synapses indicated. White arrows indicate SMIC that disappear in the next frame; red arrows indicate new SMIC that were absent from the previous frame. In all images, white scale bars represent 5 μm. Cells shown are representative of numerous cells in at least three independent experiments. d shows the frequency of different patterns of p- and c-SMIC at the immune synapse between YTS/KIR2DL1 and 221/Cw6-GFP. Two images of each type of organization, i.e., no c-SMIC, single c-SMIC, and multiple c-SMIC are shown with the percentage that each was observed given below. A total of 73 synapses were analyzed over at least three independent experiments.
Results
Peripheral Blood NK Cell Lines Capture Target Cell HLA-C.
A CD56+CD16+CD3− NK cell line, K010, derived from peripheral blood of healthy donors, was phenotyped by flow cytometry. 50% of cells in this line were found to express KIR2DL1 (or KIR2DS1, since the mAb used cannot distinguish the intracellular portion of KIR), 39% expressed KIR2DL2 (or KIR2DS2), and 0% expressed Ig-like Transcript 2. After incubation for 30 min at 37°C, 5% CO2, with transfectants of 721.221 expressing GFP-conjugated HLA-Cw6 (221/Cw6-GFP), clustering of GFP was seen in ∼50% of NK/target cell intercellular contacts. This is consistent with KIR2DL1-induced clustering of HLA-Cw6 at NK immune synapses as described previously (9). However, when imaging live conjugates of NK and 221/Cw6-GFP cells by confocal microscopy in the current study, GFP-tagged HLA-Cw6 (HLA-Cw6-GFP) could also be seen on the NK cell, both at the cell surface and in small intracellular vesicles, only in conjugates at which inhibitory synapses were evident. Two peripheral blood NK cells simultaneously surveying a single 221/Cw6-GFP cell can be seen in Fig. 1 a. HLA-C has transferred only into the NK cell at which HLA-C clustered at the immune synapse, consistent with KIR2DL1-induced clustering and intercellular transfer of HLA-Cw6.
Images taken every 0.3 μm through cell conjugates, perpendicular to the immune synapses revealed that much of the captured HLA-Cw6-GFP is on the NK plasma membrane with some in the cytoplasm. This is represented in Fig. 1 b (right), in which GFP fluorescence has been colored according to its depth within the NK cell. Blue- and red-colored patches represent GFP fluorescence located on, or near to, the upper and lower NK cell surfaces, respectively. Green colored patches locate GFP ∼1.5–2 μm beneath the upper cell surface within the cytoplasm.
Using time-lapse imaging, vesicles containing HLA-Cw6-GFP are clearly seen migrating away from the immune synapse and into the cytoplasm of an NK cell from another peripheral blood NK cell line, K007, which expresses KIR2DL1 (Fig. 1 c and Fig1cVideo1). Vesicles migrated with nonBrownian direction, reminiscent of migration of vesicles along the cytoskeleton. The speed of one of these vesicles, or group of vesicles, at room temperature was calculated to be 0.04 μm s−1.
NK Cell Transfectants Expressing KIR2DL1 Capture Target Cell HLA-C.
To determine if intercellular transfer of HLA-C is dependent on recognition by KIRs, we used a CD28+ NK tumor line YTS, which does not endogenously express known KIRs, transfected with the ecotropic receptor (YTS/Eco) and subsequently mock transfected (YTS/Mock) or transfected using a retrovirus to express KIR2DL1 (YTS/KIR2DL1; reference 31). These cells were incubated with 221/Cw3-GFP, 221/Cw4-GFP, or 221/Cw6-GFP target cells and subsequently imaged for evidence of clustering and intercellular transfer of HLA-C at NK immune synapses. HLA-Cw6-GFP transferred into and onto YTS/KIR2DL1 but not to YTS/Eco or YTS/Mock whereas HLA-Cw3-GFP did not transfer to YTS/KIR2DL1 (Table I). HLA-Cw4-GFP also transferred to YTS/KIR2DL1, demonstrating that intercellular transfer of HLA-C is not exclusive to HLA-Cw6. Flow cytometry also revealed that YTS/KIR2DL1 cells incubated with 221/Cw6-GFP targets exhibited greater GFP fluorescence than those incubated with 221/Cw3-GFP targets (Fig. 2 a and b). The GFP fluorescence in YTS/KIR2DL1 incubated with 221/Cw6-GFP steadily increased >1 h (Fig. 2 c). YTS/KIR2DL1 cells incubated with 221/Cw6-GFP or 221/Cw3-GFP targets, and YTS/Eco incubated with 221/Cw6-GFP, were purified by FACS®. Purified YTS/KIR2DL1 cells that were incubated with 221/Cw6-GFP targets had higher GFP fluorescence intensity than the other two NK populations (Fig. 2 d). Since KIR2DL1 recognizes HLA-Cw4 and -Cw6 but not -Cw3, these data demonstrate that intercellular transfer of HLA-C is dependent upon NK receptor recognition.
Table I.
Inhibitory KIRs Induce Capture of Target Cell HLA-C
| NK cell | Target cell | Number of conjugates imaged | Percentage of conjugates exhibiting clustering of GFP at the immune synapse | Percentage of conjugates showing transfer of GFP to NK cell |
|---|---|---|---|---|
| YTS/KIR2DL1 | 221/Cw6-GFP | 415 | 66 | 49 (74) |
| YTS/ECO | 221/Cw6-GFP | 207 | 2 | 5 |
| YTS/MOCK | 221/Cw6-GFP | 122 | 2 | 2 |
| CW4 YTS/KIR2DL1 | 221/CW4-GFP | 20 | 80 | 65 (81) |
| CW4-TMG YTS/KIR2DL1 | 221/CW6TMG-GFP | 89 | 76 | 48 (63) |
| YTS/KIR2DL1 | 221/Cw3-GFP | 174 | 5 | 3 |
Various transfectants of 721.221 were imaged when conjugated to various YTS transfectants as listed. Table lists the percentage of cell conjugates for which GFP-tagged HLA-C clustered at the intercellular contact and the percentage of cell conjugates for which HLA-Cw6-GFP transferred to the NK cell. Numbers in parenthesis denote the percentage of those conjugates exhibiting clustering of GFP at the immune synapse that also show transfer of GFP into the NK cell.
To determine if the whole HLA-Cw6-GFP protein transfers to NK cells, YTS/KIR2DL1 was isolated by FACS® after incubation with 221/Cw6-GFP or 221/Cw3-GFP. Lysates of the sorted NK cells were then analyzed by SDS-PAGE and Western blot analysis with an anti-GFP mAb (JL-8). A band corresponding to the full size of HLA-Cw6-GFP was evident in the lane containing the lysate of YTS/KIR2DL1 incubated with 221/Cw6-GFP but no band was seen in the lane containing the lysate of YTS/KIR2DL1 cells incubated with 221/Cw3-GFP (Fig. 2 e), in accordance with the specificity of KIR2DL1. The position of the band is also consistent with the molecular weight predicted from the sequence of HLA-Cw6-GFP, further indicating that transfer of the whole HLA-Cw6-GFP protein occurs.
YTS/KIR2DL1 was also able to capture HLA-Cw6-GFP in which the transmembrane sequence was replaced with that of HLA-G, which lacks a critical transmembrane cysteine (221/Cw6-TMG-GFP; Table I). Thus, although recognition of HLA-Cw6 by a subset of NK cells is dependent on a cysteine within the transmembrane sequence (Cys309; reference 35), capture of HLA-Cw6 by YTS/KIR2DL1 is independent of this substitution.
Like the transfer of HLA-C into peripheral blood NK cells (Fig. 1), target cell HLA-Cw6-GFP transferred to both the plasma membrane and the cytoplasm of YTS/KIR2DL1 (Fig. 3 a). In time-lapse images, target cell HLA-Cw6-GFP was seen moving away from the immune synapse and into YTS/KIR2DL1, both from the center of the immune synapse into the cytoplasm of YTS/KIR2DL1 (Fig. 3 b) and from the edge of the synapse directly onto the NK cell surface (Fig. 3 c). Transfer of target cell HLA-Cw6-GFP into YTS/KIR2DL1 was seen at both room temperature (Fig. 3 b, Fig3cVideo2 and Fig. 3 c) and at 37°C, using a heated microscope stage (Fig. 3 d). However, it proved difficult to routinely image cells at 37°C due to cell movement during image acquisition. Confirming that the GFP transferred to NK cells marks the location of HLA-C, a mAb against class I MHC protein, HC10 (36), was also found to colocalize in the vesicles containing GFP (Fig. 4).
Figure 4.

Target cell GFP transferred into YTS/KIR2DL1 colocalizes with MHC class I protein. YTS/KIR2DL1 and 221/Cw6-GFP cell conjugates were fixed, stained with HC10, a pan-class I MHC mAb, and visualized with an Alexa-568® conjugated goat anti–mouse Ig (GAM; Molecular Probes). (a) Transmitted light of a single YTS/KIR2DL1 cell (center) conjugated to a single 221/Cw6-GFP cell (in top right of panel). b and c show the (green) GFP and (red) HC10/Alexa-568® GAM fluorescence in same field of view. (d) Overlay of the GFP (green) and HC10/Alexa-568® GAM (red). Pixels at which HC10 (red) colocalizes with GFP (green) are colored yellow. The white arrow indicates two vesicles containing HC10 and GFP in the YTS/KIR2DL1 cell. White scale bar represents 5 μm.
Quantification of transferred HLA-Cw6-GFP was achieved by software analysis of the mean fluorescence intensity within defined areas. Boundaries within an image were defined around the whole conjugate, the immune synapse, and the NK cell, and the fluorescence in each of these regions was used to calculate the fraction of the total HLA-Cw6-GFP that accumulated at the NK immune synapse, and transferred to the NK cell. In five NK immune synapses between YTS/KIR2DL1 and 221/Cw6-GFP, the amount of HLA-Cw6-GFP accumulated at the synapse was found to be 24, 10, 17, 31, and 27% of the total HLA-Cw6-GFP in the conjugate. In each of these five synapses, the respective amount of HLA-Cw6-GFP transferred to the NK cell was found to be 28, 6, 13, 6, and 22%, of the total HLA-Cw6-GFP in the conjugate. Thus, it is likely that variable amounts of target cell HLA-C transfer to NK cells, independent of the amount accumulated at the immune synapse. However, differences in the amount of HLA-C transferred into the NK cells could also be accounted for if each NK cell, before imaging, surveyed a variable number of target cells capturing some HLA-C from each.
Depletion of NK Cell ATP but not Target Cell ATP Inhibits Intercellular Transfer of HLA-Cw6-GFP.
Sodium azide and antimycin-A have been shown to deplete ATP in the cell lines used by 94 and 97%, respectively (9). Here, the number of conjugates that exhibited clustering of HLA-Cw6-GFP at the immune synapse and the transfer of HLA-Cw6-GFP from 221-Cw6-GFP to YTS/KIR2DL1 cells were quantified with or without the addition of these drugs. Previously, clustering of MHC at the NK immune synapse was observed to be independent of ATP depletion (9). Here however, live-cell confocal microscopy showed that ATP is required by the NK cell for intercellular transfer of HLA-C to take place (Fig. 5 a and b). This infers that intercellular transfer of HLA-C is an active process by the NK cell, independent of the target cell ATP.
Figure 5.


Intercellular transfer of HLA-C can be inhibited by depleting NK cell ATP but not by depleting target cell ATP or by impairing both cells' actin cytoskeleton. Plot shows percentage of cell conjugates exhibiting intercellular transfer of HLA-Cw6-GFP as a percentage of those where clustering of HLA-Cw6-GFP was observed at the immune synapse. Cells were incubated with or without the following drugs as labeled (a) 50 mM sodium azide, (b) 13 μM antimycin-A, (c) 10 μM cytochalasin D, or 20 mM BDM. Each plot is representative of >100 conjugates over three independent experiments.
Cytoskeletal Impairment Has no Effect on the Number of Conjugates where Transfer of HLA-Cw6-GFP Occurs.
The number of conjugates between YTS/KIR2DL1 and 221-Cw6-GFP cells where HLA-Cw6-GFP was transferred to the NK cell were also counted with or without the addition of cytoskeletal inhibitors. Cytochalasin D caps actin microfilaments stopping their interaction with other subunits (32) and BDM has been shown to impair receptor redistribution at the T cell immune synapse (17). However, neither cytochalasin D nor BDM addition had any effect on the number of cell conjugates in which transfer of HLA-C was observed (Fig. 5 c). Therefore, even though live-cell time-lapse imaging of transfer and uptake of HLA-C-GFP by NK cells showed movement of vesicles reminiscent of travel along the cytoskeleton (Fig. 1 c and Fig1cVideo1), active polymerization of actin and myosin operation, does not appear necessary for the process.
Distributions of HLA-C at Inhibitory NK Cell Immune Synapses.
Live-cell microscopy and 3D reconstruction of interacting cells, showed various distributions of HLA-Cw6-GFP at immune synapses between peripheral blood NK cells and 221/Cw6-GFP cells (Fig. 6 a, Fig6bVideo3.avi and Fig6cVideo4). Different distributions of HLA-Cw6-GFP were also seen at inhibitory immune synapses between YTS/KIR2DL1 and 221/Cw6-GFP cells. Strikingly, two distinct distributions of HLA-Cw6-GFP were produced by a single YTS/KIR2DL1 cell, simultaneously forming two inhibitory immune synapses with two different target cells (Fig. 6 b, Fig6bVideo3, and Fig6cVideo4). HLA-Cw6-GFP has also clearly transferred to this YTS/KIR2DL1 cell (Fig. 6 b and Fig6bVideo3).
Moreover, distributions of HLA-Cw6-GFP at some immune synapses were found to change over time, such that patches within the immune synapse devoid of HLA-Cw6-GFP appeared and disappeared as synapses matured (Fig. 6 c). Thus, distinct dynamic patterns of segregated protein domains occur at human NK cell immune synapses, even with cell lines expressing a particular MHC and KIR repertoire.
The central and peripheral protein domains at T cell immune synapses are named c- and p-supramolecular activation clusters (20). In keeping with this terminology, we name the peripheral and central protein domains at the inhibitory NK immune synapse as c- and p-supramolecular inhibition clusters (SMIC), such that HLA-C appears to accumulate in the p-SMIC with areas of HLA-C exclusion being c-SMIC. Inhibitory NK immune synapses could then be characterized as containing (a) no c-SMIC, (b) a single c-SMIC, or (c) multiple c-SMIC. Examples of each are shown in Fig. 6 d. Interestingly, the frequency of each type of inhibitory synapse was similar, 40, 29, and 31%, respectively (n = 73), for immune synapses formed between YTS/KIR2DL1 and 221/Cw6-GFP.
Discussion
In this study, time-lapse LSCM of GFP-conjugated HLA-C in live cells was used with resolution superior to that reported previously (9). This directly demonstrated transfer of HLA-C from target to peripheral blood NK cells (Fig. 1 and Fig1cVideo1) and variable supramolecular organization of HLA-C at NK immune synapses (Fig. 6, Fig6bVideo3, and Fig6cVideo4). Use of NK transfectants showed NK receptor-dependent transfer of HLA-C from target to NK cells (Figs. 2 and 3) and dynamic supramolecular organization of HLA-C at NK immune synapses (Fig. 6). Use of sodium azide and antimycin-A to deplete ATP showed that intercellular transfer of HLA-C is dependent on NK cell ATP, but not target cell ATP (Fig. 5 a and b). Use of cytochalasin D or BDM to impair the cells' cytoskeleton had no effect on transfer of HLA-C (Fig. 5 c). These data demonstrate an unexpected level of high order temporal and spatial supramolecular organization likely to be important in the integration of positive and negative signaling during NK immunosurveillance.
Recent studies investigating T cell–APC interactions have shown that MHC protein (37–39) and other membrane fragments (40) transfer from target to T cells upon TCR activation. OX40 ligand may transfer from target cells to T cells independent of TCR engagement (41). In addition, B cells have recently been shown to acquire antigen from target cells at a B cell immune synapse, perhaps in order to process and present membrane-bound antigens to T cells (42). Thus intercellular protein transfer between lymphocytes may be common.
The half-life of soluble KIR2DL1 binding to soluble HLA-C is around 0.3 s, more than an order of magnitude faster than the binding of TCR to MHC ligands and at least two orders of magnitude faster than mAb binding (10). Interestingly however, the half-life of KIR2DL1/HLA-Cw6 could be similar to TCR/MHC binding, if KIR2DL1 is clustered in the presence of zinc (11). The length of time NK cells remain in contact (i.e., the order of minutes) seems unlikely to be long enough for appreciable amounts of HLA-C to be captured without the induction of an active process by KIRs. This is consistent with the requirement for NK cell ATP (Fig. 5 a and b). Thus, the half-life of TCR/MHC and KIR/MHC proteins may be similar in order to facilitate a common mechanism of capturing MHC protein from target cells. This may correlate with internalization of KIR (43) and TCR (44) after ligation.
It is interesting that vesicles in NK cells and membrane domains at NK cell surfaces can both contain target cell HLA-C (Figs. 1, 3, and 4), and it will be important to characterize these vesicles and domains fully. There is evidence that tumor, dendritic, and EBV-transformed B cells can secrete vesicles of endosomal origin or ‘exosomes’ (45, 46). However, constitutive secretion of MHC protein in exosomes is too slow, at ∼10% of the total MHC protein in 24 h (46), to account for the capture of HLA-C by NK cells reported here.
It has been suggested (37) that transfer of MHC protein to activated T cells may serve to dampen immune responses by fratricide, i.e., neighboring T cells killing T cells expressing captured MHC/antigenic peptide. However, a similar function for transfer of MHC protein between lymphocytes could not be attributed to the transfer of target cell HLA-C to NK cells, as HLA-C transferred to NK cells would not usually present an antigenic peptide and, in general, HLA-C serves to inhibit rather than activate NK cells.
Alternatively, HLA-C transferred to NK cells could serve to directly signal inhibition of NK cytotoxicity until the level of captured HLA-C falls below a certain threshold. However, this would not be consistent with observations that NK cells cannot be inhibited from killing susceptible targets by the presence of bystander cells expressing inhibitory HLA-C, i.e., NK cells cannot be inhibited in trans (8). Instead, we speculate that continually assessing the level of HLA-C expression, through serial encounter with neighboring cells, could help set a threshold at which a single cell can be determined to express low levels of HLA-C. Perhaps this could prevent unwanted lysis of healthy cells of different type with an intrinsic heterogeneity in levels of HLA-C expression.
An example of how this could work would be if the captured HLA-C served to simply sequester a key NK molecule required for inhibition, such as the KIRs or the downstream Src homology 2 domain–containing tyrosine phosphatase, (SHP)-1 (47). The amount of KIR/SHP-1 sequestered by captured HLA-C would then depend on the amount of HLA-C expressed in the area of surveillance. A high level of HLA-C captured during serial encounters with several targets would then lead to a high amount of KIR/SHP-1 being sequestered. This in turn would then leave a lower amount of KIR/SHP-1 available for inhibition at a given NK synapse and hence a higher amount of HLA-C at that immune synapse may then be required to trigger inhibition.
An emerging theme in contemporary molecular immunology is that cell surface receptors need to be considered as part of supramolecular complexes of proteins and lipids that facilitate specific receptor conformations and distinct distributions at cell surfaces. That different arrangements of segregated protein domains (Fig. 6) can occur at inhibitory immune synapses raises a number of important new questions. For example, does supramolecular organization of HLA-C at the inhibitory synapse influence the outcome of the intercellular communication and how is the organization biophysically controlled? Clustering of similarly sized proteins could account for the segregation of protein domains at immune synapses (48, 49), but could not predict the specific arrangements of such segregated domains seen at the synapses. It has also been suggested that cell surface proteins are recruited to a particular localization within cell membranes through noncovalent interactions with cholesterol-rich membrane microdomains known as ‘lipid rafts’ (50). Indeed, clustering of lipid rafts induced by costimulation of T cells suggests an immunological importance of lipid raft motility (51, 52), but their role in immune synapse formation remains to be clarified. However, recent data shows that engagement of HLA-C by KIR blocks redistribution of lipid rafts (53), suggesting that organization of lipid rafts is not responsible for the different arrangements of HLA-C at NK inhibitory immune synapses seen in Fig. 6, Fig6bVideo3, and Fig6cVideo4.
In summary, both intercellular transfer and supramolecular organization of MHC protein at immune synapses embody new high order aspects of molecular recognition by NK cells. The NK immune synapse undoubtedly includes additional cell surface proteins critical to the intercellular communication, for example, HLA-E/CD94/NKG2 (54) the activating NK receptors including NKG2D, NKp44, NKp46, and NKp30 (55, 56) and their ligands, such as MIC (57) and viral hemagglutinin (58). An important next goal is to image the organization of these and other receptors at NK immune synapses.
Acknowledgments
We are grateful to Aaron Rae and Jonathan Styles for assistance with cell sorting and to Klaus Suhling and Margaret Dallman for critical reading of the manuscript.
This work is supported by grants from the Medical Research Council, the Biotechnology and Biological Sciences Research Council, and The Royal Society.
Footnotes
The online version of this article contains supplemental material.
Abbreviations used in this paper: BDM, 2,3-butanedione monoxime; GFP, green fluorescent protein; KIR, killer Ig-like receptor; LSCM, laser scanning confocal microscopy; SHP, Src homology 2 domain-containing tyrosine phosphatase; SMIC, supramolecular inhibition clusters.
References
- 1.Trinchieri, G. 1989. Biology of natural killer cells. Adv. Immunol. 47:187–376. [DOI] [PMC free article] [PubMed] [Google Scholar]
- 2.Ljunggren, H.G., and K. Karre. 1990. In search of the ‘missing self’: MHC molecules and NK cell recognition. Immunol. Today. 11:237–244. [DOI] [PubMed] [Google Scholar]
- 3.Lanier, L.L. 1998. NK cell receptors. Annu. Rev. Immunol. 16:359–393. [DOI] [PubMed] [Google Scholar]
- 4.Long, E.O. 1999. Regulation of immune responses through inhibitory receptors. Annu. Rev. Immunol. 17:875–904. [DOI] [PubMed] [Google Scholar]
- 5.Long, E.O., and S. Rajagopalan. 2000. HLA class I recognition by killer cell Ig-like receptors. Semin. Immunol. 12:101–108. [DOI] [PubMed] [Google Scholar]
- 6.Raulet, D.H., R.E. Vance, and C.W. McMahon. 2001. Regulation of the natural killer cell receptor repertoire. Annu. Rev. Immunol. 19:291–330. [DOI] [PubMed] [Google Scholar]
- 7.Colonna, M., E.G. Brooks, M. Falco, G.B. Ferrara, and J.L. Strominger. 1993. Generation of allospecific natural killer cells by stimulation across a polymorphism of HLA-C. Science. 260:1121–1124. [DOI] [PubMed] [Google Scholar]
- 8.Colonna, M., G. Borsellino, M. Falco, G.B. Ferrara, and J.L. Strominger. 1993. HLA-C is the inhibitory ligand that determines dominant resistance to lysis by NK1- and NK2-specific natural killer cells. Proc. Natl. Acad. Sci. USA. 90:12000–12004. [DOI] [PMC free article] [PubMed] [Google Scholar]
- 9.Davis, D.M., I. Chiu, M. Fassett, G.B. Cohen, O. Mandelboim, and J.L. Strominger. 1999. The human natural killer cell immune synapse. Proc. Natl. Acad. Sci. USA. 96:15062–15067. [DOI] [PMC free article] [PubMed] [Google Scholar]
- 10.Vales-Gomez, M., H.T. Reyburn, M. Mandelboim, and J.L. Strominger. 1998. Kinetics of interaction of HLA-C ligands with natural killer cell inhibitory receptors. Immunity. 9:337–344. [DOI] [PubMed] [Google Scholar]
- 11.Vales-Gomez, M., R.A. Erskine, M.P. Deacon, J.L. Strominger, and H.T. Reyburn. 2001. The role of zinc in the binding of killer cell Ig-like receptors to class I MHC proteins. Proc. Natl. Acad. Sci. USA. 98:1734–1739. [DOI] [PMC free article] [PubMed] [Google Scholar]
- 12.Rajagopalan, S., and E.O. Long. 1998. Zinc bound to the killer cell-inhibitory receptor modulates the negative signal in human NK cells. J. Immunol. 161:1299–1305. [PubMed] [Google Scholar]
- 13.Fan, Q.R., E.O. Long, and D.C. Wiley. 2000. Cobalt-mediated dimerization of the human natural killer cell inhibitory receptor. J. Biol. Chem. 275:23700–23706. [DOI] [PubMed] [Google Scholar]
- 14.Boyington, J.C., S.A. Motyka, P. Schuck, A.G. Brooks, and P.D. Sun. 2000. Crystal structure of an NK cell immunoglobulin-like receptor in complex with its class I MHC ligand. Nature. 405:537–543. [DOI] [PubMed] [Google Scholar]
- 15.Fan, Q.R., E.O. Long, and D.C. Wiley. 2001. Crystal structure of the human natural killer cell inhibitory receptor KIR2DL1-HLA-Cw4 complex. Nat. Immunol. 2:452–460. [DOI] [PubMed] [Google Scholar]
- 16.McCloskey, M.A., and M.M. Poo. 1986. Contact-induced redistribution of specific membrane components: local accumulation and development of adhesion. J. Cell Biol. 102:2185–2196. [DOI] [PMC free article] [PubMed] [Google Scholar]
- 17.Wülfing, C., and M.M. Davis. 1998. A receptor/cytoskeletal movement triggered by costimulation during T cell activation. Science. 282:2266–2269. [DOI] [PubMed] [Google Scholar]
- 18.Wülfing, C., M.D. Sjaastad, and M.M. Davis. 1998. Visualizing the dynamics of T cell activation: intracellular adhesion molecule 1 migrates rapidly to the T cell/B cell interface and acts to sustain calcium levels. Proc. Natl. Acad. Sci. USA. 95:6302–6307. [DOI] [PMC free article] [PubMed] [Google Scholar]
- 19.Krummel, M.F., M.D. Sjaastad, C. Wulfing, and M.M. Davis. 2000. Differential clustering of CD4 and CD3zeta during T cell recognition. Science. 289:1349–1352. [DOI] [PubMed] [Google Scholar]
- 20.Monks, C.R., B.A. Freiberg, H. Kupfer, N. Sciaky, and A. Kupfer. 1998. Three-dimensional segregation of supramolecular activation clusters in T cells. Nature. 395:82–86. [DOI] [PubMed] [Google Scholar]
- 21.Grakoui, A., S.K. Bromley, C. Sumen, M.M. Davis, A.S. Shaw, P.M. Allen, and M.L. Dustin. 1999. The immunological synapse: a molecular machine controlling T cell activation. Science. 285:221–227. [DOI] [PubMed] [Google Scholar]
- 22.Stinchcombe, J.C., D.C. Barral, E.H. Mules, S. Booth, A.N. Hume, L.M. Machesky, M.C. Seabra, and G.M. Griffiths. 2001. Rab27a is required for regulated secretion in cytotoxic T lymphocytes. J. Cell Biol. 152:825–834. [DOI] [PMC free article] [PubMed] [Google Scholar]
- 23.Wülfing, C., A. Bauch, G.R. Crabtree, and M.M. Davis. 2000. The vav exchange factor is an essential regulator in actin-dependent receptor translocation to the lymphocyte-antigen-presenting cell interface. Proc. Natl. Acad. Sci. USA. 97:10150–10155. [DOI] [PMC free article] [PubMed] [Google Scholar]
- 24.Delon, J., and R.N. Germain. 2000. Information transfer at the immunological synapse. Curr. Biol. 10:R923–R933. [DOI] [PubMed] [Google Scholar]
- 25.Dustin, M.L., and J.A. Cooper. 2000. The immunological synapse and the actin cytoskeleton: molecular hardware for T cell signaling. Nat. Immunol. 1:23–29. [DOI] [PubMed] [Google Scholar]
- 26.Bromley, S.K., W.R. Burack, K.G. Johnson, K. Somersalo, T.N. Sims, C. Sumen, M.M. Davis, A.S. Shaw, P.M. Allen, and M.L. Dustin. 2001. The immunological synapse. Annu. Rev. Immunol. 19:375–396. [DOI] [PubMed] [Google Scholar]
- 27.Dustin, M.L., P.M. Allen, and A.S. Shaw. 2001. Environmental control of immunological synapse formation and duration. Trends. Immunol. 22:192–194. [DOI] [PubMed] [Google Scholar]
- 28.Friedl, P., and M. Gunzer. 2001. Interaction of T cells with APCs: the serial encounter model. Trends. Immunol. 22:187–191. [DOI] [PubMed] [Google Scholar]
- 29.Shimizu, Y., and R. DeMars. 1989. Production of human cells expressing individual transferred HLA-A,-B,-C genes using an HLA-A,-B,-C null human cell line. J. Immunol. 142:3320–3328. [PubMed] [Google Scholar]
- 30.Tsien, R.Y. 1998. The green fluorescent protein. Annu. Rev. Biochem. 67:509–544. [DOI] [PubMed] [Google Scholar]
- 31.Cohen, G.B., R.T. Gandhi, D.M. Davis, O. Mandelboim, B.K. Chen, J.L. Strominger, and D. Baltimore. 1999. The selective downregulation of class I major histocompatibility complex proteins by HIV-1 protects HIV-infected cells from NK cells. Immunity. 10:661–671. [DOI] [PubMed] [Google Scholar]
- 32.Cooper, J.A. 1987. Effects of cytochalasin and phalloidin on actin. J. Cell Biol. 105:1473–1478. [DOI] [PMC free article] [PubMed] [Google Scholar]
- 33.Urwyler, N., P. Eggli, and H.U. Keller. 2000. Effects of the myosin inhibitor 2,3-butanedione monoxime (BDM) on cell shape, locomotion and fluid pinocytosis in human polymorphonuclear leucocytes. Cell. Biol. Int. 24:863–870. [DOI] [PubMed] [Google Scholar]
- 34.Schlichter, L.C., P.A. Pahapill, and I. Chung. 1992. Dual action of 2,3-butanedione monoxime (BDM) on K+ current in human T lymphocytes. J. Pharmacol. Exp. Ther. 261:438–446. [PubMed] [Google Scholar]
- 35.Davis, D.M., O. Mandelboim, I. Luque, E. Baba, J. Boyson, and J.L. Strominger. 1999. The transmembrane sequence of human histocompatibility leukocyte antigen (HLA)-C as a determinant in inhibition of a subset of natural killer cells. J. Exp. Med. 189:1265–1274. [DOI] [PMC free article] [PubMed] [Google Scholar]
- 36.Sernee, M.F., H.L. Ploegh, and D.J. Schust. 1998. Why certain antibodies cross-react with HLA-A and HLA-G: epitope mapping of two common MHC class I reagents. Mol. Immunol. 35:177–188. [DOI] [PubMed] [Google Scholar]
- 37.Huang, J.F., Y. Yang, H. Sepulveda, W. Shi, I. Hwang, P.A. Peterson, M.R. Jackson, J. Sprent, and Z. Cai. 1999. TCR-Mediated internalization of peptide-MHC complexes acquired by T cells. Science. 286:952–954. [DOI] [PubMed] [Google Scholar]
- 38.Hwang, I., J.F. Huang, H. Kishimoto, A. Brunmark, P.A. Peterson, M.R. Jackson, C.D. Surh, Z. Cai, and J. Sprent. 2000. T cells can use either T cell receptor or CD28 receptors to absorb and internalize cell surface molecules derived from antigen-presenting cells. J. Exp. Med. 191:1137-1148. [DOI] [PMC free article] [PubMed] [Google Scholar]
- 39.Patel, D., P. Arnold, G. White, J. Nardella, and M. Mannie. 1999. Class II MHC/peptide complexes are released from APC and are acquired by T Cell responders during specific antigen recognition. J. Immunol. 163:5201–5210. [PubMed] [Google Scholar]
- 40.Hudrisier, D., J. Riond, H. Mazarguil, J.E. Gairin, and E. Joly. 2001. Cutting edge: CTLs rapidly capture membrane fragments from target cells in a TCR signaling-dependent manner. J. Immunol. 166:3645–3649. [DOI] [PubMed] [Google Scholar]
- 41.Baba, E., Y. Takahashi, J. Lichtenfeld, R. Tanaka, A. Yoshida, K. Sugamura, N. Yamamoto, and Y. Tanaka. 2001. Functional CD4 T cells after intercellular molecular transfer of 0X40 ligand. J. Immunol. 167:875–883. [DOI] [PubMed] [Google Scholar]
- 42.Batista, F.D., D. Iber, and M.S. Neuberger. 2001. B cells acquire antigen from target cells after synapse formation. Nature. 411:489–494. [DOI] [PubMed] [Google Scholar]
- 43.Huard, B., L. Karlsson, and F. Triebel. 2001. KIR down-regulation on NK cells is associated with down-regulation of activating receptors and NK cell inactivation. Eur. J. Immunol. 31:1728–1735. [DOI] [PubMed] [Google Scholar]
- 44.Salio, M., S. Valitutti, and A. Lanzavecchia. 1997. Agonist-induced T cell receptor down-regulation: molecular requirements and dissociation from T cell activation. Eur. J. Immunol. 27:1769–1773. [DOI] [PubMed] [Google Scholar]
- 45.Wolfers, J., A. Lozier, G. Raposo, A. Regnault, C. Thery, C. Masurier, C. Flament, S. Pouzieux, F. Faure, T. Tursz, et al. 2001. Tumor-derived exosomes are a source of shared tumor rejection antigens for CTL cross-priming. Nat. Med. 7:297–303. [DOI] [PubMed] [Google Scholar]
- 46.Raposo, G., H.W. Nijman, W. Stoorvogel, R. Liejendekker, C.V. Harding, C.J. Melief, and H.J. Geuze. 1996. B lymphocytes secrete antigen-presenting vesicles. J. Exp. Med. 183:1161–1172. [DOI] [PMC free article] [PubMed] [Google Scholar]
- 47.Burshtyn, D.N., A.M. Scharenberg, N. Wagtmann, S. Rajagopalan, K. Berrada, T. Yi, J.P. Kinet, and E.O. Long. 1996. Recruitment of tyrosine phosphatase HCP by the killer cell inhibitor receptor. Immunity. 4:77–85. [DOI] [PMC free article] [PubMed] [Google Scholar]
- 48.van der Merwe, P.A., S.J. Davis, A.S. Shaw, and M.L. Dustin. 2000. Cytoskeletal polarization and redistribution of cell-surface molecules during T cell antigen recognition. Semin. Immunol. 12:5–21. [DOI] [PubMed] [Google Scholar]
- 49.Wild, M.K., A. Cambiaggi, M.H. Brown, E.A. Davies, H. Ohno, T. Saito, and P.A. van der Merwe. 1999. Dependence of T cell antigen recognition on the dimensions of an accessory receptor-ligand complex. J. Exp. Med. 190:31–41. [DOI] [PMC free article] [PubMed] [Google Scholar]
- 50.Simons, K., and E. Ikonen. 1997. Functional rafts in cell membranes. Nature. 387:569–572. [DOI] [PubMed] [Google Scholar]
- 51.Viola, A., S. Schroeder, Y. Sakakibara, and A. Lanzavecchia. 1999. T lymphocyte costimulation mediated by reorganization of membrane microdomains. Science. 283:680–682. [DOI] [PubMed] [Google Scholar]
- 52.Janes, P.W., S.C. Ley, and A.I. Magee. 1999. Aggregation of lipid rafts accompanies signaling via the T cell antigen receptor. J. Cell Biol. 147:447–461. [DOI] [PMC free article] [PubMed] [Google Scholar]
- 53.Lou, Z., D. Jevremovic, D.D. Billadeau, and P.J. Leibson. 2000. A balance between positive and negative signals in cytotoxic lymphocytes regulates the polarization of lipid rafts during the development of cell-mediated killing. J. Exp. Med. 191:347–354. [DOI] [PMC free article] [PubMed] [Google Scholar]
- 54.Braud, V.M., D.S. Allan, C.A. O'Callaghan, K. Soderstrom, A. D'Andrea, G.S. Ogg, S. Lazetic, N.T. Young, J.I. Bell, J.H. Phillips, et al. 1998. HLA-E binds to natural killer cell receptors CD94/NKG2A, B and C. Nature. 391:795–799. [DOI] [PubMed] [Google Scholar]
- 55.Moretta, A., C. Bottino, M. Vitale, D. Pende, C. Cantoni, M.C. Mingari, R. Biassoni, and L. Moretta. 2001. Activating receptors and coreceptors involved in human natural killer cell-mediated cytolysis. Annu. Rev. Immunol. 19:197–223. [DOI] [PubMed] [Google Scholar]
- 56.Lanier, L.L. 2001. On guard-activating NK cell receptors. Nat. Immunol. 2:23–27. [DOI] [PubMed] [Google Scholar]
- 57.Bauer, S., V. Groh, J. Wu, A. Steinle, J.H. Phillips, L.L. Lanier, and T. Spies. 1999. Activation of NK cells and T cells by NKG2D, a receptor for stress- inducible MICA. Science. 285:727–729. [DOI] [PubMed] [Google Scholar]
- 58.Mandelboim, O., N. Lieberman, M. Lev, L. Paul, T.I. Arnon, Y. Bushkin, D.M. Davis, J.L. Strominger, J.W. Yewdell, and A. Porgador. 2001. Recognition of haemagglutinins on virus-infected cells by NKp46 activates lysis by human NK cells. Nature. 409:1055–1060. [DOI] [PubMed] [Google Scholar]