

Abstract
Peptide acquisition by MHC class II molecules is catalyzed by HLA-DM (DM). In B cells, HLA-DO (DO) inhibits or modifies the peptide exchange activity of DM. We show here that DO protein levels are modulated during B cell differentiation. Remarkably, germinal center (GC) B cells, which have low levels of DO relative to naive and memory B cells, are shown to have enhanced antigen presentation capabilities. DM protein levels also were somewhat reduced in GC B cells; however, the ratio of DM to DO in GC B cells was substantially increased, resulting in more free DM in GC B cells. We conclude that modulation of DM and DO in distinct stages of B cell differentiation represents a mechanism by which B cells regulate their capacity to function as antigen-presenting cells. Efficient antigen presentation in GC B cells would promote GC B cell–T cell interactions that are essential for B cells to survive positive selection in the GC.
Keywords: HLA-DO, HLA-DM, antigen processing, MHC class II, germinal center B cells
Introduction
Recognition of antigen by CD4+ T cells requires the presentation of short, pathogen-derived peptides displayed in the binding groove of MHC class II molecules (1). Class II molecules assemble in the endoplasmic reticulum and are transported via the Golgi apparatus to endocytic organelles where they are loaded with peptide cargo (2). Peptide loading of class II molecules is directly catalyzed by the action of a class II-like molecule, DM, which also acts as a peptide editor (3). Whereas class II and DM molecules are expressed by all professional APC, the class II-like molecule, DO, is expressed only in B cells and thymic epithelium (4). DO physically associates with DM in the endoplasmic reticulum during and after transport to class II-positive endocytic organelles (5). Recent evidence indicates that the association of DO with DM impairs or alters the peptide exchange activity of DM (4, 6–9), leading to increased levels of cell surface class II–class II-associated invariant chain peptides (CLIP) and reduced levels of class II-peptide (6, 8).
The unique expression of DO in B cells suggests that DO plays a role in presentation of antigens recognized by T cells during cognate interactions. The precise molecular function of DO in B cells remains to be elucidated. To define a role for DO in human B cells, we analyzed DO expression during the course of B cell activation. Using primary tonsillar B cells, we determined that DO is down-modulated in B cells upon entry into the GC. GC B cells had low levels of DO protein relative to naive and memory B cells. Decreased DO expression was associated with reduced levels of cell surface class II-CLIP and increased surface class II-peptide. These data suggest that B cells modulate their antigen-processing capabilities during differentiation by altering DO levels.
Materials and Methods
Cell Lines.
T2, Pala, and Raji cells were maintained in Iscove's DME with 5–10% calf serum as described (10).
Antibodies.
Anti–human mAbs used for FACS analyses were as follows: mouse IgG1-FITC (isotype control), PE-conjugated anti-CD19 and -CD38, Cy-Chrome® (Cyc) and allophycoerythrin-conjugated anti-CD38 and biotinylated anti-CD80 (B7.1) and -CD86 (B7.2) (all obtained from BD PharMingen). FITC- and PE-conjugated anti-IgD and -IgG (Southern Biotech). Biotinylated mAbs were detected with Streptavidin-CyC (BD PharMingen). Purified mAbs used for T cell depletions, anti-CD3 (OKT-3), -CD4 (Leu3a) and -CD8 (OKT-8), were purchased from the mAb Core Facility at Memorial Sloan-Kettering Cancer Center (MSKCC). The following mAbs were purified from bioreactor supernatants using standard protein G–Sepharose (Amersham Pharmacia Biotech) or protein A–Sepharose (Sigma-Aldrich) affinity chromatography: Mags.DO5, MaP.DM1 (6), L243 (11), CerCLIP.1 (11), and 3D3 (12), and conjugated with FITC or biotin as described previously (13).
To produce anti-human DO mAbs, mice were immunized with affinity-purified DM–DO complexes (10) emulsified in Titer Max (CytRx Corp.) and screened for an immune response by ELISA. Splenocytes were fused to SP2/O-Ag14 cells, and culture supernatants from the hybridoma cells were screened by immunofluorescence using DO positive and negative B cells. One hybridoma secreted an mAb that recognized DO. This clone (Mags.DO5; IgG1), recognizes free DO in addition to DM–DO complexes.
Tonsillar Samples and Cell Isolation.
Surplus sections of fresh human tonsillar specimens were processed in the Department of Pathology (The New York Presbyterian Hospital) and used according to an IRB-approved protocol. Before FACS analysis, tonsillar samples were T-depleted by application of anti-CD3, -CD4 and -CD8 mAbs, followed by addition of magnetic beads (BioMag) coupled with anti–mouse IgG (Polysciences, Inc.). Alternatively, B cells were positively selected with anti-CD19 microbeads (Miltenyi Biotech).
FACS Analyses and Cell Sorting.
Tonsillar samples were stained for FACS analyses as previously described (14) and analyzed using an LSR flow cytometer (Becton Dickinson). For intracellular staining, samples were incubated with antibodies specific for surface proteins, fixed and permeabilized with Cytofix/Cytoperm (BD PharMingen), and stained according to the supplied protocol. To sort naive and GC B cell populations, T cell–depleted tonsillar cells were stained with anti–CD38-PE and –IgD-FITC, washed and sorted with a cell sorter (MoFlo; Cytomation).
Statistical Methods.
The statistical significance of differences among results for mean fluorescence intensity (MFI) and expression ratios were evaluated by the Student's t test, (data analysis toolpack; Excel). P values were determined using the two-tailed t test for DO, DM, class II, and CLIP, whereas the one-tailed test used B7.1 and B7.2.
Immunoblot Analysis and Quantitation.
Cell populations were extracted in Triton X-100 and SDS-PAGE gels loaded with threefold dilutions of cell lysates (106 to 3.7 × 10⁴ cells/lane). After transfer, membranes were incubated with rabbit antibodies to the cytoplasmic tails of DMβ (R.DMB/c; reference 11) and DOβ (R.DOB/c; reference 6) or for calnexin (Stressgen), detected with a goat anti–rabbit alkaline-phosphatase reagent (Jackson ImmunoResearch Laboratories) and quantitated by fluorescence (Vistra ECF; Amersham Pharmacia Biotech) with a molecular imager FX system and QuantityOne software (Bio-Rad Laboratories). The percent DOβ or DMβ in naive relative to GC B cells was calculated as: percent expression = (FIGC/FINaive) × 100. Analyses were considered valid only if similar values were obtained at a minimum of two cell equivalents.
Real-time PCR.
Total RNA was isolated from sorted cells, cDNA was generated using oligo-dT primers and Real-time PCR was performed according to the manufacturer's instructions (Roche) using the primer pairs: F-DMA, 5′AAAGCCCATCTGGACATCCTG-3′; R-DMA, 5′AGTGGAACTTGCGGAACAAATG-3′; F-DOB, 5′TCAAGGCACAG-ACTCTCCAGAAG-3′; R-DOB, 5′CCACAAACATCC-CCACATCACTG-3′. Raji cDNA was used to generate a standard curve from which the amount of DNA amplified in each sample was determined. The ratio of DMA to DOB message at four template concentrations was used to calculate relative DMA/DOB ratios within the naïve or GC B cell populations.
Results
GC B Cells Have Characteristics of Efficient APCs.
To examine the status of the class II antigen-processing pathway in human B cells, we initially measured levels of HLA-DR (DR) and class II–CLIP complexes on the surface of naive (IgD+ CD38−), GC (IgD− CD38+) and memory (CD38− IgG+) B cells from fifteen human tonsillar specimens (Fig. 1 A; reference 15). Additionally, the levels of the costimulatory molecules, B7.1 and B7.2, were determined. Flow cytometric data for a representative tonsillar specimen are shown in Fig. 1 B, and the data for all tonsillar specimens are provided in Fig. 2 . As expected in a heterogeneous set of primary human tissues, cell-surface levels of each of these proteins varied among the samples. To compensate, we normalized the signal (MFI) in GC and memory B cells to that measured in naive B cells of the same specimen. On average, cell-surface DR on GC B cells was ∼150% of that observed for naive B cells, whereas for memory B cells, surface DR decreased to ∼70% of that observed for naive B cells.
Figure 1.


Surface phenotype of B cell subsets. T cell–depleted tonsillar cells were stained with mAbs as indicated and analyzed by three-color flow cytometry. (A) Identification of naive (IgD+ CD38−), GC (IgD− CD38+), and memory (IgG+ CD38−) B cell subsets. (B) Histograms indicate surface expression (solid lines) of DR, class II-CLIP, and B7.1 and B7.2 on naive, GC and memory B cells, electronically gated as defined in A. The MFI obtained after staining with specific mAb for the cell-surface marker of interest less the MFI obtained with an isotype control (dashed lines) is shown on each histogram (specific MFI). The bar graphs below each set of histograms show plots of the three distinct B cell subsets versus the specific MFI for each stain. N, naive; GC, germinal center; M, memory.
Figure 2.

GC B cells have the phenotype of an efficient APC. Purified tonsillar B cells were analyzed by FACS for cell-surface DR, class II-CLIP, B7.1 and B7.2 on naive, GC and memory B cell as in Fig. 1. MFI levels for (A) DR, (B) class II-CLIP, (C) and B7.1 and (D) B7.2 in naive B cells was set at 100% and the values obtained for GC and memory B cells of the same specimen were normalized to this value (Relative Expression). (E) Ratio of cell surface DR to Class II-CLIP in B cell subsets based on specific MFI levels for each stain in each subset. (F) Ratio of intracellular DM to DO-specific MFI in distinct B cell subsets based on FACS analyses as in Fig. 3. Solid bars represent the mean for all samples (n = 15). Individual tonsils are denoted by distinct symbols in all analyses. The tonsil shown in Figs. 1 and 3 is denoted by  . The statistical significance of potential differences between B cell subsets was established by the Student's t test. N.S., nonsignificant.
Cell-surface class II-CLIP expression provides an indirect measurement of surface class II-peptide expression (11). GC and memory B cells displayed 50 and 30% less class II-CLIP, respectively, than naive B cells (Fig. 2 B). The heterogeneity observed for class II-CLIP levels among the different tonsillar samples can be attributed to CLIP binding of different class II alleles with varying affinities (16). As expected, naive and memory B cells had reduced cell-surface B7.1 and B7.2, and these molecules were significantly increased on GC B cells (Fig. 2, C and D). Taken together, the findings of increased cell-surface expression of DR, B7.1, and B7.2 and decreased levels of surface expressed class II-CLIP on GC B cells support that GC B cells are primed for optimal antigen presentation.
DO Expression Is Down-regulated in GC B Cells.
Since the density of cell-surface class II-CLIP correlates with augmented DM expression relative to DO expression (6, 8, 17), our observations suggested that GC B cells express elevated DM levels or, alternatively, reduced DO levels. DO and DM protein levels in tonsillar B cell subsets were examined by intracellular staining with mAbs to DO and DM. These analyses showed that DO is significantly decreased in GC B cells relative to naive (P < 0.0001) and memory (P < 0.0001) B cells (Fig. 3, A and B) . Overall, DO levels in GC B cells were reduced 60–90% relative to the levels in naive B cells. Although DM also was decreased in GC B cells relative to naive and memory B cells, the decrease in DM levels (0–35% of naive) was not nearly so dramatic as that observed for DO (Figs. 3, A and C). Indeed, in 4 out of 15 tonsillar specimens, DM levels were not decreased in GC B cells. Taken together, these data demonstrate that DO protein levels are modulated during B cell differentiation.
Figure 3.

DO expression is down-modulated in GC B cells. Tonsillar B cells were stained with mAbs to IgD and CD38 or IgG and CD38, permeabilized, and stained with mAbs specific for DO (Mags.DO5-FITC) and DM (MaP.DM1-FITC). (A) Histograms show intracellular levels of DO and DM (solid lines) or of an isotype-matched control (dashed lines) in electronically gated B cell subsets from a representative sample. Specific MFI for each protein of interest is shown on the histograms. Bar graphs below each set of histograms shows the MFI for each protein in the B cell subsets. Summary of intracellular levels of DO (B) and DM (C) in all samples. The tonsillar specimen shown in A and Fig. 1 is denoted by . The Student's t test was applied to establish the significance of observed differences between the specific MFI. N.S., nonsignificant.
Biochemical Analysis of DO Protein Levels in GC and Naive B Cell Subsets.
To quantitate the degree of altered DO (and DM) expression in GC B cells, we sorted GC and naive B cells from five tonsillar samples (Fig. 4 A). DOβ and DMβ protein levels were measured for the two populations by quantitative Western blotting (Fig. 4 B). In the specimens evaluated, GC B cells had 3–29% of DOβ levels expressed by naive B cells, whereas DMβ levels ranged from 13 to 71% of the naive levels (Fig. 4 C). In each case, DOβ protein levels decreased more in GC B cells than did DMβ. These biochemical analyses are consistent with the results for DO and DM expression obtained by intracellular staining and flow cytometry (Fig. 3). Since most if not all DO is associated with DM in human B cells (5), these data indicate that naive B cells bear a greater proportion of DM complexed with DO relative to GC B cells, which express more free DM. Free DM in GC B cells would afford more efficient class II-peptide loading, as is suggested by the low levels of class II-CLIP, and would promote the capacity of GC B cells to function as APCs.
Figure 4.
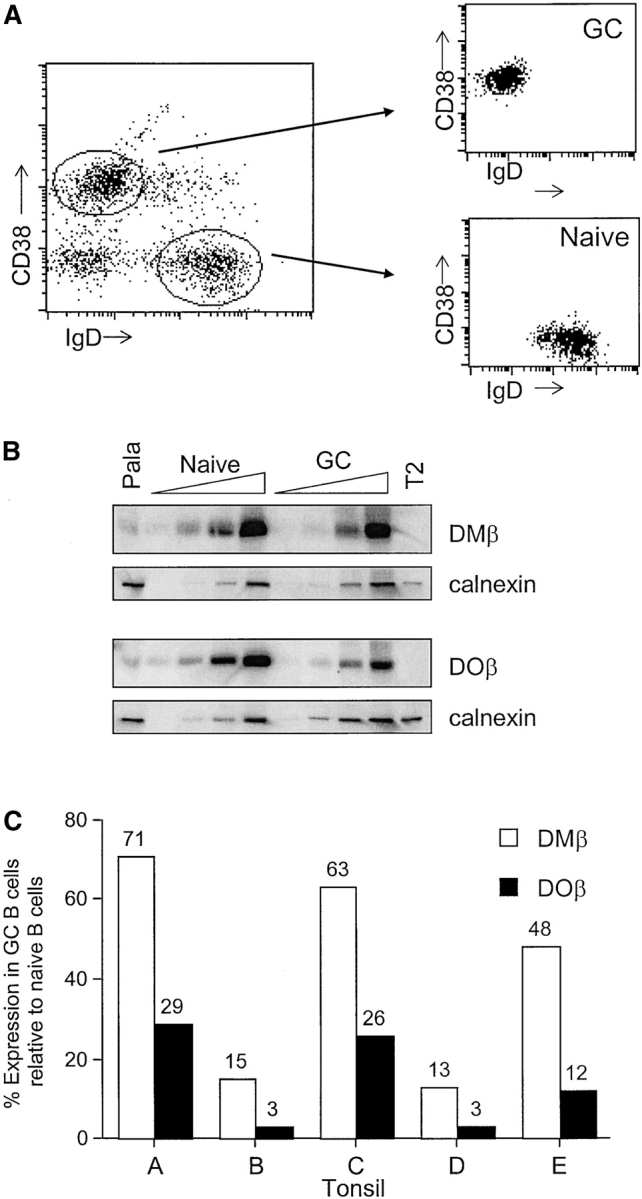
DO expression is increased in naive B cells relative to GC B cells (A) Tonsillar B cells were sorted to separate naive (IgD+ CD38−) and GC (IgD− CD38+) B cells. (B) Detergent lysates from sorted B cells were separated by SDS-PAGE, transferred to membranes, and probed with antibodies to the cytoplasmic tails of DOβ (R.DOB/c) and DMβ (R.DMB/c). Pala and T2 cells were included as positive and negative controls, respectively. To demonstrate proportional loading, each blot was also probed with an antiserum specific for calnexin. (C) Summary of DOβ and DMβ levels in GC B cells relative to naive B cells for five different tonsil samples. Tonsils used for this analysis are denoted in Figs. 2 and 3 as follows: A (+); B (); C (□); D ( ); E (
 ).
).
DR/CLIP Ratios Directly Correlate with DM/DO Ratios in B Cell Subsets.
To estimate the efficiency of MHC class II peptide loading, the ratio of cell-surface DR relative to cell-surface class II-CLIP (DR/CLIP) in the tonsillar B cell subsets was determined. A low DR/CLIP ratio indicates a low efficiency of peptide loading, whereas a high ratio suggests efficient peptide loading. The analyses revealed that GC B cells have high DR/CLIP ratios (average 4.2), whereas naive and memory B cells have low DR/CLIP ratios (average 1.1 and 1.2, respectively; Fig. 2 E). The trend for DR/CLIP ratios essentially was identical among all tonsillar samples studied, and the differences were highly significant (Fig. 2 E).
The high DR/CLIP ratios observed in GC B cells suggested that DM/DO ratios should be similarly elevated in GC B cells. Indeed, as shown in Fig. 2 F, GC B cells had the highest ratio of DM relative to DO (1.5 to 5.7), whereas naive and memory B cells demonstrated similar DM/DO ratios (0.6 to 1.7). As expected, elevated DM/DO correlated with high DR/CLIP in GC B cells (Fig. 2, compare E and F). These analyses point to the functional consequence of modulation of DO relative to DM in B cells. Cells that express high levels of DO, such as naive and memory cells, have more class II-CLIP and, therefore, less class II-peptide at the cell surface. On the other hand, cells with relatively low levels of DO, such as GC B cells, have reduced class II-CLIP and, thus, more class II-peptide that allows for productive and efficient stimulation of T cells.
Mechanism for Decreased DO and DM Levels in GC B Cells.
Two possible mechanisms to account for decreased DO and DM in GC B cells are protein degradation and transcriptional regulation. To determine if decreased DM and DO in GC B cells resulted from decreased transcription, we sorted naive and GC B cells and assessed DMA and DOB transcription by real-time PCR. Expression of DMB and DOA was not analyzed, since it has been shown that these genes are regulated in a manner identical to DMA (18). To normalize for differences in RNA concentrations, we determined the ratio of DMA message relative to DOB message in naive and GC B cells for different samples. As shown in Fig. 5 , there was no significant alteration in the ratio of DMA message relative to that for DOB. We conclude that transcriptional regulation of these genes is not responsible for the reduced DO/DM ratio in GC B cells. Treatment of tonsillar B cells with protease inhibitors as well as inhibitors of the vacuolar ATPase, has not yet provided conclusive evidence that protein degradation is the mechanism (unpublished data).
Figure 5.

Decreased DO expression in GC B cells is not due to transcriptional regulation. Message levels for DMA and DOB in naive and GC B cells were assessed by Real-time PCR. The graph shows the ratio of DMA message relative to DOB message in naive or GC B cells for four samples. Tonsils used for this analysis are denoted in Figs. 2 and 3 as follows: A (); B (); C (○); D ( ).
).
Discussion
The unique expression of DO in B cells, but not in dendritic cells or macrophages, suggests that DO may impact the timing and efficiency of T cell–B cell interactions. Our examination of the class II antigen-processing pathway in naive, GC and memory B cells showed that GC B cells down-modulate DO and, thus, express more DM than DO. The functional significance of the modulation of DO is evident from analyses of class II-CLIP on the surface of these B cell subsets. GC B cells had significantly lower levels of cell-surface class II-CLIP compared with that displayed on naive and memory B cells. These data suggest that down-modulation of DO in GC B cells favors efficient presentation of peptide antigen to CD4 T cells. Coupled with expression of high levels of the costimulatory molecules, B7.1 and B7.2, it is clear that GC B cells are poised for efficient T cell stimulation. Such interactions would provide survival signals required during B cell positive selection in the germinal center.
Our findings that GC B cells have reduced DO and surface class-CLIP and elevated class II-peptide, B7.1 and B7.2 support that these cells are optimally active APCs. Since DO inhibits or alters DM-mediated peptide loading, these findings suggest that antigen processing and presentation by B cells is more active in GC B cells relative to naive B cells. Indeed, several studies have demonstrated that naive B cells are poor APCs, which was, however, attributed to the lack of expression of costimulatory molecules (19). Our data suggest that elevated DO expression in naive B cells contributes to the inefficient presentation capabilities of naive B cells. As dendritic cells, rather than naive B cells, are responsible for activation of antigen-specific T helper cells during initiation of antibody responses (20–22), expression of DO in naive B cells may skew the activation of antigen-specific T cells during the initiation of immune responses onto dendritic cells.
The precise physiological role for DO in vivo remains unknown. Studies to date have shown that DO is an inhibitor of DM-mediated peptide exchange, perhaps in a pH-dependent manner (4, 6–9, 17). In addition, studies in the murine system have shown that H2-O (mouse homologue of DO)–deficient B cells present endocytosed antigens more efficiently than H2-O–sufficient cells, and that presentation of antigens via surface immunoglobulin on B cells results in equal or slightly improved presentation of antigens when H2-O is present (7). Collectively, these results suggest that DO alters or modifies peptide loading of class II molecules and function to skew antigen presentation toward proteins that have been internalized by surface immunoglobulin. Our results demonstrate that DO protein levels are actively modulated in vivo during B cell development, resulting in efficient and productive antigen presentation by GC B cells. However, it is likely that other factors such as increased protease expression or modulation of endocytic compartments may also contribute to increased presentation capabilities of GC B cells (23). We conclude that, down-regulation of DO in GC B cells may provide a mechanism by which GC B cells foster their own interaction with antigen-specific T cells and survive the process of B cell positive selection.
Acknowledgments
We thank Derek Sant'Angelo and Matt Tector for helpful discussions and critical reading of the manuscript, and Zahra Asgary, Olivia Lou, Frances Weis-Garcia, and Patrick Anderson for excellent technical assistance.
This work was supported by Public Health Service grants AI46202 (to L.K. Denzin) and P30-CA08748 (to MSKCC) and by funds from The Bressler Scholar Endowment Fund and The Society of MSKCC (to L.K. Denzin) and the Dorothy Rodbell Cohen Foundation (to E. Schattner).
References
- 1.Pieters, J. 2000. MHC class II-restricted antigen processing and presentation. Adv. Immunol. 75:159–208. [DOI] [PubMed] [Google Scholar]
- 2.Geuze, H.J. 1998. The role of endosomes and lysosomes in MHC class II functioning. Immunol. Today. 19:282–287. [DOI] [PubMed] [Google Scholar]
- 3.Jensen, P.E., D.A. Weber, W.P. Thayer, L.E. Westerman, and C.T. Dao. 1999. Peptide exchange in MHC molecules. Immunol. Rev. 172:229–238. [DOI] [PubMed] [Google Scholar]
- 4.Alfonso, C., and L. Karlsson. 2000. Nonclassical MHC class II molecules. Annu. Rev. Immunol. 18:113–142. [DOI] [PubMed] [Google Scholar]
- 5.Liljedahl, M., T. Kuwana, W.P. Fung-Leung, M.R. Jackson, P.A. Peterson, and L. Karlsson. 1996. HLA-DO is a lysosomal resident which requires association with HLA-DM for efficient intracellular transport. EMBO J. 15:4817–4824. [PMC free article] [PubMed] [Google Scholar]
- 6.Denzin, L.K., D.B. Sant'Angelo, C. Hammond, M.J. Surman, and P. Cresswell. 1997. Negative regulation by HLA-DO of MHC class II-restricted antigen processing. Science. 278:106–109. [DOI] [PubMed] [Google Scholar]
- 7.Liljedahl, M., O. Winqvist, C.D. Surh, P. Wong, K. Ngo, L. Teyton, P.A. Peterson, A. Brunmark, A.Y. Rudensky, W.P. Fung-Leung, and L. Karlsson. 1998. Altered antigen presentation in mice lacking H2-O. Immunity. 8:233–243. [DOI] [PubMed] [Google Scholar]
- 8.van Ham, S.M., E.P. Tjin, B.F. Lillemeier, U. Gruneberg, K.E. van Meijgaarden, L. Pastoors, D. Verwoerd, A. Tulp, B. Canas, D. Rahman, et al. 1997. HLA-DO is a negative modulator of HLA-DM-mediated MHC class II peptide loading. Curr. Biol. 7:950–957. [DOI] [PubMed] [Google Scholar]
- 9.Kropshofer, H., A.B. Vogt, C. Thery, E.A. Armandola, B.C. Li, G. Moldenhauer, S. Amigorena, and G.J. Hammerling. 1998. A role for HLA-DO as a co-chaperone of HLA-DM in peptide loading of MHC class II molecules. EMBO J. 17:2971–2981. [DOI] [PMC free article] [PubMed] [Google Scholar]
- 10.Denzin, L.K., and P. Cresswell. 1995. HLA-DM induces CLIP dissociation from MHC class II alpha beta dimers and facilitates peptide loading. Cell. 82:155–165. [DOI] [PubMed] [Google Scholar]
- 11.Denzin, L.K., N.F. Robbins, C. Carboy-Newcomb, and P. Cresswell. 1994. Assembly and intracellular transport of HLA-DM and correction of the class II antigen-processing defect in T2 cells. Immunity. 1:595–606. [DOI] [PubMed] [Google Scholar]
- 12.Kaye, J., S. Porcelli, J. Tite, B. Jones, and C.A. Janeway, Jr. 1983. Both a monoclonal antibody and antisera specific for determinants unique to individual cloned helper T cell lines can substitute for antigen and antigen-presenting cells in the activation of T cells. J. Exp. Med. 158:836–856. [DOI] [PMC free article] [PubMed] [Google Scholar]
- 13.Coligan, J.E., A.M. Kruisbeek, D.H. Margulies, E.M. Shevach, and W. Strober. 1991. Current Protocols in Immunology. Vol. 1. John Wiley and Sons, Inc., New York.
- 14.Sant'Angelo, D.B., P. Cresswell, C.A. Janeway, Jr., and L.K. Denzin. 2001. Maintenance of TCR clonality in T cells expressing genes for two TCR heterodimers. Proc. Natl. Acad. Sci. USA. 98:6824–6829. [DOI] [PMC free article] [PubMed] [Google Scholar]
- 15.Liu, Y.J., C. Barthelemy, O. de Bouteiller, C. Arpin, I. Durand, and J. Banchereau. 1995. Memory B cells from human tonsils colonize mucosal epithelium and directly present antigen to T cells by rapid up-regulation of B7-1 and B7-2. Immunity. 2:239–248. [DOI] [PubMed] [Google Scholar]
- 16.Malcherek, G., V. Gnau, G. Jung, H.G. Rammensee, and A. Melms. 1995. Supermotifs enable natural invariant chain-derived peptides to interact with many major histocompatibility complex-class II molecules. J. Exp. Med. 181:527–536. [DOI] [PMC free article] [PubMed] [Google Scholar]
- 17.van Ham, M., M. van Lith, B. Lillemeier, E. Tjin, U. Gruneberg, D. Rahman, L. Pastoors, K. van Meijgaarden, C. Roucard, J. Trowsdale, et al. 2000. Modulation of the major histocompatibility complex class II-associated peptide repertoire by human histocompatibility leukocyte antigen (HLA)-DO. J. Exp. Med. 191:1127–1136. [DOI] [PMC free article] [PubMed] [Google Scholar]
- 18.Taxman, D.J., D.E. Cressman, and J.P. Ting. 2000. Identification of class II transcriptional activator-induced genes by representational difference analysis: discoordinate regulation of the DN α/DO β heterodimer. J. Immunol. 165:1410–1416. [DOI] [PubMed] [Google Scholar]
- 19.Parker, D.C. 1993. T cell-dependent B cell activation. Annu. Rev. Immunol. 11:331–360. [DOI] [PubMed] [Google Scholar]
- 20.Guery, J.C., F. Ria, and L. Adorini. 1996. Dendritic cells but not B cells present antigenic complexes to class II-restricted T cells after administration of protein in adjuvant. J. Exp. Med. 183:751–757. [DOI] [PMC free article] [PubMed] [Google Scholar]
- 21.Metlay, J.P., E. Pure, and R.M. Steinman. 1989. Control of the immune response at the level of antigen-presenting cells: a comparison of the function of dendritic cells and B lymphocytes. Adv. Immunol. 47:45–116. [DOI] [PubMed] [Google Scholar]
- 22.Sprent, J. 1980. Features of cells controlling H-2-restricted presentation of antigen to T helper cells in vivo. J. Immunol. 125:2089–2096. [PubMed] [Google Scholar]
- 23.Lankar, D., H. Vincent-Schneider, V. Briken, T. Yokozeki, G. Raposo, and C. Bonnerot. 2002. Dynamics of major histocompatibility complex class II compartments during B cell receptor–mediated cell activation. J. Exp. Med. 195:461–472. [DOI] [PMC free article] [PubMed] [Google Scholar]