Abstract
Common lymphoid progenitors (CLP) are generated in adult bone marrow (BM), but the intermediate steps leading to T cell commitment are unknown, and so is the site at which this commitment occurs. Here, we show that colonies arising in the spleen 12 days after BM injection harbor T cell precursors that are undetectable in BM. These precursors did not generate myeloid cells in vivo but repopulated the thymus and the peripheral T cell compartment much faster than did CLP. Two lineage negative (Lin−) subpopulations were distinguished, namely CD44+ Thy1− cells still capable of natural killer generation and transient low-level B cell generation, and T cell–restricted CD44− Thy1+ cells. At a molecular level, frequency of CD3ɛ and preTα mRNA was very different in each subset. Furthermore, only the CD44− Thy1+ subset have initiated rearrangements in the T cell receptor β locus. Thus, this study identifies extramedullary T cell progenitors and will allow easy approach to T cell commitment studies.
Keywords: thymus, CFU-S, transcription factor, lymphoid differentiation, commitment
Introduction
Adult bone marrow (BM)* contains hematopoietic stem cells (HSCs) that can give rise to all lineages of blood cells (1). Purified HSCs isolated from mice have been arranged hierarchically according to the gradual loss of self-renewal capacity (2, 3). The multipotent progenitor (MPP) pool can be divided into long-term self-renewing HSC, short-term self-renewing HSCs, and non-self-renewing MPPs (3). The productive life span of a stem cell is probably related to its self-renewal capacity, even though stochastic factors such as nonspecific homing of injected cells and interactions with certain environments may influence its survival.
Most HSCs were thought to differentiate first into lineage-committed common lymphoid (CLP) or common myeloid progenitors which subsequently generated mature lymphoid- and myeloid-lineage populations (4–6). However, a common B cell/macrophage precursor has recently been isolated, suggesting that other differentiation pathways exist (7). In adults, progenitor differentiation occurs principally within BM, but precursor cells may have to migrate elsewhere to complete their development (8). This is the case of T cell precursors.
It is not yet known where and when CLP commitment to T cell differentiation occurs. Hours after intravenous grafting of BM cells into whole body–irradiated recipients, rare donor-type cells are detected in the recipient thymus (9, 10). These cells, however, are not capable of immediate expansion: a progeny is only detected 2 wk later (8). This lag period has been considered necessary for the seeding and differentiation of donor BM in order to generate committed precursors capable of thymus reconstitution. It is usually assumed that this differentiation process takes place in the host BM, but the possibility remains that T cell commitment may require proliferation and differentiation in other sites.
Indeed, after BM injection into irradiated hosts, donor-type cells also migrate to spleen and generate colonies, as first discovered by Till and McCulloch (11). Each spleen colony is produced by the proliferation of a single stem cell, or colony-forming unit (12). Proof of this clonal process was provided by Wu et al. (13), who followed radiation-induced karyotype modifications (14). Cells with an identical karyotype were later detected in the thymus and lymph nodes, suggesting that these colonies contained precursors with lymphoid differentiation potential (15). We subsequently demonstrated that cells from individual day 12 spleen colonies (SC12) were capable of T and B lymphocyte generation and transient thymus reconstitution (16). Collectively, these findings suggest that SC12 may contain lymphoid-committed progenitors. The relationship between SC12 progenitors and BM progenitors is unknown. It is possible that SC12 and BM progenitors have identical characteristics. Alternatively, BM cell expansion in spleen colonies may be accompanied by their differentiation and the generation of progenitors with unique properties.
In this study, we compared the phenotypic and molecular characteristics of lineage-negative (Lin−) BM cells with those of SC12 Lin−, and compared their potential for differentiation in vivo and in vitro. Our results demonstrate that SC12 Lin− cells have unique properties and are a major source of precursors committed to T cell differentiation.
Materials and Methods
Mice.
C57BL/6-Ly5.1 (Thy1.2) mice were purchased from Transgenic Alliance (L'Arbresle, France) and CDTA (Orléans, France). C57BL/6-Ly5.2 (Thy1.2) and C57BL/6-nu/nu (nude) (Thy1.2, Ly5.2) mice were purchased from CERJ (Le Genest St. Isles, France) and C57BL/6 CD3−/−-Ly5.1 (Thy1.2) from CDTA. C57BL/Ba (Thy1.1, Ly5.2) and C57BL/6 recombination activating gene (Rag)2−/−-Ly5.1 mice were bred and maintained in the animal care facility at the Necker Institute (Paris, France). 4–12-wk-old male and female mice were used.
Thymectomy.
C57BL/6 CD3−/−-Ly5.1 mice were anesthetized and positioned on their back; an incision was made in the skin above the sternum and the thymus removed with pincers. The skin wound was closed with surgical metal clips.
Generation of SC12.
C57BL/6-Ly5.1 and thymectomized (Tx) C57BL/6 CD3−/−-Ly5.1 hosts were exposed to lethal (950 rad) whole-body irradiation from a 137Cs source and maintained on water containing antibiotics (neomycin sulfate 1 g/500 ml) for 1 wk. C57BL/Ba BM cells (6 × 10⁴) were then injected intravenously via the retroorbital sinus. For generation of SC12 in nude hosts, mice received a sublethal dose of 800 rad and 18 × 104 BM cells intravenously from C57BL/6-Ly5.1 donors. After 12 d, the recipients' spleens were removed and individual spleen colonies were excised and pooled for subsequent studies.
Antibodies, Flow Cytometry, and Cell Sorting.
The following mAbs were used for flow cytometry and/or cell sorting: anti-CD3ɛ (145–2C11; BD PharMingen); anti-CD4 (RM4–5; BD PharMingen); anti-CD5 (53–7.3); anti-CD8α (53–6.7; BD PharMingen); anti-CD11b/Mac-1 (M1/70; CALTAG); anti-CD19 (1D3; BD PharMingen); anti-CD24/HSA (M1/69; BD PharMingen); anti-CD16/CD32 (2.4G2); anti-CD34 (RAM34; BD PharMingen); anti-CD43 (S7); anti-CD44 (1D7; BD PharMingen); anti-CD90.1/Thy1.1 (HO22.1); anti-CD45.2/Ly5.2 (104–2.1); anti-CD45R/B220 (RA3–6B2; BD PharMingen); anti-CD117/c-kit (2B8; BD PharMingen); anti-CD127/IL-7Rα (B12–1; BD PharMingen); anti-NK1.1 (PK136; BD PharMingen); anti-Sca-1 (E13–161.7; BD PharMingen); antierythroid (TER119); anti-TSA1/Sca-2 (MTS35; BD PharMingen); anti–TCR-β (H57–597; BD PharMingen); and anti-Vα2 (B20.1; BD PharMingen). These antibodies were conjugated to biotin (revealed by streptavidin-RED613 (GIBCO BRL) or streptavidin-APC (BD PharMingen)), FITC, APC, PE, and PerCP for four-color analysis and cell sorting. Flow cytometry and cell sorting were performed on a FACSCalibur™ (Becton Dickinson) and a FACSVantage™ (Becton Dickinson), respectively.
For analysis of SC12 populations, cells were first incubated with an unconjugated rat antibody (Ter119) specific for the erythroid marker. Erythroid cells were removed with sheep anti–rat IgG-conjugated beads (Dynabeads M-450; Dynal A.S.) and the remaining cells were labeled with antibodies recognizing Ly5.2 (donor population) and lineage (Lin) antigens (CD3, CD19, Mac-1, NK1.1, and TCR-αβ). Ly5.2+ Lin− cells represented ∼5–8% of such depleted populations.
Other single-cell suspensions were stained with mAbs as indicated in figure legends. Dead cells were excluded by size and structural characteristics. Data were analyzed with CellQUEST™ software (Becton Dickinson).
In Vivo Transfer of Precursor Cells.
Host mice were irradiated (600 rad) and precursor cells were injected intrathymically or intravenously. Intrathymic injections were performed as described elsewhere (16). Briefly, 3 h after irradiation, 4–5-wk-old C57BL/6-Ly5.2 mice were anesthetized and positioned on their backs; a small incision (<5 mm) was made in the skin above the sternum. Cells were injected into one thymic lobe in a 20-μl volume using a Hamilton syringe. The skin wound was closed with surgical metal clips.
Donor T cells were recovered from lymph nodes, spleen and BM of hosts reconstituted by intravenous transfer (sublethally irradiated C57BL/6 Rag2−/−-Ly5.1 mice). The lymph nodes sampled were the pooled axillary, inguinal, and mesenteric nodes, estimated to represent approximately half the total body lymph node mass (17). BM recovery was calculated based on the assumption that two femora and two tibiae represent 25% of total BM (18). Consequently, the size of the T cell pool was calculated with the following formula: 2×LN+1×Spleen+4×BM (LN, number of donor T cells in collected lymph nodes; Spleen, number of donor T cells collected in spleen; BM, number of donor T cells collected in two femora and two tibiae).
The number of NK cells was calculated with the following formula: Spleen+4×BM (Spleen: number of donor NK cells collected in spleen; BM: number of donor NK cells collected in two femora and two tibiae).
In Vitro Colony-forming Assay.
After pretreatment, total CFU-C were quantified in Complete Methylcellulose Medium with Recombinant Cytokines and Erythropoietin (MethoCult M3434; StemCell Technologies, Inc.) or in MethoCult M3230 routinely supplemented with optimal concentrations of murine recombinant IL-3 (1 ng/ml), stem cell factor (SCF 100 ng/ml), IL-6 (100 U/ml) and erythropoietin (2 U/ml). Sorted cell populations were plated in a final volume of 1 ml at densities ranging from 0.2–5 × 10⁵ cells per culture dish (FALCON 1008). Colonies were scored on day 7–8.
TCR Gene Rearrangements.
Cells were lysed by freezing the pellet to –80°C, followed by heating to 95°C for 10 min in 10 μl of H20/100,000 cells. 1 μl of proteinase K (10 mg/ml/100,000 cells) was added and each sample was incubated for 30 min at 65°C, followed by 10 min at 95°C. All PCR runs were performed with equalized samples (as determined by Cβ quantification in non saturating conditions with 30 amplification cycles) on an average of 104 cells. TCR-β chain DJ and V(D)J rearrangements were analyzed by using PCR primers in previously described conditions (19, 20). VJγ rearrangements were amplified by using two 5′ primers recognizing, respectively, the Vγ2 gene and the Vγ5 gene, and one 3′ primer recognizing the Jγ1 gene. Primers and probes were a gift from P. Pereira (Pasteur Institute, Paris, France). Vα-Jα rearrangements were studied as described previously (21). The amplification products were analyzed on 1.5% agarose gel and visualized by ethidium bromide staining.
RT-PCR.
Limiting numbers of Lin− cells were sorted using a FACSVantage™ flow cytometer equipped with an automatic cell deposition unit (Becton Dickinson). RT-PCR analysis was performed as described previously (22). Briefly, cells in each well were lyzed, mRNAs coding for the genes of interest were reverse-transcribed using specific 3′ primers, and cDNAs were amplified in a modified nested two-step PCR procedure. Plating efficiency was determined by the simultaneous amplification of the mRNA coding for the house keeping gene HPRT.
RT primers were: CD3ɛ: 5′-GATGGCTCATAGTCTGGGTT-3′; GATA-2: 5′-GGTGACTTCTCTTGCATGCACTT-3′; HPRT: 5′-TCCAACACTTCGAGAGGTCC-3′; Pax5: 5′-TGATCCTGTTGATGGAGCTG-3′; and preTα: 5′-CCTGGGCTTTGTTCTTCCTG-3′. For the first PCR, 5′ primers were: CD3ɛ: 5′-ACCAGTGTAGAGTTGACGTG-3′; GATA-2: 5′-TTCTTCTGCAGGGGGTAGTGTAG-3′; HPRT: 5′-GGGGGCTATAAGTTCTTTGC-3′; Pax5: 5′-AGGACATGGAGGAGTGAATC-3′; preTα: 5′-AACAGGTAGCTCCTGGCTGCA-3′. For CD3ɛ, GATA-2, HPRT, Pax5, and preTα, 3′ primers were the same as for the RT reaction. For the second PCR, 5′ primers were: CD3ɛ: 5′-TTTCTCGGAAGTCGAGGACA-3′; GATA-2: 5′-GACTATGGCAGCAGTCTCTTCC-3′; HPRT: 5′-GTTCTTTGCTGACCTGCTGG-3′; Pax5: 5′-TTTGTGAATGGACGGCCACT-3′; preTα: 5′-GCGTCAGGTGTCAGGCTCTA-3′; 3′ primers were: CD3ɛ and Pax5 (same primer as for the RT reaction); GATA-2: 5′-GGTGGTTGTCGTCTGACAATT-3′; HPRT: 5′-TGGGGCTGTACTGCTTAACC-3′; and preTα: 5′-GAGCAGTAGTGTCCAGCATC-3′. None of the primer combinations amplify genomic DNA. The amplification products were analyzed on 1.5% agarose gel and visualized by ethidium bromide staining.
The interpretation of our data depends on the sensitivity of our RT-PCRs assessed by several approaches. First, we always tested plating efficiency, by HPRT amplification. Second, we compared the relative efficiency of our RT-PCRs, by determining the slopes of PCR product accumulation with different cycles, in nonsaturating conditions using real time PCR (Taqman; Perkin Elmer). We found that the slopes were parallel, indicating similar efficiency. These results indicate that the message for each gene should be amplified when expressed at the same frequency as HPRT (the calculated number of HPRT mRNA molecules/cell is 5–10; reference 23). Finally, we studied individual cells known to express these different genes: Pax5 (B lymphocytes); CD3ɛ (T lymphocytes); and preTα (the TCR-β transfected SCID thymocyte cell line SCB29; reference 24). We could amplify these genes in all individual cells studied. In CD44− CD25+ TN thymocytes, 96% expressed CD3ɛ mRNA and 75% preTα mRNA (25). To determine frequencies, we used a wide range (from 1 to 1,000) of cell numbers (Table I). As frequency estimates can only be calculated when negative and positive wells are present, the cell concentrations we used to calculate frequencies varied according to the population and the gene studied (Table I).
Table I.
Cell Densities (Cells per Well) Used for the Limiting Dilution RT-PCR Analysis
| BM Lin− cells | SC12 Lin− CD44+ cells | SC12 Lin− CD44− cells | |
|---|---|---|---|
| GATA-2 | 1 | 100, 10, 5 | 100, 10, 5 |
| Pax5 | 500, 50 | 1,000, 50, 10 | 1,000, 500, 200 |
| CD3ε | 500, 200, 100 | 200, 100, 50 | 1 |
| pre-Tα | 1,000 | 200, 100, 50 | 100, 10, 5 |
Results
Characterization of the Lin− Population in SC12.
To generate spleen colonies, we injected 6 × 10⁴ syngeneic Ly5.2+ BM cells from C57BL/Ba mice into lethally irradiated C57BL/6-Ly5.1 host mice. Using these experimental conditions, 6–8 colonies were formed on the spleen surface 12 d later; these colonies were nonconfluent and each contained an average of 107 cells. The majority of SC12 cells were erythroid (Ly5.2− Ter119+), but specific depletion of this population yielded ∼106 Ly5.2+ donor cells per host.
We first compared the frequency of Lin− cells among Ly5.2+ cells from BM and SC12, using a cocktail of mAbs recognizing the following differentiated cells: T cells (anti–TCR-αβ and anti-CD3), B cells (CD19), NK cells (NK1.1), and granulocytes and macrophages (Mac-1). As described previously (26), <5% of Ly5.2+ BM cells were Lin−. In contrast, 14.5 ± 3.4% (n = 17) of Ly5.2+ SC12 donor cells were Lin−.
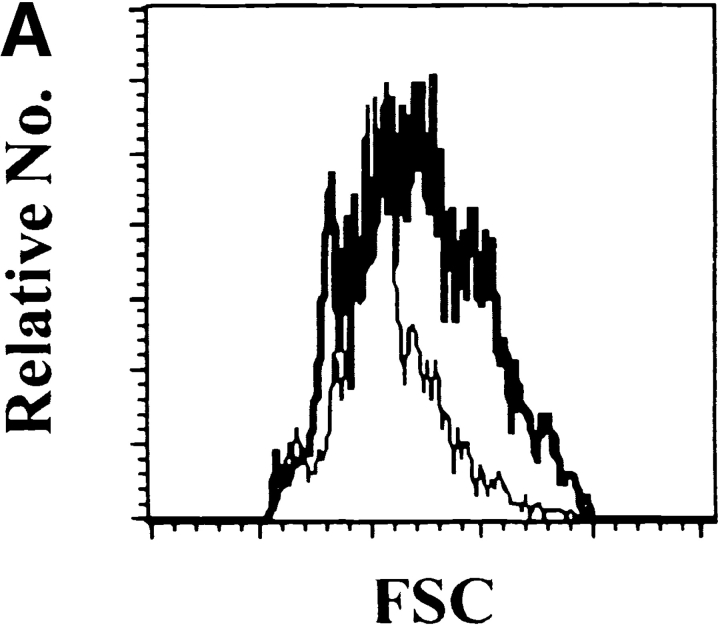
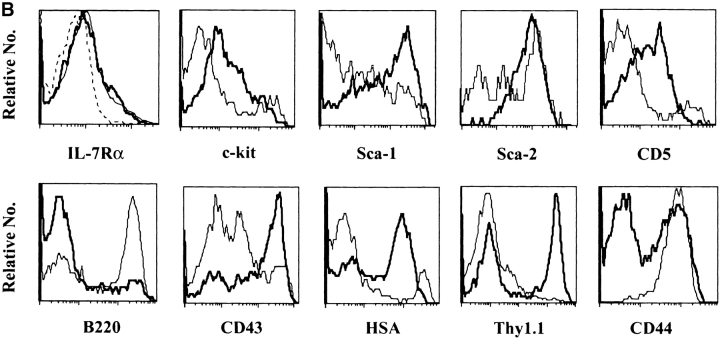
We then compared the characteristics of these Lin− cells derived from BM and SC12. SC12 Lin− cells were, on average, larger than their BM counterparts (Fig. 1 A). CD16/CD32, CD34, AA4.1 (data not shown), and IL-7Rα (Fig. 1 B) expression was similar in the two populations. The frequency of c-kit, Sca-2, and CD5-expressing cells was higher in SC12 than in BM Lin− cells, but most cells expressed less of these molecules, when compared with the high expressing BM population. Most SC12 cells were Sca-1+, and Sca-1high populations were much more abundant as compared with BM Lin− cells (Fig. 1 B). BM and SC12 Lin− cells also differed by their B220, CD43, HSA, Thy1.1, and CD44 expression (Fig. 1 B from left to right). Most BM Lin− cells expressed B220 antigen (a marker of B and NK cell precursors; reference 27), while most SC12 Lin− cells were B220−. CD43high and HSAhigh cells, corresponding to markers of pro-T cells (5), were very rare among the BM Lin− but frequent among SC12 Lin− cells. Thus, SC12 Lin− cells appeared to be enriched in T cell–committed precursors relative to BM Lin− cells. Thy1.1+ cells were rare in the BM Lin− subset, and most of them were Thy1.1low. In contrast about half of SC12 Lin− cells were Thy1.1high. Besides, SC12 Lin− cells contained a CD44− population, that was not found in BM Lin− subset.
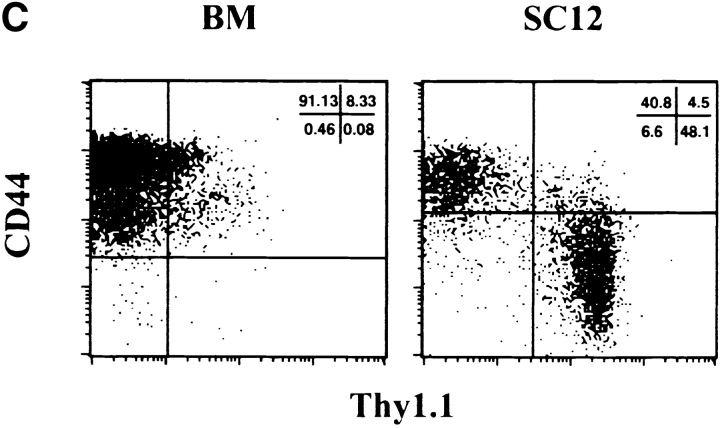
Figure 1.
Comparative analysis of surface antigen expression among BM Lin− and SC12 Lin− populations. BM and SC12 cell suspensions were labeled with antibodies recognizing Ly5.2 (donor population) and lineage antigens (CD3, CD19, Mac-1, NK1.1, and TCR-αβ). Results show the Ly5.2+ Lin− gated populations, the dotted-lined histogram representing control isotype for anti-IL-7Rα antibody, the thin-lined histograms representing BM and the bold-lined histograms SC12 cells. (A) Forward scatter. (B) Differential expression of cell surface antigens. (C) Selective coexpression of Thy1.1 antigen by SC12 and BM Lin− CD44+ and CD44− populations. Fig. 1 shows one of three independent experiments, all yielding similar results.
Expression of CD44 and Thy1.1 antigens allowed to identify two major subsets of SC12 Lin− cells. About half were CD44− Thy1.1high (Fig. 1 C), a phenotype virtually absent among BM Lin− cells (Fig. 1 C). In contrast, the SC12 CD44+ population did not express Thy1.1, while virtually all Thy1.1+ cells in the BM were CD44+ (Fig. 1 C).
Thus, SC12 Lin− cells were very different from BM Lin− cells. Their phenotype suggested a marked enrichment in T cell precursors. SC12 Lin− cells could be subdivided into a discrete CD44− Thy1.1high population and a CD44+ Thy1.1− population.
Gene Expression in SC12 Lin− CD44+ and CD44− Subsets.
To assess the lineage commitment of SC12 Lin− CD44+ and CD44− subpopulations relative to BM Lin− cells, we determined the frequency of expression of the following genes: GATA-2, encoding a transcription factor involved in the expansion of early MPPs before lymphoid commitment (28); Pax5, encoding a factor required for B cell differentiation (29); CD3ɛ, which is expressed by preT cells, before TCR gene rearrangement (30); and preTα, encoding an essential component of the preTCR (24, 31, 32).
The three populations were purified by two consecutive sorting steps. The frequency of gene expression was evaluated by the limiting dilution method. The frequency estimates were calculated according to the Poisson distribution (33). These methods are able to amplify as few as 1 mRNA molecule/cell (22). Expression of these genes in BM Lin− and SC12 Lin− populations are shown in Table II.
Table II.
Differential Expression of Developmental Genes in Precursor Populations
| BM Lin− cells | SC12 Lin− CD44+ cells | SC12 Lin− CD44− cells | |
|---|---|---|---|
| % GATA-2 | 51.42a | 15.60 (5.80) | 6.70 (3.20) |
| % Pax5 | 1.60 (0.82) | 0.19 (0.08) | 0.04 (0.03) |
| % CD3ε | 0.23 (0.13) | 1.67 (0.55) | 96b |
| % pre-Tα | Not detectedc | 0.62 (0.20) | 7.60 (3.40) |
Lin− cells were sorted in limiting dilution conditions at two or three different cell densities per well (24 wells per density) and tested for GATA-2, Pax5, CD3ε, and pre-Tα mRNA. The frequency estimates were calculated on wells which were scored positive by HPRT according to the Poisson distribution (reference 33) and 95% confidence limits are shown in brackets. When the frequency of gene expression was high, individual cells were sorted.
The frequency of GATA-2 mRNA expressing cells was estimated in 35 individual BM Lin− cells.
The frequency of CD3ε mRNA expressing cells was estimated in 49 individual SC12 Lin− CD44− cells.
8 wells containing 103 cells per well were analyzed to exclude pre-Tα expression.
Half the BM Lin− population was GATA-2 mRNA-positive, reflecting the abundance of uncommitted progenitors. Pax5 was expressed by 1.6% of cells and CD3ɛ expression was rare (0.2%). Pre-Tα mRNA transcripts were not detected in the 8 × 10³ cells studied. As regards the SC12 Lin− CD44+ and CD44− populations, GATA-2 mRNA expression was much lower than that observed in the BM Lin− population, only 15.6% of CD44+ cells and 6.7% of CD44- cells expressing GATA-2 mRNA. Pax5 expression was also very low (0.2% of CD44+ cells and 0.04% of CD44− cells). Moreover, the SC12 Lin− CD44+ population contained 1.6% of CD3ɛ mRNA-expressing cells and rare preTα-positive cells. In contrast, almost all cells of the SC12 Lin− CD44− subset expressed CD3ɛ mRNA, and 7.6% of cells expressed preTα mRNA.
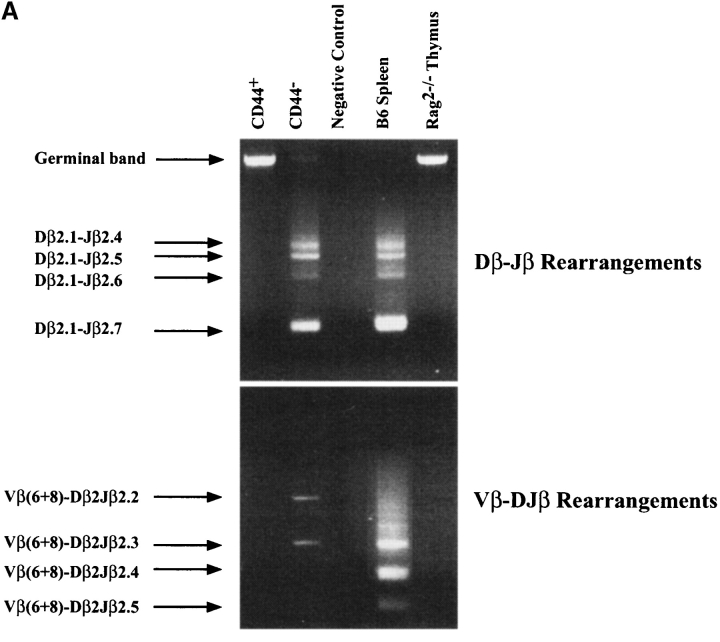
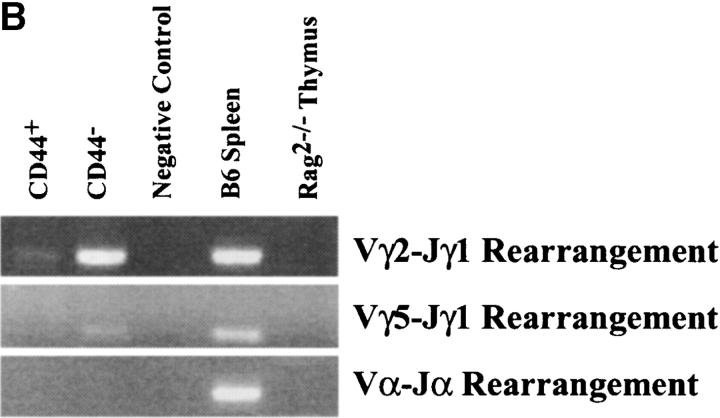
We then analyzed TCR gene rearrangements (Fig. 2) . TCR-β locus rearrangements were absent among SC12 Lin− CD44+ cells (Fig. 2 A). The Vγ2-Jγ1 rearrangement was detected but rare (Fig. 2 B). TCR-β D-J rearrangements had clearly taken place among SC12 Lin− CD44− cells, as the DJ germline band was virtually absent and multiple D-Jβ rearrangement bands were present (Fig. 2 A). TCR-β V-(D)J rearrangements were rare (Fig. 2 A), while Vγ2-Jγ1 and Vγ5-Jγ1 rearrangements were abundant (Fig. 2 B). We detected no rearrangements of the TCR-α locus in SC12 Lin− CD44+ or CD44− cells (Fig. 2 B).
Figure 2.
Analysis of TCR gene rearrangements in SC12 Lin− CD44+ and CD44− subsets. Genomic DNA was extracted from sorted SC12 Lin− CD44+ and CD44− cells, and from a C57BL/6 spleen and a Rag-2−/− thymus. Each sample (equivalent to 104 cells) was PCR-amplified, electrophoresed, and stained with ethidium bromide. (A) TCR-β locus D-J (top) and V-(D)J (bottom) rearrangements. (B) Analysis of Vγ2-Jγ1, Vγ5-Jγ1, and Vα-Jα rearrangements. Negative control (no DNA). Fig. 2 shows one of three independent experiments yielding similar results.
Collectively, these data indicated that the SC12 Lin− CD44− population almost exclusively contained preT cells, as 96% were CD3ɛ mRNA+ and TCR-β D-J and TCR-γ rearrangements were extensive. In contrast, few SC12 Lin− CD44+ cells expressed genes associated with lymphoid commitment (Pax5, preTα, CD3ɛ), and TCR gene rearrangements were very rare. However, the low GATA-2 expression in these cells suggested the loss of pluripotent HSC activity (6). Thus, in vivo and in vitro studies were designed to analyze lineage restriction in these SC12 populations.
T Cell Potential of SC12 Lin− Subpopulations after Intrathymic Transfer.
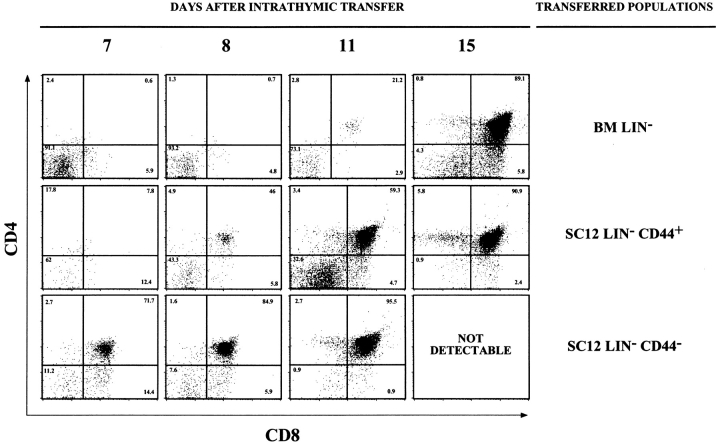
To determine the capacity of SC12 Lin− CD44+ and CD44− cells to generate T cells in vivo relative to BM Lin− cells, each population was isolated by fluorescence-activated cell sorting (FACS®), and 3 × 10⁴ cells from each subset were injected intrathymically into 600 rad irradiated congenic C57BL/6-Ly5.2 (Thy1.2) recipient mice. To study the presence and development of donor-type cells, host thymuses were analyzed for the Thy1.1 donor allotype and CD4/CD8 expression on days 7, 8, 11, and 15 after injection (Fig. 3 and Table III).
Figure 3.
Kinetics of thymus reconstitution after intrathymic transfer. C57BL/6-Ly5.2 (Thy1.2) mice were sublethally irradiated, injected intrathymically with 3 × 10⁴ Lin− cells from the BM, SC12 CD44+ and CD44− subpopulations, and studied 7, 8, 11, and 15 d after intrathymic transfer. Fig. 3 shows the CD4/CD8 expression of donor-type (Thy1.1+) thymocytes in one of two independent experiments yielding similar results.
Table III.
Accelerated Thymic Repopulation after Intrathymic Transfer of SC12 Lin− CD44+ and CD44−
| Transferred populationsa | Injected cells(× 10−4) | Recovered donor-type thymocytes (× 10−4) | Ratio of recovered/injected |
|---|---|---|---|
| 11 d after transfer | |||
| BM Lin− | 4.3 | 2 ± 0.5b (n = 3) (1.6–3)c | 0.46 |
| SC12 Lin−CD44+ | 3.2 | 3 0 ± 23.1b (n = 3) (2.4–79)c | 9.4 |
| SC12 Lin−CD44− | 2.9 | 14 ± 5.3b (n = 6) (1.1–29)c | 4.8 |
| 15 d after transfer | |||
| BM Lin− | 2.5 | 396 ± 161.6b (n = 3) (75–595)c | 158 |
| SC12 Lin−CD44+ | 2.6 | 210 ± 14.7b (n = 7) (49–1,100)c | 80 |
| SC12 Lin−CD44− | 2.6 | <0.001 (n = 6) | <0.001 |
BM and SC12 Ly5.2+ Lin− populations were sorted and transferred intrathymically to congenic donors. At the indicated times, the thymus was removed and scored by FACS® analysis for the donor-type Thy1 allotype.
Mean of recovered donor-type thymocytes ± SEM.
Range of repopulation (min.–max.). n = number of mice.
All transferred Lin− populations were capable of T cell generation but showed different kinetics of thymus reconstitution (Fig. 3). As previously reported, 1 wk after injection, BM Lin− cells (top graphs) generated only CD4−CD8− (DN) cells in the host thymus. On day 15, CD4+ CD8+ (DP) cells were present at a normal frequency but thymus reconstitution was not complete: the percentage of DN cells was increased, while the percentage of CD4+ CD8− (SP) cells was drastically reduced (only 1%), as compared with the normal thymus (8%). Thymus reconstitution was more rapid after SC12 Lin−CD44+ injection (middle graphs). On day 8 after transfer, DP cells represented 50% of donor cells, and thymus regeneration was complete on day 15 (DN cells were rare and SP cells were present at a normal frequency). Thymus reconstitution after SC12 Lin− CD44− cell injection was even more rapid (lower graphs). On day 7 after transfer the majority of donor cells were DP, thymus reconstitution was complete by day 11, and no donor-type cells were recovered in the thymus on day 15.
The expansion of donor cells in the host thymus was also evaluated (Table III). At day 11, the SC12 Lin− subsets generated a larger progeny than BM Lin− cells. However, the SC12 Lin− CD44− population had a lower expansion capacity. At day 15, only SC12 Lin− CD44+ and BM Lin− cells still expand (Table III).
These results further supported the notion that SC12 Lin− CD44− cells contained a precursor population capable of very rapid thymus reconstitution but with limited self-renewal capacity. Surprisingly, the SC12 Lin− CD44+ population (which showed no obvious molecular evidence of T cell commitment, Table II) also repopulated the thymus more rapidly than did BM Lin− cells.
Hematopoietic Potential of SC12 Lin− Populations.
To fully test the capacity of SC12 Lin− CD44+ and CD44− cells to generate hematopoietic lineages, each population (4 × 10⁴ cells) was grafted intravenously into 600 rad irradiated Rag2−/−-Ly5.1 recipient mice. The T, B, NK, and myeloid-generating potential of these precursors was evaluated 14 and 28 d after transfer.
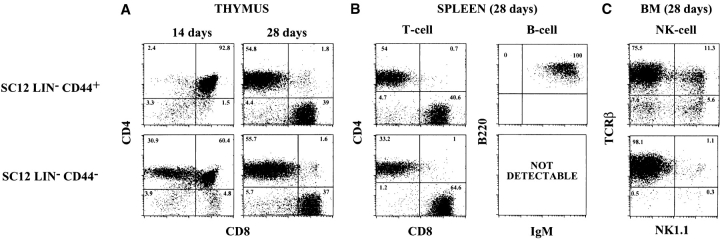
Both SC12 populations colonized and reconstituted the thymus (Fig. 4 A). In mice having received SC12 Lin− CD44+ cells, the DP compartment was fully reconstituted 14 d after injection, but SP cells were not detected. In contrast, in mice having received SC12 Lin− CD44− cells, both the DP and SP compartment were reconstituted 14 d after transfer. Both SC12 Lin− populations induced a rapid and transient thymus colonization, as DP thymocytes were no longer detected at 28 d after injection (Fig. 4 A).
Figure 4.
In vivo development of SC12 Lin− CD44+ and CD44− populations after intravenous transfer. SC12 Lin− CD44+ and CD44− cells (4 × 10⁴) were injected intravenously into 600 rad irradiated Rag2−/−-Ly5.1 recipient mice, and studied 14 and 28 d after transfer. Results are from one of three independent experiments performed with similar results. Analysis of CD4/CD8 expression of donor-type (Ly5.2+) cells in: (A) the thymus. Both precursor subsets gave only transient thymic repopulation; (B, left) the spleen, 28 d after transfer. (B, right) Analysis of B cell reconstitution in the spleen of recipient mice 28 d after transfer of SC12 Lin− CD44+ and CD44− cells. Donor Ly5.2+ CD19+ cells were gated and tested for B220 and IgM expression. No B cells were detected in the periphery of CD44− chimeric mice. (C) Analysis of NK cell reconstitution in the BM of recipient mice 28 d after transfer of SC12 Lin− CD44+ and CD44− cells. Donor cells were gated and tested for TCR-β and NK1.1 expression. Rare NK cells are present in the BM of CD44− chimeric mice.
Analysis of the peripheral compartment (Fig. 4 B) 1 mo after transfer of SC12 Lin− cells revealed that mature T cells were recovered from the spleen (Fig. 4 B), the lymph nodes (data not shown) and the BM (Fig. 4 C). The number of these T cells was about half to two thirds of that found in normal mice.
Most mature cells generated in mice having received SC12 Lin− CD44+ cells were T lymphocytes (Fig. 4 B, left). ∼5% of donor cells, however, were TCR-αβ− CD4− CD8− (Fig. 4 B, left): this population contained CD19+ cells that, once gated expressed B220 and IgM antigens (Fig. 4 B, right). This B cell generation was transient, as we could not detected B cells 2 mo after transfer (data not shown). SC12 Lin− CD44+ cells also generated NKT lymphocytes and NK cells in the spleen (data not shown) and BM (Fig. 4 C, Table IV). In contrast, in mice injected with SC12 Lin− CD44− cells no B cell progeny was detected (Fig. 4 B and Table IV). We also failed to detect NKT cells or NK cells in the spleen (data not shown). A very small number of NK1.1+ cells was visualized in the BM (Fig. 4 C, Table IV).
Table IV.
Repopulation of the Peripheral Lymphoid Compartment after I.V. Transfer of SC12Lin−CD44− and CD44+ Populations
| SC12Lin− cells transferred
|
||||||
|---|---|---|---|---|---|---|
| 4 × 10⁴ CD44+
|
4 × 10⁴ CD44−
|
|||||
| Donor type cells (× 10−4) | T | Ba | NKb | T | B | NKb |
| Mouse 1 | 1380 | 12 | 32 | 493 | - | 0.6 |
| Mouse 2 | 396 | 7 | 9.5 | 581 | - | 2.6 |
Results show the total numbers of T, B, and NK cells recovered from lymph nodes, spleen, and BM in mice injected with SC12 Lin− cells, 28 d after intravenous transfer.
No B cells were detected in the lymph nodes and BM of these mice.
No NK cells were detected in the lymph nodes of these mice.
−, B cells were not detected.
To study myeloid potential of SC12 populations, they were transferred to sublethally (600 rad) irradiated Rag2−/− mice. This model was described as optimal for determining the myeloid potential of Lin− populations, because endogenous irradiated BM was poorly competitive (5). When these hosts were injected with 4 × 10⁴ BM Lin− cells, we generated 7 × 10⁶ myeloid cells in the host, 1 mo later (data not shown). In contrast, the same number of SC12 Lin− CD44+ or CD44− progenitors, did not engender any myeloid cells after transfer (data not shown). This myeloid differentiation might not have occurred because of low precursor frequencies or we may have failed to detect a transient production by committed precursors with reduced self-renewal capacity. To circumvent these limitations, we also evaluated myeloid differentiation in vitro, in the presence of a cocktail of growth factors supporting optimal myeloid colony formation. Both the SC12 Lin− CD44+ and CD44− subsets generated rare myeloid colonies in methylcellulose: 1/33 myeloid precursors in the BM Lin− population, versus 1/166 in the SC12 Lin− CD44+ population and 1/1,450 in the SC12 Lin−CD44− population (in one of two independent experiments giving similar results).
Thus, the SC12 Lin− CD44+ and CD44− populations have different differentiation potentialities. The most immature population, CD44+, mainly generates T cells and NK cells. Some B cells are transiently produced. In contrast, CD44− cells produce T cells more rapidly, yield no B cells and very rare NK cells or NKT cells, that can only be visualized in the BM. Neither population generates myeloid cells in vivo. Some myeloid precursors were detected in vitro, but they were quite rare (in SC12 Lin−CD44− cells in particular) and may have limited self-renewal capacity.
T Cell Potentiality in SC12 Populations Is Independent of the Thymus.
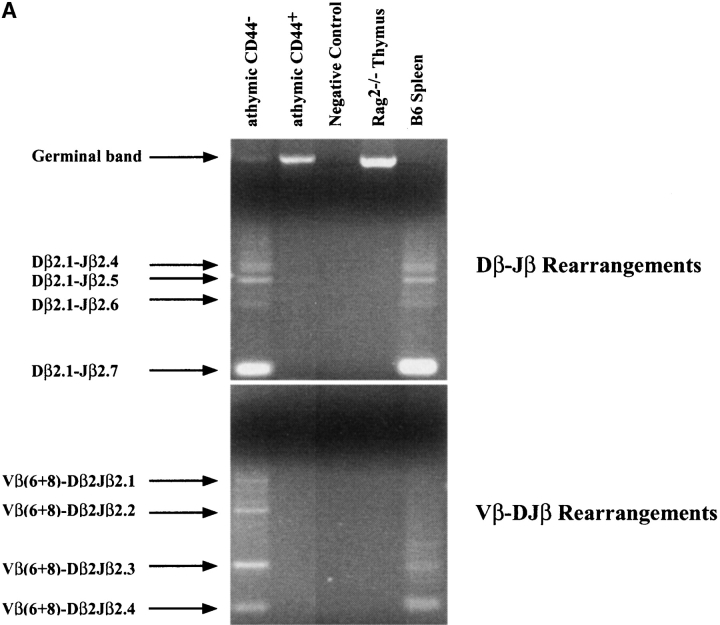
To determine whether the thymus is necessary for the generation of SC12 Lin− populations, spleen colonies were generated by injection of BM into Tx C57BL/6 CD3−/−-Ly5.1 or into nude hosts. In both recipients, SC12 colonies had the same size, and Lin− CD44+ and CD44− subsets were present at the same frequency as found in euthymic hosts (data not shown). Analysis of TCR-β locus rearrangements (D-J and V-DJ) were performed in SC12 Lin− CD44+ and CD44− subsets produced in athymic mice. Fig. 5 A indicates that TCR-β locus rearrangements were absent among SC12 Lin− CD44+ while TCR-β D-J and V-DJ rearrangements had clearly taken place among SC12 Lin− CD44− cells. These molecular characteristics are similar to those of SC12 Lin− cells generated in euthymic mice (Fig. 2 A).
Figure 5.
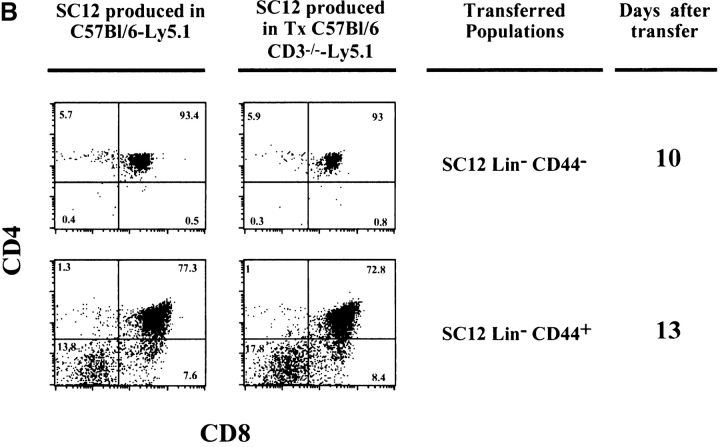
SC12 Lin− CD44− and CD44+ subpopulations generated in athymic mice. (A) SC12 were generated by injection of BM into irradiated nude hosts. TCR-β locus D-J (top) and V-(D)J (bottom) rearrangements were studied as described in Fig. 2. (B) 3 × 10⁴ Lin− cells from the SC12 CD44− and CD44+ subpopulations generated in euthymic mice (C57BL/6-Ly5.1, left) or in athymic mice (Tx C57BL/6 CD3−/−-Ly5.1, right) were injected in sublethally irradiated C57BL/6-Ly5.2 (Thy1.2) hosts. Mice receiving an injection of SC12 Lin− populations recovered from athymic and euthymic recipients were studied simultaneously. Graphs show the CD4/CD8 expression of donor-type thymocytes (Thy1.1+) 10 d (SC12 Lin− CD44−) and 13 d (SC12 Lin− CD44+) after transfer.
To evaluate the capacity of thymus reconstitution, SC12 Lin− subpopulations, generated in euthymic and athymic mice were sorted, and injected side by side intrathymically. As shown in Fig. 5 B, we found no differences in the T cell differentiation potential of SC12 Lin− CD44+ and CD44− subsets generated in Tx hosts, as compared with those generated in euthymic mice. Altogether, these data demonstrate that the thymus is not necessary for the induction of T cell commitment in SC12 progenitors.
Discussion
These results show that Lin− populations from day-12 spleen colonies and BM are very different. First, their overall phenotype is different. The frequency of c-kit, Sca-2, and CD5 expressing cells was higher in SC12 than in BM Lin− cells, but most cells expressed less of these molecules, when compared with the high expressing BM cells. The Lin− CD44− Thy1.1+ population could not be detected in the BM. The SC12 Lin− CD44+ population differed by other cell surface markers from BM CD44+ population. Second, the frequency of SC12 Lin- cells expressing GATA-2 mRNA, a marker of multipotent precursors, is lower than the frequency of GATA-2 mRNA-expressing cells in BM Lin− population. In keeping with this observation, SC12 differentiation capacity was very restricted. SC12 generated only rare myeloid cells, that could only be detected by in vitro culture. Likewise, B and NK cell productions were either very limited or absent. In contrast, SC12 cells were a major source of T cell precursors. They colonized the thymus much more rapidly than BM Lin− cells and that the previously described CLP (5). Consequently, the generation of mature T cells in these mice was precocious. A substantial reconstitution of the peripheral T cell pool was observed 1 m after transfer. At this latter time point only rare mature T cells are detected in mice injected with HSC (5).
We fractionated SC12 Lin− cells on the basis of CD44 antigen expression and found a discrete CD44− population that shared certain properties with CD44−CD4− CD8−CD3− thymocytes (TN). In particular, SC12 Lin− CD44− cells also expressed Thy1, and virtually all expressed CD3ɛ mRNA; TCR gene rearrangements (TCR-β and TCR-γ locus rearrangements) matched the pattern described in CD44− TN thymocytes (34, 35). Overall, these properties indicate that the SC12 Lin− CD44− population is relatively advanced in T cell lineage commitment. Accordingly, their differentiation potential was very restricted, as they were only able to generate T cells and a few NK cells, that could only be detected in the BM.
The properties of SC12 Lin− CD44− cells did not, however, fully overlap with those of TN cells. First, only 50% of SC12 Lin−CD44− cells expressed CD25 (data not shown) while 65–85% of CD44− TN were CD25+ (36, 37). Second, while 75% of CD44− CD25+ TN thymocytes expressed preTα mRNA and not GATA-2 mRNA (25), only 7% of SC12 Lin−CD44− cells expressed preTα and 6% expressed GATA-2 mRNA. This coexpression of CD3ɛ and GATA-2 mRNA by the same population is surprising, and may correspond to priming stages at which oligolineage commitment remains flexible. It also supports models of lineage commitment in which functionally restricted populations may conserve the molecular machinery of previous differentiation stages. Indeed, recent data indicate that lymphoid commitment might proceed by downregulation of cytokine receptors that drive myeloid development (38).
For the SC12 Lin− CD44+ subset, molecular analysis showed that TCR-β locus rearrangements were absent and that only 1% of cells expressed CD3ɛ mRNA. Therefore, it was surprising that this population, with little molecular evidence of T cell differentiation, showed such restricted differentiation potential and ample evidence of T cell commitment. These results suggest that commitment may precede rearrangements of T cell–specific genes, as shown for B cells (39). Indeed, SC12 Lin− CD44+ generated rare myeloid cells in vitro, but we observed no myeloid potential after intravenous transfer. This suggests that the SC12 Lin− CD44+ fraction contained few myeloid progenitors and/or that these progenitors failed to colonize the appropriate environment, or that they lack self-renewal capacity. The SC12 Lin− CD44+ subset generated only rare B cells. This production was also transient, as B cells were detected 1 mo after intravenous transfer but not subsequently. In contrast, the SC12 Lin− CD44+ subset generated abundant thymocytes, and substantial reconstitution of the peripheral T cell pool was observed 1 mo after injection, a time when very few T cells are detected after HSC injection (5). This population also generates NK cells. The very limited B cell generation, associated with major T cell production, suggests that SC12 Lin− CD44+ cells were more committed to T cell differentiation than are CLP, that generates identical numbers of T and B cells (5). This notion is reinforced by a comparison of the kinetics of thymus reconstitution by the two precursor populations. CLP take 3 wk to reconstitute all thymocyte populations and thymic DP cells take 6 wk to disappear (5). In contrast, after intravenous injection of SC12 Lin− CD44+ cells, all DP cells had disappeared by 4 wk after transfer.
We are currently investigating whether the rare myeloid/B cell precursors originate from a minor cell subset. The conservation of multifunctional properties and transient repopulation capacities could also indicate that commitment to a single lineage is in progress. Indeed, the rare myeloid progenitors present in the SC12 Lin− CD44+ subset may not be representative of the major myeloid differentiation pathway (6). Similarly, the restricted B cell generation may be due to the presence of a minor subset of bipotent T-B progenitors.
Altogether, our results demonstrate a new source of T cell progenitors with major advantages over BM Lin− and CLP BM-derived cells. First, they are very easy to recover, and can be obtained in much larger numbers. Unfractionated SC12 Lin− population is very enriched in T cell–committed precursors, and can be recovered by easy depletion of Lin+ cells (5). Second, SC12 populations generate T cells much more rapidly than do BM Lin− and CLP. Both these characteristics make these progenitors ideal for peripheral T cell reconstitution. Therefore, it is possible that such precursors may be of use in cell therapy, but this notion is speculative at this stage. The identification of intermediate stages of differentiation in between CLP and TN thymocytes, however, will facilitate the identification of the mechanisms leading to T cell commitment.
Concerning the origin of these precursors, the generation of SC12 cells in athymic mice indicate that these progenitors do not transit through the thymus before colonizing the spleen. The relationship between the SC12 progenitors and BM precursors remains to be established. The Lin− CD44− Thy1.1+ population cannot be detected in the BM. Only ∼0.08% of BM Lin− cells have this phenotype, but these BM cells have a different pattern of gene expression (CD3ɛ mRNA expression is rare and preTα mRNA is not expressed; data not shown) in comparison with SC12 Lin− CD44−. The distribution of different cell surface markers in SC12 CD44+ cells is also different from that found in BM CD44+ cells. SC12 CD44+ cells resemble CLP (5), by their absence of Thy1.1 and low expression of c-kit, but differ by their expression of IL-7Rα and Sca-1. SC12 populations may differentiate in situ from more immature BM precursors. It cannot be excluded, however, that SC12 may only represent the expansion of minor populations already present in the BM but too rare to be detected by available methods. Our results show, however, that BM precursors undergo modifications in the spleen. It is therefore possible that the extramedullary environment is ideal for T cell precursor proliferation and/or differentiation.
Acknowledgments
We thank our colleagues, B. Lucas, M. Papiernik, C. Penit, and H. Veiga-Fernandes, for helpful discussions during the course of this work, S. Leaument for care of the mice, A.-M. Joret for technical assistance, and S. Hamon for secretarial assistance.
C. Lancrin was supported by a grant from the Association pour la Recherche sur le Cancer (ARC) and the Ligue Nationale Contre le Cancer. F. Lambolez was supported by a grant from the Association Claude Bernard (Ligue Nationale pour la Recherche contre le Cancer). Marie-Laure Arcangeli was supported by a grant from the Ministère de l'Education Nationale, de la Recherche et de la Technologie. This work was supported by INSERM, la Fondation de France, the Agence Nationale de Recherche sur le SIDA (ANRS) and the ARC.
Footnotes
Abbreviations used in this paper: BM, bone marrow; CLP, common lymphoid progenitor; HSC, hematopoietic stem cell; MPP, multipotent progenitor; Rag, recombination activating gene; SC12, day 12 spleen colonies; Tx, thymectomized.
References
- 1.Spangrude, G.J., L. Smith, N. Uchida, K. Ikuta, S. Heimfeld, J. Friedman, and I.L. Weissman. 1991. Mouse hematopoietic stem cells. Blood. 78:1395–1402. [PubMed] [Google Scholar]
- 2.Morrison, S.J., and I.L. Weissman. 1994. The long-term repopulating subset of hematopoietic stem cells is deterministic and isolatable by phenotype. Immunity. 1:661–673. [DOI] [PubMed] [Google Scholar]
- 3.Morrison, S.J., A.M. Wandycz, H.D. Hemmati, D.E. Wright, and I.L. Weissman. 1997. Identification of a lineage of multipotent hematopoietic progenitors. Development. 124:1929–1939. [DOI] [PubMed] [Google Scholar]
- 4.Phillips, R.A., D.D. Wu, and G.M. Fulop. 1988. Lymphoid-restricted stem cells. Curr. Top. Microbiol. Immunol. 141:11–15. [DOI] [PubMed] [Google Scholar]
- 5.Kondo, M., I.L. Weissman, and K. Akashi. 1997. Identification of clonogenic common lymphoid progenitors in mouse bone marrow. Cell. 91:661–672. [DOI] [PubMed] [Google Scholar]
- 6.Akashi, K., D. Traver, T. Miyamoto, and I.L. Weissman. 2000. A clonogenic common myeloid progenitor that gives rise to all myeloid lineages. Nature. 404:193–197. [DOI] [PubMed] [Google Scholar]
- 7.Montecino-Rodriguez, E., H. Leathers, and K. Dorshkind. 2001. Bipotential B-macrophage progenitors are present in adult bone marrow. Nat. Immunol. 2:83–88. [DOI] [PubMed] [Google Scholar]
- 8.Scollay, R., J. Smith, and V. Stauffer. 1986. Dynamics of early T cells: prothymocyte migration and proliferation in the adult mouse thymus. Immunol. Rev. 91:129–157. [DOI] [PubMed] [Google Scholar]
- 9.Lepault, F., and I.L. Weissman. 1981. An in vivo assay for thymus-homing bone marrow cells. Nature. 293:151–154. [DOI] [PubMed] [Google Scholar]
- 10.Ezine, S., I.L. Weissman, and R.V. Rouse. 1984. Bone marrow cells give rise to distinct cell clones within the thymus. Nature. 309:629–631. [DOI] [PubMed] [Google Scholar]
- 11.Till, J.E., and E.A. McCulloch. 1961. A direct measure of radiation sensitivity of normal mouse bone marrow cells. Radiat. Res. 14:213–232. [PubMed] [Google Scholar]
- 12.Becker, A.J., E.A. McCulloch, and J.E. Till. 1963. Cytological demonstration of the clonal nature of spleen colonies derived from transplanted mouse marrow cells. Nature. 197:452–454. [DOI] [PubMed] [Google Scholar]
- 13.Wu, A.M., J.E. Till, L. Siminovitch, and E.A. McCulloch. 1967. A cytological study of the capacity for differentiation of normal hemopoietic colony-forming cells. J. Cell Physiol. 69:177–184. [DOI] [PubMed] [Google Scholar]
- 14.Metcalf, D., and M.A.S. Moore. 1971. Haematopoietic cells. Cells. A. Neuberger and E.L. Tatum, editors. North-Holland Publishing Company, Amsterdam and London. 1–171.
- 15.Wu, A.M., J.E. Till, L. Siminovitch, and E.A. McCulloch. 1968. Cytological evidence for a relationship between normal hematopoietic colony-forming cells and cells of the lymphoid system. J. Exp. Med. 127:455–464. [DOI] [PMC free article] [PubMed] [Google Scholar]
- 16.Lepault, F., S. Ezine, and M.C. Gagnerault. 1993. T- and B-lymphocyte differentiation potentials of spleen colony-forming cells. Blood. 81:950–955. [PubMed] [Google Scholar]
- 17.Zatz, M.M., and E.M. Lance. 1970. The distribution of chromium 51-labelled lymphoid cells in the mouse. A survey of anatomical compartments. Cell. Immunol. 1:3–17. [DOI] [PubMed] [Google Scholar]
- 18.Boggs, D.R. 1984. The total marrow mass of the mouse: a simplified method of measurement. Am. J. Hematol. 16:277–286. [DOI] [PubMed] [Google Scholar]
- 19.Rodewald, H.R., K. Awad, P. Moingeon, L. D'Adamio, D. Rabinowitz, Y. Shinkai, F.W. Alt, and E.L. Reinherz. 1993. Fcγ RII/III and CD2 expression mark distinct subpopulations of immature CD4−CD8− murine thymocytes: in vivo developmental kinetics and T cell receptor β chain rearrangement status. J. Exp. Med. 177:1079–1092. [DOI] [PMC free article] [PubMed] [Google Scholar]
- 20.Rodewald, H.R., K. Kretzschmar, S. Takeda, C. Hohl, and M. Dessing. 1994. Identification of pro-thymocytes in murine fetal blood: T lineage commitment can precede thymus colonization. EMBO J. 13:4229–4240. [DOI] [PMC free article] [PubMed] [Google Scholar]
- 21.Levin, S.D., S.J. Anderson, K.A. Forbush, and R.M. Perlmutter. 1993. A dominant-negative transgene defines a role for p56lck in thymopoiesis. EMBO J. 4:1671–1680. [DOI] [PMC free article] [PubMed] [Google Scholar]
- 22.Veiga-Fernandes, H., U. Walter, C. Bourgeois, A. McLean, and B. Rocha. 2000. Response of naive and memory CD8+ T cells to antigen stimulation in vivo. Nat. Immunol. 1:47–53. [DOI] [PubMed] [Google Scholar]
- 23.Pannetier, C., S. Delassus, S. Darche, C. Saucier, and P. Kourilsky. 1993. Quantitative titration of nucleic acids by enzymatic amplification reactions run to saturation. Nucl. Acids Res. 21:577–583. [DOI] [PMC free article] [PubMed] [Google Scholar]
- 24.Aifantis, I., O. Azogui, J. Feinberg, C. Saint-Ruf, J. Buer, and H. von Boehmer. 1998. On the role of the pre-T cell receptor in αβ versus γδ T lineage commitment. Immunity. 9:649–655. [DOI] [PubMed] [Google Scholar]
- 25.Lambolez, F., O. Azogui, A.-M. Joret, C. Garcia, H. von Boehmer, J. Di Santo, S. Ezine, and B. Rocha. 2002. Characterization of T cell differentiation in the murine gut. J. Exp. Med. 195:437–449. [DOI] [PMC free article] [PubMed] [Google Scholar]
- 26.Spangrude, G.J., S. Heimfeld, and I.L. Weissman. 1988. Purification and characterization of mouse hematopoietic stem cells. Science. 241:58–62. [DOI] [PubMed] [Google Scholar]
- 27.Rolink, A., E. Ten Boekel, F. Melchers, D.T. Fearon, I. Krop, and J. Andersson. 1996. A subpopulation of B220+ cells in murine bone marrow does not express CD19 and contains natural killer cell progenitors. J. Exp. Med. 183:187–194. [DOI] [PMC free article] [PubMed] [Google Scholar]
- 28.Tsai, F.Y., and S.H. Orkin. 1997. Transcription factor GATA-2 is required for proliferation/survival of early hematopoietic cells and mast cell formation, but not for erythroid and myeloid terminal differentiation. Blood. 89:3636–3643. [PubMed] [Google Scholar]
- 29.Nutt, S.L., B. Heavey, A.G. Rolink, and M. Busslinger. 1999. Commitment to the B-lymphoid lineage depends on the transcription factor Pax5. Nature. 401:556–562. [DOI] [PubMed] [Google Scholar]
- 30.Malissen, M., A. Gillet, L. Ardouin, G. Bouvier, J. Trucy, P. Ferrier, E. Vivier, and B. Malissen. 1995. Altered T cell development in mice with a targeted mutation of the CD3-ε gene. EMBO J. 14:4641–4653. [DOI] [PMC free article] [PubMed] [Google Scholar]
- 31.Saint-Ruf, C., K. Ungewiss, M. Groettrup, L. Bruno, H.J. Fehling, and H. von Boehmer. 1994. Analysis and expression of a cloned pre-T cell receptor gene. Science. 266:1208–1212. [DOI] [PubMed] [Google Scholar]
- 32.Barber, D.F., L. Passoni, L. Wen, L. Geng, and A.C. Hayday. 1998. The expression in vivo of a second isoform of pTα: implications for the mechanism of pTα action. J. Immunol. 161:11–16. [PubMed] [Google Scholar]
- 33.Taswell, C. 1984. Limiting dilution assays for the determination of immunocompetent cell frequencies. III. Validity tests for the single-hit Poisson model. J. Immunol. Methods. 72:29–40. [DOI] [PubMed] [Google Scholar]
- 34.Shortman, K., D. Vremec, L.M. Corcoran, K. Georgopoulos, K. Lucas, and L. Wu. 1998. The linkage between T-cell and dendritic cell development in the mouse thymus. Immunol. Rev. 165:39–46. [DOI] [PubMed] [Google Scholar]
- 35.Spits, H., B. Blom, A.-C. Jaleco, K. Weijer, M.C.M. Verschuren, J.J.M. van Dongen, M.H.M. Heemskerk, and P.C.M. Res. 1998. Early stages in the development of human T, natural killer and thymic dendritic cells. Immunol. Rev. 165:75–86. [DOI] [PubMed] [Google Scholar]
- 36.Godfrey, D.I., J. Kennedy, T. Suda, and A. Zlotnik. 1993. A developmental pathway involving four phenotypically and functionally distinct subsets of CD3−CD4−CD8− triple-negative adult mouse thymocytes defined by CD44 and CD25 expression. J. Immunol. 150:4244–4252. [PubMed] [Google Scholar]
- 37.Penit, C., B. Lucas, and F. Vasseur. 1995. Cell expansion and growth arrest phases during the transition from precursor (CD4−8−) to immature (CD4+8+) thymocytes in normal and genetically modified mice. J. Immunol. 154:5103–5113. [PubMed] [Google Scholar]
- 38.Kondo, M., D.C. Scherer, T. Miyamoto, A.G. King, K. Akashi, K. Sugamura, and I.L. Weissman. 2000. Cell-fate conversion of lymphoid-committed progenitors by instructive actions of cytokines. Nature. 407:383–386. [DOI] [PubMed] [Google Scholar]
- 39.Allman, D., J. Li, and R. Hardy. 1999. Commitment to the B lymphoid lineage occurs before DH-JH recombination. J. Exp. Med. 189:735–740. [DOI] [PMC free article] [PubMed] [Google Scholar]


