

Abstract
Primary virus infection often elicits a large CD8+ T cell response which subsequently contracts to a smaller memory T cell pool; the relationship between these two virus-specific populations is not well understood. Here we follow the human CD8+ T cell response to Epstein-Barr virus (EBV) from its primary phase in infectious mononucleosis (IM) through to the persistent carrier state. Using HLA-A2.1 or B8 tetramers specific for four lytic cycle and three latent cycle epitopes, we find marked differences in the epitope-specific composition of the T cell populations between the two phases of infection. The primary response is dominated by lytic epitope specificities which are severely culled (and in one case extinguished) with resolution of the acute infection; in contrast latent epitope specificities are less abundant, if present at all, in acute IM but often then increase their percentage representation in the CD8 pool. Even comparing epitopes of the same type, the relative size of responses seen in primary infection does not necessarily correlate with that seen in the longer term. We also follow the evolution of phenotypic change in these populations and show that, from a uniform CD45RA−RO+CCR7− phenotype in IM, lytic epitope responses show greater reversion to a CD45RA+RO− phenotype whereas latent epitope responses remain CD45RA−RO+ with a greater tendency to acquire CCR7. Interestingly these phenotypic distinctions reflect the source of the epitope as lytic or latent, and not the extent to which the response has been amplified in vivo.
Keywords: Epstein-Barr virus, CD8+ T lymphocytes, infectious mononucleosis, kinetics, phenotype
Introduction
Primary virus infections both in mouse models and in man are often accompanied by marked expansions of reactive CD8+ T cells. In several viral systems it has been shown that these expansions are indeed virus-specific and dominated by cytotoxic reactivities against a relatively small number of viral epitope peptides presented in the context of host MHC class I molecules (1–8). As the acute infection is brought under control and antigen load diminishes, the great majority of these primary effectors die by apoptosis and T cell numbers return to the normal range (9–11). However, some virus-specific CD8+ T cells survive and enter the memory pool where they subsequently persist and from which they are able to reactivate when challenged either by a second exogenous infection with a related virus strain or, in the case of a naturally persistent agent, by a recrudescence of the existing infection.
The relationship between primary and memory CD8+ T cell populations and the factors which determine selection into memory remain poorly understood. Generally, studies in murine models with agents such as lymphocyte choriomeningitis virus indicate that primary and memory virus-specific populations are qualitatively similar in terms of the relative prevalence of the different epitope-specific reactivities making up the whole response (1, 8, 12). This gave rise to the notion that all components of the primary response were equally culled, hence that clonal “burst size” at the height of the acute infection determined the extent of representation in memory (8, 13). Although changes in the memory repertoire could be induced by experimental rechallenge in such model systems, these changes were detected as refinements of dominant T cell receptor usage within an epitope-specific population rather than as shifts in the relative prevalence of different epitope reactivities (14–16).
Prospective studies on human CD8+ T cell responses during and after acute viral infection are as yet quite limited, but have been helped by the ability to identify epitope-specific T cells in PBMC preparations either by staining with HLA class I–peptide tetramers or by peptide-induced synthesis of type I cytokines (17–19). In a recent study, HIV-infected patients were screened using a large panel of HIV epitope peptides in enzyme-linked immunospot (Elispot)* assays of interferon γ release (20). Comparisons between cohorts of patients at different stages of infection suggested that the primary response is directed toward a more limited range of epitopes than that seen in chronic carriers. However, such apparent broadening of the response with prolonged exposure to HIV could reflect the diversification of antigenic challenge in vivo from this genetically unstable agent. More interestingly prospective studies on individual patients identified one HIV epitope-specific reactivity which was consistently undetectable in primary infection, even though the epitope was present in the infecting viral strain, but did appear later (20).
The present work addresses these same issues in the context of exposure to EBV, a genetically stable human γ-herpesvirus which can establish both virus productive (lytic) and nonproductive (latent) infections in target B lymphocytes (21). Primary EBV infection is clinically manifest as infectious mononucleosis (IM) and is characterized by a massive expansion of activated CD45RO+CD8+ T cells. We have shown, initially using ex vivo cytotoxicity assays and subsequently HLA class I–peptide tetramer staining, that a large fraction of this response is EBV-specific and reactive to defined immunodominant epitopes, principally drawn from the immediate early and some early proteins of the lytic cycle (3, 22, 23). On the basis of staining with one A2.1–epitope and one B8–epitope tetramer, it seemed that individual lytic epitope reactivities could account for between 5 and 50% of the CD8+ T cell expansion in IM blood. At the same time reactivities to certain latent cycle epitopes, usually drawn from a subset of the virus-coded nuclear antigens (EBNAs), were also detectable but, from the evidence of staining with one B8–epitope tetramer, only account for 1–3% of the CD8+ expansion (3). Interestingly we noted that both types of reactivity were also detectable, albeit at lower levels, in the blood of long-term asymptomatic EBV carriers (24, 25). However, both there and in the small number of post-IM patients studied (3), numeric differentials between the two populations were now less marked. Furthermore, in long term carriers the two types of reactivity appeared to be phenotypically distinct in that lytic epitope-specific populations were heterogeneous in terms of CD45 isoform (RO versus RA) expression whereas latent epitope-specific populations were uniformly RO+RA− and often contained a higher proportion of cells expressing CCR7 (25), a homing marker which has been proposed to identify a “central memory” (as opposed to an “effector memory”) T cell subset (26). It was not clear, however, when these phenotypic differences might arise and whether they were intrinsic to the two types of epitope or rather reflected different levels of epitope-driven expansion in vivo. This prompted the present study in which we have increased the number of informative A2.1- and B8-restricted lytic and latent cycle epitopes and followed the evolution of these responses, both in terms of cell number and cell phenotype, for a period of between 1 and 14 yr from the point of acute primary infection.
Materials and Methods
Donors.
Patients in the acute phase of IM (within 7 d of the onset of symptoms) were identified on clinical grounds and diagnosis confirmed by high leukocyte counts and by heterophile antibody positivity. Heparinized blood (30–60 ml/patient) was used to prepare PBMCs and aliquots of the cells cryopreserved; patients with the HLA-A2.1 and/or B8 allele were identified by genotype assay. Individual patients selected for the study were bled on up to six subsequent occasions between 3 mo and 14 yr later; all patients had shown a complete resolution of disease symptoms within 3–4 wk of the initial acute phase sample being taken.
For some comparative experiments, healthy laboratory donors (HLA-A2.1 and/or B8-positive) were sampled on at least two occasions; all had been EBV carriers for at least 5 yr and all had no prior history of IM.
T Cell Cloning and Epitope Identification.
CD8+ T cell clones were generated from the blood of selected HLA-A2.1–positive IM patients by limiting dilution cloning of PBMCs on feeder cells in interleukin 2-conditioned medium as described (23). Clones with specific cytotoxicity against EBV antigens were identified in standard 5 h chromium release assays by testing on HLA-A2.1–matched EBV-transformed B lymphoblastoid cell line (LCL) targets preinfected with recombinant vaccinias expressing one of a series of individual EBV (B95.8 strain) lytic or latent cycle antigens, again using previously published methods (27). Where necessary, the epitope specificity of the clones was identified first by testing on a panel of peptides (15 mers overlapping by 10) representing the primary sequence of the relevant EBV antigen (B95.8 strain), and then by testing shorter peptides within the 15-mer of interest using targets preexposed to a range of peptide concentrations.
Peptides and HLA Class I Tetramers.
The following EBV-epitope peptides were used in this study: the A2.1-restricted epitopes GLCTLVAML derived from the lytic cycle protein BMLF1 (23,28), YVLDHLIVV derived from the lytic cycle protein BRLF1 (29), TLDYKPLSV from the lytic cycle protein BMRF1 (this study) and CLGGLLTMV derived from the latent cycle protein LMP2 (30). The B8-restricted epitope peptides used in this study were RAKFKQLL derived from the lytic cycle protein BZLF1 (31) and FLRGRAYGL (32) and QAKWRLQTL (33) both derived from the latent cycle protein EBNA3A. The nomenclature for epitope peptides has been abbreviated to the first three amino acids throughout this text. The peptides were purchased from Alta Biosciences and dissolved in DMSO (Fisher Chemicals) to a concentration of 5 mg/ml and diluted to appropriate concentrations in RPMI-1640 immediately before use.
HLA class I/peptide tetramers were synthesized as described previously (17). Briefly, HLA-A2.1 recombinant heavy chains containing the Bir A biotinylation motif were refolded with either of the peptides GLC, YVL, TLD, or CLG, while HLA-B8 recombinant heavy chains were refolded in the presence of either FLR, QAK, or RAK peptide. After biotinylation with Bir A (Avidity) the refolded heavy chains were purified on a Superdex G75 HiLoad 26/60 prep grade FPLC column (Amersham Pharmacia Biotech) followed by further purification on a Mono Q anion exchange FPLC column (Amersham Pharmacia Biotech). The purified monomers were tetramerized by addition of streptavidin R-phycoerythrin (Molecular Probes) at a molar ratio of 4:1 respectively
Tetramer Staining Assays.
Staining of lymphocytes was undertaken by incubating the cells with a pretitrated concentration of tetramer (∼0.5 μg/ml) at 37°C for 15 min. The cells were then stained for surface markers by incubation on ice with saturating amounts of anti–human CD8 mAbs conjugated to Tricolor (Caltag Laboratories) and, for phenotyping experiments, FITC-conjugated anti–human mAbs specific for either CD45RA (Beckman Coulter) or CD45RO (Dako). To detect CCR7 expression in phenotype studies, tetramer-stained cells were incubated with an anti–human CCR7 mAb (a gift from Millennium Pharmaceuticals Inc., Cambridge, MA). Binding of the CCR7-specific mAb was detected by incubation with goat anti–mouse heavy-light chain-specific FITC-labeled antibody (Southern Biotechnology Associates, Inc.). Free anti–mouse binding sites were subsequently blocked by incubation with normal mouse serum and the cells then stained with the Tricolor-conjugated anti–human CD8 antibody (Caltag Laboratories). These stained cells were then analyzed on an Epics flow cytometer (Beckman Coulter). Note that color compensation between the different fluorochromes was set using single fluorochrome-stained cells from the same test population as described previously (34).
Results
Identification of A2.1-restricted Lytic Cycle Epitopes by IM CD8+ T Cell Cloning.
In an initial series of experiments, CD8+ T cell clones were established by limiting dilution of PBMCs cryopreserved from HLA-A2.1–positive IM patients, and screened for EBV-specificity in cytotoxicity assays on A2.1-positive LCL targets expressing individual EBV proteins from recombinant vaccinia vectors. Fig. 1 A presents data from one such patient, IM119, to illustrate each of the three types of CD8+ T cell reactivity typically seen in such experiments. The most abundant reactivity exemplified by clone 5 was directed against the immediate early lytic cycle protein BRLF1. Subsequent screening on peptide-loaded targets narrowed this response down to a 9-mer epitope YVLDHLIVV (designated YVL) within the BRLF1 sequence; this same epitope was independently identified in a recent study of T cell clones derived from synovial lymphocytes isolated from chronic arthritis patients (29). A second less abundant reactivity exemplified by clone 35 recognized the BMLF1 early lytic cycle protein and mapped to the previously described 9-mer epitope GLCTLVAML (designated GLC) (23, 28). A third reactivity, detected in a small number of IM119-derived clones exemplified by clone 136, mapped to another early lytic protein BMRF1 and was identified in peptide sensitization assays as recognizing a novel 9-mer epitope TLDYKPLSV (designated TLD). In the study of IM119 we never detected A2-restricted CD8+ T cell clones recognizing any of the EBV latent cycle proteins in vaccinia assays, nor when we deliberately screened clones on the peptide CLGGLLTMV (designated CLG), a 9-mer derived from the latent membrane protein LMP2; although subdominant among latent cycle epitopes, CLG nevertheless represents one of the strongest known targets of A2-restricted latent cycle memory in healthy virus carriers (35).
Figure 1.
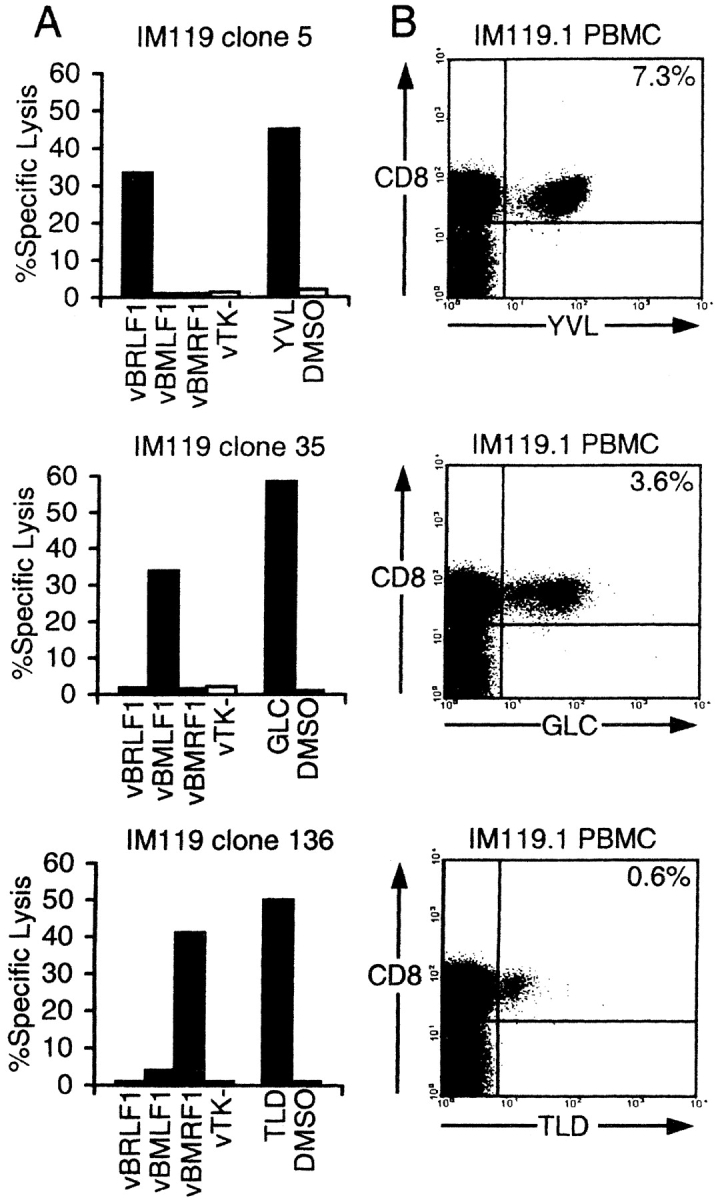
Specificity of CD8+ CTL clones isolated from an IM patient (IM119) by limiting dilution cloning, and quantitation of these responses in PBMCs by flow cytometry. (A) HLA-A2.1–restricted CD8+ clones were tested in cytotoxicity assays against autologous LCL targets that had either been infected with recombinant vaccinia (v) viruses expressing EBV lytic cycle antigens BRLF1, BMLF1, or BMRF1 (or with the control vaccinia vTK−) or been sensitized with peptides YVL, GLC, or TLD representing minimal A2.1-restricted epitopes contained within these proteins. Effector/target ratios used were 2:1, and cytotoxicity is expressed as percentage of specific lysis observed in a standard 5 h chromium release assay. (B) Acute IM PBMCs from IM119 were stained with PE-conjugated HLA-A2.1 tetramers containing either the YVL, GLC, or TLD peptide, and subsequently with Tricolor-conjugated antibodies to CD8. Percentage values refer to the percentage of CD8+ T cells that stained with the tetramer (top right quadrant).
To check that the in vitro cloning results were indeed reflecting reactivities present within the initial PBMC population, we constructed A2.1 tetramers for each of the above lytic epitopes and for the CLG latent epitope. Fig. 1 B shows the data obtained by staining another aliquot of PBMCs from the acute phase bleed of IM patient 119 (denoted IM119.1). This shows that 7.3% of the highly expanded CD8+ T cells in this patient stained with the A2.1–YVL tetramer, 3.6% with the A2.1–GLC tetramer and 0.6% with the A2.1–TLD tetramer. By contrast, there was no significant staining with the A2.1–CLG tetramer (data not shown).
Comparison of A2.1 Epitope-specific Frequencies in Acute IM Patients and Long-term Carriers.
To further characterize the CD8+ T cell response to the novel YVL and TLD epitopes as well as to GLC and CLG, this same panel of tetramers was used to stain PBMCs from another 8 A2.1-positive acute IM patients and from 12 A2.1-positive long-term EBV carriers. The results from the two sets of donors, summarized in Table I, are strikingly different. In the acute IM patients all three lytic epitope-specific reactivities were detectable with the YVL response (accounting for up to 33.6% CD8+ T cells) being the most abundant in 7/9 cases, followed either by GLC (up to 11.8% CD8+ T cells) or by TLD (up to 6.1% CD8+ T cells) as the next most abundant response; however, only one of these patients showed a detectable response to the latent CLG epitope. By contrast, in long-term EBV carriers the GLC response (up to 2.2% CD8+ T cells) was always the most abundant followed by a weaker YVL response detectable in 9/12 donors and by a very weak TLD response in only 2/12 donors; interestingly, most (9/12) long-term carriers also showed clear evidence of a CLG-specific population.
Table I.
Percentage of CD8+ T Cells Staining with A2.1 Epitope Tetramers
| Lytic epitopes |
Latent epitope |
|||
|---|---|---|---|---|
| Donor | YVL | GLC | TLD | CLG |
| IM 13.1 | 20.3 | 0.8 | 1.6 | 0 |
| IM 79.1 | 29.0 | 0.7 | 6.1 | 0.1 |
| IM 81.1 | 33.6 | 11.8 | 1.0 | 0 |
| IM 113.1 | 2.7 | 1.9 | 0.4 | 0 |
| IM 119.1 | 7.3 | 3.6 | 0.6 | 0 |
| IM 123.1 | 9.8 | 6.5 | 0.5 | 0 |
| IM 130.1 | 4.1 | 0.7 | 0.3 | 0 |
| IM 140.1 | 4.1 | 7.3 | 1.1 | 0 |
| IM 146.1 | 2.9 | 1.0 | 2.7 | 0 |
| CM | 0.1 | 2.2 | 0 | 0.05 |
| CW | 0.3 | 0.9 | 0 | 0.1 |
| DA | 0.2 | 0.4 | 0 | 0.1 |
| DW | 0.7 | 2.2 | 0.1 | 0.2 |
| JL | 0.2 | 1.5 | 0 | 0 |
| JSt | 0.1 | 0.5 | 0 | 0.2 |
| LH | 0.05 | 0.2 | 0 | 0.1 |
| MG | 0.3 | 0.8 | 0.05 | 0 |
| NB | 0 | 0.5 | 0 | 0.1 |
| NG | 0.1 | 0.5 | 0 | 0.1 |
| SL | 0 | 0.3 | 0 | 0 |
| SY | 0 | 1.3 | 0 | 0.3 |
Prospective Studies of the Response to A2.1-restricted Epitopes.
In light of these findings we performed prospective studies on all nine A2.1-positive IM patients in Table I, samples being taken on up to four further occasions over a period of 14 yr in one case, 5 yr in two cases, and 1–2 yr for the rest. This revealed differences between the kinetics of the lytic epitope responses, which consistently peaked in acute IM and then fell substantially, and the latent epitope response which was usually undetectable in IM but often appeared in later bleeds. To illustrate these trends, FACS® profile data from two patients are shown in Fig. 2 . For IM81 (Fig. 2 A) primary responses to the YVL and GLC epitopes were very large, accounting for 33.6 and 11.8% of the CD8+ T cell pool in the acute disease, but both had stabilized at <1% CD8+ T cells by 30 mo after infection. In IM146 (Fig. 2 B), primary responses to these two epitopes were 10-fold lower than in IM81 yet both were again culled down to 0.4–0.7% of the CD8+ pool. In both patients the TLD response became undetectable (even though in IM146 it had exceeded both the YVL and GLC responses during the acute phase), while over the same period both patients showed delayed development of a CLG-specific CD8+ population in the blood.
Figure 2.
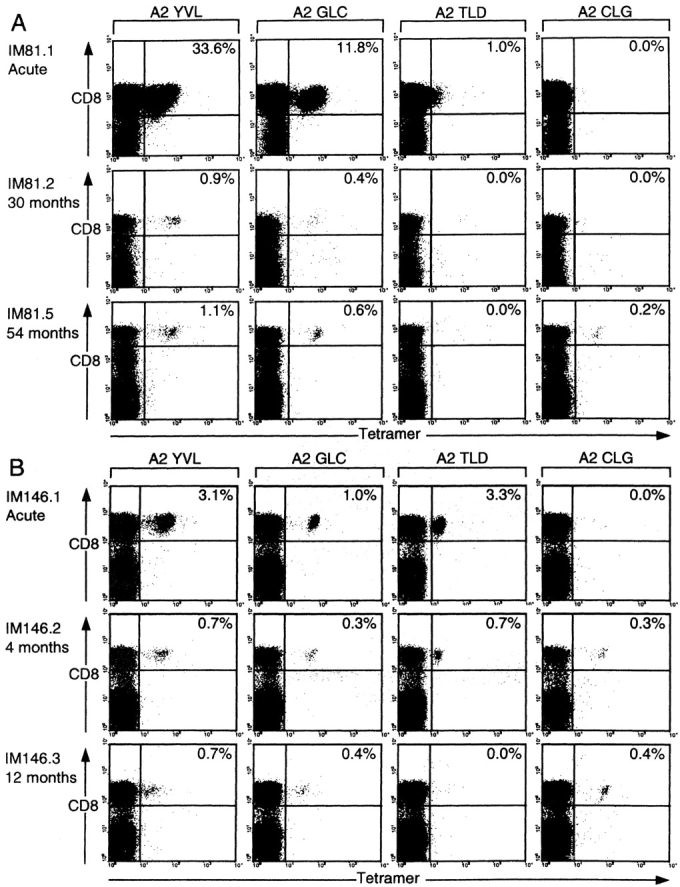
Evolution of the CD8 T cell response to the A2.1-restricted epitopes YVL, GLC, TLD, and CLG in patients sampled during and after acute IM. (A) PBMCs cryopreserved from IM81 during acute IM and 30 and 54 mo later and (B) PBMCs cryopreserved from IM146 during acute IM and 4 and 12 mo later were stained with individual A2.1 epitope tetramers and with anti-CD8. Results for each time point are presented as in Fig. 1 B.
The results of these prospective studies on A2.1-restricted epitope responses for all nine patients are summarized in Table II. These data confirm the generality of the trends outlined above. Thus, there was a marked fall in the percentage representation of lytic epitope-specific T cells in the CD8+ pool in 7/9 patients for the GLC response and in all nine patients for the YVL and TLD responses; indeed the TLD response, which was regularly observed in acute primary infection, fell below detectable levels in 7/9 cases after IM. These falls in lytic epitope responses were significant whether the data for each epitope were considered individually or combined into a single model (see Table II legend). By contrast, in four of the five patients who mounted a response to the latent CLG epitope, this was undetectable in acute IM and only appeared in later bleeds. In addition, retrospective analysis of stored samples from five other HLA-A2.1–positive patients where GLC-specific T cell representation in the CD8+ T cell pool had fallen from 4–10% in acute IM to 0.3–1.1% in a later bleed (34) again showed that the CLG response, where detectable, was always delayed (data not shown).
Table II.
Prospective Study of A2.1 Epitope Response
| Lytic epitopes |
Latent epitope |
|||
|---|---|---|---|---|
| Donor (time post-IM) |
YVL | GLC | TLD | CLG |
| 13.1 | 20.3 | 0.8 | 1.6 | 0 |
| 13.5 (14 yr) | 1.1 | 0.8 | 0 | 0 |
| 79.1 | 29.0 | 0.7 | 6.1 | 0.1 |
| 79.2 (30 mo) | 1.9 | 0.4 | 0.4 | 0.1 |
| 79.3 (60 mo) | 2.4 | 1.4 | 1.0 | 0.2 |
| 81.1 | 33.6 | 11.8 | 1.0 | 0 |
| 81.2 (30 mo) | 0.9 | 0.4 | 0 | 0.05 |
| 81.3 (36 mo) | 1.2 | 0.3 | 0 | 0.3 |
| 81.4 (44 mo) | 1.2 | 0.3 | 0 | 0.1 |
| 81.5 (54 mo) | 1.1 | 0.4 | 0 | 0.2 |
| 113.1 | 2.7 | 1.9 | 0.4 | 0 |
| 113.2 (14 mo) | 0.2 | 0.6 | 0.05 | 0.05 |
| 113.3 (17 mo) | 0.2 | 0.5 | 0 | 0.1 |
| 113.4 (25 mo) | 0.2 | 0.3 | 0 | 0.1 |
| 119.1 | 7.3 | 3.6 | 0.6 | 0 |
| 119.2 (4 mo) | 1.3 | 1.4 | 0.05 | 0 |
| 119.3 (10 mo) | 0.5 | 0.8 | 0 | 0 |
| 123.1 | 9.8 | 6.5 | 0.5 | 0 |
| 123.2 (2 mo) | 4.8 | 2.4 | 0.1 | 0 |
| 123.3 (11 mo) | 1.8 | 0.9 | 0.1 | 0 |
| 130.1 | 4.1 | 0.7 | 0.3 | 0 |
| 130.2 (5 mo) | 0.2 | 0.2 | 0 | 0 |
| 130.3 (12 mo) | 0.1 | 0.2 | 0 | 0 |
| 130.4 (20 mo) | 0.1 | 0.1 | 0 | 0 |
| 140.1 | 4.1 | 7.3 | 1.1 | 0 |
| 140.2 (3 mo) | 1.9 | 4.0 | 0.8 | 0.3 |
| 140.3 (8 mo) | 1.1 | 2.5 | 0.2 | 0.3 |
| 140.4 (10 mo) | 1.1 | 2.3 | 0.0 | 0.1 |
| 140.5 (14 mo) | 1.0 | 1.5 | 0.0 | 0.3 |
| 146.1 | 3.1 | 1.0 | 3.3 | 0 |
| 146.2 (4 mo) | 0.7 | 0.3 | 0.7 | 0.3 |
| 146.3 (12 mo) | 0.7 | 0.4 | 0 | 0.4 |
The lytic epitope responses decrease significantly over time. (YVL: P = 0.0008, GLC: P = 0.02, TLD: P = 0.002). These figures are the result of modeling each of the lytic epitopes as log(response) using SAS PROC MIXED with a random effect for intercept and with fixed and random effects for time. Combining these into a single model suggests different rates of fall between epitopes (P = 0.003 for fixed epitope time interaction effect). The latent epitope response shows no such effect.
These findings demonstrate the very significant differences that exist between the composition of CD8+ T cell responses found in the blood in acute primary infection versus the subsequent virus carrier state. Moreover, such differences do not only relate to comparisons between lytic and latent epitopes since in two cases, IM 13 and IM 79, there are also clear differences in the response to individual lytic epitopes. In both of these cases the YVL response was clearly dominant in the primary (20–29% CD8+ T cells) followed by TLD, with an unusually low response (0.7–0.8% CD8+ T cells) to GLC. These individuals showed marked culling of the YVL- and TLD-specific populations but sparing of the weak GLC response such that, despite their initial differences, the YVL and GLC reactivities finished up at roughly equivalent levels in the late post-IM bleeds. It is also interesting to compare the data from the final post-IM bleeds in all nine patients in Table II with the corresponding values from healthy long-term virus carriers in Table I. This shows that the range of A2.1 epitope reactivities established post-IM becomes similar to that seen in long-term carriers (YVL+, GLC+, TLD−, CLG+) but that post-IM patients have significantly higher YVL responses both in absolute terms and in relation to the coresident GLC response (P = 0.008 and P = 0.005, respectively, two-sample Wilcoxon test).
Prospective Studies of the Response to B8-restricted Epitopes.
To extend these prospective studies to lytic and latent epitope-specific responses restricted through a different HLA allele, we followed five HLA-B8–positive IM patients for a period of 14 mo to 5 yr. Note that two of these patients, IM130 and IM140, were both HLA-A2– and B8-positive and so are involved in both studies. Here we monitored responses to the B8 epitope RAKFKQLL (RAK) from the immediate early lytic antigen BZLF1 and to two B8 epitopes FLRGRAYGL (FLR) and QAKWRLQTL (QAK) both derived from the latent cycle antigen EBNA3A. Note that these peptides are among the strongest of all known EBV lytic and latent cycle epitopes respectively as judged by epitope-specific T cell numbers in the blood of healthy carriers (24).
In this series of patients, the lytic epitope response was again numerically dominant during the acute primary infection and was culled thereafter while the latent epitope responses, although now clearly detectable in acute IM, again often increased percentage representation in the CD8+ T cell pool in later bleeds. Fig. 3 presents some of the FACS® profile data from one such patient, IM 141 who was studied in acute IM and on a total of four subsequent occasions up to 14 mo later. The RAK response constituted 31.2% of all CD8+ T cells in the primary bleed; this value fell within 3 mo to 7.9% and stabilized at a slightly lower level thereafter. By contrast the latent FLR and QAK epitope responses were much smaller in the acute phase (2.5% and 0.7% CD8+ T cells, respectively) but both had increased their percentage representation at 3 mo. Thereafter, the QAK response followed the more typical course for a B8 latent epitope in stabilizing at a slightly lower level whereas in this particular patient the FLR response slowly increased such that by 14 mo it constituted 7.6% of all circulating CD8+ T cells and was even more abundant than the RAK response.
Figure 3.

Evolution of the CD8 T cell response to the B8-restricted epitopes RAK, FLR, and QAK in patient IM141. PBMCs cryopreserved during acute IM and 3 and 14 mo later were stained with the individual B8 epitope tetramers and with anti-CD8. Results for each time point are presented as in Fig. 1 B.
Table III summarizes all of the prospective data from the five B8-positive IM patients studied. These results again emphasize the generally different kinetics of lytic versus latent epitope responses in that percentage representation of the RAK response in the CD8+ pool always fell post-IM, though at different rates in different patients, whereas FLR- and QAK-response representation rose post-IM in 4/5 and in 3/5 cases, respectively. Combining these findings with equivalent RAK and FLR epitope data from the three patients in our original study (3), the fall in percentage representation of the lytic epitope response over time post-IM is clearly significant (P = 0.008) whereas the latent epitope response shows no significant time effect (P = 0.73). Table III also highlights the fact that within an individual donor, the kinetics of the FLR and QAK latent epitope responses do not always run strictly in parallel; the best examples of this are IM141 (Fig. 3, described above) and IM70 where the FLR response followed a typical pattern of increased representation over time while the coresident QAK response fell post-IM.
Table III.
Prospective Study of B8-restricted Response
| Lytic epitope |
Latent epitopes |
||
|---|---|---|---|
| Donor (time post-IM) |
RAK | FLR | QAK |
| 53.1 | 12.6 | 3.3 | 0.3 |
| 53.2 (8 mo) | 1.7 | 1.2 | 0.5 |
| 53.3 (15 mo) | 2.0 | 1.8 | 0.4 |
| 70.1 | 32.4 | 0.2 | 2.0 |
| 70.2 (8 mo) | 7.7 | 1.7 | 0.3 |
| 70.3 (38 mo) | 2.1 | 0.5 | 0.1 |
| 70.4 (48 mo) | 1.7 | 0.7 | 0.2 |
| 70.5 (55 mo) | 2.1 | 0.7 | 0.2 |
| 70.6 (64 mo) | 2.6 | 0.7 | 0.2 |
| 130.1 | 10.7 | 0.5 | 1.8 |
| 130.2 (5 mo) | 1.5 | 0.4 | 1.5 |
| 130.3 (12 mo) | 1.8 | 0.6 | 0.9 |
| 130.4 (21 mo) | 0.57 | 0.2 | 0.3 |
| 140.1 | 24.6 | 0.3 | 0.9 |
| 140.2 (3 mo) | 15.9 | 0.9 | 2.1 |
| 140.3 (8 mo) | 9.6 | 0.8 | 1.2 |
| 140.4 (10 mo) | 9.0 | 0.6 | 0.7 |
| 140.5 (14 mo) | 10.0 | 0.7 | 0.7 |
| 141.1 | 31.2 | 2.5 | 0.7 |
| 141.2 (3 mo) | 7.9 | 4.9 | 1.1 |
| 141.3 (8 mo) | 3.9 | 5.7 | 0.8 |
| 141.4 (10 mo) | 4.1 | 5.4 | 0.5 |
| 141.5 (14 mo) | 5.2 | 7.6 | 0.6 |
Cell Phenotype Changes with Evolution of the Lytic and Latent Epitope Responses.
In a recent study of long-term virus carriers, we noted a clear distinction between lytic and latent epitope-specific populations in their expression of certain differentiation markers. Thus, latent epitope-specific T cells mostly lay within the CCR7+ “central memory” subset and were uniformly CD45RO+CD45RA− whereas lytic epitope-specific populations were often more skewed toward the CCR7− “effector memory” phenotype and contained some CD45RA+CD45RO− cells (25). In the present work we sought to determine if and when such differences became apparent during the evolution of these responses in IM/post-IM patients, and whether they correlated with the source of the epitope per se or with the level of expansion that had occurred within the epitope-driven response.
Fig. 4 shows representative data from one such analysis involving the HLA-A2.1–positive patient IM79 sampled at the time of primary infection (IM79.1) and 5 yr later (IM79.3). On each occasion PBMCs were stained with a PE-labeled tetramer, Tricolor-labeled anti-CD8 mAb, and a FITC-labeled mAb to the third phenotypic marker; the top FACS® profiles show tetramer versus CD8 staining on total PBMCs, and the remaining profiles show tetramer versus third marker staining after gating on the CD8high PBMC fraction. During primary infection in IM79, the response to the lytic cycle epitope YVL was numerically dominant (29% CD8+ T cells) and was almost entirely CD45RA−CD45RO+ and CCR7−, a phenotype consistent with the status of activated effector cells. In the late post-IM bleed, the YVL-specific population was numerically much smaller, heterogeneous in terms of CD45RA and RO expression, with a minority (32%) of cells having acquired CCR7. Interestingly this same pattern of phenotypic change was also observed in the individual's responses to the two other A2.1-restricted lytic cycle epitopes, GLC and TLD, even though these responses were less dramatically expanded during primary infection (data not shown). IM79 was selected for study because a small primary response to the CLG latent epitope was detectable in this particular individual. As shown in Fig. 4 B, this small primary population was likewise CD45RA−, CD45RO+, and CCR7− whereas in the late bleed the CLG-specific population, now constituting a slightly larger proportion of CD8+ T cells, was still uniformly CD45RA−CD45RO+ but the majority (64%) of cells had acquired CCR7. This implies that, with sufficiently long follow-up, lytic and latent epitope-specific T cell populations in the blood of post-IM patients adopt the distinct phenotypic patterns already noted in long-term carriers. This was in fact confirmed when we studied late blood samples from three other HLA-A2.1–positive individuals IM7, IM61, and IM69 who were known to have had serologically and clinically confirmed primary infections respectively 14, 5, and 4 yr earlier. As shown in Fig. 5 A, all three contained CLG epitope-specific populations in the blood that, when compared with their YVL- and GLC-specific populations, were more strongly polarized toward a CD45RO+RA− phenotype and tended to contain a higher percentage of CCR7+ cells.
Figure 4.
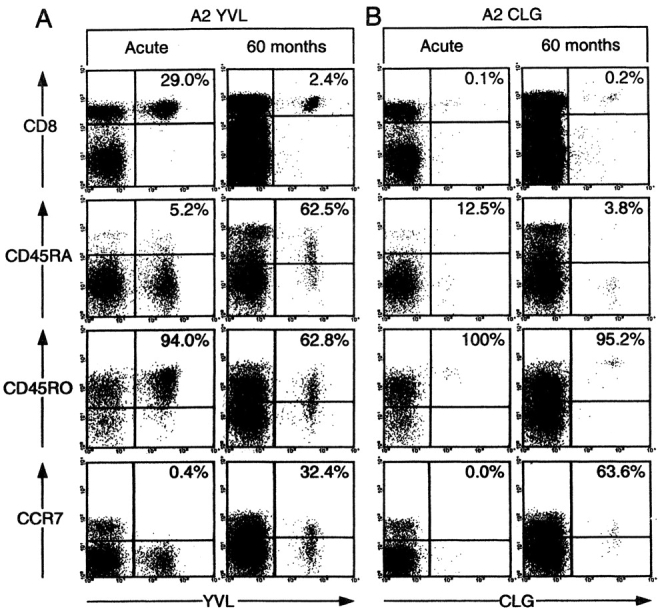
Analysis of EBV epitope-specific CD8+ T cells for CD45RA, CD45RO, and CCR7 status in patient IM79 during acute IM and 50 mo later. Cryopreserved PBMCs were stained with either the A2.1/YVL tetramer (A) or with the A2.1/CLG tetramer (B) followed by anti-CD8 antibody and an antibody against a third marker. The top flow cytometric profiles show CD8 versus tetramer staining: percentage values refer to the percentage of CD8+ cells that stained with tetramer. The lower three profiles show tetramer staining versus staining for the third marker (CD45RA, CD45RO, CCR7) after gating the analysis on CD8+ cells; percentage values refer to the percentage of tetramer-positive cells staining for the marker in question.
Figure 5.

Analysis of CD45RA, CD45RO, and CCR7 expression on EBV epitope-specific CD8 T cells. (A) Cryopreserved PBMCs from A2.1-positive donors that had had IM up to 14 yr previously were stained with appropriate A2.1 epitope tetramers, followed by antibodies specific for CD8 and for the third marker in question. Results are expressed as the percentage of CD8-positive tetramer-positive cells staining for each marker and are shown for two lytic cycle epitopes, YVL (○) and GLC (□), and for the latent cycle epitope CLG (•). (B) PBMCs cryopreserved from IM patients 140 (A2.1, B8-positive), 141 (B8-positive), and 146 (A2.1-positive) during acute IM and subsequently on occasions up to 14 mo later were stained with appropriate A2.1 and/or B8 epitope tetramers, with anti-CD8 and with antibodies to the third marker in question (CR45RA, CD45RO, and CCR7). The percentage of CD8-positive, tetramer-positive cells staining for each marker was determined and plotted over time for each donor. Results are shown for four lytic cycle epitope A2/YVL (○), A2/GLC (□), A2/TLD (▵), B8/RAK (⋄) and for three latent cycle epitopes A2/CLG (•), B8/FLR (▴) and B8/QAK (▪). †Denotes an A2/TLD-specific population which became undetectable after the last time point shown. The star denotes the appearance of an A2/CLG-specific population which was undetectable in acute IM.
We subsequently performed a prospective phenotypic analysis on three IM patients from the present series (IM140, 141, and 146) who had been sampled during the acute disease and on 2–4 further occasions over the next 12–14 mo. The results are presented in Fig. 5 B as graphs showing the percentage of tetramer-positive cells at each time point which expressed the CD45RA, CD45RO, and CCR7 markers. Patient IM140 is particularly instructive in that this individual was both HLA-A2.1– and B8-positive, allowing us to monitor the coincident responses to all seven epitopes. The results clearly show that in this patient there was a very marked change in all four lytic epitope responses with 70–90% cells moving from a CD45RO+ phenotype in acute IM to a CD45RA+ phenotype within 3 mo; this was maintained over the duration of the study with only ∼10% of the cells acquiring CCR7. Interestingly, the most marked reversion to RA+ status was seen in the TLD response, which was numerically the smallest of all four lytic epitopes responses and the one which became undetectable beyond the 8 mo bleed. By contrast, the three latent epitope-specific responses in IM140, including one (the QAK response) which in acute IM had been almost as large as that seen to TLD, all showed a much lower proportion of cells (20–40%) switching from RO+ to RA+ status; these predominantly RO+ populations showed a consistent increase in the proportion of cells with the CCR7 central memory marker to a value of 30–50% by 14 mo post-IM.
The two other patients studied in detail, IM141 (HLA-B8–positive) and IM146 (HLA-A2.1–positive) showed similar patterns of results, albeit with less dramatic differences between lytic and latent epitope responses (Fig. 5 B). In these cases, the lytic epitope-specific populations (RAK for IM141; YVL, GLC, and TLD for IM146) had switched to become 40–60% CD45RA+ within 3–4 mo of the acute disease, a change that was maintained at least beyond the first year, whereas latent epitope responses (FLR, QAK for IM141; CLG for IM146) remained predominantly CD45RO+RA− again with a trend toward greater acquisition of CCR7. It was interesting to note that the unusually large FLR-specific population that eventually outnumbered the RAK-specific population in later bleeds from post-IM patient 141 (see Table III) nevertheless remained distinct from it in terms of CD45RA/RO status.
Discussion
EBV provides one of the most instructive viral systems in which to study the evolution of CD8+ T cell responses in man. Primary infection, at least as seen in adolescence, is frequently manifest as acute IM and the CD8+ lymphocytosis associated with this disease is largely composed of EBV-specific T cells constituting the primary virus-induced response (3, 10, 34, 36, 37). Resolution of the acute infection is accompanied by a dramatic culling of the activated CD8+ T cell population and restoration both of circulating lymphocyte counts and of the CD4/CD8 ratio back into the normal range (38, 39). Nevertheless, a small number of EBV-specific CD8+ T cells survive and are maintained for life thereafter at low but apparently stable levels (24, 40, 41). We were interested to compare the composition of these EBV-specific populations given the notion, arising from work in mouse model systems with nonpersistent agents, that the “burst size” of an epitope-specific CD8+ T cell response at the time of primary infection is the principal determinant of its later representation in memory (8, 13). The most important conclusion from the present work is that the EBV-specific CD8+ T cell populations seen during primary infection and subsequently during asymptomatic viral persistence are qualitatively distinct; recent studies using a different methodology broadly support this view (42,43). Such results are clearly inconsistent with a simple “burst size” model.
One important distinction between the present work and the mouse model systems referred to above is the fact that EBV persists in the immune host, although at viral loads 103–104-fold lower than observed during primary infection (44). Hence the virus-specific CD8+ T cells found in the host long after primary infection, conventionally referred to as the “memory” population, have been maintained in the context of a chronic low grade antigenic challenge. It is worth noting that there have been suggestions of changes in the composition of human CD8+ T cell responses between acute and chronic phases of infection with other pathogens such as HIV and hepatitis C virus (20, 45–47). However, it is difficult to interpret such data given that these viruses are genetically unstable and continue to generate new antigenic variants in vivo. By contrast EBV, a genetically stable herpesvirus, provides an invariant antigenic challenge.
The clearest illustration of qualitative differences between the CD8+ T cell response seen in primary versus persistent EBV infection comes from comparison of lytic-epitope and latent-epitope specificities. In our original study, B8–RAK and B8–FLR tetramer staining on three patients sampled at acute IM and at one point 2–3 yr later first raised the possibility that the numerically larger responses to the RAK lytic cycle epitope might be disproportionately culled (3). The present work demonstrates that this is indeed the case, sampling patients on more occasions and comparing the B8–RAK response with responses against two latent B8-epitopes, FLR and QAK. More importantly the work shows that the kinetics of the lytic and latent epitope responses are distinct. Thus, the RAK response was numerically dominant in every case at primary infection and its percentage representation in the circulating CD8+ T cell pool fell by 2.5 to 20-fold thereafter. In contrast, the FLR and QAK responses, though always detectable in primary infection, had usually increased their percentage representation when assayed 3–8 mo later and thereafter reached a stable level often not too different from that seen in primary infection. As a consequence, the sizes of the lytic and latent epitope-specific pools became much closer over time. These patterns were even clearer from the work with the HLA-A2.1–restricted responses where T cells reactive for each of three lytic cycle epitopes (YVL, GLC, and TLD) were always detectable in primary infection at values ranging from 0.3–33% of the CD8+ T cell pool whereas T cells reactive to the latent cycle CLG epitope were undetectable in all but one case. After IM, the lytic epitope responses almost always fell whereas the CLG response rose to detectable levels in 4/9 cases (where examined, within 3 mo of primary infection) and stabilized thereafter. Although this detailed prospective study of A2.1-restricted responses included just one latent cycle epitope, we believe that the CLG results are generally representative of subdominant latent cycle responses. Thus, we have never detected A2.1-restricted responses to two additional subdominant latent epitopes, LLW and FLY, in studies on acute IM patients (data not shown) yet these reactivities often become detectable in post-IM bleeds just as they are in the blood of healthy virus carriers (35). The delayed appearance of the CLG-specific response after primary EBV infection resembles that recently observed for an HIV epitope in the context of primary HIV infection (20).
It is of course arguable that the kinetics of the lytic and latent epitope responses differ because these epitopes are likely presented by different cells in separate anatomical locations. Such a phenomenon has been reported in studies of mouse T cell responses to the murine γ-herpesvirus MHV-68 where, between the primary and persistent phases of infection, the dominant CD8+ reactivity switches from an epitope expressed in lung epithelium to an epitope preferentially expressed in B cells (7). During the early stages of EBV infection of the naive host, there is local replication of orally transmitted virus in the oropharynx though the identity of the permissive cell type (epithelial or B lymphoid) remains in doubt (48–52). This replicative phase is assumed to precede the virus-driven expansion of latently infected B cells that can be seen in IM tonsillar lymphoid tissues (49, 50). However, the actual sequence of the above events is not known, and certainly at the height of IM both types of infection are well established (21). In view of the present results, it will be important to monitor levels of virus replication in the oropharynx and latent infection in the B cell pool in the immediate aftermath of IM to determine whether changes in antigenic load correlate with the different T cell response patterns.
However, such arguments cannot explain another feature of the present results, which is that responses directed against the A2.1-restricted lytic cycle epitopes YVL, GLC, and TLD can also show different kinetics even though the source antigens (BRLF1, BMLF1, and BMRF1 respectively) are all coexpressed in the same cells very close to the initiation of lytic cycle(21). Thus, the YVL response is usually numerically dominant in acute IM and is consistently culled, as is the GLC response when its initial numbers are relatively high. However, in patients such as IM13 and IM79 (Table II) where the primary GLC response is low, its percentage representation in the CD8 pool remains relatively stable post-IM; consequently in such cases the YVL/GLC ratio changes dramatically over time. By contrast the TLD response, which is usually low in acute IM, is consistently culled and almost always falls below the level of detection. Indeed the absence of TLD reactivities in post-IM patients (Table II) and also in long term carriers (Table I) helps to explain why earlier studies of A2.1-restricted responses in EBV carriers have not identified this epitope.
Discordance between the kinetics of responses to coincident antigenic challenge is again apparent when comparing responses to FLR and QAK, both of which are derived from the same latent cycle antigen, EBNA3A. Thus, in three of the B8 patients studied, the two responses show significantly different patterns of expansion and contraction over time (Table III). Such results contrast with those seen in model systems such as Listeria monocytogenes infection of mice, where a synchronous expansion and contraction of different epitope-specific reactivities occur even where the source antigens are themselves distinct (53). These EBV-specific responses have more in common with recent work on influenza A infection of mice where antigen specificities that were codominant during first virus challenge and clearance were differentially amplified in response to a second challenge (6, 54). The basis of these idiosyncratic differences between FLR and QAK responses in individual IM patients is not understood, but may relate to the numbers of potentially reactive cells in each individual's naive repertoire.
It is worth noting that the present prospective studies have focused on tetramer staining as the indicator of epitope-specific populations. It is therefore formally possible that we have failed to detect CD8+ T cells which have epitope-specific function yet do not react with the tetramer, possibly as a result of partial T cell receptor down-regulation, as reported in some other systems (55, 56). However, we do not believe this to be the case. The inability to detect CLG-specific T cells in almost all acute IM samples was apparent not just from tetramer staining but also from limiting dilution cloning experiments in vitro (Fig. 1) and from ex vivo cytotoxicity assays with IM effector populations. In this latter context we have observed strong lytic epitope-specific lysis that correlates well with tetramer staining data whereas we have never detected killing of CLG epitope-loaded target cells (3, 23; and data not shown). Likewise, the inability to detect TLD-specific cells in post-IM bleeds by tetramer staining was matched by the results of Elispot assays of peptide-induced IFN-γ release. Indeed the range and relative size of epitope-specific reactivities detected in post-IM blood by tetramer staining was consistently confirmed by such Elispot assays (data not shown).
Finally, we examined the evolution of phenotypic change within the different epitope-specific populations over time. Recent work on long term virus carriers (with no history of IM) has shown that lytic epitope-specific T cells are heterogeneous in terms of CD45RO versus CD45RA expression, whereas latent epitope-specific T cells are uniformly CD45RO+RA− and tend to contain higher percentages of cells in the CCR7+ (“central memory”) compartment (25). Here we show that at the height of primary infection, both lytic and latent responses display a uniform phenotype characteristic of activated effector cells, i.e., CD45RO+, CD45RA−, and CCR7−. However, phenotypic differences became apparent within the first few months post-IM. Compared with latent responses which tended to remain CD45RO+, lytic responses always showed a greater shift toward CD45RA positivity with relatively little acquisition of CCR7. Again the extent of the divergence between the two types of responding populations was unique to each patient, but in some cases (e.g., IM140) it was very marked with unusually large shifts toward CD45RA+ status in lytic epitope–specific cells. Interestingly, where we could follow coincident responses within a single patient, all lytic epitope–specific populations showed very similar patterns of phenotypic change, irrespective of the absolute size of these populations; likewise, responses to different latent cycle epitopes varied in size but retained a similar phenotype (largely but not completely CD45RO+, with generally more CCR7 acquisition) even in instances where a latent epitope response was as large as that seen to one of the lytic epitopes. This strongly suggests that the source of the EBV epitope (i.e., lytic versus latent) is a more important determinant of phenotypic change within an epitope-specific CD8+ T cell response than the degree of expansion which the responder population has experienced in vivo. In other human viral infections, much greater phenotypic switching toward a CD45RA+ phenotype has been observed within the more highly amplified CD8+ response to cytomegalovirus (another persistent herpesvirus; references 57 and 58), than among the less abundant CD8+ response to influenza (59, 60). Our data suggest that these differences may not relate to the absolute magnitude of these antigen-specific responses per se but to the identity and/or means of presentation of the antigens involved.
Acknowledgments
We thank Dr. Chris McConkey for statistical analysis and Debbie Williams for expert secretarial help.
This work was support by the Medical Research Council U.K. grant number G9901249 and the Cancer Research Campaign.
A.D. Hislop and N.E. Annels contributed equally to this work.
Footnotes
Abbreviations used in this paper: EBNA, EBV nuclear antigen; Elispot, enzyme-linked immunospot; IM, infectious mononucleosis; LCL, B lymphoblastoid cell line.
References
- 1.Gallimore, A., A. Glithero, A. Godhin, A.C. Tissot, A. Pluckthun, T. Elliott, H. Hengartner, and R.M. Zinkernagel. 1998. Induction and exhaustion of lymphocytic choriomeningitis virus-specific cytotoxic T lymphocytes visualised using soluble tetrameric major histocompatibility complex class I peptide complexes. J. Exp. Med. 187:1383–1393. [DOI] [PMC free article] [PubMed] [Google Scholar]
- 2.Stevenson, P.G., and P.C. Doherty. 1998. Kinetic analysis of the specific host response to a murine gammaherpesvirus. J. Virol. 72:943–949. [DOI] [PMC free article] [PubMed] [Google Scholar]
- 3.Callan, M.F.C., L. Tan, N. Annels, G.S. Ogg, J.D.K. Wilson, C.A. O'Callaghan, N. Steven, A.J. McMichael, and A.B. Rickinson. 1998. Direct visualization of antigen-specific CD8+ T cells during the primary immune response to Epstein-Barr virus in vivo. J. Exp. Med. 187:1395–1402. [DOI] [PMC free article] [PubMed] [Google Scholar]
- 4.Butz, E.A., and M.J. Bevan. 1998. Massive expansion of antigen-specific CD8+ T cells during an acute virus infection. Immunity. 8:167–175. [DOI] [PMC free article] [PubMed] [Google Scholar]
- 5.Kuroda, M.J., J.E. Schmitz, D.H. Barouch, A. Craiu, T.M. Allen, A. Sette, D.I. Wakins, M.A. Forman, and N.L. Letvin. 1998. Analysis of gag-specific cytotoxic T lymphocytes in simian immunodeficiency virus-infected rhesus monkeys by cell staining with a tetrameric major histocompatibility complex class I peptide complex. J. Exp. Med. 187:1373–1381. [DOI] [PMC free article] [PubMed] [Google Scholar]
- 6.Belz, G.T., W.D. Xie, J.D. Altman, and P.C. Doherty. 2000. A previously unrecognised H-2D(b)-restricted peptide prominent in the primary influenza A virus-specific CD8+ T-cell response is much less apparent following secondary challenge. J. Virol. 74:3486–3493. [DOI] [PMC free article] [PubMed] [Google Scholar]
- 7.Stevenson, P.G., G.T. Belz, J.D. Altman, and P.C. Doherty. 1999. Changing patterns of dominance in the CD8+ T cell response during acute and persistent murine gamma-herpesvirus infection. Eur. J. Immunol. 29:1059–1067. [DOI] [PubMed] [Google Scholar]
- 8.Murali-Krishna, K., J.D. Altman, M. Suresh, D.J.D. Sourdive, A.J. Zajac, J.D. Miller, J. Slansky, and R. Ahmed. 1998. Counting antigen-specific CD8 T cells: A re-evaluation of bystander activation during viral infection. Immunity. 8:177–187. [DOI] [PubMed] [Google Scholar]
- 9.Grayson, J.M., A.J. Zajac, J.D. Altman, and R. Ahmed. 2000. Cutting edge: Increased expression of Bcl-2 in antigen-specific memory CD8+ T cells. J. Immunol. 164:3950–3954. [DOI] [PubMed] [Google Scholar]
- 10.Callan, M.F.C., C. Fazou, H.B. Yang, T. Rostron, K. Poon, C. Hatton, and A.J. McMichael. 2000. CD8+ T cell selection, function, and death in the primary immune response in vivo. J. Clin. Invest. 106:1251–1261. [DOI] [PMC free article] [PubMed] [Google Scholar]
- 11.Goldrath, A.W., and M.J. Bevan. 1999. Selecting and maintaining a diverse T cell repertoire. Nature. 402:255–262. [DOI] [PubMed] [Google Scholar]
- 12.Blattman, J.N., D.J.D. Sourdive, K. Murali-Krishna, R. Ahmed, and J.D. Altman. 2000. Evolution of the T cell repertoire during primary, memory, and recall responses to viral infection. J. Immunol. 165:6081–6090. [DOI] [PubMed] [Google Scholar]
- 13.Hou, S., L. Hyland, K.W. Ryan, A. Portner, and P.C. Doherty. 1994. Virus-specific CD8+ T-cell memory determined by clonal burst size. Nature. 369:652–654. [DOI] [PubMed] [Google Scholar]
- 14.Bachmann, M.F., D.E. Speiser, and P.S. Ohashi. 1997. Functional maturation of an anti-viral cytotoxic T-cell response. J. Virol. 71:5764–5768. [DOI] [PMC free article] [PubMed] [Google Scholar]
- 15.Busch, D.H., I. Pilip, and E.G. Pamer. 1998. Evolution of a complex T cell receptor repertoire during primary and recall bacterial infection. J. Exp. Med. 188:61–70. [DOI] [PMC free article] [PubMed] [Google Scholar]
- 16.Busch, D.H., and E.G. Pamer. 1999. T cell affinity maturation by selective expansion during infection. J. Exp. Med. 189:701–709. [DOI] [PMC free article] [PubMed] [Google Scholar]
- 17.Altman, J.D., P.A.H. Moss, P.J.R. Goulder, D.H. Barouch, M.G. Mcheyzer-Williams, J.I. Bell, A.J. McMichael, and M.M. Davis. 1996. Phenotypic analysis of antigen-specific T lymphocytes. Science. 274:94–96. [DOI] [PubMed] [Google Scholar]
- 18.Lalvani, A., R. Brookes, S. Hambleton, W.J. Britton, A.V.S. Hill, and A.J. McMichael. 1997. Rapid effector function in CD8+ memory T cells. J. Exp. Med. 186:859–865. [DOI] [PMC free article] [PubMed] [Google Scholar]
- 19.Waldrop, S.L., C.J. Pitcher, D.M. Peterson, V.C. Maino, and L.J. Picker. 1997. Determination of antigen-specific: Memory/effector CD4+ T cell frequencies by flow cytometry - evidence for a novel, antigen-specific homeostatic mechanism in HIV-associated immunodeficiency. J. Clin. Invest. 99:1739–1750. [DOI] [PMC free article] [PubMed] [Google Scholar]
- 20.Goulder, P.J.R., M.A. Altfeld, E.S. Rosenb, T. Nguyen, Y.H. Tang, R.L. Eldridge, M.M. Addo, S.Q. He, J.S. Mukherjee, M.N. Phillips, et al. 2001. Substantial differences in specificity of HIV-specific cytotoxic T cells in acute and chronic HIV infection. J. Exp. Med. 193:181–193. [DOI] [PMC free article] [PubMed] [Google Scholar]
- 21.Rickinson, A.B, and E. Kieff. 2001. Epstein-Barr virus. Fields Virology, 4th Ed. B.N. Fields, D.M. Knipe, P.M. Howley, R.M. Chanock, J.L. Melnick, T.P. Monath, B. Roizman, and S.E. Strauss, editors. Lippincott Williams & Wilkins, Philadelphia. 2575–2627.
- 22.Steven, N.M., A.M. Leese, N. Annels, S. Lee, and A.B. Rickinson. 1996. Epitope focusing in the primary cytotoxic T-cell response to Epstein-Barr virus and its relationship to T-cell memory. J. Exp. Med. 184:1801–1813. [DOI] [PMC free article] [PubMed] [Google Scholar]
- 23.Steven, N.M., N. Annels, A. Kumar, A. Leese, M.G. Kurilla, and A.B. Rickinson. 1997. Immediate early and early lytic cycle proteins are frequent targets of the Epstein-Barr virus-induced cytotoxic T cell response. J. Exp. Med. 185:1605–1617. [DOI] [PMC free article] [PubMed] [Google Scholar]
- 24.Tan, L.C., N. Gudgeon, N.E. Annels, P. Hansasuta, C.A. O'Callaghan, S. Rowland-Jones, A.J. McMichael, A.B. Rickinson, and M.F.C. Callan. 1999. A re-evaluation of the frequency of CD8+ T cells specific for EBV in healthy virus carriers. J. Immunol. 162:1827–1835. [PubMed] [Google Scholar]
- 25.Hislop, A.D., N.H. Gudgeon, M.F.C. Callan, C. Fazou, H. Hasegawa, M. Salmon, and A.B. Rickinson. 2001. EBV-specific CD8+ T cell memory: relationships between epitope specificity, cell phenotype, and immediate effector function. J. Immunol. 167:2019–2029. [DOI] [PubMed] [Google Scholar]
- 26.Sallusto, F., D. Lenig, R. Forster, M. Lipp, and A. Lanzavecchi. 1999. Two subsets of memory T lymphocytes with distinct homing potentials and effector functions. Nature. 401:708–712. [DOI] [PubMed] [Google Scholar]
- 27.Murray, R.J., M.G. Kurilla, J.M. Brooks, W.A. Thomas, M. Rowe, E. Kieff, and A.B. Rickinson. 1992. Identification of target antigens for the human cytotoxic T cell response to Epstein-Barr virus (EBV): Implications for the immune control of EBV-positive malignancies. J. Exp. Med. 176:157–168. [DOI] [PMC free article] [PubMed] [Google Scholar]
- 28.Scotet, E., J. David-Ameline, M.-A. Peyrat, A. Moreau-Aubry, D. Pinczon, A. Lim, J. Even, G. Semana, J.M. Berthelot, R. Breathnach, et al. 1996. T cell response to Epstein-Barr virus transactivators in chronic rheumatoid arthritis. J. Exp. Med. 184:1791–1800. [DOI] [PMC free article] [PubMed] [Google Scholar]
- 29.Saulquin, X., C. Ibisch, M.-A. Peyrat, E. Scotet, M. Hourmant, H. Vie, M. Bonneville, and E. Houssaint. 2000. A global appraisal of immunodominant CD8 T cell responses to Epstein-Barr virus and cytomegalovirus by bulk screening. Eur. J. Immunol. 30:2531–2539. [DOI] [PubMed] [Google Scholar]
- 30.Lee, S.P., W.A. Thomas, R.J. Murray, F. Khanim, S. Kaur, L.S. Young, M. Rowe, M. Kurilla, and A.B. Rickinson. 1993. HLA A2.1-restricted cytotoxic T cells recognizing a range of Epstein-Barr virus isolates through a defined epitope in latent membrane protein LMP2. J. Virol. 67:7428–7435. [DOI] [PMC free article] [PubMed] [Google Scholar]
- 31.Bogedain, C., H. Wolf, S. Modrow, G. Stuber, and W. Jilg. 1995. Specific cytotoxic T-lymphocytes recognize the immediate-early transactivator ZTA of Epstein-Barr virus. J. Virol. 69:4872–4879. [DOI] [PMC free article] [PubMed] [Google Scholar]
- 32.Burrows, S.R., T.B. Sculley, I.S. Misko, C. Schmidt, and D.J. Moss. 1990. An Epstein-Barr virus-specific cytotoxic T cell epitope in EBNA3. J. Exp. Med. 171:345–350. [DOI] [PMC free article] [PubMed] [Google Scholar]
- 33.Burrows, S.R., J. Gardner, R. Khanna, T. Steward, D.J. Moss, S. Rodda, and A. Suhrbier. 1994. Five new cytotoxic T-cell epitopes identified within Epstein-Barr virus nuclear antigen 3. J. Gen. Virol. 75:2489–2493. [DOI] [PubMed] [Google Scholar]
- 34.Annels, N.E., M.F.C. Callan, L. Tan, and A.B. Rickinson. 2000. Changing patterns of dominant TCR usage with maturation of an EBV-specific cytotoxic T cell response. J. Immunol. 165:4831–4841. [DOI] [PubMed] [Google Scholar]
- 35.Chapman, A.L.N., A.B. Rickinson, W.A. Thomas, R.F. Jarrett, J. Crocker, and S.P. Lee. 2001. Epstein-Barr virus-specific cytotoxic T lymphocyte responses in the blood and tumour site of Hodgkin's disease patients: implications for a T cell-based therapy. Cancer Res. 61:6219–6226. [PubMed] [Google Scholar]
- 36.Hoshino, Y., T. Morishima, H. Kimura, K. Nishikawa, T. Tsurumi, and K. Kuzushima. 1999. Antigen-driven expansion and contraction of CD8+-activated T cells in primary EBV infection. J. Immunol. 163:5735–5740. [PubMed] [Google Scholar]
- 37.Roos, M.T.L., R.A.W. van Lier, D. Hamann, G.J. Knol, I. Verhoofstad, D. van Baarle, F. Miedema, and P.T.A. Schellekens. 2000. Changes in the composition of circulating CD8+ T cell subsets during acute Epstein-Barr and human immunodeficiency virus infections in humans. J. Infect. Dis. 182:451–458. [DOI] [PubMed] [Google Scholar]
- 38.Akbar, A.N., N. Borthwick, M. Salmon, W. Gombert, M. Bofill, N. Shamsadeen, D. Pilling, S. Pett, J.E. Grundy, and G. Janossy. 1993. The significance of low Bcl-2 expression by CD45RO-T-cells in normal individuals and patients with acute viral infections - The role of apoptosis in T-cell memory. J. Exp. Med. 178:427–438. [DOI] [PMC free article] [PubMed] [Google Scholar]
- 39.Uehara, T., T. Miyawaki, K. Okta, Y. Tamaru, T. Yokoi, S. Nakamura, and N. Taniguchi. 1992. Apoptotic cell death of primed CD45RO+ T lymphocytes in Epstein-Barr virus-induced infectious mononucleosis. Blood. 80:452–458. [PubMed] [Google Scholar]
- 40.Benninger-Doring, G., S. Pepper, L. Deml, S. Modrow, H. Wolf, and W. Jilg. 1999. Frequency of CD8+ T lymphocytes specific for lytic and latent antigens of Epstein-Barr virus in healthy virus carriers. Virology. 264:289–297. [DOI] [PubMed] [Google Scholar]
- 41.Kuzushima, K., Y. Hoshino, K. Fujii, N. Yokoyama, M. Fujita, T. Kiyono, H. Kimura, T. Morishima, Y. Morishima, and T. Tsurumi. 1999. Rapid determination of Epstein-Barr virus-specific CD8+ T-cell frequencies by flow cytometry. Blood. 94:3094–3100. [PubMed] [Google Scholar]
- 42.Bharadwaj, M., S.R. Burrows, J.M. Burrows, D.J. Moss, M. Catalina, and R. Khanna. 2001. Longitudinal dynamics of antigen-specific CD8+ cytotoxic T lymphocytes following primary Epstein-Barr virus infection. Blood. 98:2588–2589. [DOI] [PubMed] [Google Scholar]
- 43.Catalina, M.D., J.L. Sullivan, K.R. Bak, and K. Luzuriaga. 2001. Differential evolution of epitope-specific CD8+ T cell responses in EBV infection. J. Immunol. 167:4450–4457. [DOI] [PubMed] [Google Scholar]
- 44.Kimura, H., M. Morita, Y. Yabuta, K. Kuzushima, K. Kato, S. Kojima, T. Matsuyama, and T. Morishima. 1999. Quantitative analysis of Epstein-Barr virus load by using a real-time PCR assay. J. Clin. Microbiol. 37:132–136. [DOI] [PMC free article] [PubMed] [Google Scholar]
- 45.Altfeld, M.A., E.S. Rosenberg, R. Shankarappa, J.S. Mukherjee, F.M. Hecht, R.L. Eldridge, M.M. Addo, S.H. Poon, M.N. Phillips, G.K. Robbins, et al. 2001. Cellular immune responses and viral diversity in individuals treated during acute and early HIV-1 infection. J. Exp. Med. 193:169–180. [DOI] [PMC free article] [PubMed] [Google Scholar]
- 46.Kaul, R., T. Dong, F.A. Plummer, J. Kimani, T. Rostron, P. Kiama, E. Njagi, E. Irungu, B. Farah, J. Oyugi, et al. 2001. CD8+ lymphocytes respond to different HIV epitopes in seronegative and infected subjects. J. Clin. Invest. 107:1303–1310. [DOI] [PMC free article] [PubMed] [Google Scholar]
- 47.Lechner, F., D.K.H. Wong, P.R. Dunbar, R. Chapman, R.T. Chung, P. Dohrenwend, G. Robbins, R. Phillips, P. Klenerman, and B.D. Walker. 2000. Analysis of successful immune responses in persons infected with hepatitis C virus. J. Exp. Med. 191:1499–1512. [DOI] [PMC free article] [PubMed] [Google Scholar]
- 48.Sixbey, J.W., J.G. Nedrud, N. Raab-Traub, R.A. Hanes, and J.S. Pagano. 1984. Epstein-Barr virus replication in oropharyngeal epithelial cells. N. Engl. J. Med. 310:1225–1230. [DOI] [PubMed] [Google Scholar]
- 49.Karajannis, M.A., M. Hummel, I. Anagnostopoulos, and H. Stein. 1997. Strict lymphotropism of Epstein-Barr virus during acute infectious mononucleosis in non-immunocompromised individuals. Blood. 89:2856–2862. [PubMed] [Google Scholar]
- 50.Anagnostopoulos, I., M. Hummel, C. Kreschel, and H. Stein. 1995. Morphology, immunophenotype and distribution of latently and/or productively Epstein-Barr virus-infected cells in acute infectious mononucleosis: Implications for the interindividual infection route of Epstein-Barr virus. Blood. 85:744–750. [PubMed] [Google Scholar]
- 51.Niedobitek, G., A. Agathanggelou, H. Herbst, L. Whitehead, D.H. Wright, and L.S. Young. 1997. Epstein-Barr virus (EBV) infection in infectious mononucleosis: Virus latency, replication and phenotype of EBV-infected cells. J. Pathol. 182:151–159. [DOI] [PubMed] [Google Scholar]
- 52.Babcock, G.J., and D.A. Thorley-Lawson. 2000. Tonsillar memory B cells, latently infected with Epstein-Barr virus, express the restricted pattern of latent genes previously found only in Epstein-Barr virus-associated tumours. Proc. Natl. Acad. Sci. USA. 97:12250–12255. [DOI] [PMC free article] [PubMed] [Google Scholar]
- 53.Busch, D.H., I.M. Pilip, S. Vijh, and E.G. Pamer. 1998. Co-ordinate regulation of complex T cell populations responding to bacterial infection. Immunity. 8:353–362. [DOI] [PubMed] [Google Scholar]
- 54.Turner, S.J., R. Cross, W. Xie, and P.C. Doherty. 2001. Concurrent naive and memory CD8+ T cell responses to an Influenza A virus. J. Immunol. 167:2753–2758. [DOI] [PubMed] [Google Scholar]
- 55.Spencer, J.V., and T.J. Braciale. 2000. Incomplete CD8+ T lymphocyte differentiation as a mechanism for subdominant cytotoxic T lymphocyte responses to a viral antigen. J. Exp. Med. 191:1687–1698. [DOI] [PMC free article] [PubMed] [Google Scholar]
- 56.Rubio-Godoy, V., V. Dutoit, D. Rimoldi, D. Lienard, F. Lejeune, D. Speiser, P. Guillaume, J.-C. Cerottini, P. Romero, and D. Valmori. 2001. Discrepancy between Elispot IFNγ secretion and binding of A2/peptide multimers to TCR reveals interclonal dissociation of CTL effector function from TCR-peptide/MHC complexes half-life. Proc. Natl. Acad. Sci. USA. 98:10302–10307. [DOI] [PMC free article] [PubMed] [Google Scholar]
- 57.Wills, M.R., A.J. Carmichael, M.P. Weekes, K. Mynard, G. Okecha, R. Hicks, and J.G.P. Sissons. 1999. Human virus-specific CD8+ CTL clones revert from CD45ROhigh to CD45RAhigh in vivo: CD45RAhigh CD8+ T cells comprise both naive and memory cells. J. Immunol. 162:7080–7087. [PubMed] [Google Scholar]
- 58.Gillespie, G.M.A., M.R. Wills, V. Appay, C. O'Callaghan, M. Murphy, N. Smith, P. Sissons, S. Rowland-Jones, J.I. Bell, and P.A.H. Moss. 2000. Functional heterogeneity and high frequencies of cytomegalovirus-specific CD8+ T lymphocytes in healthy seropositive donors. J. Virol. 74:8140–8150. [DOI] [PMC free article] [PubMed] [Google Scholar]
- 59.Pittet, M.J., D. Valmori, P.R. Dunbar, D.E. Speiser, D. Lienard, F. Lejeune, K. Fleischhauer, V. Cerundolo, J.-C. Cerottini, and P. Romero. 1999. High frequencies of naive Melan-A/MART-1-specific CD8+ T cells in a large proportion of human histocompatibility leukocyte antigen (HLA)-A2 individuals. J. Exp. Med. 190:705–715. [DOI] [PMC free article] [PubMed] [Google Scholar]
- 60.Dunbar, P.R., G.S. Ogg, J. Chen, N. Rust, P. Van der Bruggen, and V. Cerundolo. 1998. Direct isolation, phenotyping and cloning of low-frequency antigen-specific cytotoxic T lymphocytes from peripheral blood. Curr. Biol. 8:413–416. [DOI] [PubMed] [Google Scholar]