

Abstract
Various immune diseases are considered to be regulated by the balance of T helper (Th)1 and Th2 subsets. Although Th lymphocytes are believed to be generated in draining lymph nodes (LNs), in vivo Th cell behaviors during Th1/Th2 polarization are largely unexplored. Using a murine granulomatous liver disease model induced by Propionibacterium acnes, we show that retention of Th1 cells in the LNs is controlled by a chemokine, CXCL10/interferon (IFN) inducible protein 10 produced by mature dendritic cells (DCs). Hepatic LN DCs preferentially produced CXCL10 to attract 5′-bromo-2′-deoxyuridine (BrdU)+CD4+ T cells and form clusters with IFN-γ–producing CD4+ T cells by day 7 after antigen challenge. Blockade of CXCL10 dramatically altered the distribution of cluster-forming BrdU+CD4+ T cells. BrdU+CD4+ T cells in the hepatic LNs were selectively diminished while those in the circulation were significantly increased by treatment with anti-CXCL10 monoclonal antibody. This was accompanied by accelerated infiltration of memory T cells into the periphery of hepatic granuloma sites, most of them were in cell cycle and further produced higher amount of IFN-γ leading to exacerbation of liver injury. Thus, mature DC-derived CXCL10 is pivotal to retain Th1 lymphocytes within T cell areas of draining LNs and optimize the Th1-mediated immune responses.
Keywords: chemokine, dendritic cell, helper T cell, lymph node, liver
Introduction
Systemic recirculation of T lymphocytes is necessary to maintain constant surveillance of host tissues (1, 2) and is largely dependent on various chemokines based on their state of differentiation and level of activation (3–6). When naive CD4+ T cells encounter an appropriate antigen presented by mature dendritic cells (DCs)* in the paracortex of LNs, they enter the cell cycle and presumably differentiate into memory/effector T cells, such as nonpolarized T, and subsequently Th1, or Th2 cells (7–11). DC–T cell interaction is therefore considered to be essential to initiate effector T cell generation (1, 7, 12). To undergo proper function, antigen-primed CD4+ T cells migrate through LNs during immune responses. CC chemokine receptor (CCR)7+ T cells may remain within T cell areas (6), CCR4+ T cells seem to migrate toward a new wave of maturing DCs within the paracortex (13), CXCR5+ follicular Th cells move to the follicular border to interact with B cells (14), and other T cells return to the circulation through efferent lymphatics (4, 5, 11). However, the in vivo evidence to support those events is confined to rather early stages within the first 48 h after stimulation (6–8, 12–14), while T cells are characteristically in a nonpolarized proliferative stage. The actual site of subsequent Th1 or Th2 polarization, and the mediators regulating the migratory patterns of polarized T cell are still ill-defined (11).
Mature DCs express a set of chemokines (15, 16), which enable them to attract various subsets of T cells and thus to promote and amplify DC–T cell interactions. However, there is very limited evidence concerning the roles of DC-derived chemokines in DC–T cell interaction in the lymphoid organs. IFN-inducible protein (IP)-10/CXCL10 has been reported to be an inflammatory chemokine, which is induced by proinflammatory stimuli (17–19) and may attract effector Th1 cells to sites of local inflammation (20–22). We described previously that CXCL10 is expressed at not only by nonlymphoid organs such as liver and kidney (17–19, 22) but also by lymphoid organs such as spleen and thymus (23). Therefore, we thought that CXCL10 might play a role in the lymphoid organs. We investigated herein the role of CXCL10 in LNs administered with Propionibacterium acnes, which is suspected to cause sarcoidosis in humans (24) and induces a granulomatous liver disease in mice (22, 25).
Materials and Methods
Characterization of Anti-CXCL10 mAb.
Anti–rat CXCL10 mAb was generated as described previously (13). To test whether this mAb could inhibit the function of murine CXCL10 (R&D Systems), we performed chemotaxis assay of the splenocytes obtained from C57BL/6 mice with concanavalin A–induced hepatitis (18, 23) and calcium influx assay using murine CXCR3 stably transfected CHO-K1 cells (23). 100 μg/ml of this mAb could 50% block the activity of murine CXCL10 (100 ng/ml) in chemotaxis and completely block calcium influx assays. The specificity of this mAb for CXCL10 was confirmed immunologically against murine CXCL9, CCL3, CCL21, and CCL22.
In Vivo Treatment.
Specific pathogen-free female C57BL/6 mice (8–9 wk old; CLEA Japan, Inc.) were injected with heat-killed P. acnes (ATCC 11828; 1 mg/100 μl in PBS) via the tail vein (22, 25). All mice were injected with 5′-bromo-2′-deoxyuridine (BrdU) (500 μg/100 μl PBS; Sigma-Aldrich) 1 h before killing (25). For blocking experiments, 200 μg/100 μl in PBS of anti-CXCL10 mAb or anti–human parathyroid-related peptide mAb, which was the IgG1 subclass-matched control mAb, or anti-CXCL9 pAb, anti-CCL3 pAb (25), or control rabbit IgG (25) were administered 0–2 d after P. acnes injection. Hepatocellular damage was determined by serum alanine transferase levels (22). All animal experiments complied with the standards set out in the guidelines of The University of Tokyo.
Immunostaining.
The following anti–mouse mAbs were used: CD3ε (clone; 145–2C11); CD4 (RM4–5); B220 (RA3–6B2); CD62L (MEL-14); IFN-γ (XMG1.2; BD PharMingen); DEC-205 (NLDC-145) (BMA BIOMEDICALS); and CD11c (N418; Serotec). As secondary Abs, an alkaline phosphatase–labeled anti–rat IgG (Jackson ImmunoResearch Laboratories) and a horseradish peroxidase–labeled anti–rat Ig (Biosource) were used. For immunostaining of CXCL10 or CXCL9, goat pAbs (25) to CXCL10 or CXCL9 (Santa Cruz Biotechnology, Inc.) were used.
Single or triple immunostaining was performed by indirect immunoalkaline phosphatase or immunoperoxidase methods (25). For triple immunostaining, acetone-fixed 6-μm fresh frozen tissue sections were doubly immunostained using 3,3′-diaminobenzidine (DAB; Wako) substrate solution and alkaline phosphatase substrate kit II (Vector blue; Vector Laboratories). After further fixation with 1% glutaraldehyde (Nakarai) in PBS for 9 min, they were reacted with the third Abs to BrdU using a BrdU staining kit (Zymed) and were colored red with Vector Red (25).
For double immunofluorescence staining, acetone-fixed 4-μm fresh frozen tissue sections were incubated with biotinylated anti-CD4/B220 or DEC-205 mAbs and then with Alexa-594-conjugated avidin (Molecular Probes). They were incubated with FITC-conjugated anti–IFN-γ mAb or anti-CXCL10 followed by FITC-labeled anti–goat IgG (26), and were observed by fluorescence microscopy (26).
Preparation of CD11c+ DCs.
For liver, nonparenchymal cells were first prepared as described previously (25). Flow cytometric immunofluorescence analyses of freshly isolated nonparenchymal cells were performed and CD11c+ cells were sorted using EPICS ELITE ESP cell sorter (Beckman Coulter) as described previously (22, 25). To collect circulating CD11c+ DC precursors (25), peripheral blood (0.8 ml) was obtained by cardiac puncture under ether anesthesia. After density separation (Lympholyte-Mouse; Cedarlane), immunofluorescence analyses were performed and B220−CD11c+ cells were sorted (22, 25). LN cells were prepared as described previously (22). Reanalysis of the sorted population showed purity >99%.
The one-way mixed leukocyte reaction for CD11c+ DCs was also performed in 96-well plates using premix WST-1 cell proliferation assay system (Takara Biomedicals), as described previously (25). In brief, C57BL/6 mouse derived LN DCs (104 cells/100 μl/well) were cocultured with nylon-wool passed LN T cells (4 × 10⁵ cells/100 μl/well) from BALB/c mice for 72 h. 4 h before the end of culture, WST-1 (20 μl) was added and the absorbance (450–650 nm) was measured.
Antigen-specific Proliferation.
In vitro cell proliferation assay was performed as described previously (27). Briefly, hepatic LN cells (106 cells/100 μl/well) from normal and P. acnes-primed mice at days 2 and 7 were stimulated with or without antigens (P. acnes and OVA; 10 μg/100 μl of PBS) at 37°C for 72 h. After incubation, cell proliferation was measured by WST-1 as described previously.
RT-PCR.
Total RNA was isolated from liver, spleen, and LN specimens and 2 × 10⁵ sorted blood, liver, and LN CD11c+ cells using RNAzolB (BIOTEX LAB) and reverse transcribed (22, 25). Thereafter, cDNA was amplified using the ABI 7700 sequence detector system (Applied Biosystems) with a set of primers and probes corresponding to CXCL9, CXCL10, CXCL11, CCL3, CCL19, CCL21, CCL22, CXCR3, and GAPDH as described previously (22, 25).
Chemotaxis Assay.
Freshly isolated hepatic LN cells (8 × 10⁵/120 μl in RPMI 1640 medium plus 0.25% BSA) were loaded into murine type IV collagen-coated transwells (3-μm pore size; Becton Dickinson), which were placed in a 24-well tissue culture plate containing 500 μl of the medium supplemented with or without 100 ng/ml of CCL22, CXCL10 (R&D Systems), or CCL21 (25, 27). 4 h later, cells in the bottom of each well were collected and counted. After double immunostaining for BrdU and CD4, the absolute number of migrated BrdU+/−CD4+ cells was determined by multiplying the total migrated cell number by the fraction of BrdU+/−CD4+ population.
Cytokine Measurement.
Liver and hepatic LN CD4+ T cells were sorted as described previously (22) by an EPICS Elite Cell Sorter™. Freshly sorted CD4+ T cells (105 cells per well per 200 μl) were incubated in 96-well plates for 24 h with medium or coated anti-CD3ε mAb (20 μg/ml; reference 22). The levels of IFN-γ and IL-4 in each culture supernatant were measured by ELISA kits (Endogen). The detection limits of the assay for IFN-γ and IL-4 were 15 and 5 pg/ml, respectively.
Statistical Analysis.
Differences were evaluated using the Student's t test. P < 0.05 were considered to be statistically significant.
Results
Production of CXCL10 by Mature DCs in the Paracortex of Hepatic LNs.
We have recently reported the rapid appearance of CD11c+ DC precursors in the circulation after P. acnes administration. These DC precursors rapidly migrated into Disse's space of the liver to participate in granuloma formation, and after their maturation into the hepatic LNs (25). On the presumption that DCs need to attract T cells to promote immune response after arriving at the hepatic LNs, we examined the kinetics of chemokine mRNA expression profiles of LN CD11c+ DCs. In the early phase (day 2), CD11c+ DCs in the hepatic LNs started to express CXCL10 and monocyte-derived chemokine (MDC)/CCL22 (Fig. 1 a). In contrast at a later phase (day 7), these DCs expressed CXCL10 at higher level (Fig. 1, a and b), but not Mig/CXCL9, I-TAC/CXCL11, or ELC/CCL19 (Fig. 1 a). The expression levels of CCL22 were conversely decreased (Fig. 1 b). CXCL10 was selectively expressed by hepatic LN DCs, but not by circulating DC precursors or by liver infiltrating mature DCs (Fig. 1 c). In addition, nonregional axillary LN DCs did not express CXCL10 (Fig. 1 c), suggesting that CXCL10 expression was not a property common to LN-resident DCs, but was confined to draining LN DCs. Double immunohistochemical staining confirmed the production of CXCL10 by DEC-205+ mature DCs (25) in the paracortex of hepatic LNs (Fig. 1 d) only after P. acnes injection. These data suggested that activated CD11c+ DCs produced CXCL10 in response to P. acnes. Based on the traffic of DCs (25) and restricted distribution of CXCL10 (Fig. 1 c), most CXCL10-producing DCs were probably derived from the liver through afferent lymphatics.
Figure 1.

Production of CXCL10 by maturing DCs in the hepatic LNs. (a) Kinetics for chemokine expression profiles of hepatic LN CD11c+ DCs. Total RNA of normal spleen specimens was used as positive control. (b) Real time quantitative PCR analysis of CXCL10 and CCL22 mRNA expressions by hepatic LN CD11c+ DCs. Each amount was normalized to the level of GAPDH and the final relative values were expressed relative to calibrators (references 22 and 25); normalized amount on day 0. C, control. (c) Expression of chemokine mRNAs in CD11c+ DCs isolated from the blood, liver, hepatic, and axillary LNs at day 7 after P. acnes injection. These results represent three independent experiments. (d) Double immunostaining for CXCL10 (green) and DEC-205 (red) in the hepatic LNs on day 5. Double positive DCs (merge; yellow) were detected selectively within the paracortex. The outline shows the B cell follicle border as evidenced by B220 staining of serial sections. Scale bars, 40 μm; 20 μm (insert). F, follicle; PC, paracortex.
Promotion of DC–Th1 Lymphocyte Cluster Formation by CXCL10.
After administration of P. acnes, DEC-205+ mature DCs accumulated in the paracortex (Fig. 2 , a and b) clustered with CD4+ T cells (Fig. 2 b). Part of the CD4+ T cells at the periphery of accumulated DCs were labeled with BrdU (Fig. 2, b and c), suggesting that CD4+ T cells proliferated at these sites. To characterize the T cell subsets responding to DC-derived CXCL10, we next investigated the kinetics of proliferation, cytokine production, and migration potential of the hepatic LN T cells. The frequency of BrdU+CD4+ T cells (per mm2) in the paracortex of hepatic LNs rapidly increased to a maximum level by day 2 and remained stable thereafter (Fig. 2 d). P. acnes-primed LN T cells exhibited antigen-specific proliferation by day 2 (Fig. 2 e). Sorted LN CD4+ T cells at day 2 produced considerable levels of IFN-γ and IL-4 (Fig. 2 f). In contrast, the IL-4 level was decreased nearly to background while the IFN-γ level was dramatically increased by LN CD4+ T cells at day 7 (Fig. 2 f). These results suggested that BrdU+CD4+ T cells on day 2 reflected proliferating, nonpolarized Th cells while BrdU+CD4+ T cells by day 7 corresponded to further polarized Th1 cells. IFN-γ–producing CD4+ T cells were selectively detected in the paracortex (Fig. 2 g) and were located at the periphery of small granulomatous clusters (Fig. 2 g). DEC-205+ DCs were actually clustered with IFN-γ–producing cells (Fig. 2 g).
Figure 2.
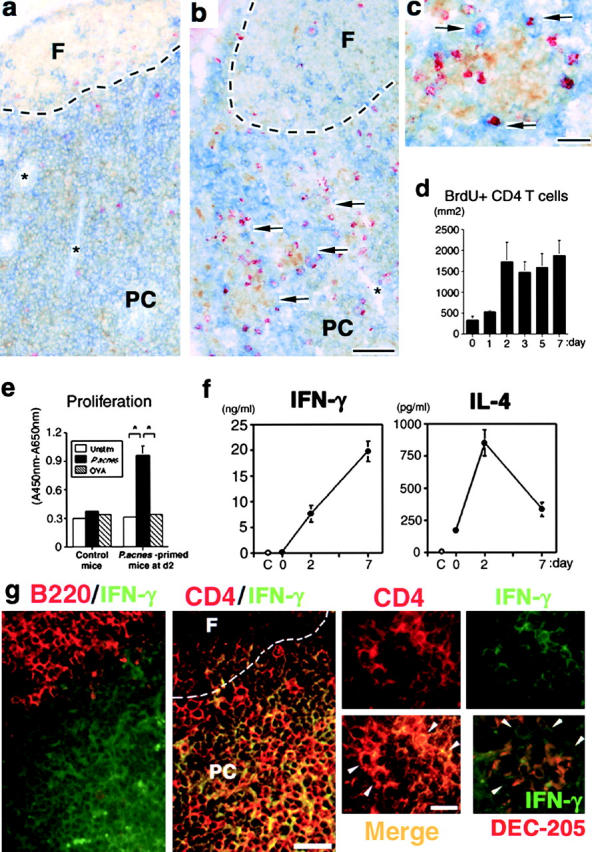
Visualization of DC–T cell clusters in the hepatic LNs. (a–c) Triple immunostaining in the hepatic LNs on days 0 (a) and 7 (b and c). (a) DEC-205+ (brown) cells and a little number BrdU+ (red) CD4+ (blue) cells at day 0. Note that these cells did not form clusters. (b) Numerous clusters between DEC-205+ (brown) cells and BrdU+ (red) CD4+ (blue) cells (arrow) were seen in the paracortex at day 7. *HEV. Scale bar, 100 μm. (c) Contact between BrdU+ (red) CD4+ (blue) cells and DEC-205+ (brown) cells (arrow) at the periphery of a small granulomatous cluster. Scale bar, 20 μm. (d) The numbers of BrdU+CD4+ cells in the paracortex of hepatic LNs determined by 15-mm2 stained cryosections. T cell area of hepatic LNs was defined by B220 or CD3ɛ staining (reference 25). (e) Antigen-specific proliferation of hepatic LN T cells sorted from normal and P. acnes–primed mice at day 2. White bar, medium alone (unstimulated); black bar, P. acnes–stimulated; striped bar, OVA-stimulated. (f) IFN-γ and IL-4 productions by sorted LN CD4+ T cells at day 7. C, medium alone as negative control. (d–f) Representative data from five independent experiments. Mean ± SD. n = 6. Student's t test, *P < 0.05. (g) Double immunostaining for B220 or CD4 (red) and IFN-γ (green) in the hepatic LNs on day 7. IFN-γ+ cells were selectively located in the B220− paracortex (left). IFN-γ+CD4+ cells (yellow) were selectively located at the paracortex. The outlines show the B cell follicle border. F, follicle; PC, paracortex. Scale bar, 40 μm. IFN-γ+CD4+ cells (merge; yellow; white arrowheads) were located at the periphery of a small granulomatous clusters. Right bottom panel depicts double staining for IFN-γ (green) and DEC-205 (red) at day 7. IFN-γ+ cells (white arrowheads) were located at the periphery of DEC-205+ DC accumulation. Scale bar, 20 μm.
In chemotaxis assays, both CXCL10 and CCL22 attracted BrdU+CD4+ T cells at day 2 (Fig. 3 a). In contrast, BrdU+CD4+ T cells at day 7 showed a strong chemotactic response toward CXCL10, while their response to CCL22 was decreased (Fig. 3 a). BrdU−CD4+ resting T cells did not respond to CXCL10 or CCL22, but responded to SLC/CCL21 throughout (Fig. 3 a), suggesting that these cells are still CCR7+ naive T cells (4, 8). CXCR3, a receptor for CXCL10, was detected on sorted LN CD4+ T cells from day 2, and the expression level significantly increased thereafter (Fig. 3 b). These observations indicated that CXCL10 exhibited a chemotactic activity to antigen-responding, proliferating CXCR3+CD4+ T cells, and that Th1 subset predominated among these proliferating T cells (Fig. 2 f).
Figure 3.


Migration potential of LN T lymphocytes. (a) Chemotaxis of freshly isolated LN T cells. The absolute numbers of responding cell subsets were determined after migration as described above, and final results are presented as percentage of the input cells migrated (reference 23). Resting T, BrdU−CD4+ T cells; Proliferating T, BrdU+CD4+ T cells; C, medium alone as negative control. (b) Real time quantitative PCR analysis of CXCR3 mRNA expression on freshly isolated LN CD4+ T cells. The final relative values were expressed relative to the calibrators as described above; normalized amount of CXCR3 on day 0. Representative data from three independent experiments. Mean ± SD, n = 6.
Reduced Cluster Formation in the Paracortex by Blocking CXCL10.
To establish the biological role of CXCL10 in LN T cell mobilization, we investigated the effect of neutralizing anti-CXCL10 mAb on T cell distribution within the hepatic LNs. Mice were injected with anti-CXCL10 mAb or control mAb 0 and 2 d after P. acnes treatment. On day 7, there were very few clusters between DEC-205+ mature DCs and BrdU+CD4+ T cells in the paracortex of hepatic LNs (Fig. 4 , a and b) and only foci of DCs with resting T cells were seen in anti-CXCL10 mAb-treated mice (Fig. 4, a–e). Although the CD4/CD8 ratio (3.52 vs. 3.80 in control mAb versus anti-CXCL10 mAb-treated mice) and total cell number (Fig. 4 f) of hepatic LNs did not statistically change, the number of BrdU+CD4+ T cells was significantly decreased in anti-CXCL10 mAb-treated mice at day 7 (Fig. 4, b and g). In situ double immunofluorescence staining also revealed the dramatic decrease of IFN-γ+ CD4+ T cells at day 7 (data not shown). Anti-CXCL10 treatment did not affect the number or ex vivo alloantigen-presenting capability of DEC-205+ mature DCs (Fig. 4 h), indicating that the decreased frequency of DC–T cell clusters was not due to increased apoptosis, decreased migration, or impaired function of DCs. In addition, P. acnes–specific proliferation of LN T cells obtained from anti-CXCL10 mAb-treated mice at day 7 was not affected (Fig. 4 i).
Figure 4.

Effect of anti-CXCL10 mAb on LN T cells. (a and b) Triple immunostaining for DEC-205 (brown), BrdU (red), and CD4 (blue) in the hepatic LNs of control mAb- (a) and anti-CXCL10 mAb- (b) treated mice at day 7. The outlined squares represent clusters between DEC-205+ DCs and CD4+ T cells. Note that there were few BrdU+ CD4+ cells in b. Scale bar, 20 μm. The outlines show the B cell follicle border. F, follicle: PC, paracortex. (c–e) Triple immunostaining for B220 (brown), BrdU (red), and DEC-205 (blue) in the hepatic LNs at day 0 (c) and day 7 (d and e). (d) In control mAb-treated LNs, the clusters between DEC-205+ cells and B220−BrdU+ cells were seen in the paracortex. (e) In anti-CXCL10 mAb-treated LNs, only DC accumulations were seen in the paracortex. The outlined squares represent DC accumulation. Note that DEC-205+ DCs did not form clusters by themselves (square) at day 0. Scale bar, 20 μm. F, follicle; PC, paracortex. (f) Total cell numbers of LN cells on day 7. (g) The numbers of BrdU+CD4+ cells in the paracortex of hepatic LNs determined by 15-mm2 stained cryosections. (h) DEC-205+ cells in the paracortex of hepatic LNs on day 7 determined by 15-mm2 stained cryosections (top). Densely labeled cells were analyzed using a grid micrometer (reference 25). The number of grid intersections overlying positively labeled cells was counted. Final results were presented as the proportion of the number of positive intersections to the total number of grid intersections. Primary allogeneic MLR of CD11c+ DCs isolated from the hepatic LNs on day 7 (bottom). White column, control mAb-treated mice; black column, anti-CXCL10 mAb-treated mice; dotted column, untreated mice (f–h). (i) Antigen-specific proliferation of LN T cells obtained from P. acnes–primed mice treated with control or anti-CXCL10 mAb at day 7. Medium alone, unstimulated LN T cells obtained from P. acnes–primed mice treated with control mAb at day 7. 10 mice per group were examined. Representative data from three experiments. Mean ± SD, n = 10. Student's t test, *P < 0.05.
Increased Infiltration of Proliferating Th1 Cells in the Liver by Blocking CXCL10.
We further pursued the fate of LN BrdU+CD4+ T cells, which disappeared from LNs in anti-CXCL10 mAb-treated mice. Blockade of CXCL10 unexpectedly enhanced the inflammatory hepatocellular damage (Fig. 5 a) accompanied by a significant increase in number and size of CD4+ T cell–associated granulomas (Fig. 5, b and c) without affecting recruitment of F4/80+ macrophages/Kupffer cells (Fig. 5, d and e) at day 7. The number of CD62L−CD4+ memory T cells (9) was increased in peripheral blood as well as in the hepatic sinusoid by anti-CXCL10 mAb (data not shown). Moreover, BrdU+CD4+ T cells were also increased both in the liver and the circulation (Fig. 5 f). Liver-infiltrating CD4+ T cells isolated from anti-CXCL10 mAb-treated mice produced higher levels of IFN-γ than control mAb-treated mice without affecting IL-4 production (Fig. 5 g).
Figure 5.
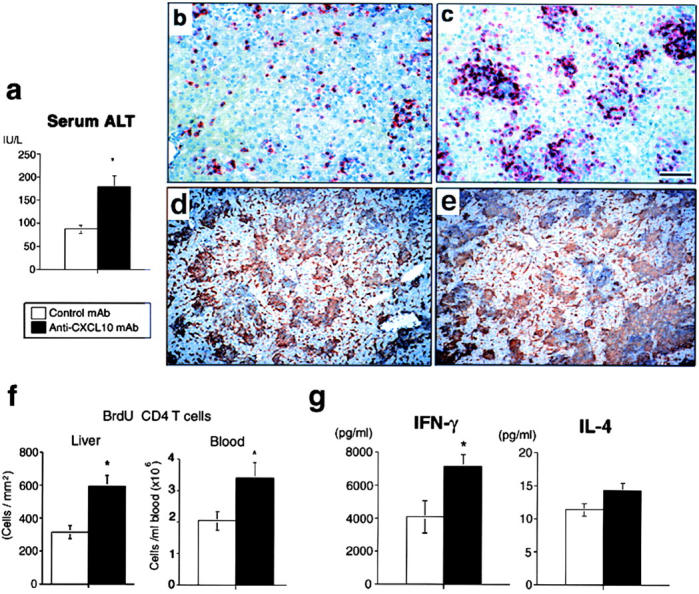
Effect of anti-CXCL10 mAb on liver injury. (a) Serum alanine transferase levels on d7. (b–e) Immunostaining for CD4 (red) or F4/80 (brown) in the control mAb-treated liver (b and d) and anti-CXCL10 mAb-treated liver (c and e) at day 7. Scale bar, 100 μm. (f) The numbers of BrdU+CD4+ T cells in the hepatic sinusoid determined by 15-mm2 stained cryosections (left) and in the circulation (right) at day 7. (g) IFN-γ and IL-4 productions by sorted liver CD4+ T cells at day 7. White column, control mAb-treated mice; black column, anti-CXCL10 mAb-treated mice (a, f, and g). Representative data from three independent experiments. Mean ± SD, n = 10. Student's t test, *P < 0.05.
Distinct Expression of Inflammatory Chemokines in the Liver and Hepatic LNs.
Anti-CXCL10 mAb-treatment was originally expected to inhibit Th1 cell infiltration in the liver and diminish granuloma formation (22). To solve this, we compared mRNA expression levels between the liver and hepatic LNs of three chemokines, CXCL10, CXCL9, and MIP-1α/CCL3 whose mRNAs all were upregulated in P. acnes–primed liver (22). CXCL9 and CCL3 mRNAs were predominantly detected in the liver, but not in the hepatic LNs (Fig. 6 a), and were not affected by anti-CXCL10 mAb (data not shown). In contrast, the expression level of CXCL10 in the hepatic LNs was significantly higher than in the liver (Fig. 6 a) on day 7 after P. acnes injection. In addition, CXCL10 was produced not by granuloma-forming cells but by hepatocytes surrounding granulomas (Fig. 6 b). CXCL9 (Fig. 6 c) and CCL3 (25) were detected at granuloma-forming cells including Kupffer cells. These results suggested that Th1 cells still had a capacity to enter the liver in response to CXCL9 and CCL3 even after blockade with CXCL10. Actually, as expected, treatment with both anti-CXCL9 and CCL3 polyclonal Abs resulted in a significant reduction in the size (Fig. 6 d) and the number of the hepatic granulomas.
Figure 6.
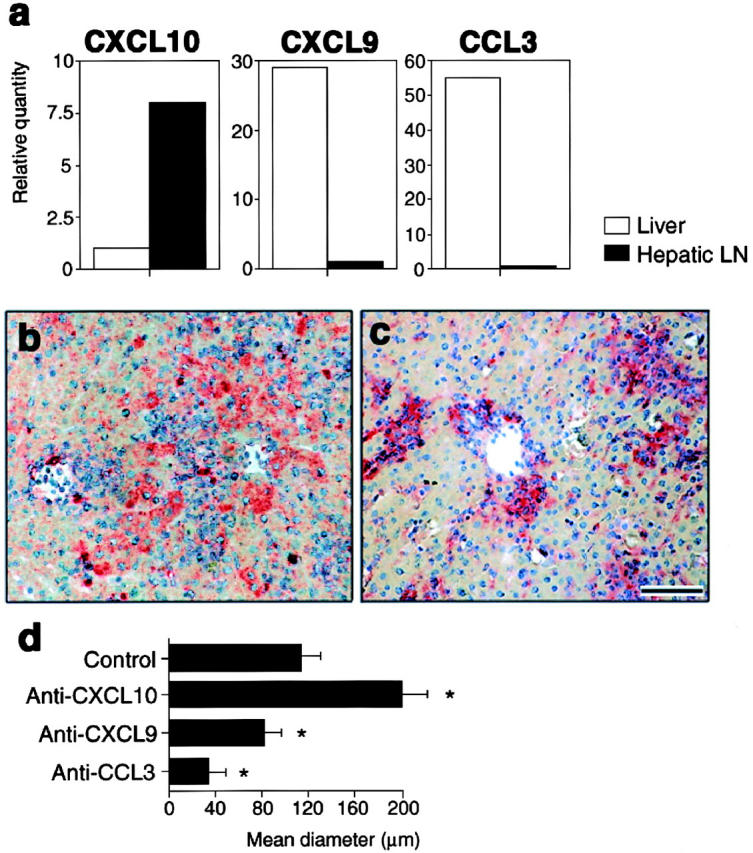
Effect of inflammatory chemo-kines on liver injury. (a) Real-time quantitative PCR analysis of CXCL10, CXCL9, and CCL3 mRNA expressions on the liver (white bars) and hepatic LNs (black bars) at day 7. Each amount was normalized to the level of each GAPDH. The final relative values were expressed relative to the calibrators (reference 25); normalized amount of liver for CXCL10, and of LNs for CXCL9 and CCL3. (b and c) Production of CXCL10 (b, red) by hepatocytes surrounding granulomas or CXCL9 (c, red) by granuloma-forming cells at day 7. Scale bar, 100 μm. (d) Effects of anti-CXCL10, CXCL9, and CCL3 Abs on the size of hepatic granulomas. Mice were injected with anti-CXCL10 mAbs, anti-CXCL9 pAbs, anti-CCL3 pAbs, or control rabbit IgG 0, 2 d after P. acnes treatment. On day 7, mice were killed and livers were sampled. Mean diameters of granulomas (reference 25) were determined by HE staining of formalin-fixed 2-μm thick liver sections. Representative data from three independent experiments. Mean ± SD, n = 6. Student's t test, *P < 0.05.
Discussion
We have demonstrated that blockade of CXCL10 dramatically altered the distribution of BrdU+CD4+ T cells (Figs. 4 and 5) in the late phase of P. acnes–induced Th1 granulomatous liver disease (22, 25). Several possibilities were considered about the role of CXCL10 within the hepatic LNs. First, CXCL10 directly promoted proliferation of T cells. In this respect, recent investigations suggest that chemokines produced by antigen-presenting cells directly influence Th cell differentiation (28). The numbers of liver F4/80+ macrophages (Fig. 5 e) and CD11c+ DCs (data not shown) in this study were not affected by anti-CXCL10 mAb treatment, suggesting that CXCL10 did not recruit these antigen-presenting cells into the liver and that P. acnes–antigen loading was not impaired. In addition, alloantigen-presenting capability of LN DCs as well as antigen-specific LN T cell proliferation was not impaired by anti-CXCL10 mAb treatment (Fig. 4, h and i). Evidence of increased liver-infiltrating BrdU+CD4+ T cells even after treatment with CXCL10 (Fig. 5 d) also supported the notion that Th cell proliferation was not directly affected by blockade of CXCL10. Second, CXCL10 promoted circulating memory T cell reentry into the hepatic LNs through afferent lymphatics from the liver, or through high endothelial venules (HEVs) from the circulation. However, since CXCL10 was not produced by HEVs (Fig. 1 d) or afferent lymphatics located in the hepatic portal area (data not shown), it is unlikely that anti-CXCL10 mAb inhibited memory T cell reentry across HEVs or along afferent lymphatics.
Third, CXCL10 attracted and retained IFN-γ–producing CD4+ T cells within the DC–T cell clusters in the hepatic LNs. In this respect, CCR7 was reported to control T cell localization within T cell areas of lymphoid tissues (6, 29). Forced expression of CCR7 on in vitro–generated antigen-specific Th2 cells shifted their position from B cell follicle to T cell areas when adoptively transferred (6), while transferred CCR7-lacking T cells did not remain within the T cell areas but extensively localized in B cell follicle of the spleen (29). In contrast in this study, the number of BrdU+CD4+ T cells did not increase within B cell follicle (Fig. 4, b and e), but significantly increased in the peripheral blood by blocking CXCL10 (Fig. 5 f). This suggests that BrdU+CD4+ T cells egressed the LNs and entered the circulation. Therefore, the third mechanism seems to be most probable.
Increased BrdU+ memory T cells and probably their progeny in the peripheral blood by treatment with anti-CXCL10 mAb may subsequently enter the hepatic sinusoid, where the initial antigen took place (25). A larger number of memory T cells accumulated at granuloma sites (peripheral DC–T cell clusters; reference 25) by treatment with anti-CXCL10 mAb were in cell cycle (Fig. 5, c and f), indicating that these cells could proliferate by reclustering with antigen-loaded DCs (25) in the liver. Interestingly, these cells produced higher amount of IFN-γ (Fig. 5 g), suggesting that antigen-experienced incompletely polarized CD4+ T cells might be further polarized at the liver after compelled to be released from the draining LNs by blockade of CXCL10. Although anti-CXCL10 mAb treatment altered the fate of CD4+ T cells, the redistributed CD4+ T cells neither migrated toward follicular border where B cell help occurs (14, 30), nor produced IL-4 in the liver (Fig. 5, f and g). These suggest that released CD4+ T cells by blockade of CXCL10 were not follicular Th or Th2 cells. Taking account of several lines of evidence that P. acnes treatment induces Th1 type immune response (22), the effect of anti-CXCL10 mAb in the hepatic LNs was selective on proliferating, IFN-γ-producing, Th1 type CD4+ T cells.
Our findings identify the actual site of Th1 cell polarization in vivo in P. acnes–induced granulomatous liver disease; DC–T cell clusters both in the draining LNs and in the peripheral inflamed tissue. Therefore, we propose that Th1 cell generation in this model can be divided into at least four phases controlled by mature DC-derived chemokines (Fig. 7) . First, initiation of DC–naive T cell interaction possibly by CCL19, or CCL21 (3, 4, 7). Second, amplification of DC–nonpolarized T cell clusters by CCL22 (and possibly by CXCL10). Third, selective attraction and retention of T cells that were being in the process toward Th1 polarization by CXCL10. The last phase is reformation of DC–Th1 cell clusters at the peripheral tissue possibly by CCL3 (25) (and also CXCL9) (Fig. 7) to complete Th1 polarization. This also implicates that granuloma is not mere endpoint of inflammation but a feature of ongoing immune response.
Figure 7.

Peripheral and regional DC–Th cell clusters as the sites of Th1 cell generation regulated by DC-derived chemo-kines. (1) Initiation and induction of DC-naive T cell clusters by CCL19 or CCL21 (references 3, 4, and 7). (2) Amplification of DC-nonpolarized T cell clusters by CCL22 (references 13, 34, and this study). (3) Promotion and retention of DC–Th1 cell clusters (this study). These clusters may develop in the given spaces of the paracortex called “cytokine fields” (reference 33). DC-derived chemo-kines may regulate T cell traffic depending on their state of activation between these given spaces to magnify the effective immune responses. After leaving the LNs, Th1 cells migrate into the liver through the circulation and (4) reform clusters with peripheral tissue-resided inflammatory DCs (granuloma formation) possibly by CCL3 or CXCL9 (references 22, 25, and this study). Th1 cells can further proliferate and produce higher amount of IFN-γ at the periphery of the granulomas to complete polarization.
Although cluster-forming nonpolarized T cells progressively shifted to Th1 cells within the LNs (Fig. 2 f), the frequency of BrdU+CD4+ T cells in the paracortex did not change from days 2–7 in situ (Fig. 2 d). This would be explained by the following considerations. Anatomically, the paracortex is filled with a dense reticular fiber network (31), in which collagen is sequestered. Therefore, formation of small granulomatous DC–T cell clusters could develop only within the sparse reticular/collagen spaces (31, 32) that scattered in the deep cortex. Recently proposed “cytokine fields” as the sites of the polarization of immune response (33) may develop at such given spaces. In this respect, it was reported that antigen-loaded maturing DCs produced CCL22 after arriving draining LNs and attracted activated T cells (13), and that CCL22 mediated antigen-primed T cell–DC binding (34). In this study, CCL22 was also expressed by maturing LN DCs probably in the given spaces and attracted BrdU+CD4+ T cells (Figs. 1 a and 3 a) probably to create the local “cytokine field.” Antigen-experienced initial nonpolarized BrdU+ T cells (Fig. 2, d and f) may migrate toward newly arrived DCs to form a maximum frequency of DC–T cell clusters at the given spaces by day 2. Mature DCs are usually eliminated from the LNs within 48 h after interacting with antigen-specific T cells (12). This may enable initially primed CD4+ T cells (nonpolarized T cells) to free to migrate toward other sites. On the other hand, circulating DC precursors in this model continuously enter the LNs through afferent lymphatics at least by day 7 (25). Thus, from days 2–7, newly arriving DCs might enter the extinguished “cytokine fields” and selectively attract IFN-γ-producing, but not IL-4–producing subset among the freed primed CD4+ T cells by producing CXCL10. In other words, like CD8+ T cell competition to antigen-presenting cells (35), activated CXCR3+CD4+ T cells might compete for access to CXCL10-producing mature DCs according to their extent of IFN-γ production between the established “cytokine fields.”
CXCL10-mediated effector T cell traffic pattern is also interesting. In Toxoplasma gondii infection, Khan et al. (20) reported that neutralization of CXCL10 inhibited the infiltration of effector Th1 cells and ability to kill the parasite in the target organs such as the liver, spleen, brain, and lung. The effect on the Th1 cell trafficking into the target tissues is opposite to our results. However, this could be explained by the distinct response to different stimuli according to the disease models, since gene expression of inflammatory chemokines including CXCL10 is induced in tissue-, cell type–, and stimulus-specific manner (17–22, 36, 37). Inflammatory chemokines including CCL3, CXCL9, and CXCL11 were generally produced by granuloma-forming Kupffer cells in our model (references 22 and 25; Fig. 6, and data not shown). Since Kupffer cells directly abut the blood stream, CCL3 and CXCL9 may promote blood T cell entry into the hepatic sinusoid and may help them to transmigrate into Disse's space (25, 38). On the other hand, CXCL10 was preferentially produced by injurious hepatocytes (Fig. 6), whose vascular poles abutted Disse's space. T cells that transmigrated into Disse's space may be sequentially attracted into the tissue space by CXCL10. In this respect, sequential involvement of different chemokines for leukocyte entry and subsequent mobilization in the tissue has been also demonstrated in inflamed tonsils and skin (39). Therefore, direct effect of CXCL10 for blood T cell entry into the sinusoid is considered to be weak compared with CCL3 and CXCL9. In addition, the expression of CXCL10 mRNA was much higher in the LNs than that in the liver (Fig. 6). Thus, the effect of CXCL10 mAb treatment in this model was mostly on the LNs, and released cells in the process of Th1 polarization bearing CXCR3 alone or both CXCR3 and CCR5 (22) could be recruited to the sinusoid by CCL3 and CXCL9 (Fig. 6). In contrast, in T. gondii infection as well as acute allograft rejection in cardiac transplantation, CXCL10 was rapidly and strongly expressed in the target organs (20, 36, 37) especially by endothelial cells (37) that may directly promote leukocyte entry from the circulation. The expressions of CXCL9, CXCL11, and CCL3 in the target organs in these models were reported to be delayed and weak or none compared with CXCL10 (20, 36, 37), and the effect of CXCL10 neutralization was mostly on the target tissues. Either CXCL9 or CCL3 did not substitute for CXCL10 in T cell recruitment. Therefore, we consider that effector T cell traffic into the target organs may be determined by the expression level and tissue localization of chemokines between lymphoid and nonlymphoid organs. Despite the opposite effect on T cell traffic into the target organs, the consensus is that CXCL10 plays a pivotal role in controlling effector Th1 cell mobilization in host defense system.
The biological significance of CXCL10-mediated Th1 cell retention could be of host protection. The final outcome of T cell–mediated disease is dependent on the extent and duration of effector T cell recruitment into the target tissue. Although appropriate Th1 cell traffic into the inflamed liver is necessary to eliminate microorganism (25), excessive influx of Th1 cells may cause more severe inflammation (Fig. 5 a). CXCL10 may play a role in supplying an appropriate number of effector T cells to the circulation. This should enable the host to eradicate an invading pathogen with minimum tissue damage.
In conclusion, we have demonstrated in this study that DC-derived CXCL10 regulates DC–Th1 cell cluster formation and retention of CD4+ T lymphocytes that are being in the process of Th1 polarization in the T cell areas of draining LNs. Our study suggests that release of memory T lymphocytes into efferent lymphatics as well as homing to inflamed tissue are controlled by chemokines. The concept of “Th1 cell retention” as host protective immunity may provide a new insight into the mechanism of effector T cell generation as well as the development of novel therapeutic approaches to Th1-mediated diseases.
Acknowledgments
We are very grateful to Dr. Joost J. Oppenheim (National Cancer Institute, Frederick, MD) for review before submission. We express our sincere gratitude to Prof. K. Matsuno (Dokkyo University, Tochigi, Japan) for advice on immunohistochemical staining.
This study was supported in part by a grant from Core Research and Evolutional Science and Technology, Japan Science and Technology Corporation, and the Japan Society for the Promotion of Science.
Footnotes
Abbreviations used in this paper: BrdU, 5′-bromo-2′-deoxyuridine; CCR, CC chemokine receptor; HEV, high endothelial venule; IP, IFN-inducible protein.
References
- 1.Butcher, E.C., and L.J. Picker. 1996. Lymphocyte homing and homeostasis. Science. 272:60–66. [DOI] [PubMed] [Google Scholar]
- 2.Westermann, J., and R. Pabst. 1996. How organ-specific is the migration of ‘naive’ and ‘memory’ T cells? Immunol. Today. 17:278–282. [DOI] [PubMed] [Google Scholar]
- 3.Cyster, J.G. 1999. Chemokines and cell migration in secondary lymphoid organs. Science. 286:2098–2102. [DOI] [PubMed] [Google Scholar]
- 4.Lanzavecchia, A., and F. Sallusto. 2000. Dynamics of T lymphocyte responses: intermediates, effectors, and memory cells. Science. 290:92–97. [DOI] [PubMed] [Google Scholar]
- 5.Yoneyama, H., S. Kawasaki, and K. Matsushima. 2000. Regulation of Th1 and Th2 immune responses by chemokines. Springer Semin. Immunopathol. 22:329–344. [DOI] [PubMed] [Google Scholar]
- 6.Randolph, D.A., G. Huang, C.J.L. Carruthers, L.E. Bromley, and D.A. Chaplin. 1999. The role of CCR7 in TH1 and TH2 cell localization and delivery of B cell help in vivo. Science. 286:2159–2162. [DOI] [PubMed] [Google Scholar]
- 7.Banchereau, J., and R.M. Steinman. 1998. Dendritic cells and the control of immunity. Nature. 392:245–252. [DOI] [PubMed] [Google Scholar]
- 8.Lanenkamp, A., M. Messi, A. Lanzavecchia, and F. Sallusto. 2000. Kinetics of dendritic cell activation: impact on priming of TH1, TH2 and nonpolarized T cells. Nat. Immunol. 1:311–316. [DOI] [PubMed] [Google Scholar]
- 9.Iezzi, G., D. Scheidegger, and A. Lanzavecchia. 2001. Migration and function of antigen-primed nonpolarized T lymphocytes in vivo. J. Exp. Med. 193:987–993. [DOI] [PMC free article] [PubMed] [Google Scholar]
- 10.Grogan, J.L., M. Mohrs, B. Harmon, D.A. Lacy, J.W. Sedat, and R.M. Locksley. 2001. Early transcription and silencing of cytokine genes underlie polarization of T helper cell subsets. Immunity. 14:205–215. [DOI] [PubMed] [Google Scholar]
- 11.Reinhardt, R.L., A. Khoruts, R. Merica, T. Zill, and M.K. Jenkins. 2001. Visualizing the generation of memory CD4 T cells in the whole body. Nature. 410:101–105. [DOI] [PubMed] [Google Scholar]
- 12.Ingulli, E., A. Mondino, A. Khoruts, and M.K. Jenkins. 1997. In vivo detection of dendritic cell antigen presentation to CD4+ T cells. J. Exp. Med. 185:2133–2141. [DOI] [PMC free article] [PubMed] [Google Scholar]
- 13.Tang, H.L., and J.G. Cyster. 1999. Chemokine up-regulation and activated T cell attraction by maturing dendritic cells. Science. 284:819–822. [DOI] [PubMed] [Google Scholar]
- 14.Breitfield, D., L. Ohl, E. Kremmer, J. Ellwart, F. Sallusto, M. Lipp, and F. Forster. 2000. Follicular B helper T cells express CXC chemokine receptor 5, localize to B cell follicles, and support immunoglobulin production. J. Exp. Med. 192:1545–1551. [DOI] [PMC free article] [PubMed] [Google Scholar]
- 15.Sallusto, F., B. Palermo, D. Lenig, M. Miettinen, S. Matikainen, I. Julkunen, R. Forster, R. Burgstahler, M. Lipp, and A. Lanzavecchia. 1999. Distinct patterns and kinetics of chemokine production regulate dendritic cell function. Eur. J. Immunol. 29:1617–1625. [DOI] [PubMed] [Google Scholar]
- 16.Hashimoto, S., T. Suzuki, H.Y. Dong, S. Nagai, N. Yamazaki, and K. Matsushima. 1999. Serial analysis of gene expression in human monocyte-derived dendritic cells. Blood. 94:845–852. [PubMed] [Google Scholar]
- 17.Narumi, S., L.M. Wyner, H. Stoler, C.S. Tannenbaum, and T.A. Hamilton. 1992. Tissue-specific expression of murine IP-10 mRNA following systemic treatment with IFN-γ. J. Leukoc. Biol. 52:27–33. [DOI] [PubMed] [Google Scholar]
- 18.Tamaru, M., K. Nishioji, Y. Kobayashi, Y. Watanabe, Y. Itoh, T. Okanoue, M. Murai, K. Matsushima, and S. Narumi. 2000. Liver-infiltrating T lymphocytes are attracted selectively by IFN-inducible protein-10. Cytokine. 12:299–308. [DOI] [PubMed] [Google Scholar]
- 19.Narumi, S., H. Yoneyama, H. Inadera, K. Nishioji, Y. Itoh, T. Okanoue, and K. Matsushima. 2000. TNF-α is a potent inducer for IFN-inducible protein-10 in hepatocytes and unaffected by GM-CSF in vivo, in contrast to IL-1β and IFN-γ. Cytokine. 12:1007–1016. [DOI] [PubMed] [Google Scholar]
- 20.Khan, I.A., J.A. MacLean, F.S. Lee, L. Casciotti, E. DeHaan, J.D. Schwartzman, and A.D. Luster. 2000. IP-10 is critical for effector T cell trafficking and host survival in Toxoplasma gondii infection. Immunity. 12:483–494. [DOI] [PubMed] [Google Scholar]
- 21.Liu, M.T., B.P. Chen, P. Oertel, M.J. Buchmeier, D. Armstrong, T.A. Hamilton, and T.E. Lane. 2000. The T cell chemoattractant IFN-inducible protein 10 is essential in host defense against viral-induced neurologic disease. J. Immunol. 165:2327–2330. [DOI] [PubMed] [Google Scholar]
- 22.Yoneyama, H., A. Harada, T. Imai, M. Baba, O. Yoshie, Y. Zhang, H. Higashi, M. Murai, H. Asakura, and K. Matsushima. 1998. Pivotal role of TARC, a CC chemokine, in bacteria-induced fulminant hepatic failure in mice. J. Clin. Invest. 102:1933–1941. [DOI] [PMC free article] [PubMed] [Google Scholar]
- 23.Tamaru, M., Y. Tomonaga, K. Yatsunami, and S. Narumi. 1998. Cloning of murine interferon-inducible protein 10 (IP-10) receptor and its specific expression in lymphoid organs. Biochem. Biophys. Res. Commun. 251:41–48. [DOI] [PubMed] [Google Scholar]
- 24.Ishige, I., Y. Usui, T. Takemura, and Y. Eishi. 1999. Quantitative PCR of mycrobacterial and propionibacterial DNA in lymph nodes of Japanese patients with sarcoidosis. Lancet. 354:120–123. [DOI] [PubMed] [Google Scholar]
- 25.Yoneyama, H., K. Matsuno, Y. Zhang, M. Murai, M. Itakura, S. Ishikawa, G. Hasagawa, M. Naito, H. Asakura, and K. Matsushima. 2001. Regulation by chemokines of circulating dendritic cell precursors, and the formation of portal tract-associated lymphoid tissue, in a granulomatous liver disease. J. Exp. Med. 193:35–49. [DOI] [PMC free article] [PubMed] [Google Scholar]
- 26.Suriki, H., K. Suzuki, Y. Baba, K. Hasegawa, R. Narisawa, Y. Okada, T. Mizuochi, H. Kawachi, F, Shimizu, and H. Asakura. 2000. Analysis of cytokine production in the colon of nude mice with experimental colitis induced by adoptive transfer of immunocompetent cells from mice infected with murine retrovirus. Clin. Immunol. 97:33–42. [DOI] [PubMed] [Google Scholar]
- 27.Itakura, M., A. Tokuda, H. Kimura, S. Nagai, H. Yoneyama, N. Onai, S. Ishikawa, T. Kuriyama, and K. Matsushima. 2001. Blockade of secondary lymphoid tissue chemokine exacerbates Propionibacterium acnes-induced acute lung inflammation. J. Immunol. 166:2071–2079. [DOI] [PubMed] [Google Scholar]
- 28.Luther, S.A., and J.G. Cyster. 2001. Chemokines as regulators of T cell differentiation. Nat. Immunol. 2:102–107. [DOI] [PubMed] [Google Scholar]
- 29.Forster, R., A. Schubel, D. Breitfield, E. Kremmer, I. Renner-Muller, E. Wolf, and M. Lipp. 1999. CCR7 coordinates the primary immune response by establishing functional microenvironments in secondary lymphoid organs. Cell. 99:23–33. [DOI] [PubMed] [Google Scholar]
- 30.Garside, P., E. Ingulli, R.R. Merica, J.G. Johnson, R.J. Noelle, and M.K. Jenkins. 1998. Visualization of specific B and T lymphocyte interactions in the lymph node. Science. 281:96–99. [DOI] [PubMed] [Google Scholar]
- 31.Ushiki, T., O. Ohtani, and K. Abe. 1995. Scanning electron microscopic studies of reticular framework in the rat mesenteric lymph node. Anat. Rec. 241:113–122. [DOI] [PubMed] [Google Scholar]
- 32.Gunzer, M., A. Schafer, S. Borgmann, S. Grabbe, K.S. Zanker, E. Brocker, E. Kampgen, and P. Friedl. 2000. Antigen presentation in extracellular matrix: interactions of T cells with dendritic cells are dynamic, short lived, and sequential. Immunity. 13:323–332. [DOI] [PubMed] [Google Scholar]
- 33.Kourilsky, P., and P. Truffa-Bachi. 2001. Cytokine fields and the polarization of the immune response. Trends Immunol. 22:502–509. [DOI] [PubMed] [Google Scholar]
- 34.Wu, M.-T., H. Fang, and S.T. Hwang. 2001. CCR4 mediates antigen-primed T cell binding to activated dendritic cells. J. Immunol. 167:4791–4795. [DOI] [PubMed] [Google Scholar]
- 35.Kedl, R.M., W.A. Rees, D.A. Hildeman, B. Schaefer, T. Mitchell, J. Kappler, and P. Marrack. 2000. T cells compete for access to antigen-bearing antigen-presenting cells. J. Exp. Med. 192:1105–1113. [DOI] [PMC free article] [PubMed] [Google Scholar]
- 36.Hancock, W.W., B. Lu, W. Gao, V. Csizmadia, K. Faia, J.A. King, S.T. Smiley, M. Ling, N.P. Gerard, and C. Gerard. 2000. Requirement of the chemokine receptor CXCR3 for acute allograft rejection. J. Exp. Med. 192:1515–1519. [DOI] [PMC free article] [PubMed] [Google Scholar]
- 37.Hancock, W.W., W. Gao, V. Csizmadia, K.L. Faia, N. Shemmeri, and A.D. Luster. 2001. Donor-derived IP-10 initiates development of acute allograft rejection. J. Exp. Med. 193:975–980. [DOI] [PMC free article] [PubMed] [Google Scholar]
- 38.Kudo, S., K. Matsuno, T. Ezaki, and M. Ogawa. 1997. A novel migration pathway for rat dendritic cells from the blood: hepatic sinusoids-lymph translocation. J. Exp. Med. 185:777–784. [DOI] [PMC free article] [PubMed] [Google Scholar]
- 39.Vanbervliet, B., B. Homey, I. Durand, C. Massacrier, S. Ait-Yahia, O. de Bouteiller, A. Vicari, and C. Caux. 2002. Sequential involvement of CCR2 and CCR6 ligands for immature dendritic cell recruitment: possible role at inflamed epithelial surfaces. Eur. J. Immunol. 32:231–242. [DOI] [PubMed] [Google Scholar]