Abstract
Dendritic cells (DCs) are able in tissue culture to phagocytose and present antigens derived from infected, malignant, and allogeneic cells. Here we show directly that DCs in situ take up these types of cells after fluorescent labeling with carboxyfluorescein succinimidyl ester (CFSE) and injection into mice. The injected cells include syngeneic splenocytes and tumor cell lines, induced to undergo apoptosis ex vivo by exposure to osmotic shock, and allogeneic B cells killed by NK cells in situ. The CFSE-labeled cells in each case are actively endocytosed by DCs in vivo, but only the CD8+ subset. After uptake, all of the phagocytic CD8+ DCs can form major histocompatibility complex class II–peptide complexes, as detected with a monoclonal antibody specific for these complexes. The CD8+ DCs also selectively present cell-associated antigens to both CD4+ and CD8+ T cells. Similar events take place with cultured DCs; CD8+ DCs again selectively take up and present dying cells. In contrast, both CD8+ and CD8− DCs phagocytose latex particles in culture, and both DC subsets present soluble ovalbumin captured in vivo. Therefore CD8+ DCs are specialized to capture dying cells, and this helps to explain their selective ability to cross present cellular antigens to both CD4+ and CD8+ T cells.
Keywords: dendritic cells, cross-presentation, apoptosis, dendritic cell subset, CD8+ dendritic cell
Introduction
Dendritic cells (DCs)* are particularly efficient in the cross presentation of antigens. DCs can present, on MHC class I products, peptides derived from incoming immune complexes (1–3), heat shock proteins (4–6), nonreplicating bacteria (7), and dying cells (8–13). Dying cells are likely to be an important source of antigen in many settings, for example, tumors, transplants, infections, and autoimmunity. To understand the role of DCs in the presentation of cell-associated antigens, which occurs efficiently on both MHC class I (8–13) and class II products (14, 15), we have directly followed the capacity of DCs to take up dying cells in vivo, particularly spleen cells labeled with carboxyfluorescein succinimidyl ester (CFSE). Injected splenocytes are commonly used to follow the immune response to cell associated antigens (16–18), and DCs are the principal cells presenting these antigens onto MHC class I (19). We find that uptake of several types of dying cells in situ occurs selectively in the CD8+ subset of DCs. This is associated with selective presentation on both MHC class I and II products. In contrast, uptake of latex occurs to a comparable extent in both CD8+ and CD8− DCs as reported (20). We discuss the emerging evidence that subsets of DCs have distinct endocytic receptors, a critical limiting variable for implementing antigen presentation, and that one potential consequence of apoptotic cell uptake is tolerance to cell associated antigens.
Materials and Methods
Mice.
C57BL/6, (BALB/c × DBA/2) F1 (CD2F1), CBA/J, and BALB/c mice were purchased from Japan SLC or Nippon Clea. TCR transgenic mice were specific for OVA presented on H-2Kb or I-Ab (CD8+ OT-I and CD4+ OT-II; provided by Dr. F. Carbone, University of Melbourne, Parkville, Victoria, Australia) or specific for I-E presented on I-Ab (CD4+ 1H3 T cells; provided by C. Viret and C.A. Janeway, Jr., Yale University, New Haven, CT). DEC-205 (CD205)-deficient mice were made and provided by M. Nussenzweig (Rockefeller University, New York, NY). The mice were maintained under specific pathogen free conditions and used at 7–8 wk of age. All experiments were conducted according to institutional guidelines.
Antibodies and Reagents.
Rat mAbs for MHC class II (TIB120, M5/114.15.2), CD205 (HB290, DEC-205), granulocytes (RB6–8C5: Gr-1), B220 (TIB146: RA3–3A1, RA3–6B2), F4/80 (HB198), and CD8 (TIB211, 3.155) were from American Type Culture Collection. FITC-anti-CD11c, CD3ε, Thy-1.2 (CD90), B220 and CD107b, PE-conjugated anti-CD8α, CD11b, CD11c, biotinylated anti-CD4, CD8α, I-Ab, CD40, CD54, CD80, CD86 and CD11c, mouse anti–human Vβ8, and streptavidin-CyChrome® were from BD PharMingen. Y-Ae mAb, specific for the MHC–peptide complex formed by I-Ab presenting a peptide from I-E (14, 21), was provided by Dr. C.A. Janeway, Jr. Anti-CD11c, CD43, CD19, and CD5 microbeads® were from Miltenyi Biotec. The other reagents were rat IgG, FITC-conjugated mouse anti–rat IgG, biotin-conjugated rat IgG, biotin-conjugated Syrian hamster IgG, Cy3-conjugated F(ab′)2 mouse anti–rat IgG, Cy3-conjugated F(ab′)2 goat anti–rat IgG, streptavidin-Cy5 and streptavidin-Cy-3 (Jackson ImmunoResearch Laboratories), biotin-conjugated anti-CD11b and F4/80 (Caltag Labs), allophycocyanin (APC)-conjugated anti-CD8α and CD11b (eBioscience), collagenase D (Boehringer), Percoll (Amersham Pharmacia Biotech), RPMI 1640 (Nissui Pharmaceutical Co. Ltd.), 30% BSA solution (Sigma-Aldrich), and avidin-Red670™ (Life Technologies).
Cell Preparations.
DCs from spleen and subcutaneous lymph nodes were positively selected (anti-CD11c microbeads®) from low density cells as described (22). In some experiments, the CD8α+ DCs subset was first positively enriched with anti-CD8 microbeads® from spleen low-density cells, depleted of T cells by either CD3ε or CD90, B cells by either CD19 or B220, and granulocytes by Gr-1; then CD8α−, CD11c+ DCs were purified by anti-CD11c microbeads® from the remaining cells. In other experiments, CD8+ and CD8− DCs were purified by sorting with EPICS ALTRA® flow cytometer (Beckman Coulter) after preenrichment of CD11c+ DCs by Microbeads®. Liver DCs were prepared from collagenase-digested livers enriched for leukocytes on Percoll gradients, followed by the depletion of CD3, B220, and Gr-1-expressing cells as described (23). In liver, low and high CD11b expression is preferable for identifying DC subsets, because CD8 expression is lower than in spleen (23).
B cells were negatively selected CD43− cells (anti-CD43 microbeads®) from spleen suspensions. In some experiments, B cells were activated with goat F(ab′)2 anti–mouse IgM/IgG plus IL-4 for 2 d as described (14). TCR-transgenic, CD8+ OT-I T cells were prepared by depleting B220, Gr-1, CD4, F4/80, MHC class II, and NK1.1-expressing cells using sheep anti–rat IgG Dynabeads®. For CD4+ OT-II and 1H3 T cells, anti-CD8 instead of CD4 mAb was used. Macrophages were peritoneal exudate cells of mice that had been injected with 2 ml of thioglycollate medium 4 d before.
To label with CFSE (Molecular Probes), B cells or the BaF3 and EL-4 cell lines were suspended at 107/ml in RPMI and incubated with CFSE at concentrations of 5 μM for in vivo injection and 1 μM for in vitro assay for 10 min at 37°C. The reaction was stopped by washing three times with PBS-0.1% BSA. CFSE-labeled cells were osmotically shocked (16–18) to accelerate apoptosis. By this treatment, 55% of the cells were stained with both PI and annexin, and 17% were PI− and annexin+, within 3 h of culture at 37°C, whereas only 5 and 6% of untreated cells became PI+ annexin+ and PI− annexin+, respectively.
For NK cell depletion, mice were injected intraperitoneally with 50 μl of rabbit anti–mouse asialo-GM1 serum (Wako Pure Chemical Industries Ltd.) 3 and 1 d before injecting CFSE-labeled B cells. Control mice were injected with normal rabbit serum.
In Vivo Uptake of FITC-Latex Microspheres or CFSE-labeled Cells by DCs.
Three mice/group were injected with 200 μl of 0.27% 1 μm Fluoresbrite™ Yellow Green Carboxylate Microspheres (FITC-Lx; Polysciences, Inc.) or 1–2 × 10⁷ CFSE-labeled cells intravenously. The mice were killed at various time points, and FITC- or CFSE-labeled cells were analyzed in the CD11c+ fraction by FACS®, or by deconvolution microscopy (Olympus) after sorting with an EPICS ALTRA® flow cytometer as above.
In Vitro Uptake of FITC-Latex Microspheres or CFSE-labeled Cells by DCs.
After staining with PE-CD8α or PE-CD11b mAbs, enriched CD11c+ DCs at 105 cells/well were seeded in triplicate with a final concentration of 0.0027% (vol/vol) FITC-Lx or graded doses of CFSE-labeled, osmotically shocked B cells in 0.2 ml of RPMI 1640 supplemented with 5% FCS, 50 μM 2-mercaptoethanol, 100 μg/ml streptomycin, and 100 U/ml penicillin in 96-well flat-bottomed plates, and then cultured for 1–12 h in a CO2 incubator. Controls were incubated at 4°C. The percentage of phagocytic DCs in each subset was calculated by subtracting the value of the control from the experimental culture.
Flow Cytometric Analyses.
Low density spleen, lymph node, and liver leukocytes were depleted of CD3ε, Gr-1, and B220-expressing cells and stained with PE-CD11c in combination with biotinylated mAbs plus streptavidin-Red670 or -CyChrome®. Cells were incubated before staining with 2.4G2 mAb on ice for 30 min to prevent nonspecific mAb binding. All procedures were performed using cold PBS containing 5 mM EDTA, 0.02% NaN3, and 1% FCS. DCs were acquired as CD11c+ cells. Surface antigen expression was monitored on a FACSCalibur™ and analyzed with CELLQuest™ program (Becton Dickinson) or WinMDI software (TSRI). For cytoplasmic staining, the cells stained with PE-CD11c were fixed with 4% (wt/vol) paraformaldehyde for 30 min on ice, permeabilized with 0.1% saponin, and incubated with biotinylated mAbs and Avidine-Red 670. For 4-color staining, the cells were stained with PE-CD11c and APC-CD8α followed by biotinylated mAbs and Streptavidin-CyChrome®.
Immunofluorescence Microscopy.
Spleen samples were embedded in Tissue-Tek® OTC (Sakura Fine Technical Co., Ltd.) and stored at –20° until use. Cryosections at 10 μm of thickness were fixed with acetone for 10 min, and then incubated successively with SER-4 anti-CD169, Cy3-conjugated F(ab′)2 mouse anti–rat IgG, rat IgG for blocking, biotin-CD11c or CD8α, and streptavidin-Cy5. Purified DCs were adhered to poly-l-lysine-coated glass coverslips for 1 h in a CO2 incubator. The cells were then fixed in 3% (wt/vol) paraformaldehyde followed by permeabilization with 0.05% saponin in RPMI 1640 containing 10 mM HEPES and 10% FCS, and then stained for CD205 or CD107b using Cy5-conjugated F(ab′)2 mouse anti–rat IgG followed by biotin-anti-I-Ab and streptavidin-Cy3. After washing, specimens were mounted with glycerin-PBS (1:1) containing 1% propylgallate (Wako Pure Chemicals Industries, Ltd.)
Stimulation of TCR Transgenic T Cells to Monitor Antigen Presentation.
The experiments used mice injected with C57BL/6 splenocytes or EL-4 tumor cells that had been osmotically shocked in 10 mg/ml OVA, or mice injected with I-E+ allogeneic BALB/c B cells. After allowing uptake to take place in situ, the DCs were added to T cells from TCR transgenic mice (above) to assess presentation of the captured and processed antigens (see legends).
Reverse Transcription PCR. Total RNA was extracted from 106 sorted CD8+ and CD8− spleen DCs and peritoneal macrophages using TRIzol Reagent (GIBCO BRL) and used to produce cDNA template with SuperScript II (GIBCO BRL) in accordance with manufacturer's protocols. The cDNA was then used in reverse transcription (RT)-PCR with Z-Taq DNA polymerase (Takara Shuzo). The primers were: for integrin αv (5′-CAA GCT CAC TCC CAT CAC-3′, 5′-GGG TGT CTT GAT TCT CAA AGG G-3′), integrin β3 (5′-TTG CTA CTC TGC TCA TCT GGA AGC-3′, 5′-TCC CCA CAC TCG TCA CAC ACA TAAG-3′), integrin β5A (5′-TTG CCA AGT TCC AAA GTG A-3′, 5′-GCG TGA CCT TTT TAT TTC AT-3′), integrin β5B (5′-TGC CAA GTT CCA AAG CCT-3′, 5′-GCG TGA CCT TTT TAT TTC AT-3′), CD14 (5′-TTT TGG ACT CTG AAT CCC ACT CGG-3′, 5′-TAC CCA CTG AAC CAT CTT GAC TGC C-3′), CD36 (5′-CAG CCC AAT GGA GCC ATC-3′, 5′-CAG CGT AGA TAG ACC TGC-3′), scavenger receptor class BI (5′-CAT CTG GTG GAC AAA TGG AAC G-3′, 5′-CGT GGG AAT GCC TTC AAA CAC-3′), macrophage scavenger receptor type I (SR-AI; 5′-ACA GTT CGA CTG GTT GGT GGT AGT G-3′, 5′-TGA AGT ACA AGT GAC CCC AGC ATC-3′), macrophage scavenger receptor type II (SR-AII; 5′-CAC CTC TGG ACA AGT CAT CAA CAC-3′, 5′-GAA GGC AGG AAC ATC CCT CTA CTC-3′), C1q receptor (5′-GAC ACC TCA CCC CAG CCA TCT G-3′, 5′-CAC TGA GTG GTA CAG AAT GGC AC-3′), phosphatidylserine receptor (PtdsR; 5′-CAT CAA GGT GAC CCG AGA AGA AGG-3′, 5′-AAG TTG GTG CTG CTG GCA AAG TTC-3′), CD68 (5′-ATG CGG CTC CCT GTG TGT C-3′, 5′-TCA GAG GGG CTG GTA GGT TG-3′), CD4 (5′-GAG AGT CAG CGG AGT TCT C-3′, 5′-CTC ACA GGT CAA AGT ATT GTT G-3′), CD23 (5′-GGA ACTG CAT GCA ACA TAT GTC CCA AGA ACT GGCT-3′, 5′-GTC AGG GTT CAC TTT TTG GGG TGG GCC T-3′), mDC-SIGN (5′-ACA TGA GTG ATT CTA AGG AAA TGG-3′, 5′-TGT CAA GGT TAT CAA TGG TCA CAG-3′), and actin (5′-CAG GAG ATG GCC ACT GCC GCA-3′, 5′-CTC CTT CTG CAT CCT GTC AGC A-3′). Amplification was begun at 95°C for 2 min followed by 30 cycles (each cycle being 98°C for 1 s, 60°C for 5 s but 68°C for β-actin, and 72°C for 5 s) and a final extension of 70°C for 7 min.
Results
Both CD8+ and CD8− splenic DCs phagocytose latex in vivo, but only CD8+ DCs take up injected apoptotic splenocytes. Following on the work of Shortman and colleagues that splenic DCs phagocytose latex beads administered intravenously (20), we injected mice with either 1 micron FITC-modified latex spheres or CFSE-labeled splenocytes. The latter were subject to osmotic shock, which is used to load splenocytes with exogenous proteins like OVA (16–18). We found that apoptosis, as assessed by FITC-annexin staining, was induced in the majority of splenocytes within 3 h of an osmotic shock delivered ex vivo (not shown). 1 h after injecting CFSE-labeled osmotically shocked splenocytes, or FITC-latex, we enriched DCs from the spleens on the basis of their low buoyant density (22). Then flow cytometry with antibodies to CD11c and CD8 was used to identify the low density cells that had taken up CFSE-splenocytes or FITC-latex.
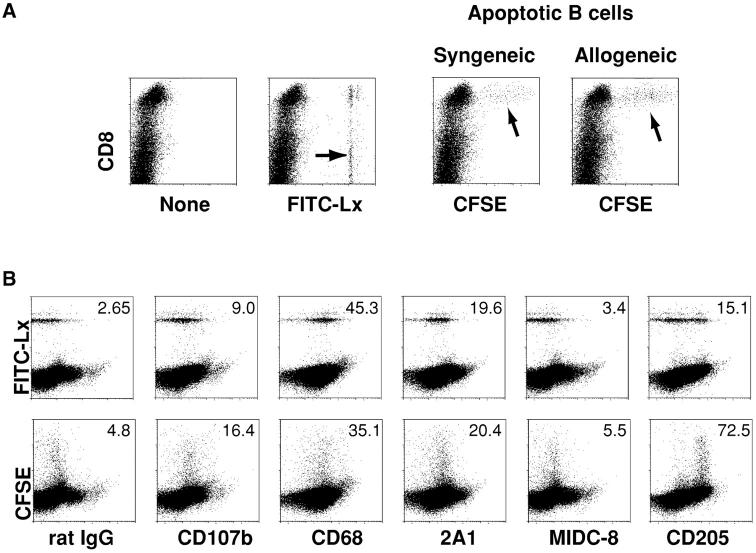
Fig. 1 A (left) shows that both CD8+ and CD8− DCs took up latex as described (20), primarily one bead but occasionally two beads per cell (arrows). However only CD8+ cells endocytosed CFSE-labeled apoptotic splenocytes, either syngeneic or allogeneic (arrows, Fig. 1 A right). Very few CFSE-labeled cells were noted in the CD11c− low density cells, or the high density fraction (not shown), and these were not further characterized. Fig. 1 B describes the phenotype of the phagocytic DCs in the CD11c+ low density population. Staining for the lysosomal marker lamp 2 (CD107b) was weak, in contrast to macrophages. The CD68 and 2A1 antigens, found within small numbers of endocytic vacuoles of DCs (24), were expressed by phagocytic DCs, but the MIDC-8 marker of T cell area DCs (25) was lacking. In the case of latex, only some of the phagocytic cells expressed DEC-205/CD205; however, the DCs capturing apoptotic splenocytes had a high level of DEC-205 (Fig. 2 B) and low levels of CD11b (not shown), as expected for the CD8+ subset (26, 27). Therefore, uptake of particulates in vivo by splenic DCs is influenced by the particle. Only CD8+ DCs take up apoptotic splenocytes, whereas both CD8+ and CD8− DCs take up latex.
Figure 1.
Apoptotic B cells and splenocytes, but not FITC-latex spheres, are selectively captured by CD8+ splenic DCs in vivo. (A) Groups of three mice were injected with PBS, FITC-latex (0.2 ml of a 0.27% solution), or 20 × 106 apoptotic CFSE-labeled syngeneic or allogeneic B cells. 1 h later, splenic suspensions were floated in dense BSA to provide DC-enriched low density cells (reference 22). The latter were stained for CD11c and CD8 and examined by FACS® (see also Fig. 2 A). Shown here are cells gated for CD11c expression and analyzed for PE–anti-CD8 and fluorescein stain. Phagocytic DCs are arrowed. The percentage of phagocytic CD8+ and CD8− DCs for FITC-Lx was 2.7 and 3.8% of total CD11c+ cells, respectively. Comparable percentages (1.5%) of DCs were capable of phagocytosing apoptotic syngeneic and allogeneic B cells. (B) DCs that phagocytose FITC-latex (5.7%) and CFSE-apoptotic splenocytes (1.45%) are comparable in phenotype (panel numbers are mean fluorescence in arbitrary units), except for higher DEC-205 endocytic receptor on those DCs taking up splenocytes (lower right).
Figure 2.
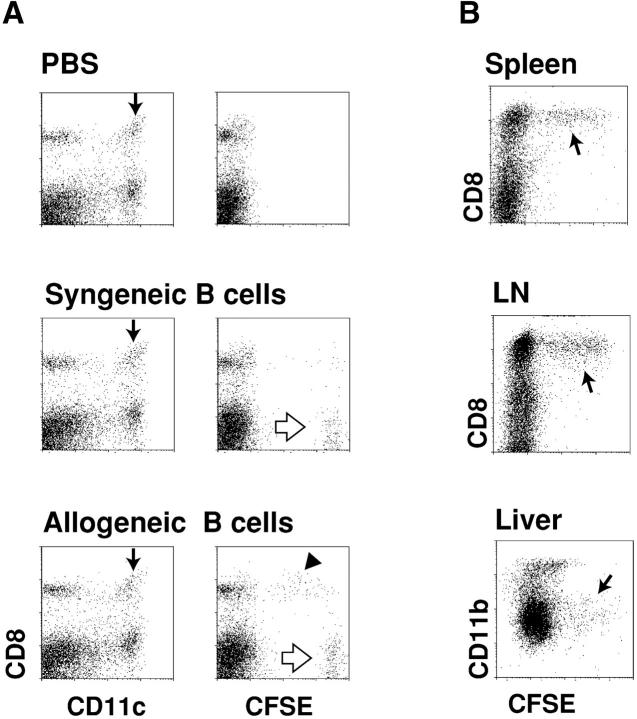
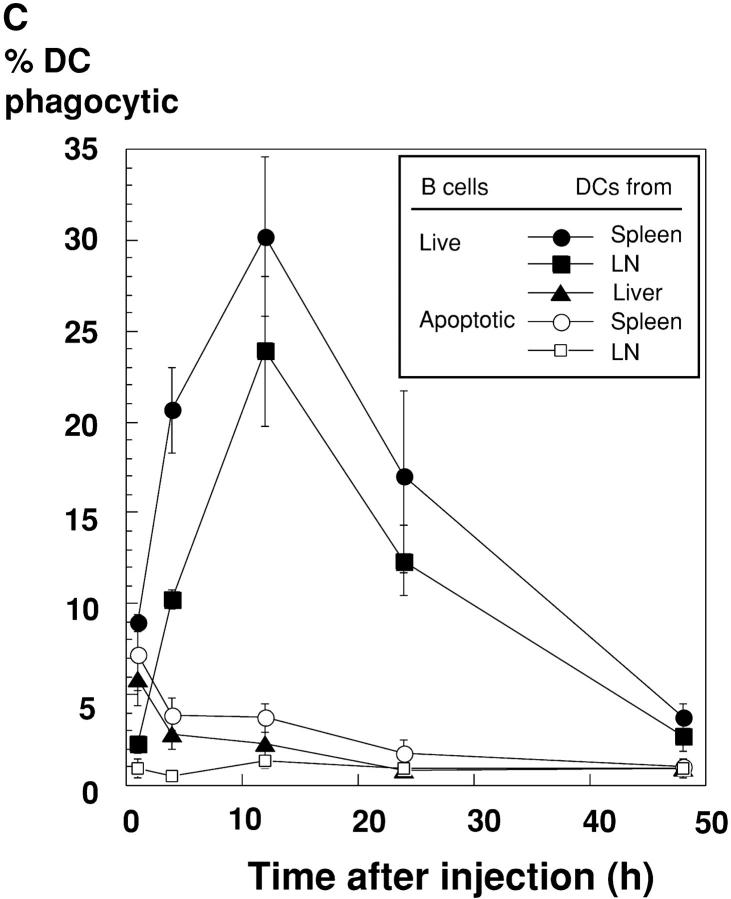
Allogeneic B cells are selectively captured by CD8+ splenic DCs. (A) Dot plots of the low density spleen population 12 h after injecting mice with PBS or 20 × 106 live syngeneic or allogeneic B cells. In the left vertical column, CD11c+ DCs are arrowed and contain CD8+ and CD8− subsets. In the right vertical column, the uptake of allogeneic B cells by CD8+ DCs is evident (black arrowhead), as are some of the injected strongly CFSE-positive living B cells (white arrows). 1.3% of low density cells were phagocytic for allogeneic B cells. (B) Uptake of CFSE-labeled allogeneic B cells by CD8+ DCs from spleen and subcutaneous lymph nodes, and CD11b low liver DCs (reference 23), 12 h after injection. Panels of dot plot showed CD11c+ cells, and phagocytic cells in spleen, lymph nodes, and liver were 4.5, 6.6, and 2.5%, respectively. (C) Kinetics of uptake of allogeneic live B cells, or apoptotic osmotically shocked B cells, by DCs in three organs. Uptake at early time points may result from B cell killing in blood, and at later time points, killing of B cells within lymphoid tissues in which the B cells recirculate. The percentage of phagocytic DCs are shown for CD8+ DCs in spleen and lymph nodes and CD11blow cells in liver.
Selective Uptake of Allogeneic B Cells, Killed by Recipient NK Cells, by CD8+ DCs.
Fig. 2 compares the uptake in vivo of live syngeneic versus allogeneic CFSE-labeled B cells by C57BL/6 splenic DCs. CD43-negative resting B cells were used instead of splenocytes to avoid the induction of graft versus host disease by allogeneic T cells. The injected cells, which labeled at a high level for CFSE (Fig. 2 A, white arrows), carried B cell markers and were abundant in the DC-depleted high density population of spleen (not shown). Fig. 2 A (middle) shows that syngeneic live cells were for the most part ignored, but allogeneic cells were again captured by CD8+ DCs (Fig. 2 B, black arrowhead). Fig. 2 B (arrows) shows that CFSE-labeled allogeneic B cells were captured by the CD8+ subset of DCs in spleen, lymph node, and liver. The kinetics of uptake of CFSE-labeled cells were then followed using both live and apoptotic (osmotic shock) allogeneic B cells. DC uptake of live cells increased with time, so that at 12 h, 20–30% of the splenic and lymph node DCs had strong CFSE labeling (Fig. 2 C, filled symbols). In contrast, if apoptotic cells were injected, the kinetics of uptake were different. The DCs from spleen and liver became labeled within an hour, but labeling was decreased at later time points and no labeling was found in lymph node DCs (Fig. 2 C, open symbols). These findings raised the hypothesis that the allogeneic B cells were being killed before efficient uptake by DCs in all organs through which the B cells were recirculating.
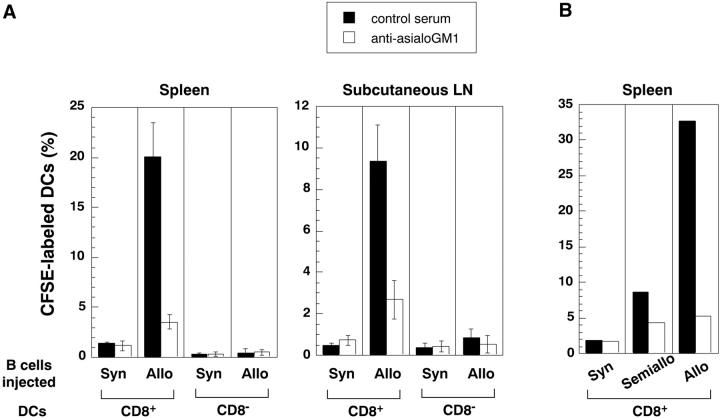
Fossum et al. had years ago described the rapid clearance of allogeneic leukocytes after NK dependent killing in vivo and had visualized uptake of injected cell fragments by DCs in tissue sections through the T cell areas (28). The lytic activity of NK cells is activated by “missing self” (29), as would occur when allogeneic B cells lacking “self MHC” are injected. We tested if treatment of recipient mice with the NK depleting asialoGM antibody (30, 31) would block the uptake of CFSE-labeled allogeneic splenocytes by DCs. The anti-asialoGM antibody did not deplete T cells or B cells, but splenic CD3− NK-1.1+ cells were reduced from 3–4% to <0.1% by this treatment (data not shown). The treatment nullified the capacity of DCs in spleen and lymph node to capture injected allogeneic splenocytes (Fig. 3, A and B) . As expected for NK-mediated killing, semiallogeneic B cells were captured much less efficiently than fully allogeneic ones (Fig. 3 B). Therefore, live allogeneic cells, probably after killing by NK cells, were efficiently phagocytosed by CD8+ DCs; this provided an efficient model to further characterize DCs that take up cell associated antigens in situ.
Figure 3.
Recipient NK cells are required for DCs to take up allogeneic B cells. C57BL6 mice were treated with control antiserum or rabbit anti-asialoGM1, the latter to deplete NK cells (references 30 and 31). Then CSFE-labeled 10 × 106 allogeneic (BALB/C) or syngeneic B cells (A), or 20 × 106 allogeneic (DBA/2) or semiallogeneic (C57BL6 × DBA/2 F1)(B) were injected intravenously 12 h later, low density splenocytes were isolated, stained for CD11c and CD8, and the percentage of CFSE-labeled CD11c+ DC subsets (CD8+ and CD8− determined by FACS®.
Identification of Phagocytic DCs in Sections of Spleen.
We first looked in sections for the injected live, CFSE-labeled allogeneic B cells. Most were found in the B cell areas (follicles) of spleen white pulp and lymph node, as expected (Fig. 4 A). We occasionally detected cells taking up CFSE-labeled cells within numerous macrophages of the marginal zone, but we readily found CFSE-phagosomes within CD11c+ DCs in the T cell areas as well as the red pulp region (Fig. 4, B and C; white arrows). In contrast, when FITC latex was injected, we observed extensive uptake at 1 h into CD8+CD11c+ DCs in the red pulp (Fig. 4, D and E, white arrows), CD169+ (sialoadhesin+) marginal zone metallophil macrophages (Fig. 4 E, white arrowheads), as well as CD169− or low marginal zone macrophages (Fig. 4, D and E; white arrows). By 3 d, FITC-latex remained abundant in the marginal zone phagocytes, but now DCs (CD11c+, not shown) were noted in the T cell areas (Fig. 4 F, arrow). When apoptotic (osmotically shocked) splenocytes were injected, uptake into CD8+ and CD11c+ DCs was prominent in the red pulp (Fig. 4, H and I, white arrows) and also noted in CD169+ macrophages of the marginal zone (Fig. 4, H and I). Therefore, uptake of B cells killed by NK cells in vivo is selectively observed in CD11c+ DCs in situ whereas uptake of cells induced to apoptose ex vivo is extensive in DCs in the red pulp as well as some marginal zone macrophages.
Figure 4.
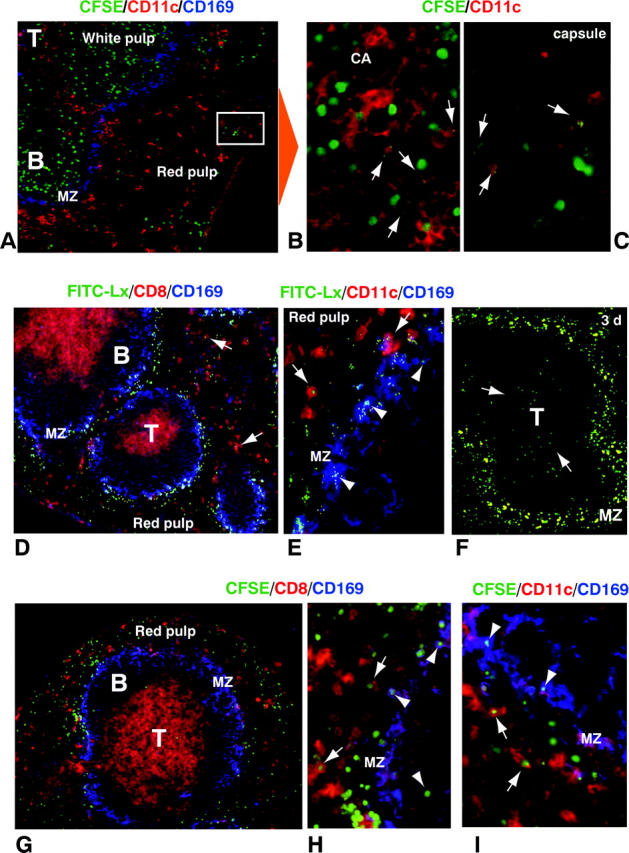
Localization of injected particulates in vivo. (A–C) Sections of spleen were examined 12 h after the injection of CFSE-labeled live allogeneic B cells. In addition to green label from the CFSE-B cells, primarily in the white pulp (A), the sections were stained with CD11c (red DCs) and SER-4/CD169 (blue marginal zone macrophages). B and C are enlarged views of several red CD11c+ DCs that have captured fragments of the injected B cells (arrows) in the white pulp (CA, central artery) and red pulp. (D–F) Sections of spleen 1 h (D and E) and 3 d (F) after injection of FITC-latex, showing strong labeling in marginal zone cells early on (MZ), and by day 3 (arrows), in T cell area DCs. Sections were stained with CD8 (red) and SER-4/CD169 (blue; D) or CD11c (red) and SER-4/CD169 (blue; E). Arrows and arrowheads indicate DCs and marginal zone macrophages engulfing FITC-Lx, respectively. (G and H) Sections of spleen, 1 h after injection of CFSE-labeled apoptotic B cells, were stained with either CD8 (G and H) or CD11c (I; red) in combination with SER-4/CD169 (blue). In contrast with live B cells, very few CFSE-labeled apoptotic cells reached the T area, and most of them were phagocytosed by marginal zone metallophils and red pulp DCs.
CD8+ DCs Also Selectively Take Up Apoptotic Tumor Cells Administered Intravenously.
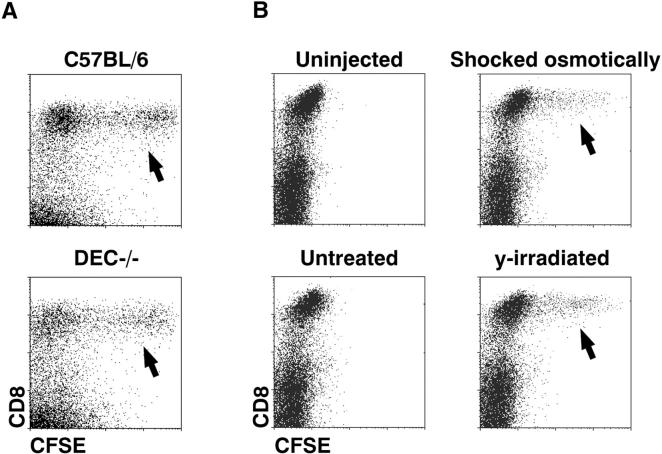
We induced apoptosis of different cell lines either by withdrawing an essential cytokine (nontransformed BaF3 cells; Fig. 5 A), or by applying osmotic shock or high doses (50–300 Gy) of ionizing irradiation (tumorigenic EL-4 cells, Fig. 5 B). The cell lines were then injected intravenously, and recipient spleen cells examined for the capture of CFSE-labeled cells. Again, only the CD8+ DC subset took up the injected cells, and only when cell death had been initiated ex vivo (arrows, Fig. 5 B). As DEC-205 is an endocytic receptor expressed at high levels on CD8+ DCs, we also tested uptake in DEC-205−/− mice. However, no defect was noted in DC phagocytosis in the absence of DEC-205 (Fig. 5 A). In summary, the CD8+ DC subset selectively captures dying cell lines in vivo.
Figure 5.
CFSE-labeled, cell lines and tumor cells are selectively captured by CD8+CD11c+ DCs in vivo. (A) 20 × 106 BaF3 tumor cells, induced to apoptose by 12 h of culture in the absence of IL-3, were injected intravenously; then splenic DCs were examined 2 h later for CFSE-uptake (arrows) as in Fig. 1. The experiments were done in parallel in wild type and DEC-205−/− mice. Phagocytic DCs in the CD11c+ population were 6.3% for C57BL/6 mice and 5.0% in DEC-205−/− mice. (B) 5 × 10⁶ EL-4 thymoma cells, untreated or induced to apoptose by heavy irradiation (50 Gy) or by osmotic shock, were injected intravenously 2 h later, CD11c+ splenocytes were examined for uptake of CFSE-labeled cells (arrows). CSFE-labeled DCs were 0.04% in mice injected with untreated cells, 3.1% after osmotically shocked cells, and 5.15% after irradiated cells.
Single Cell Assays to Verify Formation of MHC–Peptide Complexes from Phagocytosed Dying Cells In Situ.
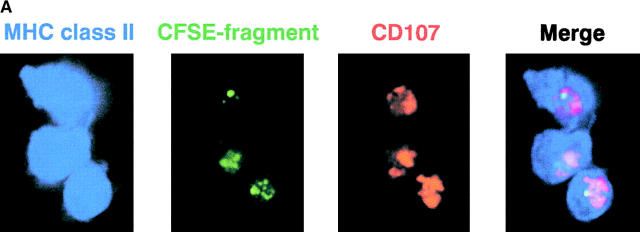
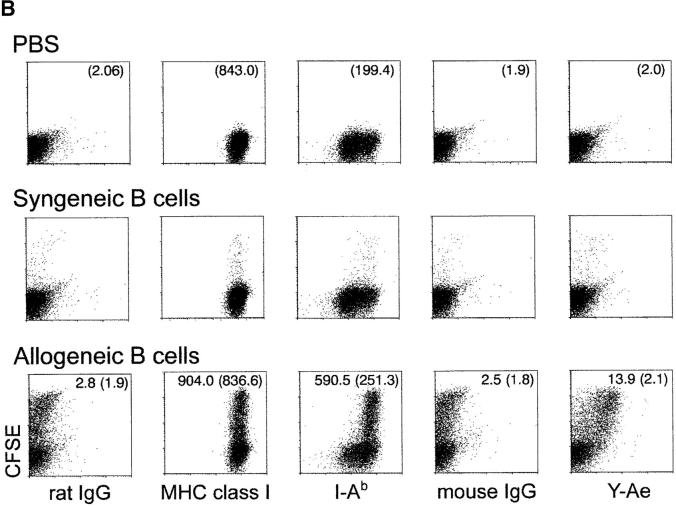
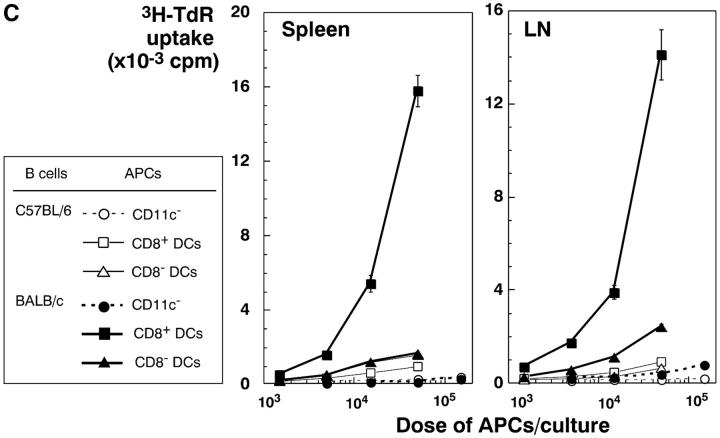
To monitor the processing of cell-associated antigens into MHC–peptide complexes, we extended a prior tissue culture study (14) using the Y-Ae monoclonal antibody that is specific for I-Ab molecules presenting a peptide from another MHC product, I-E (21). In keeping with the prior work (14), CFSE-labeled, allogeneic I-E+ B cells from BALB/c mice were injected into I-Ab C57BL/6 mice. 12 h later, CD8+ and CD11c+ DCs contained most of the phagocytosed CFSE labeled cells in the spleen cell suspension (Fig. 6 A), and virtually all the CFSE-labeled DCs stained for Y-Ae above the background observed with control mouse IgG (Fig. 6 B, right). Y-Ae staining could not be detected in mice given syngeneic B cells or no B cells (Fig. 6 B, right). The phagocytic DCs had higher levels of MHC class II than the nonphagocytic DCs (mean fluorescence index of 590.5 vs. 251.3 in Fig. 6 B, bottom row), but this high MHC class II+ subset was clearly evident in the nonphagocytic DCs from mice given PBS or syngeneic B cells (Fig. 6 B, top and middle rows), suggesting that a subset of MHC class II rich DCs were either selectively phagocytic or were expressing high MHC class II because of continuous processing of dying cells in the steady state. We then evaluated presentation by different subsets of spleen cells of this same I-Ab/I-E peptide complex to CD4+ 1H3 TCR transgenic T cells, which have a similar specificity to the Y-Ae mAb (32). Again CD8+ DCs from either spleen or node selectively presented I-E from dying B cells to MHC class II–restricted CD4+ T cells (Fig. 6 C). Therefore, CD8+ DCs efficiently and selectively process dying allogeneic B cells in situ including for presentation to CD4+ T cells.
Figure 6.
Processing of allogeneic B cells in situ to form MHC class II-peptide complexes. 20 × 106 live allogeneic (BALB/C) I-E+ B cells, or C57BL/6 syngeneic control B cells, were injected intravenously into C57BL/6 mice. (A) In vivo uptake of apoptotic B cells (green) by MHC class II+ (blue) and CD107b+ (red) DCs. Sorted CFSE-labeled cells were placed on coverslips, fixed, and stained with mAbs. (B) Phenotype of CD8+ DCs 12 h after injecting live CFSE labeled allogeneic B cells. Low density spleen cells, gated for both CD11c and CD8 expression, were assessed for CFSE uptake (y-axis) and surface markers (x-axis; see text) including Y-Ae an epitope formed by I-Ab presenting I-E peptide. CFSE-labeled DCs by the injection of syngeneic and allogeneic B cells were 1.38 and 28.1% in CD8+ DCs, respectively. (C) At 12 h after injection of live syngeneic or allogeneic B cells, low density spleen cells were separated into CD11c+ DCs from the cells depleting CD3ε, CD90, Gr-1, and B220-expressing cells with anti-CD11c microbeads. The CD11c+ DCs from spleen and lymph nodes were separated into CD8+ and CD8− subsets by sorting on a FACS Vantage™. Graded doses were added to 2 × 10⁵ CD4+ 1H3 TCR transgenic cells (reference 32) specific for I-Ab presenting I-E peptide, kindly provided by Drs. C. Viret and C. Janeway of Yale Medical School, New Haven, CT. Proliferation ([3H]thymidine uptake) was measured at 27–40 h.
In Vitro, CD8+ DCs Also Selectively Take Up and Present Antigens from Dying Cells.
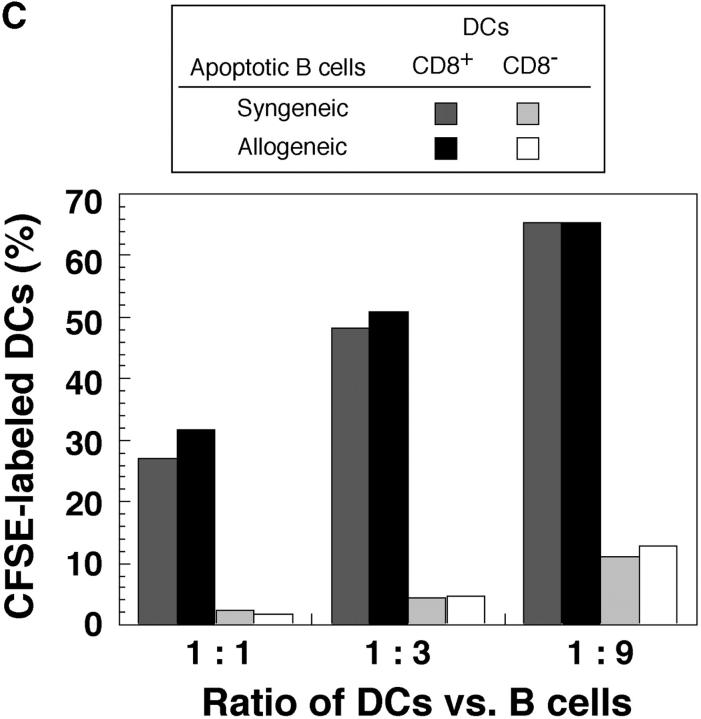
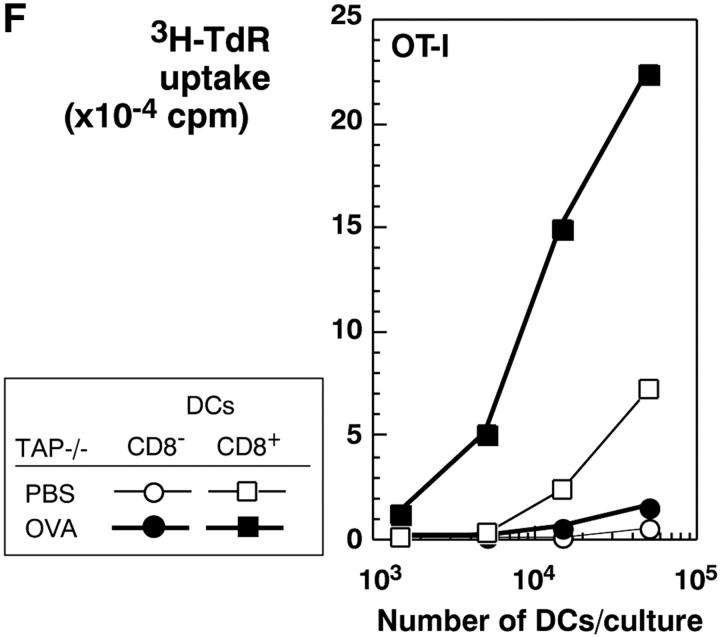
The selective role of CD8+ DCs in the uptake of dying cells could conceivably relate to preferential access of dying cells to this subset in vivo. We therefore performed experiments where apoptotic cells were fed to CD11c+ selected DCs in vitro. Apoptotic syngeneic or allogeneic splenocytes were again efficiently captured by CD8+ DCs, but not by CD8− DCs, from spleen, subcutaneous lymph nodes, and liver (Fig. 7 A). The uptake of apoptotic cells reached a plateau over 4–12 h (Fig. 7 B). The percentage of phagocytic CD8+ DCs increased with increasing numbers of administered B cells, so that 60% of the CD8+ DCs showed phagocytic activity at the highest dose of B cells tested (Fig. 7 C). When we examined the cells by confocal microscopy, the DEC-205+ DCs contained phagosomes with CFSE-labeled fragments (Fig. 7 D), which is very similar to what we observed if we examined DCs that had taken up dying cells in vivo (e.g., Fig. 4, B and C). Both CD8+ and CD8− DCs captured FITC latex in vitro (Fig. 7 E), indicating that CD8− DCs were capable of phagocytic activity. To verify that the selective uptake of dying cells was associated with selective cross presentation of antigen, we fed the DCs splenocytes shocked in the presence of OVA. The CD8+ and CD8− DC subsets were then added to OVA-specific, MHC class I–restricted, OT-I TCR transgenic T cells. The CD8+ DCs were markedly enriched in presenting activity (Fig. 7 F). Therefore CD8+ DCs are specialized to take up and cross present dying cells.
Figure 7.
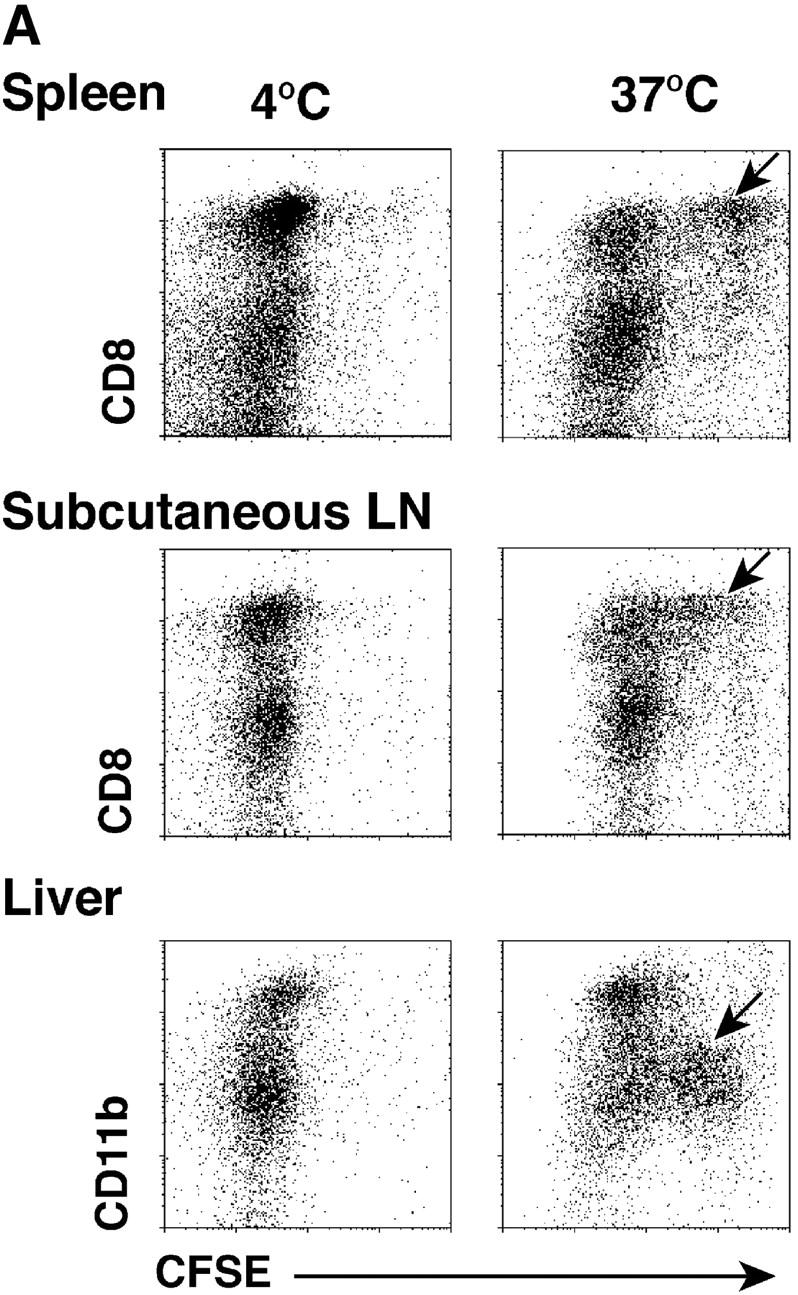
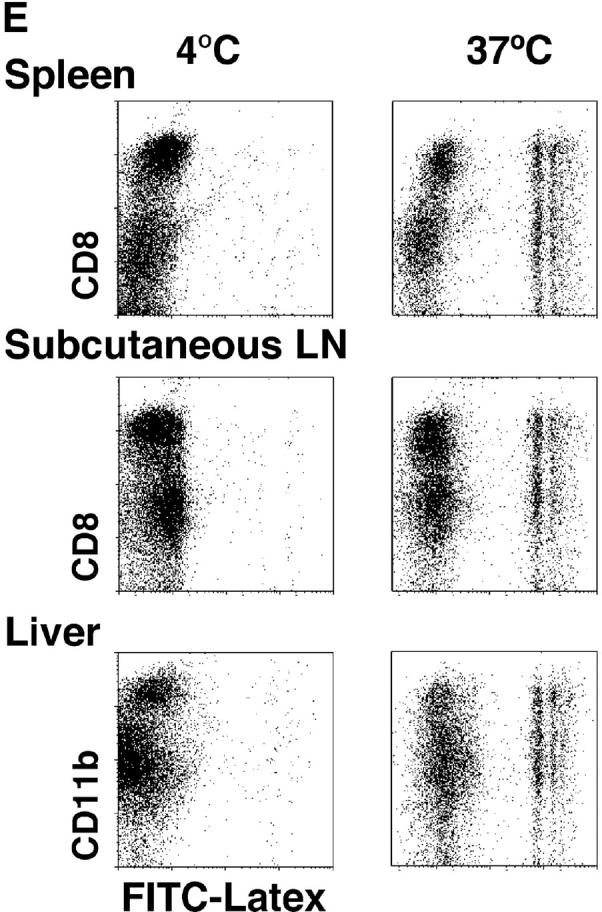
CD8+ DCs selectively capture and present dying cells in vitro. (A) CD11c+ DCs were selected were stained with PE-CD8 for spleen and subcutaneous lymph nodes and PE-CD11b for liver. In flat-bottomed microtest wells, 105 DCs were cocultured with 3 × 10⁵ CFSE-labeled apoptotic (osmotic shock) B cells for 4 h at 4°C or 37°C. Residual B cells were gated from these FACS® plots by CD19 labeling (biotin-CD19 and avidine-CyChrome®). (B) Kinetics of uptake (FACS® assay) of osmotically shocked apoptotic syngeneic and allogeneic B cells by DCs from spleen, subcutaneous lymph nodes, and liver. The percentage of CFSE-labeled DCs were shown in the respective subsets. (C) Effect of increasing dose of B cells on the frequency of DCs phagocytic for apoptotic B cells. CFSE-labeled DCs were assessed 4h after coculture as described in panel A. (D) In vitro uptake of apoptotic B cells (green) by MHC class II+ (blue) and DEC-205+ (red) DCs. (E) Uptake of FITC latex by DCs from the three different tissues we have studied, showing uptake at 37°C (right side of each panel) by both CD8+ and CD8− DCs. The percentage of FITC-Lx− CD8+ and CD8− DCs and FITC-Lx+ CD8+ and CD8− DCs were 33.2, 64.8, 0.7, and 1.3 at 4°C and 28.5, 54.3, 5.3, and 11.9 at 37°C for spleen, 39.4, 52.5, 1.2, and 1.9 at 4°C and 32.7, 46.2, 7.6, and 13.5 at 37°C for subcutaneous lymph nodes, and those of FITC-Lx− CD11b+ and CD11b− DCs and FITC-Lx+CD11b+ and CD11b− DCs were 20.5, 78.0, 0.3, 1.2 at 4°C and 14.1, 60.2, 6.2, and 19.5 at 37°C for liver. (F) Selective presentation by CD8+ DCs of OVA from apoptotic splenocytes. DCs were selected from CD3ε, Gr-1, and B220-negative low density splenocytes sequentially with anti-CD8 and anti-CD11c microbeads® and cultured for 4 h with splenocytes (1 DC:3 spleen cells) loaded with 10 mg/ml OVA during osmotic shock. After the culture, the both subsets of DCs were again stained with FITC-anti-CD11c and anti-FITC microbeads®, and the DCs were selected by MACS columns to avoid contamination of dead cells. Both CD8+ and CD8− subsets were used in graded doses to present antigen to 2 × 10⁵ purified OT-I T cells in flat bottomed microtest wells. [3H]thymidine uptake was measured at 38–50 h.
In Vivo, CD8+ DCs Selectively Capture Antigens from Dying Cells for Presentation on Both MHC Class I and II Products.
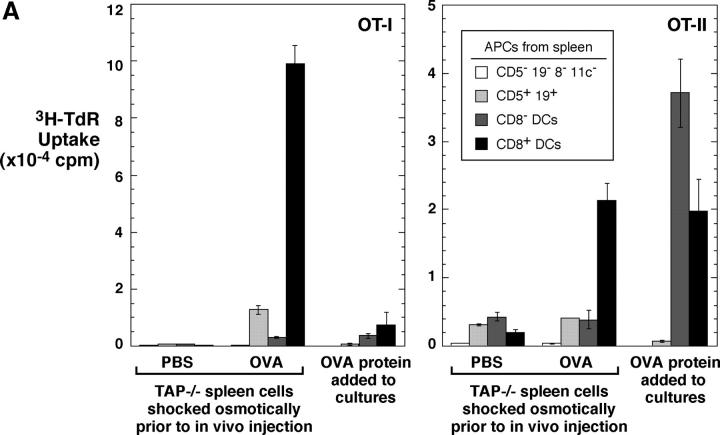
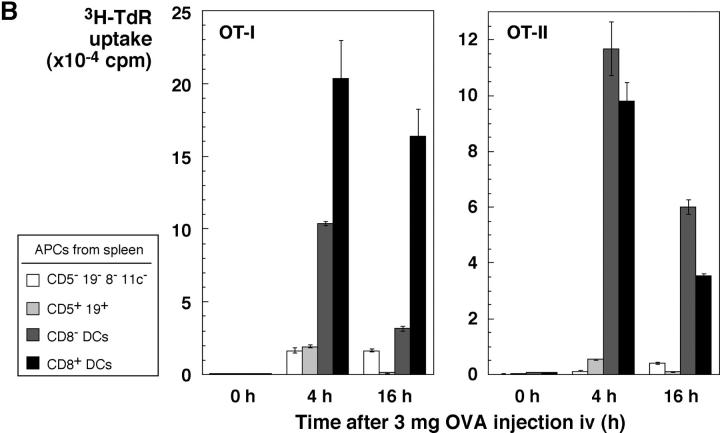
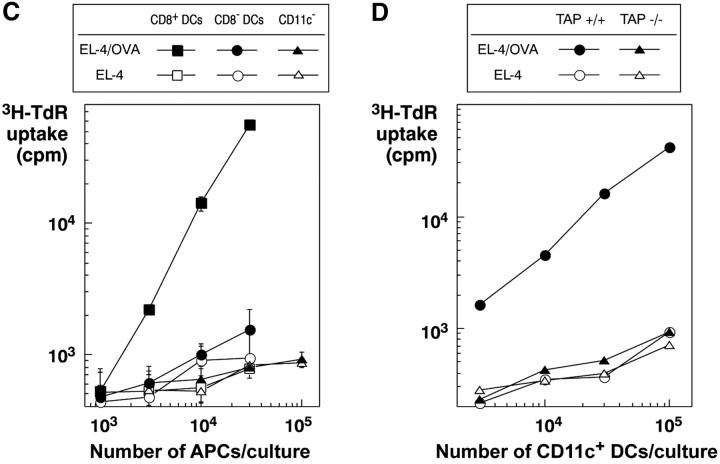
It has been reported that CD8+ DCs in vivo selectively cross present OVA to OT-I T cells (19). Our findings suggest that this reflects selective uptake of dying OVA-bearing splenocytes, rather than selective cross presenting function after uptake. To evaluate this, we injected OVA-shocked splenocytes, isolated CD8+ and CD8− DCs (as well as lymphocytes), and tested if the APCs would stimulate OT-I and also MHC class II–restricted OT-II T cells. In fact, the CD8+ DCs selectively presented cell-associated OVA to both CD8+ and CD4+ T cells (Fig. 8 A). As a positive control for the antigen-capturing activity of CD8− DCs, we tested for presentation of soluble OVA protein added to DC–T cell cocultures. Both CD8+ and CD8− DCs presented protein to MHC class II–restricted, OT-II transgenic T cells but the presentation to OT-I was weak, as expected for antigens administered in relatively low doses as a soluble protein (Fig. 8 A, right part of each panel). To determine if OVA protein injected in vivo could be presented by both CD8+ and CD8− DCs, we used a high dose, 3 mg, intravenously. Both DC subsets were able to stimulate MHC class I and class II–restricted T cells (Fig. 8 B). We conclude that CD8+ DCs selectively present antigens from dying cells on both MHC class I and II products because of their selective endocytic capacity for dying cells, but that CD8− DCs have the capacity to present the same protein when taken up by other endocytic routes.
Figure 8.
CD8+ DCs selectively capture dying cells in vivo for presentation on MHC class I and II products. (A) OVA presentation from TAP−/− splenocytes, osmotically shocked in PBS or 10 mg/ml OVA (x-axis) before injecting 20 × 106 cells intravenously per mouse. 4 h later, spleen cell suspensions were prepared and DCs partially enriched by flotation in dense BSA solution (reference 22). Subsets of APCs were isolated by the following sequence using antibody-coated magnetic beads: mixtures of CD5+ and CD19+ cells (B and T), CD8+ cells (DCs), and CD11c+ cells (CD8− DCs). Cells were added in graded doses to 2 × 10⁵ purified OT-I or OT-II cells in flat-bottomed microtest wells. Proliferation was measured at 38–50 h, with the data shown for the top dose of APCs (3 × 10⁴ for DCs and 2.5 × 10⁵ for lymphocytes). In parallel, cells from the PBS-injected mice were also used to present OVA protein, at a dose of 30 μg/ml continuously in the DC–T cell cocultures. (B) Both CD8+ and CD8− DCs can present soluble OVA via the exogenous pathway to MHC class I. Mice were injected intravenously with 3 mg of OVA protein. At the indicated times, subsets of APCs were isolated as in panel A and used (104 DCs and 3 × 10⁵ lymphocytes) to stimulate OT-I (1.4 × 10⁵) and OT-II (2 × 10⁵) cells. [3H]thymidine uptake was measured at 38–50 h. (C) 20 × 106 EL-4 thymoma cells loaded with OVA with 10 mg/ml OVA during osmotic shock were injected. CD8+ and CD8− CD11c+ DCs and CD11c− cells were prepared by MACS columns 8 h later and cultured with 2 × 10⁵ OT-I T cells in 96-well flat bottomed microtest plates in triplicates. 3H-TdR uptake between 36–48 h was measured. Control mice were injected EL-4 cells treated by the same way in the absence of OVA. Purities of CD8+ and CD8− DCs from the mice injected with OVA-loaded EL-4 cells were 91.4 and 90.3%, respectively. (D) TAP-dependent presentation of OVA by DCs to specific CD8+ OT-I T cells. CD11c+ DCs were obtained from the TAP−/− and littermate control mice that had been injected intravenously with 15 × 106 OVA-loaded or unloaded EL-4 cells 7.5 h before. Graded doses of DCs were cultured with 1 × 10⁵ OT-I T cells in round-bottomed microculture plates for 48 h. 3H-TdR uptake for the last 8 h was determined.
Expression of mRNA for Different Candidate Receptors for Dying Cells.
A number of receptors have been implicated in the uptake of dying cells (33, 34), so we used RT-PCR to search for these in CD8+ and CD8− DCs as well as peritoneal macrophages. Two of these receptors, SR-AI and C1qR, were restricted to macrophages, whereas others (phosphatidyl serine receptor, β5A and B integrins, SR-BI, CD14, CD68) were found in all three cell types. SR-AII, αv, β3, mDC-SIGN, and CD23 were all more abundant in CD8− versus CD8+ DCs. Only CD36 was more abundant in CD8+ versus CD8− DCs. Therefore this preliminary analysis only identified CD36 as a possible receptor that selectively guides dying cells to one DC subset, but further analyses are required.
Discussion
We have followed the uptake of dying cells in vivo, an event that may be critical for the presentation of cell associated antigens in many clinical settings. We find that DCs endocytose dying cells, by directly monitoring the capture of fluorescein-labeled lymphocytes and various cell lines. Uptake however takes place primarily in the CD8+ subset of DCs. Likewise, when experiments are performed in vitro under more easily controlled conditions, the majority of the CD8+ DCs selectively express phagocytic activity for dying cells. We also find that the selective presenting activity of CD8+ DCs extends to both MHC class I and II products, whereas both CD8+ and CD8− DC subsets are able to present soluble protein captured in vivo on MHC class I and II. These results likely explain the fact that CD8+ DCs selectively cross present cell-associated antigens (19; Fig. 8). Our findings provide a means for experimentally loading DCs in situ with antigens derived from self, allogeneic, or malignant cells (Figs. 1–5).
The capacity of CD8+ DCs to take up dying cells is efficient. In the case of allogeneic B cells as substrate, a substantial proportion of the DCs can be directly visualized with phagocytosed dying cells by FACS® and by immunofluorescence microscopy in section (Fig. 4 B). If DCs are isolated after uptake of dying cells in vivo (not shown) or in vitro (Fig. 7 D), the cells contain several intracellular CFSE-labeled phagosomes. Furthermore, most of the phagocytic DCs can be shown to be forming MHC–peptide complexes after processing of a membrane protein from the dying cells (Fig. 6 B). Uptake of osmotically shocked cells is also readily observed in DCs in splenic red pulp, and by some macrophages in the marginal zone of tissue sections of spleen (Fig. 4, G–I), as long as one looks within 1 h after injection of the apoptotic cells. However, sialoadhesin+ (CD169+) large phagocytic cells are difficult to liberate into a cell suspension. In contrast, marginal zone and red pulp macrophages do not appear to participate in the clearance of live allogeneic B cells, killed by NK cells (Fig. 4, A–C).
A number of functional differences have been reported in the function of CD8+ and CD8− DCs from mice. Shortman et al. first noted that CD8+ DCs are less active in inducing T cell proliferation and cytokine production (35–37). In contrast, when DC subsets are pulsed with antigen and matured ex vivo, and then reinjected into mice, CD8+ DCs preferentially stimulate strong Th1 responses (38, 39). This paper describes a new functional distinction of the CD8+ subset that can be documented in situ and in culture. These DCs selectively take up dying cells under several conditions. The first are syngeneic splenocytes rendered apoptotic by osmotic shock before injection, a procedure commonly used to study delivery of cell-associated proteins into mice (16–18). The second are intact allogeneic cells that are likely killed in vivo by asialoGM1+ NK cells. The third are cell lines and tumor cells induced to apoptose by various means. The highest frequencies of phagocytic CD8+ DCs in vivo are observed with allogeneic cells, with 20–30% of the DCs showing uptake of the injected CFSE-labeled allogeneic B cells. These findings with CD8+ DCs in mice parallel the findings of Huang et al. who have reported that the subset of CD4− DCs in rat mesenteric lymph selectively carries apoptotic fragments of intestinal epithelial cells (40). CD8 is not expressed by rat DCs, but the phagocytic CD8+ mouse DCs are CD4− (while CD8− DCs are to a major extent CD4+ [26]), paralleling the data of Huang et al.
We suspect that the selective capacity of CD8+ DCs to cross present dying cells on MHC class I is controlled primarily at the level of specific endocytic receptors, rather than subsequent processing. Both subsets of DCs were able to present soluble OVA to MHC class I–restricted T cells (Fig. 8 B), which is distinct from the report of Pooley et al. (41). They found that CD8+ DCs selectively presented soluble OVA on MHC class I, while CD8− DCs present OVA on MHC class II. Perhaps there are quantitative differences that we were unable to detect with our particular preparation of OVA; also we did not add IL-2 to our T cell assays. CD8− DCs do have phagocytic activity, as we confirmed that both CD8+ and CD8− DCs take up FITC latex (20). CD8+ DCs also selective take up and present dying cells in vitro, where access of particles to both CD8+CD8− DCs is ensured. Therefore CD8− DCs are phagocytic and can present antigens on both MHC class I and II; however, this DC subset seems to ignore dying cells. We hypothesize that CD8+ DCs selectively express a receptor for apoptotic cells. This receptor is not the DEC-205 receptor, at least exclusively. DEC-205 is abundant on CD8+ DCs (26, 27), but DEC-205 knockout mice are comparably efficient to wild-type in taking up injected cells (Fig. 5). An analysis of mRNA expression for several candidate phagocytic receptors for dying cells (33, 34) only identified CD36 as being expressed more abundantly in CD8+ DCs. Most other receptors were expressed similarly in both DC subsets, or were more abundant in CD8− DCs (Fig. 9) .
Figure 9.
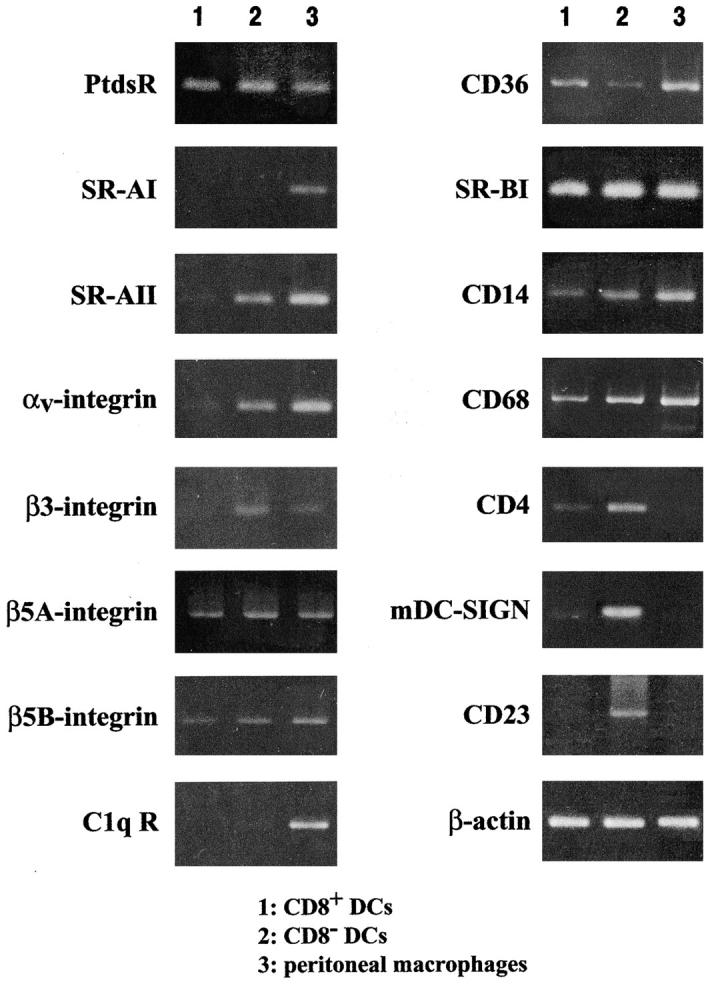
RT-PCR analysis for the expression of receptors that may be involved in engulfment of dying cells. Purified DC subsets from spleen, obtained by FACS®-sorting, were subject to the assay and compared with peritoneal macrophages.
It is of interest that several DC subsets are proving to have distinct receptors for endocytosis. These include BDCA-2 on plasmacytoid DCs (42), Langerin on Langerhans cells (43), DC-SIGN (44) and asialoglycoprotein receptor on monocyte-derived DCs (45). This may allow subsets of DCs to present select antigens and microbes; in addition these subsets can express distinct toll-like receptors (46, 47). The selective uptake of dying cells, which is evident in vivo and at the single cell level, represents one of the most dramatic known differences in the function of CD8+ and CD8− DC subsets in mouse spleen and lymph node.
It is proposed (48–50) that the uptake of antigens by immature DCs in the steady-state will lead to the induction of tolerance to those peptides that are successfully presented, whereas maturation stimuli are required to make DCs immunogenic for effector and memory cell formation. Evidence for this has recently been obtained in studies of the presentation of an antigenic peptide delivered selectively to DCs in situ via a monoclonal anti–DEC-205 antibody (49). There is evidence that certain necrotic cells, but not apoptotic cells, are able to induce maturation of DCs in culture (51, 52), with the release of heat shock proteins being a relevant stimulus (53, 54). Experiments to test the tolerizing and immunizing properties of cell-associated antigens, injected under steady-state and DC maturation conditions, are underway using the methods described here to facilitate the uptake of dying cells by DCs in situ.
Acknowledgments
This work was performed through Special Coordination Funds for Promoting Science and Technology from the Ministry of Education, Culture, Sports, Science and Technology, the Japanese Government, and also in part by Grant-in-Aid for Scientific Research on Priority Areas (A-13037019, B-13140202, and C-13218063, 13226053). R.M. Steinman is supported by National Institutes of Health grants AI 13013 and CA 84512.
Footnotes
Abbreviations used in this paper: CFSE, carboxyfluorescein succinimidyl ester; DC, dendritic cell; RT, reverse transcription.
References
- 1.Regnault, A., D. Lankar, V. Lacabanne, A. Rodriguez, C. Thery, M. Rescigno, T. Saito, S. Verbeek, C. Bonnerot, P. Ricciardi-Castagnoli, and S. Amigorena. 1999. Fcγ receptor-mediated induction of dendritic cell maturation and major histocompatibility complex class I-restricted antigen presentation after immune complex internalization. J. Exp. Med. 189:371–380. [DOI] [PMC free article] [PubMed] [Google Scholar]
- 2.Rodriguez, A., A. Regnault, M. Kleijmeer, P. Ricciardi-Castagnoli, and S. Amigorena. 1999. Selective transport of internalized antigens to the cytosol for MHC class I presentation in dendritic cells. Nat. Cell Biol. 1:362–368. [DOI] [PubMed] [Google Scholar]
- 3.Dhodapkar, K.M., J. Krasovsky, B. Williamson, and M.V. Dhodapkar. 2002. Anti-tumor monoclonal antibodies enhance cross-presentation of cellular antigens and the generation of myeloma-specific killer T cells by dendritic cells. J. Exp. Med. 195:125–133. [DOI] [PMC free article] [PubMed] [Google Scholar]
- 4.Castellino, F., P.E. Boucher, K. Eichelberg, M. Mayhew, J.E. Rothman, A.N. Houghton, and R.N. Germain. 2000. Receptor-mediated uptake of antigen/heat shock protein complexes results in Major Histocompatibility Complex class I antigen presentation via two distinct processing pathways. J. Exp. Med. 191:1957–1964. [DOI] [PMC free article] [PubMed] [Google Scholar]
- 5.Singh-Jasuja, H., R.E. Toes, P. Spee, C. Munz, N. Hilf, S.P. Schoenberger, P. Ricciardi-Castagnoli, J. Neefjes, H.G. Rammensee, D. Arnold-Schild, and H. Schild. 2000. Cross-presentation of glycoprotein 96-associated antigens on major histocompatibility complex class I molecules requires receptor-mediated endocytosis. J. Exp. Med. 191:1965–1974. [DOI] [PMC free article] [PubMed] [Google Scholar]
- 6.Basu, S., R.J. Binder, T. Ramalingam, and P.K. Srivastava. 2001. CD91 is a common receptor for heat shock proteins gp96, hsp90, hsp70, and calreticulin. Immunity. 14:303–313. [DOI] [PubMed] [Google Scholar]
- 7.Svensson, M., B. Stockinger, and M.J. Wick. 1997. Bone marrow-derived dendritic cells can process bacteria for MHC-I and MHC-II presentation to T cells. J. Immunol. 158:4229–4236. [PubMed] [Google Scholar]
- 8.Albert, M.L., B. Sauter, and N. Bhardwaj. 1998. Dendritic cells acquire antigen from apoptotic cells and induce class I-restricted CTLs. Nature. 392:86–89. [DOI] [PubMed] [Google Scholar]
- 9.Albert, M.L., S.F.A. Pearce, L.M. Francisco, B. Sauter, P. Roy, R.L. Silverstein, and N. Bhardwaj. 1998. Immature dendritic cells phagocytose apoptotic cells via αvβ5 and CD36, and cross-present antigens to cytotoxic T lymphocytes. J. Exp. Med. 188:1359–1368. [DOI] [PMC free article] [PubMed] [Google Scholar]
- 10.Yrlid, U., and M.J. Wick. 2000. Salmonella-induced apoptosis of infected macrophages results in presentation of a bacteria-encoded antigen after uptake by bystander dendritic cells. J. Exp. Med. 191:613–623. [DOI] [PMC free article] [PubMed] [Google Scholar]
- 11.Subklewe, M., C. Paludan, M.L. Tsang, R.M. Steinman, and C. Münz. 2001. Dendritic cells cross-present latency gene products from Epstein-Barr Virus-transformed B cells and expand tumor-reactive CD8+ killer T cells. J. Exp. Med. 193:405–412. [DOI] [PMC free article] [PubMed] [Google Scholar]
- 12.Liu, T., B. Chambers, A.D. Diehl, L. Van Kaer, M. Jondal, and H.-G. Ljunggren. 1997. TAP peptide transporter-independent presentation of heat-killed sendai virus antigen on MHC class I molecules by splenic antigen-presenting cells. J. Immunol. 159:5364–5371. [PubMed] [Google Scholar]
- 13.Motta, I., F. Andre, A. Lim, J. Tartaglia, W.I. Cox, L. Zitvogel, E. Angevin, and P. Kourilsky. 2001. Cross-presentation by dendritic cells of tumor antigen expressed in apoptotic recombinant canarypox virus-infected dendritic cells. J. Immunol. 167:1795–1802. [DOI] [PubMed] [Google Scholar]
- 14.Inaba, K., S. Turley, F. Yamaide, T. Iyoda, K. Mahnke, M. Inaba, M. Pack, M. Subklewe, B. Sauter, D. Sheff, et al. 1998. Efficient presentation of phagocytosed cellular fragments on the MHC class II products of dendritic cells. J. Exp. Med. 188:2163–2173. [DOI] [PMC free article] [PubMed] [Google Scholar]
- 15.Munz, C., K.L. Bickham, M. Subklewe, M.L. Tsang, A. Chahroudi, M.G. Kurilla, D. Zhang, M. O'Donnell, and R.M. Steinman. 2000. Human CD4+ T lymphocytes consistently respond to the latent Epstein-Barr Virus nuclear antigen EBNA1. J. Exp. Med. 191:1649–1660. [DOI] [PMC free article] [PubMed] [Google Scholar]
- 16.Moore, M.W., F.R. Carbone, and M.J. Bevan. 1988. Introduction of soluble protein into the class I pathway of antigen processing and presentation. Cell. 54:777–785. [DOI] [PubMed] [Google Scholar]
- 17.Carbone, F.R., M.W. Moore, J.M. Sheil, and M.J. Bevan. 1988. Induction of cytotoxic T lymphocytes by primary in vitro stimulation with peptides. J. Exp. Med. 167:1767–1779. [DOI] [PMC free article] [PubMed] [Google Scholar]
- 18.Carbone, F.R., and M.J. Bevan. 1990. Class I–restricted processing and presentation of exogenous cell-associated antigen in vivo. J. Exp. Med. 171:377–387. [DOI] [PMC free article] [PubMed] [Google Scholar]
- 19.den Haan, J., S. Lehar, and M. Bevan. 2000. CD8+ but not CD8− dendritic cells cross-prime cytotoxic T cells in vivo. J. Exp. Med. 192:1685–1696. [DOI] [PMC free article] [PubMed] [Google Scholar]
- 20.Kamath, A.T., J. Pooley, M.A. O'Keeffe, D. Vremec, Y. Zhan, A. Lew, A. D'Amico, L. Wu, D.F. Tough, and K.S. Shortman. 2000. The development, maturation, and turnover rate of mouse spleen dendritic cell populations. J. Immunol. 165:6762–6770. [DOI] [PubMed] [Google Scholar]
- 21.Murphy, D.B., S. Rath, E. Pizzo, A.Y. Rudensky, A. George, J.K. Larson, and C.A. Janeway, Jr. 1992. Monoclonal antibody detection of a major self peptide. J. Immunol. 148:3483–3491. [PubMed] [Google Scholar]
- 22.Crowley, M., K. Inaba, M. Witmer-Pack, and R.M. Steinman. 1989. The cell surface of mouse dendritic cells: FACS analyses of dendritic cells from different tissues including thymus. Cell. Immunol. 118:108–125. [DOI] [PubMed] [Google Scholar]
- 23.O'Connell, P.J., A.E. Morelli, A.J. Logar, and A.W. Thomson. 2000. Phenotypic and functional characterization of mouse hepatic CD8α+ lymphoid-related dendritic cells. J. Immunol. 165:795–803. [DOI] [PubMed] [Google Scholar]
- 24.Inaba, K., M. Inaba, N. Romani, H. Aya, M. Deguchi, S. Ikehara, S. Muramatsu, and R.M. Steinman. 1992. Generation of large numbers of dendritic cells from mouse bone marrow cultures supplemented with granulocyte/macrophage colony-stimulating factor. J. Exp. Med. 176:1693–1702. [DOI] [PMC free article] [PubMed] [Google Scholar]
- 25.Breel, M., R.E. Mebius, and G. Kraal. 1987. Dendritic cells of the mouse recognized by two monoclonal antibodies. Eur. J. Immunol. 17:1555–1559. [DOI] [PubMed] [Google Scholar]
- 26.Vremec, D., J. Pooley, H. Hochrein, L. Wu, and K. Shortman. 2000. CD4 and CD8 expression by dendritic cell subtypes in mouse thymus and spleen. J. Immunol. 164:2978–2986. [DOI] [PubMed] [Google Scholar]
- 27.Inaba, K., M. Pack, M. Inaba, H. Sakuta, F. Isdell, and R.M. Steinman. 1997. High levels of a major histocompatibility complex II - self peptide complex on dendritic cells from lymph node. J. Exp. Med. 186:665–672. [DOI] [PMC free article] [PubMed] [Google Scholar]
- 28.Fossum, S., and B. Rolstad. 1986. The roles of interdigitating cells and natural killer cells in the rapid rejection of allogeneic lymphocytes. Eur. J. Immunol. 16:440–450. [DOI] [PubMed] [Google Scholar]
- 29.Ljunggren, H.G., and K. Karre. 1990. In search of the ‘missing self’: MHC molecules and NK cell recognition. Immunol. Today. 11:237–244. [DOI] [PubMed] [Google Scholar]
- 30.Barry, T.S., D.M. Jones, C.B. Richter, and B.F. Haynes. 1991. Successful engraftment of human postnatal thymus in severe combined immune deficient (SCID) mice: differential engraftment of thymic components with irradiation versus anti-asialo GM-1 immunosuppressive regimens. J. Exp. Med. 173:167–180. [DOI] [PMC free article] [PubMed] [Google Scholar]
- 31.Ishikawa, H., H. Hisaeda, M. Taniguchi, T. Nakayama, T. Sakai, Y. Maekawa, Y. Nakano, M. Zhang, T. Zhang, M. Nishitani, et al. 2000. CD4+ Vα14 NKT cells play a crucial role in an early stage of protective immunity against infection with Leishmania major. Int. Immunol. 12:1267–1274. [DOI] [PubMed] [Google Scholar]
- 32.Viret, C., D.B. Sant'Angelo, X. He, H. Ramaswamy, and C.A. Janeway, Jr. 2001. A role for accessibility to self-peptide-self-MHC complexes in intrathymic negative selection. J. Immunol. 166:4429–4437. [DOI] [PubMed] [Google Scholar]
- 33.Hoffmann, P.R., A.M. deCathelineau, C.A. Ogden, Y. Leverrier, D.L. Bratton, D.L. Daleke, A.J. Ridley, V.A. Fadok, and P.M. Henson. 2001. Phosphatidylserine (PS) induces PS receptor-mediated macropinocytosis and promotes clearance of apoptotic cells. J. Cell Biol. 155:649–660. [DOI] [PMC free article] [PubMed] [Google Scholar]
- 34.Platt, N., and R. Haworth. 1999. Scavenger receptors and phagocytosis of bacteria and apoptotic cells. Phagocytosis: The Host. S. Gordon, editor. JAI Press Inc., Stanford, CT. 71–85.
- 35.Vremec, D., M. Zorbas, R. Scollay, D.J. Saunders, C.F. Ardavin, L. Wu, and K. Shortman. 1992. The surface phenotype of dendritic cells purified from mouse thymus and spleen: investigation of the CD8 expression by a subpopulation of dendritic cells. J. Exp. Med. 176:47–58. [DOI] [PMC free article] [PubMed] [Google Scholar]
- 36.Kronin, V., K. Winkel, G. Suss, A. Kelso, W. Heath, J. Kirberg, H. von Boehmer, and K. Shortman. 1996. A subclass of dendritic cells regulates the response of naive CD8 T cells by limiting their IL-2 production. J. Immunol. 157:3819–3827. [PubMed] [Google Scholar]
- 37.Kronin, V., C.J. Fitzmaurice, I. Caminschi, K. Shortman, D.C. Jackson, and L.E. Brown. 2001. Differential effect of CD8+ and CD8− dendritic cells in the stimulation of secondary CD4+ T cells. Int. Immunol. 13:465–473. [DOI] [PubMed] [Google Scholar]
- 38.Maldonado-Lopez, R., T. De Smedt, P. Michel, J. Godfroid, B. Pajak, C. Heirman, K. Thielemans, O. Leo, J. Urbain, and M. Moser. 1999. CD8α1 and CD8α− subclasses of dendritic cells direct the development of distinct T helper cells in vivo. J. Exp. Med. 189:587–592. [DOI] [PMC free article] [PubMed] [Google Scholar]
- 39.Pulendran, B., J.L. Smith, G. Caspary, K. Brasel, D. Pettit, E. Maraskovsky, and C. Maliszweski. 1999. Distinct dendritic cell subsets differentially regulate the class of immune responses in vivo. Proc. Natl. Acad. Sci. USA. 96:1036–1041. [DOI] [PMC free article] [PubMed] [Google Scholar]
- 40.Huang, F.-P., N. Platt, M. Wykes, J.R. Major, T.J. Powell, C.D. Jenkins, and G.G. MacPherson. 2000. A discrete subpopulation of dendritic cells transports apoptotic intestinal epithelial cells to T cell areas of mesenteric lymph nodes. J. Exp. Med. 191:435–442. [DOI] [PMC free article] [PubMed] [Google Scholar]
- 41.Pooley, J.L., W.R. Heath, and K. Shortman. 2001. Intravenous soluble antigen is presented to CD4 T cells by CD8− dendritic cells, but cross-presented to CD8 T cells by CD8+ dendritic cells. J. Immunol. 166:5327–5330. [DOI] [PubMed] [Google Scholar]
- 42.Dzionek, A., Y. Sohma, J. Nagafune, M. Cella, M. Colonna, F. Facchetti, G. Günther, I. Johnston, A. Lanzavecchia, T. Nagasaka, et al. 2001. BDCA-2, a novel plasmacytoid dendritic cell-specific type II C-type lectin, mediates antigen-capture and is a potent inhibitor of interferon-α/β induction. J. Exp. Med. 194:1823–1834. [DOI] [PMC free article] [PubMed] [Google Scholar]
- 43.Valladeau, J., O. Ravel, C. Dezutter-Dambuyant, K. Moore, M. Kleijmeer, Y. Liu, V. Duvert-Frances, C. Vincent, D. Schmitt, J. Davoust, et al. 2000. Langerin, a novel C-type lectin specific to Langerhans cells, is an endocytic receptor that induces the formation of Birbeck granules. Immunity. 12:71–81. [DOI] [PubMed] [Google Scholar]
- 44.Engering, A., T.B. Geijtenbeek, S.J. van Vliet, M. Wijers, E. van Liempt, N. Demaurex, A. Lanzavecchia, J. Fransen, C.G. Figdor, V. Piguet, and Y. van Kooyk. 2002. The dendritic cell-specific adhesion receptor DC-SIGN internalizes antigen for presentation to T cells. J. Immunol. 168:2118–2126. [DOI] [PubMed] [Google Scholar]
- 45.Valladeau, J., V. Duvert-Frances, J.-J. Pin, M.J. Kleijmeer, S. Ait-Yahia, O. Ravel, C. Vincent, F. Vega, Jr., A. Helms, D. Gorman, et al. 2001. Immature human dendritic cells express asialoglycoprotein receptor isoforms for efficient receptor-mediated endocytosis. J. Immunol. 167:5767–5774. [DOI] [PubMed] [Google Scholar]
- 46.Kadowaki, N., S. Ho, S. Antonenko, R. de Waal Malefyt, R.A. Kastelein, F. Bazan, and Y.-J. Liu. 2001. Subsets of human dendritic cell precursors express different toll-like receptors and respond to different microbial antigens. J. Exp. Med. 194:863–870. [DOI] [PMC free article] [PubMed] [Google Scholar]
- 47.Krug, A., A. Towarowski, S. Britsch, S. Rothenfusser, V. Hornung, R. Bals, T. Giese, H. Engelmann, S. Endres, A.M. Krieg, and G. Hartmann. 2001. Toll-like receptor expression reveals CpG DNA as a unique microbial stimulus for plasmacytoid dendritic cells which synergizes with CD40 ligand to induce high amounts of IL-12. Eur. J. Immunol. 31:3026–3037. [DOI] [PubMed] [Google Scholar]
- 48.Steinman, R.M., S. Turley, I. Mellman, and K. Inaba. 2000. The induction of tolerance by dendritic cells that have captured apoptotic cells. J. Exp. Med. 191:411–416. [DOI] [PMC free article] [PubMed] [Google Scholar]
- 49.Hawiger, D., K. Inaba, Y. Dorsett, K. Guo, K. Mahnke, M. Rivera, J.V. Ravetch, R.M. Steinman, and M.C. Nussenzweig. 2001. Dendritic cells induce peripheral T cell unresponsiveness under steady state conditions in vivo. J. Exp. Med. 194:769–780. [DOI] [PMC free article] [PubMed] [Google Scholar]
- 50.Steinman, R.M., and M.C. Nussenzweig. 2002. Avoiding horror autotoxicus: the importance of dendritic cells in peripheral T cell tolerance. Proc. Natl. Acad. Sci. USA. 99:351–358. [DOI] [PMC free article] [PubMed] [Google Scholar]
- 51.Sauter, B., M.L. Albert, L. Francisco, M. Larsson, S. Somersan, and N. Bhardwaj. 2000. Consequences of cell death. Exposure to necrotic tumor cells, but not primary tissue cells or apoptotic cells, induces the maturation of immunostimulatory dendritic cells. J. Exp. Med. 191:423–434. [DOI] [PMC free article] [PubMed] [Google Scholar]
- 52.Gallucci, S., M. Lolkema, and P. Matzinger. 1999. Natural adjuvants: endogenous activators of dendritic cells. Nat. Med. 5:1249–1255. [DOI] [PubMed] [Google Scholar]
- 53.Basu, S., R. Binder, R. Suto, K. Anderson, and P. Srivastava. 2000. Necrotic but not apoptotic cell death releases heat shock proteins, which deliver a partial maturation signal to dendritic cells and activate the NF-κB pathway. Int. Immunol. 12:1539–1546. [DOI] [PubMed] [Google Scholar]
- 54.Somersan, S., M. Larsson, J.F. Fonteneau, S. Basu, P. Srivastava, and N. Bhardwaj. 2001. Primary tumor tissue lysates are enriched in heat shock proteins and induce the maturation of human dendritic cells. J. Immunol. 167:4844–4852. [DOI] [PubMed] [Google Scholar]


