

Abstract
The migration of antigen-specific T cells to nonlymphoid tissues is thought to be important for the elimination of foreign antigens from the body. However, recent results showing the migration of activated T cells into many nonlymphoid tissues raised the possibility that antigen-specific T cells do not migrate preferentially to nonlymphoid tissues containing antigen. We addressed this question by tracking antigen-specific CD4 T cells in the whole body after a localized subcutaneous antigen injection. Antigen-specific CD4 T cells proliferated in the skin-draining lymph nodes and the cells that underwent the most cell divisions acquired the ability to bind to CD62P. As time passed, CD62P-binding antigen-specific CD4 T cells with interferon γ production potential accumulated preferentially at the site of antigen injection but only in recipients that expressed CD62E. Surprisingly, these T cells did not proliferate in the injection site despite showing evidence of more cell divisions than the T cells in the draining lymph nodes. The results suggest that the most divided effector CD4 T cells from the lymph nodes enter the site of antigen deposition via recognition of CD62E on blood vessels and are retained there in a nonproliferative state via recognition of peptide–major histocompatibility complex II molecules.
Keywords: antigen-specific, CD4, T cell, migration, selectin
Introduction
The elimination of intracellular antigens from the body is thought to depend on the migration of the activated T cells to the tissue where antigen is harbored (1). For CD4 T cells, this process is initiated by dendritic cells that take up antigen in the tissue where it enters the body and then migrate to the secondary lymphoid organs displaying peptide–MHC II complexes derived from the antigen (2). CD4 T cells expressing a complementary TCR, recognize these complexes, produce growth factors, proliferate (3), and then many of the progeny migrate into nonlymphoid tissues including the lungs, liver, intestines, and salivary glands (4). As the CD4 T cells in nonlymphoid tissues are potent producers of IL-4 (5, 6) or IFN-γ (4, 7), the purpose of this migration may be to bring effector T cells into infected tissues to stimulate the antimicrobial activities of phagocytes.
Activated T cells are able to enter nonlymphoid tissues due to the induction of surface receptors that are not expressed on naive T cells. Naive T cells use CD62L, CCR7, and LFA-1 to recognize and extravasate through the specialized high endothelial venules of the lymph nodes and mucosal lymphoid tissues, but lack the molecules needed to pass out of other types of blood vessels (1, 8). In contrast, a subset of activated T cells lose CD62L and gain a new set of selectins, chemokine receptors, and integrins, which allow these cells to pass through blood vessels and migrate into the interstitial spaces of nonlymphoid tissues (1, 8).
Activated T cells enter the skin by binding to CD62P and CD62E on the endothelial cells of inflamed blood vessels. The binding of activated T cells to CD62P and CD62E is thought to be mediated by a fucosylated form of CD62P ligand-1 (PSGL-1;* reference 9), although another CD62E-binding molecule known as CD62E ligand-1 also exists (10). PSGL-1 is expressed on naive T cells, but in an unfucosylated form that does not bind to CD62P or CD62E (9, 11–13). After TCR and IL-12 receptor signaling, T cells express a fucosyl transferase that adds a fucose group to PSGL-1, converting it to a form capable of binding to both CD62P and CD62E (11, 14, 15). Of the activated CD4 T cells that bind to CD62P ∼70% of these cells also bind to CD62E (16), probably via PSGL-1. The molecule that accounts for the binding of activated T cells to CD62P alone is unknown.
The importance of CD62E and CD62P to T cell migration is evidenced by the finding that the migration of Th1 cells into inflamed skin after adoptive transfer is inhibited when CD62P and/or CD62E are blocked (17, 18). In addition, the cutaneous hypersensitivity reaction, which is mediated by T cells, is impaired in mice lacking CD62P (19), CD62E and CD62P (18, 20, 21), or fucosyl transferase VII (22), and in mice in which CD62E is blocked (23, 24). Furthermore, a fraction of the antigen-specific CD4 T cells in the lymph nodes express fucosylated PSGL-1 several days after subcutaneous injection of antigen (25) as do the majority of T cells that can be isolated from the skin (26). It is therefore possible that antigen-stimulated T cells leave the lymph node during the primary response and use fucosylated PSGL-1 to enter the site of immunization by binding to CD62P and CD62E-expressing blood vessels. Although this is an appealing scenario, it has yet to be demonstrated during an immune response in vivo.
Although activated T cells migrate into nonlymphoid tissues, it is not clear that nonlymphoid tissues containing antigen are preferred. Topham et al. (27) found that antigen-experienced CD8 T cells migrated into inflamed lungs whether or not the relevant antigen was present in the lungs. Although autoantigen-specific T cells infiltrate the organ expressing the autoantigen (28, 29), it is possible that this reflects generalized migration to nonlymphoid tissues rather than specific migration to an antigen-containing site. Recent studies in which activated T cells were shown to migrate into many nonlymphoid organs after systemic administration of antigen (4, 30), did not shed light on this issue because antigen was not concentrated in a defined location. Thus, it was not possible to determine whether or not the T cells accumulated to a greater extent in organs that contained antigen compared with those that did not.
We addressed this question by quantifying antigen-specific CD4 T cells in the whole body after a localized subcutaneous injection of antigen. The results show the combined action of CD62E-dependent migration and antigen-dependent retention cause the injection site to become the major nonlymphoid tissue in which antigen-specific CD4 T cells accumulate during the primary response in the skin.
Materials and Methods
Mice.
DO11.10 BALB/c (31), DO11.10 BALB/c RAG2-deficient, and OT-II C57BL/6 (B6).PL (32) mice were bred in a specific pathogen-free facility according to National Institutes of Health guidelines. B6, BALB/c, and CD62P-deficient B6 mice were purchased from The Jackson Laboratory. B6 mice deficient in CD62E only or both CD62P and CD62E (33) were provided by D.C. Bullard (University of Alabama at Birmingham).
Adoptive Transfer.
Single-cell suspensions of spleen and lymph nodes were prepared from DO11.10 BALB/c, DO11.10 RAG2-deficient BALB/c, or OT-II B6.PL mice. A sample was stained to obtain the percentage of CD4 T cells expressing the transgenic TCR. For DO11.10 mice, cells were stained with CyChrome-labeled anti-CD4 mAb (BD Biosciences) and FITC-labeled KJ1–26 mAb (Caltag), which specifically recognizes the DO11.10 TCR (34). For OT-II mice, cells were stained with CyChrome-labeled anti-CD4 mAb, FITC-labeled anti-Vα2 mAb, and phycoerythrin-labeled anti-Thy1.1 mAb (all from BD Biosciences). Recipient mice were injected with 3 × 10⁶ TCR transgenic CD4 T cells in 0.3 ml of PBS. For 5- and 6-carboxy-fluorescein succinimidyl ester (CFSE; Molecular Probes) labeling, cells were incubated with 5 μM CFSE in HBSS for 10 min at 37°C. Cells were then washed with medium containing FCS and PBS before adoptive transfer.
Immunizations.
Mice were injected with chicken OVA peptide (residues 323–339; Research Genetics) either intravenously or subcutaneously, 1 d after receiving TCR transgenic T cells. For intravenous injections, mice received 100 μg of OVA peptide with or without LPS (25 μg, serotype Escherichia coli 026:B6, Difco Laboratories) in 0.3 ml of PBS via the tail vein. Alternatively, mice received 50 or 100 μg of OVA peptide emulsified in IFA (Sigma-Aldrich) in 20 or 40 μl, respectively, in the tail. In some cases mice were injected at two subcutaneous sites on the same tail. One site received 50 μg of OVA peptide in 20 μl of IFA, and the other received 20 μl of IFA alone. These two sites were separated by 1 cm of normal tail tissue.
Whole Mouse Staining.
Mice were killed, perfused with PBS through the left ventricle of the heart, and frozen in O.C.T. embedding compound. 10 μm sections were cut with a LKB 2250 cryomicrotome as described previously (4, 35). Sections were dehydrated and fixed in formaldehyde and then Fc-, biotin-, or avidin-binding sites were blocked as described previously (4). After a brief wash with PBS, sections were incubated for 20 min with biotin labeled anti-Thy1.1 monoclonal antibody. The sections were then incubated with streptavidin-peroxidase followed by biotinyl tyramide from the TSA™-Biotin kit (NEN Life Science Products) according to manufacturer instructions. Deposited biotin was detected by streptavidin-Cy3 (Caltag), and the sections were counterstained for 5 min with a 10 μg/ml solution of 4′,6-diamidine-2′-phenylindole dihydrochloride (DAPI; Roche Applied Science) in PBS. Sections were mounted on glass plates and covered with Vectashield (Vector Laboratories) before application of a coverslip.
Whole Mouse Imaging.
Images of whole mouse sections were captured by a CCD camera attached to an Olympus B-60 fluorescence microscope equipped with an automated stage driven by Metamorph software (Universal Imaging Corp.). A slide with an affixed whole mouse section was mounted on the stage and positioned such that the stage was in the top, left position. This position was defined as the origin. Beginning at the origin, a series of DAPI images covering ∼3/4 of the section was collected in a pattern of 14 rows, each consisting of 37 images. Once the DAPI images were obtained, the stage was returned to the origin, and the same set of Cy3 images was collected. Because it was not possible to image the entire mouse in one pass, the slide was moved and an additional 5–7 rows were imaged to capture the full section. Photoshop 5.5 software (Adobe Systems Inc.) was used to assemble the ∼700 individual images into single composite DAPI or Cy3 images. The DAPI images are assembled first. Due to canvas size constraints in Photoshop 5.5, each individual image was reduced in size to a width of 2 inches. The individual images from each row were assembled and then stacked sequentially to produce the final composite DAPI image. Similar actions were used to assemble the Cy3 images except that operations were first performed to reduce background fluorescence. The background signal was blanked by setting the threshold so that no red pixels were detected on an area of tissue that had no punctate red objects. The Image/Adjust/Invert function was used to convert the remaining red objects to black. Individual T cells (based on rim staining) where then identified in the lymphoid tissues and the average number of pixels per T cell was determined using the Image/Histogram function. Objects that had 50% more or less pixels than this average were eliminated using the Digimarc Plug-in feature, IP•Features/Cutoff. This step eliminated noncell sized artifacts. The remaining cellular objects were converted back to red using the Select/Color range/Reds function in Photoshop and increased fivefold in diameter using the Select/Modify/Expand feature so that individual T cells could be seen on the composite image. The individual Cy3 images were then assembled as described above, and the resulting Cy3 composite was overlaid on the relevant DAPI composite to produce the final merged composite of each section.
Quantification of Antigen-specific T Cells in Individual Tissues.
Sections (6–10 μm) of explanted tail, spleen, lung, or small intestine from recipients of DO11.10 or OT-II cells were prepared using a Leica CM 1800 cryomicrotome (Leica), and placed on charged glass slides (Fisher Scientific). After blocking, sections were stained sequentially with biotin-labeled KJ1–26 mAb or biotin-labeled anti-Thy 1.1 mAb, streptavidin-peroxidase, biotinyl tyramide, streptavidin-Cy3, and DAPI as described above. Digital images were prepared and the background was adjusted as for the whole mouse images. An average pixel/cell cutoff was applied to eliminate artifacts and cells that were not in the plane of the section, preventing overestimation of the total cells in the organ. This was done as described above, except that the cutoff was applied only to objects below the average pixel value, so as not to eliminate clusters of cells. The cell-sized objects that remained were counted using the Digimarc Plug-in feature IP•Features/Count marks option. On sections where TCR transgenic cells were very abundant and in contact with one another, the same cutoff was used, but instead of using the count marks option, the total number of red pixels on the section obtained using the Select/Color range and Image/Histogram options in Photoshop was divided by the average pixels/cell value. This gave a value for the total number of TCR transgenic cells per section. In the case of tail cross sections, this value was multiplied by the total number of sections along the length of the injection site. For the other organs, which have irregular shapes, the fractional area of representative sections occupied by TCR transgenic T cells was multiplied by the volume of that organ (as determined by the weight of that organ in comparably treated animals with the assumption that 1 ml = 1 cm3 = 1 gm) and divided by the average volume of a T cell, as described previously (4).
Cell Isolation and Intracellular Staining for Detection of Cytokines.
BALB/c recipients of DO11.10 cells were injected subcutaneously in the tail with OVA peptide/IFA. 14 d later, mice were challenged with an intravenous injection of 100 μg of OVA peptide. Mice were killed 2 h later and inguinal, periaortic, and mesenteric lymph nodes, and the tail injection sites were removed and placed in chilled Eagles Hanks with amino acids medium containing 10% FCS. Media for all subsequent steps were supplemented with 10 μg/ml of brefeldin A to inhibit secretion of intracellular cytokine. Lymph nodes were mashed with the end of a syringe plunger and incubated in PBS containing collagenase D (Roche Applied Sciences; 400 U/ml), collagenase VII (Sigma-Aldrich; 100 U/ml), or Liberase Blendzyme 3 (Roche Applied Sciences) for 20 min at 37°C. The resulting cell suspension was filtered to remove debris, washed with PBS, and placed in FCS-containing medium on ice while the tail injection sites were processed. Tail tissue was minced into small pieces and incubated for 15 min in the collagenase mixture at 37°C. The remaining fragments were then mashed with the end of a syringe plunger and incubated for an additional 15 min. The digested tissue was minced an additional time before being passed through a filter to obtain a single cell suspension. The suspension was then passed over Lympholyte M (CedarLane Laboratories). Lymphocytes were collected from the interface.
Lymph nodes cells and lymphocytes from the tail were fixed in 2% formaldehyde, permeabilized with 0.3% saponin, and stained with fluorochrome-labeled anti-CD4, KJ1–26 or anti-Thy1.1, and anti-IL-2 or IFN-γ antibodies to detect lymphokine production in DO11.10 or OT-II T cells (36). Cells capable of binding to CD62P were identified using a fusion protein containing the extracellular portion of CD62P and the Fc portion of human IgG (CD62P-Ig; BD Biosciences). CD62P-Ig was incubated with cells for 30 min on ice. The cells were washed with PBS and fixed in 2% formaldehyde. After fixation, cells were stained with Cy5.5-labeled anti-CD4 and allophycocyanin-labeled KJ1–26 antibodies (Caltag) followed by PE-labeled goat anti-human IgG antibody (Caltag). Human IgG (Caltag) was used as a negative control for CD62P-Ig binding. Stained cells were analyzed by flow cytometry.
Bromodeoxyuridine Labeling.
BALB/c recipients of DO11.10 cells were injected subcutaneously in the tail with 100 μg of OVA peptide/IFA. At various times after immunization, mice were injected intraperitoneally with 0.5 mg of bromodeoxyuridine and then again 2 h later. Mice were killed 2 h after the second bromodeoxyuridine injection and the inguinal, mesenteric, and periaortic lymph nodes and tail injections sites were harvested. Cells were isolated as described for intracellular cytokine staining. Isolated cells were stained with allophycocyanin-labeled KJ1–26 antibody (Caltag) and Cy5.5-labeled anti-CD4 antibody (BD Biosciences) for 30 min on ice. Cells were washed in PBS and suspended in 0.5 ml of 1% paraformaldehyde with 0.01% Tween 20, and stored overnight at 4°C. Cells were then stained with FITC-labeled anti-bromodeoxyuridine antibody (BD Biosciences) as described previously (37) and analyzed by flow cytometry.
Bromodeoxyuridine incorporation was also assayed by immunohistochemistry. The lungs, tail injection sites, and periaortic, inguinal, and mesenteric lymph nodes were dissected from individual mice that received OVA peptide/IFA and bromodeoxyuridine as described above. Organs were frozen together in O.C.T., sectioned, and stained with biotinylated-KJ1–26 antibody and tyramide-rhodamine from the TSA™-rhodamine kit (NEN Life Science Products) according to manufacturer instructions. Sections were then washed briefly in PBS and incubated an additional 60 min in 1% H202/0.01% azide. Slides were incubated in avidin and biotin block (Vector Laboratories) before antigen-retrieval according to the BD Biosciences bromodeoxyuridine in situ detection kit (BD Biosciences). The sections were then incubated with biotin-labeled anti-bromodeoxyuridine antibody, washed with PBS, and incubated with Streptavidin-peroxidase for 30 min. After washing, slides were incubated for 5 min with biotinyl-tyramide (NEN Life Science Products), washed, and incubated with streptavidin-Cy5 (Caltag) for 20 min. Slides were mounted with Vectashield (Vector Laboratories). Digital images in the rhodamine, FITC, and Cy5 channels were collected. The autofluorescence present on the FITC images was used to outline the anatomy of the tissue. Photoshop 5.5 software was used to color Rhodamine-stained objects red, Cy5-stained objects green, and the FITC autofluorescence gray. The three sets of images were then overlaid. DO11.10 T cells that incorporated bromodeoxyuridine contained red and green color and thus appeared yellow. Yellow objects significantly smaller than an average cell were eliminated to ensure that yellow staining was due to true costaining rather then overlap of green and red by two adjacent cells.
Results
Antigen-specific T Cells Accumulate at a Subcutaneous Site of Antigen Deposition.
It was recently demonstrated that antigen-specific CD4 T cells migrate to nonlymphoid organs in large numbers after systemic exposure to antigen (4). Because the antigen had access to all parts of the body under these conditions it was not possible to determine whether or not the T cells migrated preferentially into antigen-containing organs. This issue was addressed here by confining antigen to a local site by injecting mice with OVA peptide/IFA subcutaneously in the tail. This form of antigen administration was chosen because IFA emulsions remain localized at the site of injection for weeks (38). To assess the migration of antigen-specific CD4 T cells into this injection site it was necessary to transfer a small number of naive OVA peptide-specific CD4 T cells from TCR transgenic donor mice into normal mice before immunization because the frequency of CD4 T cells specific for this peptide in the normal T cell repertoire is below the limit of detection of flow cytometry and immunohistology (39).
Whole-mouse immunohistology was used to determine whether or not the local site of antigen injection was the major nonlymphoid tissue into which antigen-specific CD4 T cells migrated after subcutaneous immunization. Sections prepared from normal B6 mice (Thy 1.2), or B6 mice that received several million OT-II TCR transgenic CD4 T cells (Thy 1.1) were stained with Cy3-labeled anti-Thy 1.1 antibody. A section through a normal mouse that did not receive OT-II cells contained a few nonspecifically-stained objects, primarily in the kidney, muscle, and liver (Fig. 1 A). As expected (4), a section through a recipient of OT-II cells that was not injected with OVA peptide showed a similar appearance with the exception that stained objects, presumably OT-II cells, were also present in the spleen and lymph nodes (Fig. 1 B). No OT-II cells were present in the tail tissue of naive mice (Fig. 1, B and E), consistent with the theory that naive T cells circulate through secondary lymphoid organs but not nonlymphoid organs (40). As reported previously (4), OT-II cells were detected at elevated levels in the spleen and several other organs such as the liver, lung, salivary gland, intestines, and thymus, 5 d after intravenous injection of OVA peptide and LPS (Fig. 1 C). Very few OT-II cells migrated into the tail under these conditions. In contrast, large numbers of OT-II T cells were found in the tail tissue 5 d after subcutaneous injection of OVA peptide/IFA into this location (Fig. 1, D and F).
Figure 1.
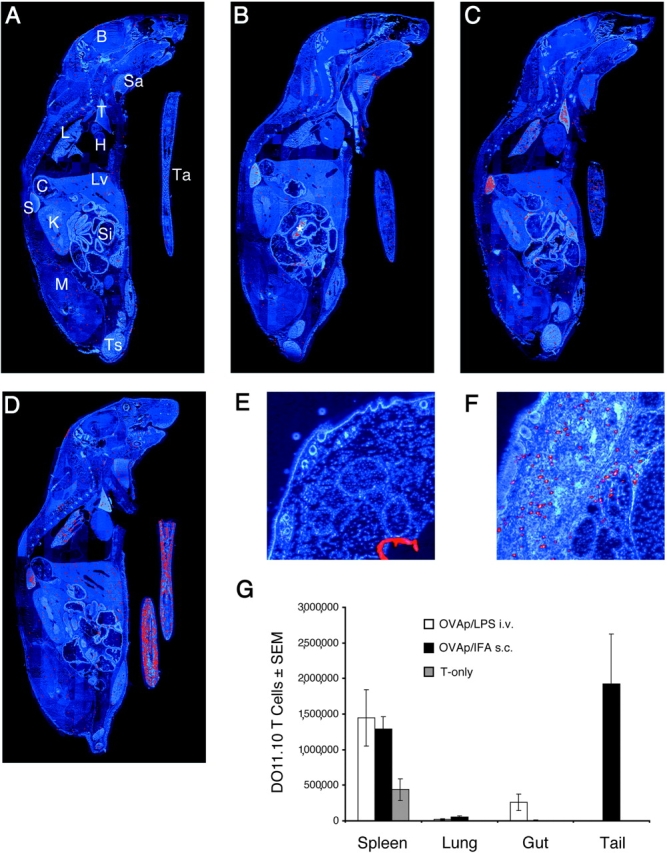
Detection of antigen-specific T cells in whole body sections following different routes of immunization. Images from anti-Thy 1.1/Cy3-stained sections through the following mice are shown: (A) a normal B6 mouse that did not receive OT-II cells; (B) a B6 mouse that received 3 × 10⁶ OT-II cells intravenously 5 d before sacrifice; (C) a B6 mouse that received OT-II cells, was injected intravenously the next day with 100 μg OVA peptide and 25 μg LPS, and was killed 4 d later; and (D) a B6 mouse that received OT-II cells, was injected subcutaneously in the tail with 100 μg OVA peptide/IFA and was killed 4 d later. B, brain; H, heart; K, kidney; L, lung; C, colon; Lv, liver; M, muscle; S, spleen; Sa, salivary glands; Si, small intestine; T, thymus; Ts, testes; Ta, Tail; *, lymph nodes. Enlarged cross sections KJ1-stained through normal tail tissue (E) or a day 5 tail site containing OVA peptide/IFA (F) from recipients of DO11.10 T cells are also shown. The number of DO11.10 T cells (assessed in spleens by flow cytometry and in the other organs by immunohistology) present on day 5 in the indicated organs in mice injected with 100 μg OVA peptide and 25 μg LPS intravenously (white bars), 100 μg OVA peptide/IFA subcutaneously (black bars), or nothing (shaded bars) is shown in G.
A more quantitative immunohistochemical analysis was performed using individual organs from BALB/c recipients of DO11.10 RAG2-deficient CD4 T cells (Fig. 1 G). Naive DO11.10 T cells were found in the spleen but not nonlymphoid organs in mice that were not injected with OVA peptide. The number of DO11.10 T cells in the spleen increased 5 d after intravenous injection of OVA peptide plus LPS or subcutaneous injection of OVA peptide/IFA. DO11.10 T cells migrated into the lungs after both types of antigen administration. In contrast, DO11.10 T cells migrated to the intestines but not the tail after intravenous antigen delivery, whereas DO11.10 cells entered the tail but not the intestines after subcutaneous injection. The entry of CD4 T cells into the tail appeared to be a function of the route of antigen delivery and not the type of adjuvant used since DO11.10 cells were found in the tail in similar numbers 5 d after subcutaneous priming with OVA peptide/IFA or OVA peptide plus LPS (unpublished data). These results show that although antigen-specific CD4 T cells enter nonlymphoid organs after both systemic and localized antigen administration, the distribution of T cells differs according to the route of immunization.
Antigen-specific CD4 T Cells Accumulate Preferentially in the Subcutaneous Antigen Injection Site.
It was possible that the antigen-specific CD4 T cells that accumulated in the tail injection site did so by sensing the inflamed blood vessels in this location. It was also possible, that recognition of OVA peptide–MHC II complexes played a role in this process. To assess the roles of inflammation and antigen presentation, a small amount of IFA containing OVA peptide was injected into one site on the tail, and an equal volume of IFA alone was injected into another physically separate site on the same tail. This created two inflamed sites that differed only by the presence or absence of antigen. The number of transferred DO11.10 T cells was then determined in the tail-draining lymph nodes by flow cytometry and at each tail injection site by immunohistochemistry. Immunohistochemistry was used for tail tissue (on sections of the type shown in Fig. 1 F) because only a small fraction of the cells shown by immunohistochemistry to be in this location could be released by enzymatic digestion for flow cytometric analysis (unpublished data).
About 30,000 DO11.10 T cells were present in the lymph nodes of recipients that were not injected with OVA peptide (Fig. 2) , or were injected with IFA alone (unpublished data), whereas no cells were detected in the tail tissue under these conditions (Fig. 2). The number of DO11.10 T cells in the draining nodes increased ∼10-fold to 300,000 by day 5 after injection of OVA peptide/IFA and IFA in separate sites on the same tail, and then decreased progressively over the next several weeks. Small numbers of DO11.10 T cells first appeared in the OVA peptide/IFA and IFA injection sites by day 3. The number of DO11.10 T cells in the OVA peptide/IFA injection sites then increased 300-fold to a peak of 1,000,000 on day 14. During this period, the number of DO11.10 cells in the IFA injection site increased to a peak of 30,000. The number of DO11.10 cells in the tail tissue sites then fell sharply between days 14 and 20 and slowly thereafter to the limit of detection by day 60. Therefore, antigen-specific CD4 T cells migrated into normal and inflamed tissue that did not contain antigen, but only accumulated to large numbers in inflamed tissue containing antigen.
Figure 2.

Quantification of antigen-specific CD4 T cells after subcutaneous injection of antigen. Mice were injected at two sites on the tail: one site with OVA peptide/IFA, and the second site with IFA alone. The graph shows the number of DO11.10 RAG2-deficient cells ± SEM (n = 2–3 mice per timepoint in three independent experiments) found in the draining inguinal and periaortic lymph nodes (squares), the injection site containing OVA peptide/IFA (circles), or the injection site containing IFA alone (triangles). The minimum value for the Y axis is the limit of detection.
Antigen-specific CD4 T Cells Do Not Proliferate after Entering the Antigen Injection Site.
As no antigen-specific CD4 T cells were found in the tail before immunization (Fig. 1, B, E, and G), their initial appearance at this site must have been due to migration from some other part of the body. However, it was possible that the dramatic increase in cell number seen in the antigen injection site between days 3 and 14 (Fig. 2) was due to the proliferation of the initial immigrants.
To address this question, the thymidine analogue bromodeoxyuridine was used to label cells undergoing proliferation during the time that the antigen-specific T cells accumulated at the injection site. Recipients of DO11.10 T cells were exposed to bromodeoxyuridine for 4 h at various times after subcutaneous injection of OVA peptide/IFA. This short pulse was used to maximize the chance that cells incorporated bromodeoxyuridine in the location in which they were sampled. The transferred cells were identified by coexpression of CD4 and the clonotypic TCR (Fig. 3 A).
Figure 3.
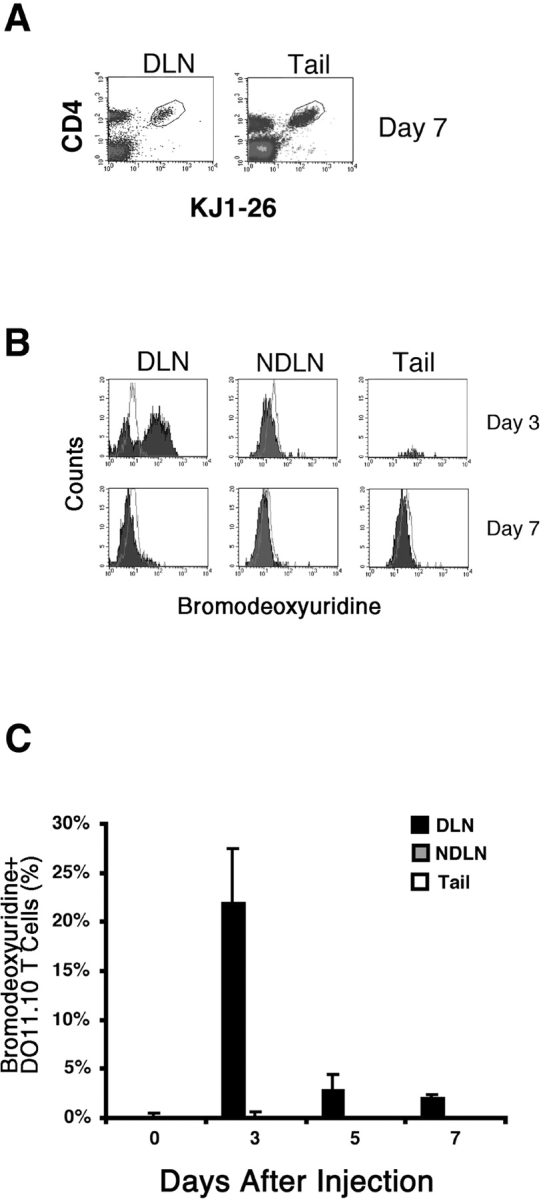
In vivo proliferation by antigen-specific CD4 T cells. Recipients of naive DO11.10 T cells were injected with OVA peptide/IFA. 3 or 7 d later, mice were injected with bromodeoxyuridine over a 4 h period immediately preceding sacrifice, and intracellular staining was used to detect bromodeoxyuridine incorporation in DO11.10 T cells. The gate used to identify DO11.10 cells is shown in panel A for draining lymph nodes (DLN) and tail tissue from mice injected with OVA peptide/IFA 7 d earlier. Staining with anti-bromodeoxyuridine (filled histograms) or an isotype control antibody (open histograms) in DO11.10 cells isolated from the draining inguinal and periaoritic lymph nodes (DLN), nondraining mesenteric lymph nodes (NDLN), or tail injection sites, 3 or 7 d after immunization is shown in B. C shows the mean percentage of DO11.10 T cells ± SEM (n = 5–7 mice per time point from two independent experiments) that incorporated bromodeoxyuridine in the draining lymph nodes (black bars), nondraining lymph nodes (gray bars), or tail injection sites (white bars).
20–50% of the DO11.10 T cells in the draining lymph nodes were labeled with a 4 h pulse of bromodeoxyuridine 3 d after injection of OVA peptide/IFA (Fig. 3, B and C). This labeling pattern was consistent with an earlier study (39), which showed that many DO11.10 T cells in the draining lymph nodes are in the cell cycle at this time. The fraction of bromodeoxyuridine-labeled DO11.10 T cells in the draining lymph nodes declined on days 5 and 7 although an easily detectable population was still present (Figs. 3 C and 4 A). The DO11.10 T cells in the nondraining lymph nodes were not labeled with bromodeoxyuridine (Fig. 3, B and C, and Fig. 4 B), demonstrating the local nature of this immune response. Surprisingly, bromodeoxyuridine-labeled DO11.10 T cells were not detected in the antigen injection site on days 3, 5, or 7 (Figs. 3 C and 4 C), despite the fact that the number of DO11.10 T cells in this location increased dramatically during this period (Fig. 2). Immunohistochemical analysis of tail sections from these mice showed the presence of bromodeoxyuridine-labeled cells other than DO11.10 T cells, demonstrating that cells in this location had access to bromodeoxyuridine during the 4 h treatment period (Fig. 4 C). These results showed that antigen-specific CD4 T cells did not proliferate extensively after entering the nonlymphoid site of antigen deposition. Therefore, immigration from another part of the body was a more likely explanation for the accumulation of these cells.
Figure 4.
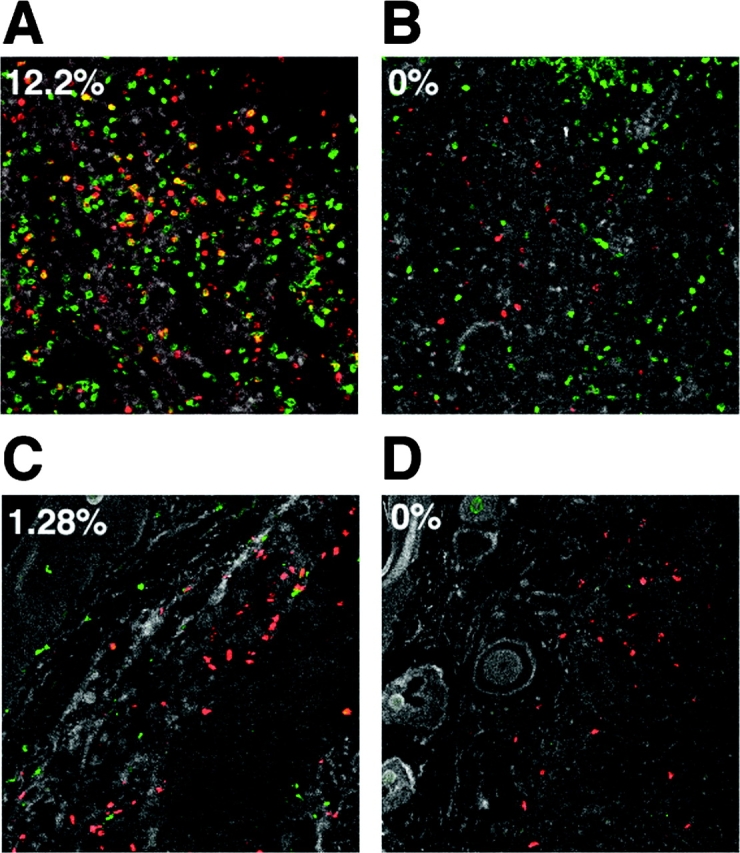
In situ detection of bromodeoxyuridine-labeled cells. Recipients of naive DO11.10 T cells were injected with OVA peptide/IFA. 7 d later mice were either injected with bromodeoxyuridine over a 4 h period just before sacrifice (A–C), or did not receive bromodeoxyuridine (D). Sections of a draining inguinal lymph node (A), a nondraining mesenteric lymph node (B), or tail (C and D) stained with KJ1–26 (Cy3, red), and anti-bromodeoxyuridine (Cy5, green) antibodies are shown. The tail section shown in D served as a control for false double-positive staining. The number in the upper left corner of each panel represents the percentage of red KJ1–26+ cells that also stained green with anti-bromodeoxyuridine antibody, and thus appear as yellow objects.
CD62P-binding, Antigen-specific CD4 T Cells Appear in the Draining Lymph Nodes and then Accumulate at the Antigen Injection Site.
Because the DO11.10 T cells showed no signs of division after entering the antigen injection site it was possible that these cells had never divided. However, since it is thought that only antigen-experienced T cells are capable of migrating into nonlymphoid tissues (40, 41), it seemed more likely that the DO11.10 cells divided elsewhere before migrating. These possibilities were addressed by labeling the naive DO11.10 T cells with CFSE before transfer and measuring cell division-related dilution of the dye (42). Because cell division history correlated with CD62P binding by lymph node T cells in another study (43), the cells were also tested for CD62P-binding activity using CD62P-Ig (44).
The DO11.10 T cells in the lymph nodes at the time of OVA peptide/IFA injection contained high levels of CFSE (Fig. 5) and did not bind CD62P as expected for naive T cells (11, 43). By 2 d after injection, most of the DO11.10 T cells in the draining lymph nodes had divided at least once, with many of the cells showing signs of multiple cell divisions. At this time, a subset of the most divided cells in the draining lymph nodes bound CD62P. DO11.10 T cells could not be isolated from the injection site 2 d after antigen injection (unpublished data). The DO11.10 T cells continued to divide in the draining lymph nodes such that by day 5 many of the cells had divided more than six times. Again, a subset of the most divided cells bound CD62P. By this time, DO11.10 T cells could be isolated from the tail injection site. All of these cells had divided more than 6 times and most bound CD62P. Thus, the most divided cells in the lymph node resembled the cells in the tail with respect to CD62P-binding activity. The CFSE staining pattern for DO11.10 T cells in the draining lymph nodes did not change between days 5 and 11, indicating that cell division ceased during this interval. By day 11, very few CD62P-binding DO11.10 T cells remained in the draining lymph nodes. In contrast, all of the DO11.10 T cells at the injection site at this time bound CD62P. Together these results are consistent with a scenario in which antigen-specific CD4 T cells are stimulated in the draining lymph nodes. A subset of these cells, which divides more than other cells in the population, acquires the ability to bind CD62P, leaves the lymph nodes, and migrates to the injection site.
Figure 5.

The most divided antigen-specific CD4 T cells in the lymph nodes and antigen injection site bind CD62P. The dot plots show the levels of CD62P binding and CFSE dilution in KJ1–26+ cells from the draining lymph nodes or tails of BALB/c recipients of CFSE labeled DO11.10 T cells that were injected subcutaneously in the tail with OVA peptide/IFA.
CD62E Is Critical for the Entry of Antigen-specific CD4 T Cells into the Antigen Injection Site.
Because CD62P-binding antigen-specific CD4 T cells accumulated at the antigen injection site and because most T cells that bind CD62P also bind CD62E (16), it was possible that these molecules played a role in the migration process. This possibility was tested by assessing the capacity of antigen-specific CD4 T cells to accumulate at the site of antigen injection in mice lacking CD62P, CD62E, or both CD62P and CD62E. The adoptive transfer of OT-II cells was used for this purpose because the selectin-deficient recipients were on the B6 background.
The accumulation of OT-II cells in the draining lymph nodes 5 d after subcutaneous injection of OVA peptide/IFA was similar in normal and CD62P-deficient mice (Fig. 6 A). In addition, similar numbers of OT-II cells were present in the tail injection sites in both groups. In contrast, OT-II T cells accumulated in the antigen injection sites of mice lacking CD62E (Fig. 6 B) or CD62P and CD62E (Fig. 6 C) 6–10-fold less well than they did in normal mice. The draining lymph nodes of CD62E-deficient or CD62E/P-deficient recipients of OT-II cells also contained one half to one third as many OT-II cells as the draining lymph nodes of normal mice, 5 d after OVA/IFA injection. Although this difference could have been explained by the fact that about half as many OT-II cells were present in the lymph nodes of CD62E/P-deficient mice before immunization, this could not account of the difference in CD62E-deficient mice, which contained the same number of OT-II cells in the lymph nodes as normal mice before antigen injection. These results indicated that the CD62E expression by the recipient was critical for maximal accumulation of antigen-specific CD4 T cells in the draining lymph nodes and site of antigen injection.
Figure 6.

Antigen-specific CD4 T cells do not migrate to the subcutaneous antigen injection site in the absence of CD62E. Thy 1.1+ OT-II T cells were transferred into normal, CD62P-deficient, CD62E-deficient, or CD62E/P-deficient mice, some of which were then injected subcutaneously in the tail with 100 μg of OVA peptide/IFA. The mean number ± SEM (n = 4–6 mice) of OT-II T cells detected in the draining periaortic and inguinal lymph nodes (by flow cytometry) or tail injection sites (by immunohistology) of normal or CD62-deficient mice 5 d after OVA peptide/IFA injection are shown. Normal recipients (black bars) were compared with CD62P-deficient (A), CD62E-deficient (B), or CD62E/P-deficient recipients (white bars) in separate experiments.
Antigen-specific CD4 T Cells at the Antigen Injection Site Produce IFN-γ but Not IL-2.
The preferential accumulation of antigen-specific CD4 T cells in the antigen injection sites several weeks after immunization raised the possibility that these T cells recognized peptide–MHC II complexes in this location. This possibility was explored using a method that allows direct ex vivo detection of intracellular IL-2 and IFN-γ in transferred DO11.10 cells (36). About 15% of the DO11.10 cells in the tail injection sites on day 14 contained IFN-γ, a value that increased to 30% (Fig. 7 B) after challenge with OVA peptide. In contrast, very few of the DO11.10 cells in the tail injection sites on day 14 contained IL-2 before or after challenge (Fig. 7, A and B), perhaps explaining why these cells did not proliferate in the injection site. The DO11.10 cells in the draining lymph nodes of mice injected with OVA peptide/IFA 14 d earlier did not contain IL-2 or IFN-γ (Fig. 7, A and B), but ∼10% of the cells produced IL-2 but not IFN-γ, 2 h after challenge with OVA peptide (Fig. 7, A and B). The presence of IFN-γ in the antigen-specific CD4 T cells that resided in the antigen injection site is evidence that these cell were undergoing active stimulation in this location, despite a lack of IL-2 production and proliferation. In contrast, the antigen-experienced CD4 T cells that resided in the lymph nodes showed no signs of constitutive stimulation and produced IL-2 but not IFN-γ when challenged with antigen.
Figure 7.

IL-2 and IFN-γ production by antigen-specific CD4 T cells. Recipients of naive DO11.10 T cells were injected with OVA peptide/IFA. 14 d later, ex vivo intracellular staining was used to detect IL-2 (A) or IFN-γ (B) in DO11.10 T cells before (black bars) or 2 h after intravenous injection of 100 μg of OVA peptide (white bars).
Discussion
The results presented here provide clear evidence that the local site of antigen deposition is the major nonlymphoid tissue in which activated antigen-specific CD4 T cells accumulate during the primary response. This conclusion is supported by the recent finding that antigen-specific CD4 T cells accumulate in the lungs after nasal influenza virus infection (7). These studies imply that peptide–MHC II recognition plays a role in either the migration or retention of antigen-specific T cells in nonlymphoid tissues. It is therefore likely, that the previously reported migration of antigen-specific T cells into most nonlymphoid tissues after systemic antigen administration (4, 30, 45) is explained in part by the body-wide distribution of antigen in this situation. However, the fact that some antigen-specific CD4 T cells accumulated in the lungs and thymus after subcutaneous injection of antigen suggests that local antigen presentation is not the only factor that determines the distribution of antigen-specific T cells in certain nonlymphoid tissues.
It is currently thought that the migration of activated T cells into nonlymphoid organs is controlled by induction of homing and chemokine receptors on the T cells and inflammation-dependent display of selectins, adhesion molecules, and chemokines on blood vessels (8, 46). It was recently shown that the induction of homing molecules on the T cells is influenced by the type of secondary lymphoid organ in which peptide–MHC II recognition occurs. For example, several days after systemic administration of antigen, antigen-specific CD62P-binding CD4 T cells lacking α4β7 integrin were generated in peripheral lymph nodes, whereas cells expressing high levels of α4β7 integrin but lacking CD62P-binding activity were generated in mucosal lymph nodes (43). As inflamed blood vessels in the skin and mucosal tissues express CD62P and CD62E (47–49) or MadCAM-1 (50), respectively, it was possible that the CD62P-binding T cells generated in peripheral lymph nodes, migrated to the skin, whereas the α4β7 integrin-expressing T cells in the mucosal lymphoid organs migrated to the mucosal tissues. Our findings that CD62P-binding antigen-specific CD4 T cells were generated in the draining lymph nodes early after subcutaneous antigen injection and then accumulated at the injection site is consistent with this scenario.
The finding that CD62E is critical for the migration of antigen-experienced CD4 T cells to the site of antigen deposition during the primary response is consistent with earlier reports that secondary T cell responses in the skin are dependent on CD62E and/or CD62P expression on blood vessels (17–19, 21, 23, 24, 51). CD62E has been reported to play a larger role than CD62P in the migration of polyclonal T cells into a skin site injected with inflammatory cytokines and the migration of porcine T cells into the skin during the DTH reaction (23, 52). In our experiments, antigen-experienced CD4 T cells used CD62E preferentially to enter the injection site while retaining the ability to bind to CD62P. This situation could be related to temporal differences in the expression of CD62E and CD62P. For example, CD62E may be expressed on skin blood vessels at higher levels than CD62P several days after immunization when antigen-experienced T cells are leaving the lymph nodes and entering the bloodstream. It is currently not clear which receptor is used by the antigen-experienced T cells to recognize CD62E and enter the injection site. Although PSGL-1 and CD62E ligand-1 are both candidates, we favor PSGL-1 because it is expressed by T cells at the injection site and can account for the fact that they bind CD62P and CD62E.
At first glance it was surprising to find that antigen-specific CD4 T cells did not accumulate normally in the draining lymph nodes of recipients lacking CD62E. As CD62E is not expressed on T cells or APCs (53) it is unlikely that it could directly influence T cell activation or proliferation. Therefore, we favor the idea that the reduced accumulation in the lymph nodes was a secondary effect of the reduced accumulation of T cells at the injection site. As activated T cells can enter lymph nodes from tissues via afferent lymphatic vessels (41), the number of antigen-specific T cells in the draining lymph nodes after immunization is determined by two inputs: cells that proliferated and remained in the lymph node and cells that migrated to the injection site and reentered the lymph node via the afferent lymph. In the absence of CD62E, this second source of T cells would be missing, resulting in fewer T cells in the draining lymph nodes.
As mouse endothelial cells can express MHC II molecules under certain conditions (54, 55), it is possible that recognition of peptide–MHC II complexes on blood vessels played a role in the entry of antigen-specific CD4 T cells into the antigen injection site. However, the fact that the antigen-specific CD4 T cells initially entered equally into sites containing antigen plus IFA or IFA alone suggests that an antigen-independent mechanism is involved in entry. Thus, it is more likely that the antigen-specific T cells initially passed out of blood vessels at both types of injection sites by recognizing CD62E and other adhesive ligands. The much greater subsequent accumulation of antigen-specific T cells in the antigen-containing sites could then have occurred because the T cells were retained in this location as a consequence of peptide–MHC II recognition on local APC. Support for this scenario comes from earlier experiments in which adoptively transferred neuroantigen- or OVA-specific T cell clones entered the brain equally, but only the neuroantigen-specific cells accumulated in this location (56). Similarly, although activated CD8 T cells enter many inflamed tissues, they accumulate in tissues containing in antigen (57, 58).
Remarkably, the accumulation of antigen-specific CD4 T cells at subcutaneous sites of antigen injection was not associated with proliferation in this location. This lack of proliferation was not due to a lack of peptide–MHC II recognition because a sizeable fraction of the T cells in this site at 2 wk were producing IFN-γ constitutively. A similar state where proliferative capacity is lost but effector function is retained has been described recently for activated CD8 T cells (59, 60) and IL-4–producing T cells in the lungs (6). Despite the lack of proliferation at the injection site, the antigen-specific CD4 T cells had divided on average more than the cells in the lymph nodes at the same time. This could be explained by the fact that the T cells divided extensively in the lymph nodes before migrating to the injection site. The most divided T cells may have accumulated preferentially at the injection site because these were the only cells in the lymph nodes that acquired the ability to bind CD62E.
Coordinate regulation of homing molecule expression and lymphokine production potential by cell division may also explain the observation that IFN-γ–producing T cells resided preferentially at the injection site, whereas IL-2–producing cells resided preferentially in lymph nodes. In vitro experiments have shown that multiple cell divisions favor acquisition of the capacity to produce effector lymphokines such as IL-4 and IFN-γ (61), although this was not the case in at least one in vivo situation (62). Therefore, it is possible that the CD4 T cells that divide the most in the lymph nodes acquire the capacity to produce effector lymphokines and express homing molecules needed to enter nonlymphoid organs. In the case of an infection, this sequence of events would produce the desirable result of concentrating CD4 T cells with the capacity to produce anti-microbial lymphokines at the nonlymphoid infection site.
Acknowledgments
We thank Jennifer Walter for technical assistance.
This work was supported by National Institutes of Health research grants AI27998, AI35296, AI39614 (M.K. Jenkins), AI35783 (C.T. Weaver), AR46404 (D.C. Bullard), and National Institutes of Health training grant AI07313 (R.L. Reinhardt).
Footnotes
Abbreviations used in this paper: B6, C57BL/6; CD62P-Ig, fusion protein consisting of the extracellular domain of CD62P and human Ig Fc; CFSE, 5- and 6-carboxy-fluorescein succinimidyl ester; DAPI, 4′,6-diamidine-2′-phenylindole dihydrochloride; PSGL-1, CD62P glycoprotein ligand-1.
References
- 1.von Andrian, U.H., and C.R. Mackay. 2000. T-cell function and migration. N. Engl. J. Med. 343:1020–1034. [DOI] [PubMed] [Google Scholar]
- 2.Banchereau, J., and R.M. Steinman. 1998. Dendritic cells and the control of immunity. Nature. 392:245–252. [DOI] [PubMed] [Google Scholar]
- 3.Jenkins, M.K., A. Khoruts, E. Ingulli, D.L. Mueller, S.J. McSorley, R.L. Reinhardt, A. Itano, and K.A. Pape. 2001. In vivo activation of antigen-specific CD4 T cells. Annu. Rev. Immunol. 19:23–45. [DOI] [PubMed] [Google Scholar]
- 4.Reinhardt, R.L., A. Khoruts, R. Merica, T. Zell, and M.K. Jenkins. 2001. Visualizing the generation of memory CD4 T cells in the whole body. Nature. 410:101–105. [DOI] [PubMed] [Google Scholar]
- 5.Mohrs, M., K. Shinkai, K. Mohrs, and R.M. Locksley. 2001. Analysis of type 2 immunity in vivo with a bicistronic IL-4 reporter. Immunity. 15:303–311. [DOI] [PubMed] [Google Scholar]
- 6.Harris, N.L., V. Watt, F. Ronchese, and G. Le Gros. 2002. Differential T cell function and fate in lymph node and nonlymphoid tissues. J. Exp. Med. 195:317–326. [DOI] [PMC free article] [PubMed] [Google Scholar]
- 7.Roman, E., E. Miller, A. Harmsen, J. Wiley, U.H. Von Andrian, G. Huston, and S.L. Swain. 2002. CD4 effector T cell subsets in the response to influenza: heterogeneity, migration, and function. J. Exp. Med. 196:957–968. [DOI] [PMC free article] [PubMed] [Google Scholar]
- 8.Campbell, J.J., and E.C. Butcher. 2000. Chemokines in tissue-specific and microenvironment-specific lymphocyte homing. Curr. Opin. Immunol. 12:336–341. [DOI] [PubMed] [Google Scholar]
- 9.Fuhlbrigge, R.C., J.D. Kieffer, D. Armerding, and T.S. Kupper. 1997. Cutaneous lymphocyte antigen is a specialized form of PSGL-1 expressed on skin-homing T cells. Nature. 389:978–981. [DOI] [PubMed] [Google Scholar]
- 10.Steegmaier, M., A. Levinovitz, S. Isenmann, E. Borges, M. Lenter, H.P. Kocher, B. Kleuser, and D. Vestweber. 1995. The E-selectin-ligand ESL-1 is a variant of a receptor for fibroblast growth factor. Nature. 373:615–620. [DOI] [PubMed] [Google Scholar]
- 11.Lim, Y.C., L. Henault, A.J. Wagers, G.S. Kansas, F.W. Luscinskas, and A.H. Lichtman. 1999. Expression of functional selectin ligands on Th cells is differentially regulated by IL-12 and IL-4. J. Immunol. 162:3193–3201. [PubMed] [Google Scholar]
- 12.Maly, P., A. Thall, B. Petryniak, C.E. Rogers, P.L. Smith, R.M. Marks, R.J. Kelly, K.M. Gersten, G. Cheng, T.L. Saunders, et al. 1996. The alpha(1,3) fucosyltransferase Fuc-TVII controls leukocyte trafficking through an essential role in L-, E-, and P-selectin ligand biosynthesis. Cell. 86:643–653. [DOI] [PubMed] [Google Scholar]
- 13.Blander, J.M., I. Visintin, C.A. Janeway, Jr., and R. Medzhitov. 1999. Alpha(1,3)-fucosyltransferase VII and alpha(2,3)-sialyltransferase IV are up-regulated in activated CD4 T cells and maintained after their differentiation into Th1 and migration into inflammatory sites. J. Immunol. 163:3746–3752. [PubMed] [Google Scholar]
- 14.Lim, Y.C., H. Xie, C.E. Come, S.I. Alexander, M.J. Grusby, A.H. Lichtman, and F.W. Luscinskas. 2001. IL-12, STAT4-dependent up-regulation of CD4(+) T cell core 2 beta-1,6-n-acetylglucosaminyltransferase, an enzyme essential for biosynthesis of P-selectin ligands. J. Immunol. 167:4476–4484. [DOI] [PubMed] [Google Scholar]
- 15.White, S.J., G.H. Underhill, M.H. Kaplan, and G.S. Kansas. 2001. Differential requirements for Stat4 in expression of glycosyltransferases responsible for selectin ligand formation in Th1 cells. J. Immunol. 167:628–631. [DOI] [PubMed] [Google Scholar]
- 16.Tietz, W., Y. Allemand, E. Borges, D. von Laer, R. Hallmann, D. Vestweber, and A. Hamann. 1998. CD4+ T cells migrate into inflamed skin only if they express ligands for E- and P-selectin. J. Immunol. 161:963–970. [PubMed] [Google Scholar]
- 17.Austrup, F., D. Vestweber, E. Borges, M. Lohning, R. Brauer, U. Herz, H. Renz, R. Hallmann, A. Scheffold, A. Radbruch, and A. Hamann. 1997. P- and E-selectin mediate recruitment of T-helper-1 but not T-helper-2 cells into inflamed tissues. Nature. 385:81–83. [DOI] [PubMed] [Google Scholar]
- 18.Hirata, T., G. Merrill-Skoloff, M. Aab, J. Yang, B.C. Furie, and B. Furie. 2000. P-Selectin glycoprotein ligand 1 (PSGL-1) is a physiological ligand for E-selectin in mediating T helper 1 lymphocyte migration. J. Exp. Med. 192:1669–1676. [DOI] [PMC free article] [PubMed] [Google Scholar]
- 19.Subramaniam, M., S. Saffaripour, S.R. Watson, T.N. Mayadas, R.O. Hynes, and D.D. Wagner. 1995. Reduced recruitment of inflammatory cells in a contact hypersensitivity response in P-selectin-deficient mice. J. Exp. Med. 181:2277–2282. [DOI] [PMC free article] [PubMed] [Google Scholar]
- 20.Labow, M.A., C.R. Norton, J.M. Rumberger, K.M. Lombard-Gillooly, D.J. Shuster, J. Hubbard, R. Bertko, P.A. Knaack, R.W. Terry, and M.L. Harbison. 1994. Characterization of E-selectin-deficient mice: demonstration of overlapping function of the endothelial selectins. Immunity. 1:709–720. [DOI] [PubMed] [Google Scholar]
- 21.Staite, N.D., J.M. Justen, L.M. Sly, A.L. Beaudet, and D.C. Bullard. 1996. Inhibition of delayed-type contact hypersensitivity in mice deficient in both E-selectin and P-selectin. Blood. 88:2973–2979. [PubMed] [Google Scholar]
- 22.Erdmann, I., E.P. Scheidegger, F.K. Koch, L. Heinzerling, B. Odermatt, G. Burg, J.B. Lowe, and T.M. Kundig. 2002. Fucosyltransferase VII-deficient mice with defective E-, P-, and L-selectin ligands show impaired CD4+ and CD8+ T cell migration into the skin, but normal extravasation into visceral organs. J. Immunol. 168:2139–2146. [DOI] [PubMed] [Google Scholar]
- 23.Binns, R.M., A. Whyte, S.T. Licence, A.A. Harrison, Y.T. Tsang, D.O. Haskard, and M.K. Robinson. 1996. The role of E-selectin in lymphocyte and polymorphonuclear cell recruitment into cutaneous delayed hypersensitivity reactions in sensitized pigs. J. Immunol. 157:4094–4099. [PubMed] [Google Scholar]
- 24.Silber, A., W. Newman, V.G. Sasseville, D. Pauley, D. Beall, D.G. Walsh, and D.J. Ringler. 1994. Recruitment of lymphocytes during cutaneous delayed hypersensitivity in nonhuman primates is dependent on E-selectin and vascular cell adhesion molecule 1. J. Clin. Invest. 93:1554–1563. [DOI] [PMC free article] [PubMed] [Google Scholar]
- 25.Campbell, D.J., C.H. Kim, and E.C. Butcher. 2001. Separable effector T cell populations specialized for B cell help or tissue inflammation. Nat. Immunol. 2:876–881. [DOI] [PubMed] [Google Scholar]
- 26.Picker, L.J., L.W. Terstappen, L.S. Rott, P.R. Streeter, H. Stein, and E.C. Butcher. 1990. Differential expression of homing-associated adhesion molecules by T cell subsets in man. J. Immunol. 145:3247–3255. [PubMed] [Google Scholar]
- 27.Topham, D.J., M.R. Castrucci, F.S. Wingo, G.T. Belz, and P.C. Doherty. 2001. The role of antigen in the localization of naive, acutely activated, and memory CD8(+) T cells to the lung during influenza pneumonia. J. Immunol. 167:6983–6990. [DOI] [PubMed] [Google Scholar]
- 28.Cross, A.H., T. O'Mara, and C.S. Raine. 1993. Chronologic localization of myelin-reactive cells in the lesions of relapsing EAE: implications for the study of multiple sclerosis. Neurology. 43:1028–1033. [DOI] [PubMed] [Google Scholar]
- 29.Liu, C.P., K. Jiang, C.H. Wu, W.H. Lee, and W.J. Lin. 2000. Detection of glutamic acid decarboxylase-activated T cells with I-Ag7 tetramers. Proc. Natl. Acad. Sci. USA. 97:14596–14601. [DOI] [PMC free article] [PubMed] [Google Scholar]
- 30.Masopust, D., V. Vezys, A.L. Marzo, and L. Lefrancois. 2001. Preferential localization of effector memory cells in nonlymphoid tissue. Science. 291:2413–2417. [DOI] [PubMed] [Google Scholar]
- 31.Murphy, K.M., A.B. Heimberger, and D.Y. Loh. 1990. Induction by antigen of intrathymic apoptosis of CD4+ CD8+TCRlo thymocytes in vivo. Science. 250:1720–1723. [DOI] [PubMed] [Google Scholar]
- 32.Barnden, M.J., J. Allison, W.R. Heath, and F.R. Carbone. 1998. Defective TCR expression in transgenic mice constructed using cDNA-based alpha- and beta-chain genes under the control of heterologous regulatory elements. Immunol. Cell Biol. 76:34–40. [DOI] [PubMed] [Google Scholar]
- 33.Bullard, D.C., E.J. Kunkel, H. Kubo, M.J. Hicks, I. Lorenzo, N.A. Doyle, C.M. Doerschuk, K. Ley, and A.L. Beaudet. 1996. Infectious susceptibility and severe deficiency of leukocyte rolling and recruitment in E-selectin and P-selectin double mutant mice. J. Exp. Med. 183:2329–2336. [DOI] [PMC free article] [PubMed] [Google Scholar]
- 34.Haskins, K., R. Kubo, J. White, M. Pigeon, J. Kappler, and P. Marrack. 1983. The major histocompatibility complex-restricted antigen receptor on T cells. I. Isolation with a monoclonal antibody. J. Exp. Med. 157:1149–1169. [DOI] [PMC free article] [PubMed] [Google Scholar]
- 35.Southern, P.J., P. Blount, and M.B. Oldstone. 1984. Analysis of persistent virus infections by in situ hybridization to whole-mouse sections. Nature. 312:555–558. [DOI] [PubMed] [Google Scholar]
- 36.Khoruts, A., A. Mondino, K.A. Pape, S.L. Reiner, and M.K. Jenkins. 1998. A natural immunological adjuvant enhances T cell clonal expansion through a CD28-dependent, interleukin (IL)-2-independent mechanism. J. Exp. Med. 187:225–236. [DOI] [PMC free article] [PubMed] [Google Scholar]
- 37.Penit, C., and F. Vasseur. 1997. Expansion of mature thymocyte subsets before emigration to the periphery. J. Immunol. 159:4848–4856. [PubMed] [Google Scholar]
- 38.Warren, H.S., F.R. Vogel, and L.A. Chedid. 1986. Current status of immunological adjuvants. Annu. Rev. Immunol. 4:369–388. [DOI] [PubMed] [Google Scholar]
- 39.Kearney, E.R., K.A. Pape, D.Y. Loh, and M.K. Jenkins. 1994. Visualization of peptide-specific T cell immunity and peripheral tolerance induction in vivo. Immunity. 1:327–339. [DOI] [PubMed] [Google Scholar]
- 40.Mackay, C.R., D.P. Andrew, M. Briskin, D.J. Ringler, and E.C. Butcher. 1996. Phenotype, and migration properties of three major subsets of tissue homing T cells in sheep. Eur. J. Immunol. 26:2433–2439. [DOI] [PubMed] [Google Scholar]
- 41.Mackay, C., W. Marston, and L. Dudler. 1990. Naive and memory T cells show distinct pathways of lymphocyte recirculation. J. Exp. Med. 171:801–817. [DOI] [PMC free article] [PubMed] [Google Scholar]
- 42.Lyons, A.B., and C.R. Parish. 1994. Determination of lymphocyte division by flow cytometry. J. Immunol. Methods. 171:131–137. [DOI] [PubMed] [Google Scholar]
- 43.Campbell, D.J., and E.C. Butcher. 2002. Rapid acquisition of tissue-specific homing phenotypes by CD4(+) T cells activated in cutaneous or mucosal lymphoid tissues. J. Exp. Med. 195:135–141. [DOI] [PMC free article] [PubMed] [Google Scholar]
- 44.Todderud, G., J. Alford, K.A. Millsap, A. Aruffo, and K.M. Tramposch. 1992. PMN binding to P-selectin is inhibited by sulfatide. J. Leukoc. Biol. 52:85–88. [DOI] [PubMed] [Google Scholar]
- 45.Marshall, D.R., S.J. Turner, G.T. Belz, S. Wingo, S. Andreansky, M.Y. Sangster, J.M. Riberdy, T. Liu, M. Tan, and P.C. Doherty. 2001. Measuring the diaspora for virus-specific CD8+ T cells. Proc. Natl. Acad. Sci. USA. 98:6313–6318. [DOI] [PMC free article] [PubMed] [Google Scholar]
- 46.Moser, B., and P. Loetscher. 2001. Lymphocyte traffic control by chemokines. Nat. Immunol. 2:123–128. [DOI] [PubMed] [Google Scholar]
- 47.Geng, J.G., M.P. Bevilacqua, K.L. Moore, T.M. McIntyre, S.M. Prescott, J.M. Kim, G.A. Bliss, G.A. Zimmerman, and R.P. McEver. 1990. Rapid neutrophil adhesion to activated endothelium mediated by GMP-140. Nature. 343:757–760. [DOI] [PubMed] [Google Scholar]
- 48.Groves, R.W., M.H. Allen, J.N. Barker, D.O. Haskard, and D.M. MacDonald. 1991. Endothelial leucocyte adhesion molecule-1 (ELAM-1) expression in cutaneous inflammation. Br. J. Dermatol. 124:117–123. [DOI] [PubMed] [Google Scholar]
- 49.Silber, A., W. Newman, K.A. Reimann, E. Hendricks, D. Walsh, and D.J. Ringler. 1994. Kinetic expression of endothelial adhesion molecules and relationship to leukocyte recruitment in two cutaneous models of inflammation. Lab. Invest. 70:163–175. [PubMed] [Google Scholar]
- 50.Streeter, P.R., E.L. Berg, B.T. Rouse, R.F. Bargatze, and E.C. Butcher. 1988. A tissue-specific endothelial cell molecule involved in lymphocyte homing. Nature. 331:41–46. [DOI] [PubMed] [Google Scholar]
- 51.Hirata, T., B.C. Furie, and B. Furie. 2002. P-, E-, and L-selectin mediate migration of activated CD8+ T lymphocytes into inflamed skin. J. Immunol. 169:4307–4313. [DOI] [PubMed] [Google Scholar]
- 52.Kulidjian, A.A., A.C. Issekutz, and T.B. Issekutz. 2002. Differential role of E-selectin and P-selectin in T lymphocyte migration to cutaneous inflammatory reactions induced by cytokines. Int. Immunol. 14:751–760. [DOI] [PubMed] [Google Scholar]
- 53.Bevilacqua, M.P., S. Stengelin, M.A. Gimbrone, Jr., and B. Seed. 1989. Endothelial leukocyte adhesion molecule 1: an inducible receptor for neutrophils related to complement regulatory proteins and lectins. Science. 243:1160–1165. [DOI] [PubMed] [Google Scholar]
- 54.St Louis, J.D., J.A. Lederer, and A.H. Lichtman. 1993. Costimulator deficient antigen presentation by an endothelial cell line induces a nonproliferative T cell activation response without anergy. J. Exp. Med. 178:1597–1605. [DOI] [PMC free article] [PubMed] [Google Scholar]
- 55.Girvin, A.M., K.B. Gordon, C.J. Welsh, N.A. Clipstone, and S.D. Miller. 2002. Differential abilities of central nervous system resident endothelial cells and astrocytes to serve as inducible antigen-presenting cells. Blood. 99:3692–3701. [DOI] [PubMed] [Google Scholar]
- 56.Zeine, R., and T. Owens. 1992. Direct demonstration of the infiltration of murine central nervous system by Pgp-1/CD44high CD45RB(low) CD4+ T cells that induce experimental allergic encephalomyelitis. J. Neuroimmunol. 40:57–69. [DOI] [PubMed] [Google Scholar]
- 57.Masopust, D., J. Jiang, H. Shen, and L. Lefrancois. 2001. Direct analysis of the dynamics of the intestinal mucosa CD8 T cell response to systemic virus infection. J. Immunol. 166:2348–2356. [DOI] [PubMed] [Google Scholar]
- 58.Hogan, R.J., E.J. Usherwood, W. Zhong, A.A. Roberts, R.W. Dutton, A.G. Harmsen, and D.L. Woodland. 2001. Activated antigen-specific CD8+ T cells persist in the lungs following recovery from respiratory virus infections. J. Immunol. 166:1813–1822. [DOI] [PubMed] [Google Scholar]
- 59.Deeths, M.J., R.M. Kedl, and M.F. Mescher. 1999. CD8+ T cells become nonresponsive (anergic) following activation in the presence of costimulation. J. Immunol. 163:102–110. [PubMed] [Google Scholar]
- 60.Shrikant, P., A. Khoruts, and M.F. Mescher. 1999. CTLA-4 blockade reverses CD8+ T cell tolerance to tumor by a CD4+ T cell- and IL-2-dependent mechanism. Immunity. 11:483–493. [DOI] [PubMed] [Google Scholar]
- 61.Bird, J.J., D.R. Brown, A.C. Mullen, N.H. Moskowitz, M.A. Mahowald, J.R. Sider, T.F. Gajewski, C.R. Wang, and S.L. Reiner. 1998. Helper T cell differentiation is controlled by the cell cycle. Immunity. 9:229–237. [DOI] [PubMed] [Google Scholar]
- 62.Laouar, Y., and I.N. Crispe. 2000. Functional flexibility in T cells: independent regulation of CD4+ T cell proliferation and effector function in vivo. Immunity. 13:291–301. [DOI] [PubMed] [Google Scholar]