

Abstract
Systemic lupus erythematosus (SLE) is a prototype systemic autoimmune disease characterized by flares of high morbidity. Using oligonucleotide microarrays, we now show that active SLE can be distinguished by a remarkably homogeneous gene expression pattern with overexpression of granulopoiesis-related and interferon (IFN)-induced genes. Using the most stringent statistical analysis (Bonferroni correction), 15 genes were found highly up-regulated in SLE patients, 14 of which are targets of IFN and one, defensin DEFA-3, a major product of immature granulocytes. A more liberal correction (Benjamini and Hochberg correction) yielded 18 additional genes, 12 of which are IFN-regulated and 4 granulocyte-specific. Indeed immature neutrophils were identified in a large fraction of SLE patients white blood cells. High dose glucocorticoids, a standard treatment of disease flares, shuts down the interferon signature, further supporting the role of this cytokine in SLE. The expression of 10 genes correlated with disease activity according to the SLEDAI. The most striking correlation (P < 0.001, r = 0.55) was found with the formyl peptide receptor-like 1 protein that mediates chemotactic activities of defensins. Therefore, while the IFN signature confirms the central role of this cytokine in SLE, microarray analysis of blood cells reveals that immature granulocytes may be involved in SLE pathogenesis.
Keywords: microarray, immature granulocytes, glucocorticoid, leukocytes, autoimmunity
Introduction
Systemic lupus erythematosus (SLE)* affects multiple organs, including the skin, vessels, kidneys, and central nervous system (1, 2). SLE etiopathogenesis has challenged investigators for many years. It is believed that the environment, e.g., viral infections, acts in the context of a wide array of susceptibility genes. Human SLE appears linked to at least 6 gene loci and numerous mouse genetic mutants show SLE-like syndromes (3). This disease, where tolerance to self-components is broken in a systemic fashion, is currently viewed as a dysregulation of T–B cell interactions (4–7). SLE patients paradoxically display polyclonal hypergammaglobulinemia concomitantly with B and T lymphopenia (8, 9). Indeed, human SLE is characterized by high titers of autoantibodies of a wide range of specificities, including nuclear components, DNA, and nucleosomes (10–12). Vasculitis and kidney failure are thought to be immune complex-mediated while other symptoms such as thrombocytopenia are viewed as direct antibody-mediated depletion. Yet, these alterations represent end-points of a dysregulated immune system. Therefore, understanding the early stages of the disease might lead to the development of better therapies, which currently are symptomatic and based on nonspecific immunosuppression i.e., glucocorticoids and chemotherapy. Dendritic cells (DCs; reference 13) are being recognized as critical in the maintenance of peripheral tolerance (14). Therefore, we turned our attention to their potential alteration in pediatric SLE, a disease of high morbidity/mortality. Accordingly, we demonstrated that a fraction of patients display in their blood stream monocytes with properties of DCs, namely the ability to induce allogeneic naive T cells to proliferate (MLR; reference 15). Furthermore, the serum of some patients induced the differentiation of normal monocytes into DCs, an effect mediated by IFN-α. This led us to consider that SLE may be driven by unabated IFN production that activates monocytes into mature DCs able to capture dying cells and present their antigens to autoreactive T/B cells. Yet, only a fraction of patients display circulating IFN-α (16), thereby raising the question of whether this reflects disease heterogeneity. Because IFN-α may represent a major therapeutic target in SLE, as TNF does in arthritis (17), we approached this question by analyzing the genes expressed by patient leukocytes using oligonucleotide microarray technology (18–20). Here we demonstrate that blood mononuclear cells from active SLE patients overexpress IFN-regulated and granulopoiesis-specific genes. The IFN signature is extinguished by treatment with high dose intravenous steroids, further pointing to this cytokine as a specific target for therapeutic intervention.
Materials and Methods
Messenger RNA Samples.
After informed consent (IRB no. 0199017), blood was obtained from pediatric patients who satisfied diagnostic criteria of the American College of Rheumatology (ACR) for SLE and Juvenile Chronic Arthritis (poly-articular, pauci-articular, and systemic) and controls (children visiting the clinic for reasons other than autoimmunity or infectious diseases). Disease activity was assessed by the SLEDAI activity index and determined the day of blood draw. Blood leukocytes were isolated on Ficoll gradient and immediately processed for RNA extraction using the RNeasy kit (QIAGEN) according to the manufacturer's instructions.
Flow Cytometry and Cell Cultures.
A fraction of patients cells was retained for flow cytometry analysis including the determination of T cells, B cells, plasmablasts (CD20−CD19 low CD38 high), monocytes as described earlier (9) and DCs (DC kit; Becton Dickinson). Leukocytes from healthy adults were cultured in RPMI enriched with 5% fetal calf serum for 6 h with or without 1,000 U/ml Interferon a2b (Intron A; Schering-Plough).
Staining of PBMCs and Sorted Granular Cells.
PBMCs were stained with anti-CD14 PE (BD Biosciences) and sorted (FACSVantage™; Becton Dickinson) based on granularity (high forward side scatter/side light scatter) and lack of CD14 expression. Both unsorted PBMCs and sorted cells were allowed to adhere for 1 h on slides previously coated with 0.1 mg/ml of poly-L-lysine (Sigma-Aldrich) for 1 h at room temperature and fixed with 4% paraformaldehyde. After quenching with PBS-glycine (50 mM), cells were permeabilized with Triton X-100 (0.1%), 10 min. They were subsequently washed with PBS-saponin (0.2%) and quenched with PBS-BSA-gelatin fish before staining with FITC-conjugated mouse anti-human myeloperoxidase (DakoCytomation). Cytospins of unsorted and sorted cells were stained with Giemsa or treated with p-phenylenediamine and catechol to detect cytoplasmic myeloperoxidase according to the method described by Hanker et al. (21). Fluorescence labeled cells were mounted in fluoromount mounting medium (Southern Biotechnology Associates, Inc.) for confocal microscopy. All micrographs were recorded using a confocal microscopy system equipped with three Ar488, Kr568, and HeNe633 lasers (TCS-SP; Leica) as well as spectrophotometers using the objectives 63× or 100× PL APO with zoom 2.
Patient Characteristics.
30 pediatric SLE patients, 18 females and 12 males, were enrolled in the study Dec 2001–June 2002. Of these, 13 were Hispanic, 8 African-American, 6 Asian, and 3 Caucasian. This distribution reflects the overall ethnicity of our SLE population in North Texas. The detailed clinical information is provided as online supplemental Table S1.
Microarray Procedures.
Total RNA extracted from samples was used to generate cRNA target using the ENZO kit, subsequently hybridized to human U95A oligonucleotide probe array (Affymetrix, Inc.) according to standard protocols provided by the manufacturer.
Data Analysis.
An absolute expression analysis was performed using Affymetrix MAS 5.0, and the data from 12,626 genes was imported into GeneSpring software (Silicon Genetics) for further analyses. Differentially expressed genes were selected as described in Results.
Online Supplemental Material.
Differentially expressed genes were selected as described in Results. Supplemental Table S1 is available at http://www.jem.org/cgi/content/full/jem.20021553/DC1.
Results
Gene Expression in Blood Leukocytes.
To identify gene expression signatures unique to SLE, we analyzed Ficoll-separated blood mononuclear cells (PBMCs) from three pediatric cohorts: 9 healthy children (age 13 ± 4 yr), 30 SLE patients (age 13 ± 3 yr), and 12 patients with juvenile chronic arthritis (JCA; age 10 ± 3 yr). SLE patients belonged to four ethnicities and included 12 males and 18 females. One patient had been in complete remission (SLE Disease Activity Index [SLEDAI] = 0) for more than 2 yr, 11 patients had minimal disease activity (SLEDAI = 2–4), 10 patients had intermediate disease activity (SLEDAI = 6–10) and 8 patients had high disease activity (SLEDAI = 11–20). The clinical features are provided as supplementary data (Table S1). Of the 12 patients with JCA, 4 had pauci-articular, 5 poly-articular, and 3 the systemic form of the disease.
PBMC cRNA was hybridized to U95AV2 Affymetrix oligonucleotide microarrays containing 12,561 human genes and the data were analyzed with the GeneSpring software. Up to 5,000 genes were expressed, with 4,600 being common to all children. The pattern of expression was remarkably stable among individuals. SLE patients and healthy donors were analyzed using a parametric statistical group comparison incorporating the global error method. Using the most stringent multiple comparison correction for controlling Type I error (Bonferroni correction), 15 genes were found differentially expressed (P < 0.1) between these two populations and highly up-regulated in SLE patients. Strikingly, 14 of 15 genes (Table I) represent either well-known or newly identified targets of interferon. The single non-IFN–regulated gene was defensin, a major product of immature neutrophils. Applying a more liberal correction to the pairwise tests (Benjamini and Hochberg correction) yielded 18 additional genes, 12 of which are known to be IFN-regulated and 4 neutrophil-specific (Table I). Use of the more liberal multiple comparison corrective technique yields an expanded list of genes differentially expressed (P < 0.05) between these two groups to 374 (Fig. 1) . Among these, 210 genes were up-regulated and 141 genes were down-regulated in a majority of patients.
Table I.
Genes Significantly Up-regulated in SLE Patient's Blood Mononuclear Cells
| GenBank accession no. |
Description | Family | Function | P value Bonferroni |
P value Benjamini and Hochberg |
|---|---|---|---|---|---|
| M87434 | 71 kD 2′5′ OIAS | IFN | Antiviral | <0.00001 | <0.0001 |
| AB000115 | GS3686 | IFN | Unknown | <0.0001 | <0.0001 |
| D28195 | Hep C p44 | IFN | Unknown | 0.0001 | <0.0001 |
| X57352 | 1-8U | IFN | Unknown | <0.0002 | <0.0001 |
| M33882 | MX1 | IFN | GTP-ase antiviral | <0.0003 | <0.0001 |
| M30818 | MX2 | IFN | GTP-ase antiviral | <0.002 | <0.0003 |
| U66711 | RIGE/TSA1 | IFN | Signal transduction | <0.01 | <0.001 |
|
AB006746
|
Phospholipid scramblase |
IFN | Transbilayer migration of phospholipids |
<0.03 | <0.003 |
| L12691 | DEFA3 | Neut | Antibacterial | <0.03 | <0.003 |
| X04371 | 2′5′ OIAS E18 isoform | IFN | Antiviral degradation of RNA | <0.03 | <0.003 |
| AL047596 | EST Hute 1 | IFN | Unknown | <0.05 | <0.005 |
| U53831 | IRF 7b | IFN | Transcription activator | <0.05 | <0.005 |
| M97935 | ISGF-3 | IFN | Transcription factor | 0.06 | <0.005 |
| AL022318 | Phorbolin 1 like | IFN | Unknown mRNA editing? | 0.06 | <0.005 |
| U72882 | IF p35 | IFN | Unknown | 0.07 | <0.005 |
| L13210 | MAC-2-BP | IFN | Host defense cell adhesion | <0.02 | |
|
X99699
|
XIAP associated factor 1 |
IFN | Proapoptotic | <0.02 | |
| M13755 | ISG-15 | IFN | Unknown | <0.03 | |
|
X69910
|
p63 transmembrane protein |
Unknown | Membrane trafficking | <0.03 | |
| X54486 | C1 inhibitor | IFN | C1 esterase inhibition | <0.03 | |
|
X55988
|
Eosinophil derived neurotoxin |
Neut | Ribonuclease | <0.04 | |
|
L09708
|
Complement component 2 |
IFN | Complement cascade | <0.05 | |
|
AF016903
|
Agrin | IFN | Aggregation of signaling proteins at the neurological and immunological synapsis |
<0.05 | |
| X57522 | TAP1 | IFN | Antigen presentation | <0.05 | |
| AF026939 | Cig 49 | IFN | Unknown | <0.05 | |
|
AI126134
|
EST similar to calgranulin |
Neut | Calcium binding protein proinflammatory |
<0.05 | |
| AJ225089 | TRIP 14 OIAS | IFN | Antiviral degradation of RNA | <0.05 | |
| U37518 | TRAIL | IFN | Apoptosis | <0.05 | |
|
M84562
|
Formyl peptide receptor-like |
Neut | Neutrophil activation and chemotaxis |
<0.05 | |
| AL036554 | DEFA1 | Neut | Antibacterial | 0.05 | |
| Z38026 | FALL-39 | Neut | Antibacterial | 0.06 | |
|
AB025254
|
Sim to Dros. Tudor |
IFN | Unknown | 0.06 | |
| M24594 | IFI-56 | IFN | Unknown | 0.06 |
Figure 1.
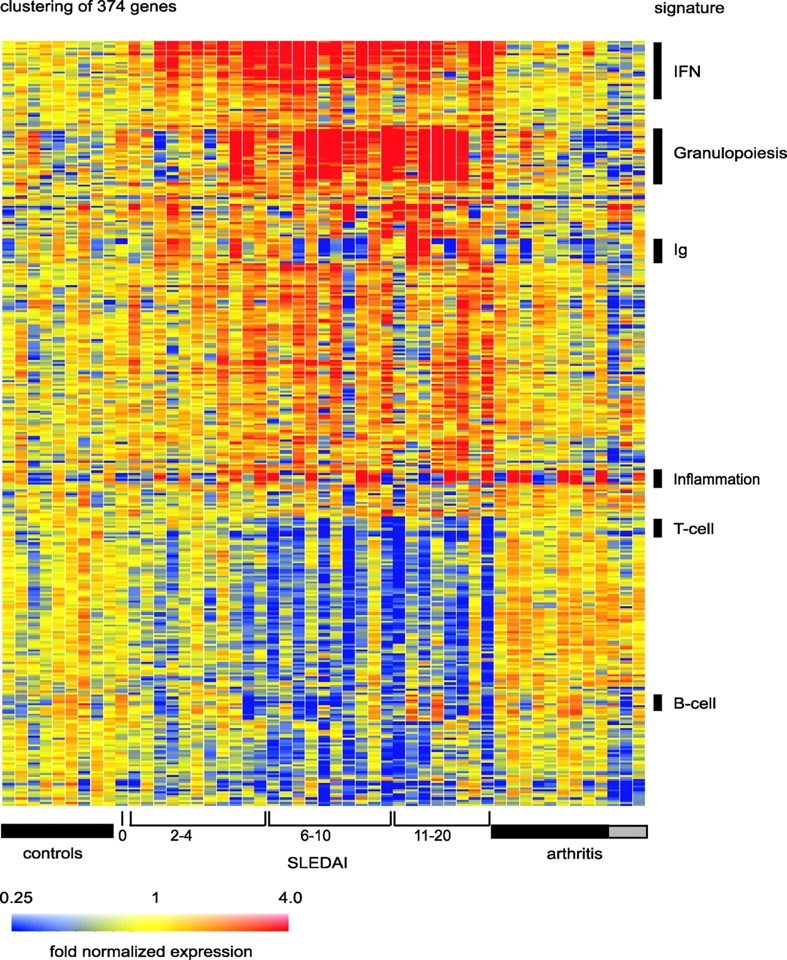
SLE signature. Hierarchical clustering of gene expression data by blood leukocytes of 9 healthy children, 30 with SLE, and 12 with juvenile chronic arthritis including 3 systemic arthritis. The SLE patients have been ranked according to their SLEDAI at time of blood draw. Each row represents a separate gene and each column a separate patient. 374 transcript sequences have been selected which were differentially expressed in SLE by comparison to healthy patients. The normalized expression index for each transcript sequence (rows) in each sample (columns) is indicated by a color code. Red, yellow, and blue squares indicate that expression of the gene is greater than, equal to or less than the mean level of expression across 9 healthy controls. The scale extends from fluorescence ratios of 0.25 to 4.0. Full raw data expression information of the genes in this figure is available upon request to the corresponding authors.
PBMCs from the only patient in complete remission displayed a global gene pattern indistinguishable from that of the healthy controls. Indeed, when compared with the nine healthy individuals, hierarchical clustering spontaneously placed this patient next to the healthy children. Furthermore, patients with JCA did not display the same pattern of expression for these genes. Thus, we have identified a pattern of gene expression that distinguishes SLE from healthy individuals and from other autoimmune diseases. This represents a remarkable finding, as SLE is characterized by significant clinical heterogeneity. A closer analysis of the altered genes permitted the identification of several signatures.
The IFN Signature.
The initial analysis of SLE up-regulated genes showed a striking predominance of genes known to be up-regulated in response to type I IFN. To further delineate whether other genes up- and down-regulated in SLE leukocytes may be previously unrecognized IFN targets, we analyzed the genes expressed in healthy PBMCs cultured with IFN-α (1,000 U/ml, 6 h). Overall, IFN-α altered the expression of 127 genes, up-regulating 92 of them. 46 of these 92 genes were found up-regulated in SLE PBMC. Fig. 2 illustrates the expression of 36 up-regulated and 13 down-regulated genes in both SLE PBMC (left panel) and healthy PBMC exposed to IFN-α (right panel).
Figure 2.
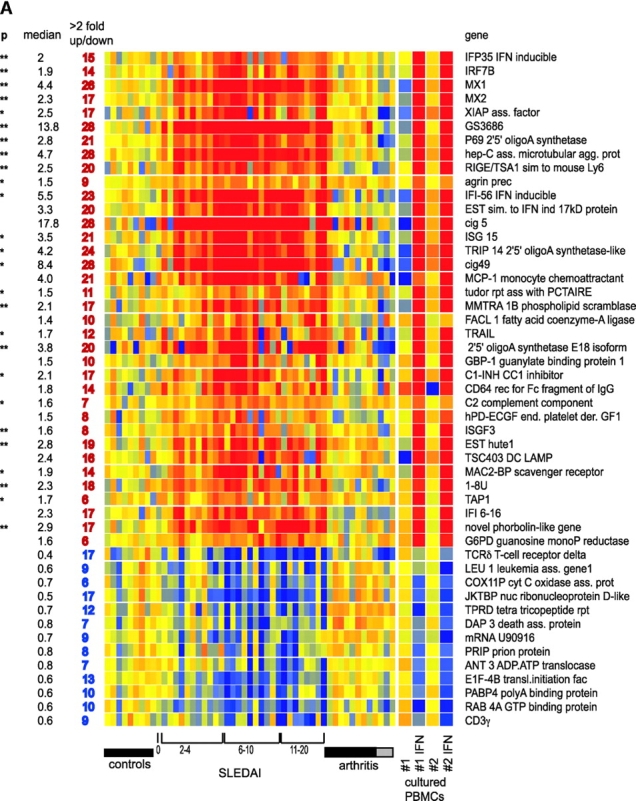

IFN signature. (A) Active SLE patients leukocytes (left panel) display 36 IFN-up-regulated and 13 down-regulated transcript sequences. The same genes are altered in healthy PBMCs cultured in vitro with IFN-α (right panel). Median expression and the number of patients who display more than twofold increase in gene expression. ** Significant after Bonferroni correction, * significant after Benjamini and Hochberg correction. (B) Levels of MCP-1 protein in the 25 available SLE serum samples correlate with the MCP-1 gene expression.
The most commonly up-regulated transcripts (in 28/29 active patients) corresponded to three genes known to be IFN-induced (Cig5, Cig49, and Hepatitis C associated microtubular aggregate protein) and a novel gene (GS3686), which our in vitro studies show as being IFN-regulated as well. The well-known type I IFN response genes MX1 and oligoadenylate synthetase were up-regulated in 26 and 21/29 active SLE patients, respectively.
Further analysis of IFN-α up-regulated genes identified from both in vitro cultures and patient's PBMCs revealed several genes coding for molecules relevant to SLE, including autoantigens (Ro-52 and Lamin 1b) and molecules involved in complement cascade such as C2- and C1-inhibitor. Furthermore, 17/29 SLE PBMCs showed up-regulation of phospholipid scramblase (22), a molecule implicated in the transbilayer movement of plasma membrane phospholipids occurring upon cell injury or apoptosis (23). In this context, TRAIL, an TNF-induced potent effector of apoptosis (24), was up-regulated in 12 of the patients (Fig. 2 A). XAF1 (XIAPAF1), a recently described molecule involved in TRAIL-induced apoptosis (25), was also found to be IFN-induced in vitro and up-regulated in 17/29 SLE patients (Fig. 2 A).
DC-LAMP, a lysosomal transport related molecule specifically expressed in mature DCs (26), was up-regulated by IFN in vitro and found overexpressed in 16/29 SLE PBMCs. Thus, the global gene analysis correlates with our recent finding demonstrating that SLE blood contains monocytes that function as DCs in an IFN-α–dependent fashion (15). Finally, a majority of patients (25/29) overexpressed the IFN-regulated chemokine MCP-1. Accordingly, the levels of MCP-1 protein in 25 available SLE serum samples correlated remarkably well with the level of MCP1 gene expression (r = 0.60, P = 0.0007; Fig. 2 B), thereby corroborating the global gene analysis approach. Taken together the present data reinforce the critical role of interferon in the etiopathogenesis of SLE.
Lymphocytes and DCs.
Numerous lymphocyte-specific transcripts were decreased in SLE PBMCs, an expected finding in line with the lymphopenia that characterizes human SLE. In particular, the pan-T cell genes TCRα/β, p56 lck, CD3γ chain, and SAP were down-regulated in many patients (Fig. 3 A). Pan-B cell (CD20, CD79a/b, and CD22) and naive B cell markers (IgD) were dowregulated in 14 patients.
Figure 3.
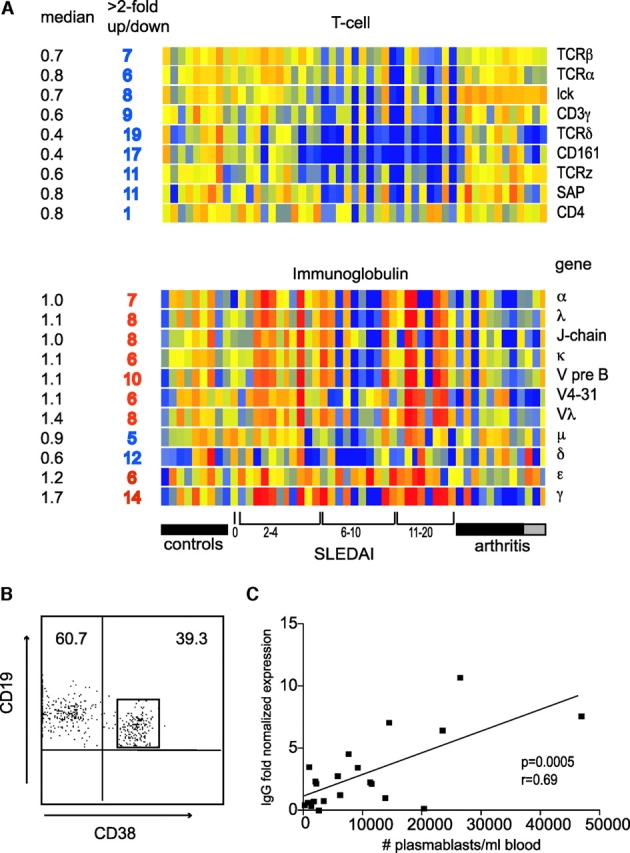
Lymphoid signature: T and B lymphopenia with hypergammaglobulinemia. (A) T cell genes, and the Ig genes. Median expression and the number of patients who display more than twofold increase (red) or decrease (blue) in gene expression. (B) Flow cytometry analysis of purified B cells showing the high frequency of CD19+CD38high plasmablasts. (C) IgG transcript levels correlate with plasmablast numbers.
On the contrary, >2 fold up-regulated transcription of IgG and IgA was found in 14 and 7 patients, respectively, and correlated with their number of circulating plasma blasts/cells (Fig. 3, B and C). There was a strong correlation between increased IgG transcription and gender, as 2/12 males and 12/18 females up-regulated this molecule. Additionally, down-regulated (<2 fold) IgG transcripts were found in 5/12 males but in only 1/18 females (P = 0.009, Chi square with exact P value).
CD161, a marker of NK/NKT cells, was found to be the most significantly decreased (19/30 patients) lineage marker. Two genes specific for activated DCs, DC-LAMP and CD83, were up-regulated in 16 and 6 patients, respectively. Furthermore, TAP1, a critical molecule for MHC class I antigen presentation, was up-regulated in 6 patients (Fig. 2 A) as well as in the in vitro IFN-treated PBMCs, thus extending the list of IFN-regulated genes. This pattern of DC activation molecules is consistent with our previous report demonstrating unabated DCs induction by SLE serum (15).
Signature of Granulopoiesis.
Among the SLE distinctive up-regulated genes, the highest overexpression (over a 100-fold) was found in granulopoiesis-related genes. These could be divided into three categories: enzymes and their inhibitors, bactericidal proteins, including defensins, as well as other molecules such as calcium-binding proteins (Fig. 4 A). 25 patients overexpressed these genes. Accordingly, the average transcription levels of MPO and elastase, two genes preferentially transcribed within the earliest granulocytes (myeloblasts and promyelocytes; reference 27), were 8- and 12-fold higher, respectively, than controls. Conversely, formyl-methionyl-leucyl-phenylalanine receptor-like (F2RPA), a transcript characteristic of mature (band, segmented and polymorphonuclear) cells, was up-regulated only 1.8-fold in SLE compared with healthy controls. Indeed, the neutrophil-specific gene most significantly up-regulated in our patients was defensin-3, a transcript mainly present at the intermediate (myelocyte-metamyelocyte) stages of maturation and absent in polymorphonuclear cells (27).
Figure 4.
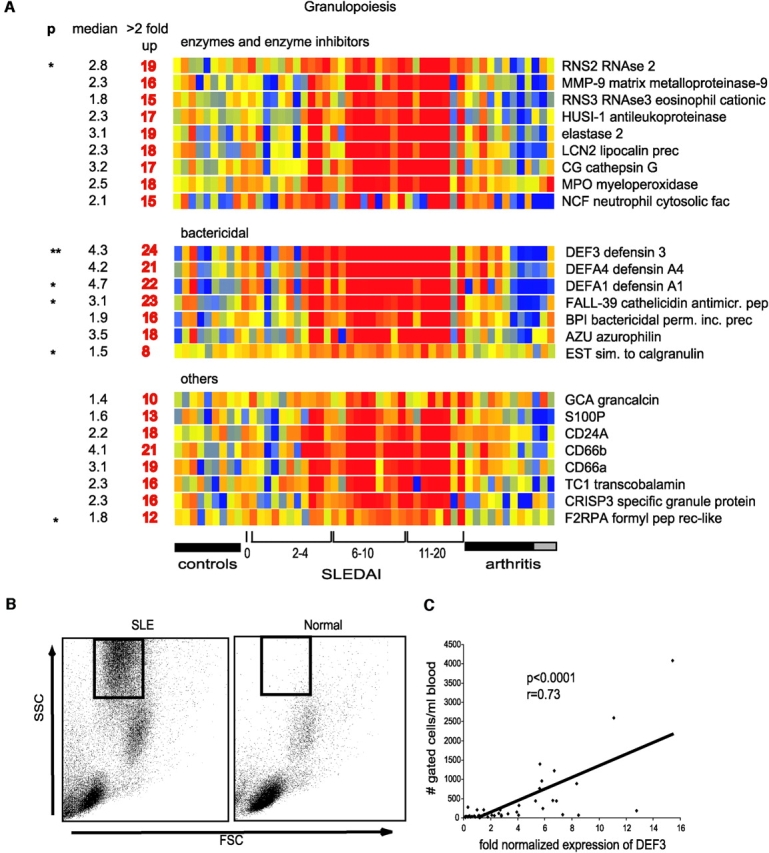
Granulopoiesis signature. (A) Genes have been divided into three categories: enzymes and their inhibitors, bactericidal proteins, and others. Median expression and the number of patients who display more than twofold increase (red) in gene expression. ** Significant after Bonferroni correction, * significant after Benjamini and Hochberg correction. (B) Presence of granular cells in leukocytes that display granulopoiesis-related RNA. Flow cytometry analysis (forward scatter vs. side scatter) of Ficoll-separated mononuclear cells. The gated cells are immature neutrophils. (C) Correlation between the defensin α (DEF3) levels and the numbers of cells gated as shown in B.
The expression of early neutrophil genes was surprising, as Ficoll-separated PBMCs do not normally contain granulocytes. The analysis of flow cytometry data showed that all the patients expressing granulopoiesis-related genes had a population of highly granular cells (Fig. 4 B). A more detailed analysis of these cells has been performed in two additional patients (#31 and #32, not included in the microarray analysis). Fig. 5 shows the scattergram of the PBMCs from patient #31 demonstrating the presence of granular cells (Fig. 5 A) and a Giemsa staining of the same PBMCs (Fig. 5 B) displaying lymphoid and monocytoid-shaped mononuclear cells. Indeed the staining of these PBMCs with a FITC-labeled anti-MPO antibody reveals the presence of two strongly positive cells corresponding to a myelocyte and a band neutrophil (Fig. 5 C). Without the MPO staining, the myelocyte would have been morphologically undistinguishable from a monocyte. We next sorted the high scatter cells and confirmed their lack of expression of monocyte (CD14) lineage markers (Fig. 5 D). Giemsa staining of the sorted cells revealed the presence of cells at all stages of granulocyte development, including pro-myelocytes, myelo- and meta-myelocytes, early and late bands as well as segmented neutrophils (Fig. 5 E). All these cells actually expressed MPO (Fig. 5 F). The PBMCs from an additional patient (#32) were further analyzed by scattergram (Fig. 5 G) and Giemsa staining (Fig. 5 H). An enzymatic assay to reveal MPO (21) was performed and showed the presence of many intensely positive cells. A single field in Fig. 5 I shows three positive cells, one of them displaying a nucleus morphologically undistinguishable from two monocytes present in the same field. The presence of immature granulocytes correlated with the granulopoiesis signature (Fig. 4 C). Furthermore, the data gathered in Table II demonstrates that the granulopoiesis signature cannot be attributed to steroid treatment, as several newly diagnosed, untreated patients displayed both the signature and the cells. Table II also shows that the IFN and granulopoiesis signatures are not necessarily associated.
Figure 5.
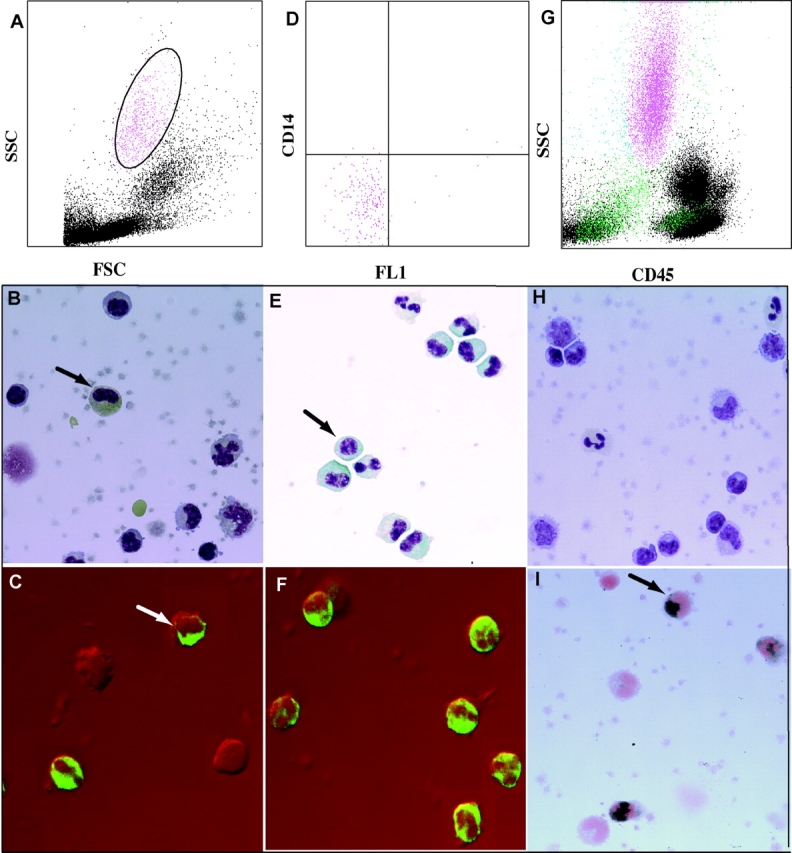
(A) FSC/SSC analysis of SLE patient #31 PBMCs; (B) Giemsa staining of the same PBMCs (arrow indicates possible early granulocyte); (C) confocal analysis of anti-MPO FITC staining of the same PBMCs. A late band/early segmented granulocyte and a metamyelocyte (arrow) are strongly positive for MPO; (D) sorted CD14 negative granular cells from panel A; (E) Giemsa staining of the sorted cells showing multiple mononuclear cells, including a myelocyte (arrow) and several metamyelocytes, bands and segmented neutrophils; (F) confocal analysis with anti-MPO FITC antibodies show that >95% of the sorted cells express MPO; (G) FSC/SSC analysis of the PBMCs for a second SLE patient (#32); (H) Giemsa staining of the PBMCs from the same patient; (I) three cells from the same patient's PBMCs, including one with monocytoid nucleus (arrow), are positive for MPO.
Table II.
Raw Expression Data from Representative IFN and Granulopoiesis Signature Genes in a Subset of SLE Patients
| Granulopoiesis signature
|
IFN signature
|
|||||||||||
|---|---|---|---|---|---|---|---|---|---|---|---|---|
| SLE patient no. |
SLE DAI |
Treatment | % Granulocytes |
MPO | Elastase | DEF3 | DEFA1 | F2RPA | 2′5′ OIAS | GS3686 | HepC p44 |
MX1 |
| 30 | 20 | N*
|
22.1 |
249
(3.2) |
312
(3.1) |
15704
(4.5) |
5064
(6.8) |
843
(4.1) |
2876
(3.6) |
4416
(25.2) |
5176
(14.5) |
3775
(10.0) |
| 27 | 12 | Y | 14.6 |
3539
(49.3) |
5847
(63.6) |
26594
(8.4) |
29984
(43.6) |
192
(1.0) |
1157
(1.6) |
1384
(8.6) |
1569
(4.8) |
666
(1.9) |
| 26 | 12 | N*
|
15.4 |
2203
(33.6) |
6115
(73.0) |
11414
(3.9) |
11454
(18.3) |
333
(1.9) |
1842
(2.8) |
1334
(9.0) |
744
(2.5) |
1337
(4.2) |
| 25 | 12 | N*
|
11.0 |
862
(9.8) |
2813
(25.0) |
59928
(15.4) |
30013
(35.8) |
665
(2.9) |
1615
(2.9) |
3285
(16.6) |
2074
(5.2) |
3903
(9.2) |
| 24 | 12 | N*
|
4.3 |
183
(2.6) |
419
(4.7) |
12591
(4.1) |
1539
(2.3) |
366
(2.0) |
2098
(3.0) |
2005
(12.8) |
1784
(5.6) |
2976
(8.9) |
| 23 | 11 | N*
|
13.7 |
754
(6.9) |
1297
(9.3) |
53375
(11.1) |
19953
(19.2) |
696
(2.5) |
1418
(1.3) |
1173
(4.8) |
1830
(3.7) |
1652
(3.1) |
| 22 | 10 | Y | 30.5 |
3765
(53.7) |
6911
(77.0) |
20815
(6.7) |
23042
(34.4) |
365
(2.0) |
1704
(2.4) |
2171
(13.8) |
1090
(3.4) |
1342
(4.0) |
| 17 | 8 | Y | 8.2 |
963
(9.6) |
1055
(8.2) |
32365
(7.3) |
3701
(3.9) |
449
(1.7) |
4071
(4.0) |
3266
(14.5) |
2142
(4.7) |
1127
(2.3) |
| 15 | 8 | Y | 6.5 |
168
(2.3) |
285
(3.0) |
18265
(5.6) |
3700
(5.3) |
531
(2.8) |
3463
(4.7) |
2387
(14.5) |
2741
(8.2) |
4385
(12.4) |
| 10 | 4 | Y | 2.2 |
722
(10.0) |
1552
(16.8) |
27089
(8.5) |
11268
(16.3) |
388
(2.0) |
1299
(1.8) |
703
(4.3) |
795
(2.4) |
826
(2.4) |
| 29 | 18 | N | 0.7 |
70
(1.0) |
56
(0.6) |
2414
(0.8) |
463
(0.7) |
133
(0.7) |
2822
(4.0) |
3751
(24.1) |
2391
(7.5) |
2944
(8.8) |
| 14 | 8 | Y | 1.1 |
68
(0.8) |
52
(0.5) |
10499
(2.8) |
1035
(1.3) |
265
(1.2) |
4360
(5.0) |
5211
(27.2) |
3627
(9.3) |
5214
(12.7) |
| 7 | 2 | N*
|
0.6 |
107
(1.6) |
88
(1.0) |
6026
(2.1) |
1868
(3.0) |
144
(0.8) |
1713
(2.6) |
1872
(12.8) |
1132
(3.8) |
1450
(4.6) |
| 5 | 2 | Y | 0.4 |
56
(0.7) |
82
(0.8) |
1827
(0.5) |
479
(0.6) |
462
(2.2) |
2066
(2.5) |
2601
(14.4) |
1562
(4.5) |
2676
(6.9) |
| 4 | 2 | Y | 0.7 |
77
(1.1) |
12
(0.1) |
390
(0.1) |
31
(0.05) |
204
(1.1) |
1742
(2.4) |
1298
(8.2) |
1454
(4.5) |
1021
(3.0) |
| 9 healthy donors | <0.1 |
71
± 22 |
94
± 88 |
3221
± 3004 |
716
± 947 |
186
± 90 |
712
± 116 |
158
± 49 |
322
± 71 |
338
± 67 |
||
The granulopoiesis signature is independent of treatment and is found only in patients with immature granulocytes. Raw signal values with a “per chip” normalization applied are shown in bold; Normalized values are shown in italics. N*, new untreated patient; N, untreated patient; Y, treated patient. % granulocytes: fraction of granular cells from the gated viable cells of the PBMCs isolated over Ficoll.
Whether these cells are essential to SLE pathogenesis remains to be established. However, some of the life-threatening complications of SLE, such as renal failure, vasculitis, and CNS involvement, could actually be related to the release of neutrophil proteolytic enzymes (28).
Microarrays for SLE Patient Follow-up.
Out of 33 SLE-specific genes selected with the Benjamini and Hochberg multiple comparison correction, we could identify a set of 10 whose expression correlated with disease activity according to the SLEDAI (Table III, Fig. 6) . Of these, 8 genes were IFN-regulated and 2 were neutrophil-related. Expression of every one of these genes correlated better with disease activity than serum levels of anti–double-stranded DNA antibodies, a hallmark of SLE (Fig. 6). The most significant correlation (P < 0.001, r = 0.55) was found with the gene encoding F2RPA, which mediates the chemotactic activities of defensins (29) and is mainly transcribed within segmented and polymorphonuclear cells (26; Fig. 6). Longitudinal follow-up of these gene expression levels in our patients will allow us to determine their significance in disease flare prediction. This is of particular importance, as there are no parameters other than clinical symptoms to predict SLE flares.
Table III.
Correlation of Gene Expression with Disease Activity Measured by SLEDAI
| Gene | Family | r | P value |
|---|---|---|---|
| F2RPA | Neutr | 0.55 | 0.0014 |
| ISG15 | IFN | 0.52 | 0.003 |
| Cig49 | IFN | 0.50 | 0.0048 |
| HepC microtubular Agg | IFN | 0.49 | 0.0059 |
| TRIP 14 | IFN | 0.48 | 0.0069 |
| MX1 | IFN | 0.43 | 0.01 |
| Phospholipid scramblase 1 | IFN | 0.41 | 0.02 |
| XIAPAF 1 | IFN | 0.41 | 0.02 |
| DEFA3 | Neutr | 0.39 | 0.03 |
| RIGE/TSA 1 | IFN | 0.38 | 0.03 |
r, Pearson correlation coefficient.
Figure 6.

Correlation of gene expression and disease activity as measured by SLEDAI. Two IFN-induced genes (Cig49 and phospholipid scramblase 1) and a granulocyte-related gene (F2RPA) correlate significantly with SLEDAI. These particular genes are selected from those in Table III to illustrate different families. By comparison, there is no correlation of serum levels of anti-double stranded DNA antibodies with disease activity.
Glucocorticoid Treatment Extinguishes the IFN Signature in SLE Leukocytes.
Glucocorticoids (GCs) constitute the standard therapy of SLE. We usually administer low dose oral prednisone (≤0.5 mg/kg/day) to avoid the considerable side effects of this type of medication. This therapy is unfortunately insufficient to keep children with SLE in remission, and flaring of the disease is frequent. Flares can be controlled with high dose glucocorticoid intravenous pulses (30 mg methylprednisolone/kg/day for 3 consecutive days). We analyzed the PBMCs of three patients before and after such treatment. As shown in Fig. 7 , all patients showed a highly significant down-regulation of IFN-regulated genes after the pulse. Yet, granulocyte-related genes were not extinguished. These data therefore raise the intriguing possibility that glucocorticoids, broad inhibitors of immune cell functions (30), may act in SLE treatment through the blocking of IFN activity.
Figure 7.

Extinction of IFN signature after steroid infusion. Analysis of PBMCs from 3 patients (#30, 25, and 5, see online Table S1) before and after (1–4 d) treatment with high dose intravenous GC (1g/day for 3 d). All patients show down-regulation of IFN-regulated genes. P values on the right indicate significance of the gene expression level before and after GC (paired t test). Patient #5 did not display granulopoiesis signature before high dose GC therapy, 2 other patients do not show alteration in granulocyte-related genes following high dose GC therapy.
Discussion
This study demonstrates that the majority (29/30) of children suffering from SLE display a signature of IFN exposure in their blood cells, therefore reinforcing the role of IFN-α in the pathogenesis of this disease (15, 31, 32). Thus, in spite of being clinically heterogeneous, all active SLE patients regardless of age, gender, and ethnicity have a signature of IFN exposure. Importantly, many of the IFN-α targets represent molecules that have long been associated to SLE pathogenesis. For example, the IFN up-regulated Ro-52 is one of the hallmark antigens in this disease, and autoantibodies against this molecule are routinely measured in SLE patients (1, 2). The up-regulation of IFN-induced phospholipid scramblase, TRAIL and XIAPAF1 provides a link to the current association of SLE with dysregulation of apoptosis and/or handling of apoptotic cells (33). Increased expression of genes coding for TAP1 and DC-LAMP may be relevant for autoantigen presentation. Our studies also show that high dose IV steroid treatment, one of the most effective treatments of SLE flares, efficiently down-regulates the IFN-α signature in SLE leukocytes. This reinforces the importance of targeting IFN to treat this disease, especially as most available therapies, especially glucocorticoids, carry severe morbidity and dramatic life-long side effects, particularly in children.
Microarray analysis appears to provide a more faithful indication of exposure of blood cells to IFN than the measurement of IFN in SLE patient's serum. In our previous study, we detected increased levels of IFN-α by ELISA in 10/20 patients (15). Our current microarray analysis revealed that 29/30 patients had evidence of exposure to this cytokine. Several factors may contribute to the lower sensitivity of the IFN serum assay(s). SLE patients, for example, have been shown to display anti-IFN antibodies in their serum (34) that may interfere with ELISA measurements. Additionally, the antibody used for ELISA detection may not react with all the IFN species that may circulate in the blood. Finally, our lack of detection of significant IFN-α transcripts in the SLE patient's PBMCs and the reported presence of plasmacytoid DCs in the skin lesions of SLE patients support that this cytokine may be mainly produced in the patient's tissues (35, 36).
In addition to the IFN signature, we observed a significant up-regulation of granulocyte-specific transcripts within SLE-PBMC RNA. This “granulocyte signature” was traced down to the presence of highly granular cells that copurified with mononuclear cells during density gradient centrifugation. Low density neutrophils have been previously described in the blood of patients with SLE (37). The highly granular cells that we observe in our patients seem to correspond, however, to granulocytes at different stages of maturation, from myelocytes to polymorphonuclear cells. Giemsa and MPO stainings of PBMCs and CD14-negative granular cells, together with the granulocyte-specific gene transcription pattern that we obtained, support indeed the predominance of immature cells (27). Low density, mature granulocytes may be contributing, however, to the disease pathogenesis, as the transcription levels of F2RPA, a mature neutrophil transcript, displayed the best correlation with SLE disease activity as measured by the SLEDAI.
Stress and demargination are a well known cause of neutrophilia, but they usually yield neutrophils with characteristics of polymorphonuclear cells (38). Demargination is also associated with steroid treatment. The cells that we describe, however, preferentially transcribe genes characteristic of immature bone marrow precursors. Furthermore, these cells are present not only regardless of steroid treatment, but we find them at the highest levels in new, untreated patients (Table II).
Our in vitro experiments support that mononuclear cells, i.e., monocytes and lymphocytes, are the main cells responsible for the IFN-α signature. In fact, PBMCs from healthy donors, which do not display the low density granulocyte population, up-regulate the same set of genes upon incubation with IFN for 6 h. Additionally, the IFN signature is evident in five patients who lack the highly granular population and therefore the neutrophil-specific genes (Table II). Further experiments to assess the contribution of individual cell population to the SLE blood signatures are currently underway.
Hypergammaglobulinemia and immune complex formation represent two classical features of SLE. Pediatric SLE patients, however, display reduced numbers of blood mature lymphocytes and a concomitant expansion of plasma cell precursors (9). Our current studies confirm these alterations, as we found down-regulation of pan-lymphocyte markers. Additionally, up to half of our patients displayed a blood plasma cell signature with increased transcription of immunoglobulin genes. Interestingly, there was a statistically significant correlation between increased IgG transcription and female gender, as of the 12 males in our study, only 2 had increased blood IgG while 5 showed a global reduction of Ig transcripts. This is the only gender associated signature in our study, as both IFN and granulocyte-specific genes were equally present in males and females.
We propose that SLE prone patients cells, perhaps as the result of complex genetic alterations associated to the disease, produce IFN in an unabated fashion. Alternatively SLE patients may carry a persistent stimulus, i.e., a virus, that may drive overproduction of IFN. Regardless of the mechanism leading to its excess, IFN turns on the adaptive immune system through the activation of DCs, leading to a break of tolerance to self antigens. Concomitantly, IFN may mobilize the innate immune system, as illustrated by the accumulation of low-density neutrophils in the circulation, possibly via induction of endogenous G-CSF (39, 40). These cells are rarely found in the blood under normal circumstances, and their presence in large amounts may reflect their recruitment to sites of inflammation where immune complexes are deposited. There, they may contribute to tissue damage through the release of potent proteases, possibly following immune complex triggering (41). Indeed, it has been shown that neutrophils may be associated to kidney disease as well as to vasculitis in SLE patients (42, 43). Furthermore, immature neutrophils may be dying outside their natural microenvironment and thus may represent a major source of nuclear autoantigens (44). The latter will be captured by IFN-α activated DCs and presented to autoreactive lymphocytes, thus closing the circle.
The present study, using SLE as a prototype autoimmune disease, demonstrates the power of analyzing blood samples with microarrays. Indeed, white blood cells are immune cells from either the innate immune system (granulocytes, NK cells) or the adaptive immune system (T and B lymphocytes) or both (monocytes and DCs). Our study shows that microarray analysis of blood may identify etiopathogenic factors and predictors of disease activity. This approach may be applied to many other diseases of the immune system and beyond.
Acknowledgments
We thank Florence Allantraz and Jean-Phillipe Blanck for technical assistance, Sandra Clayton for confocal analysis, Gretchen Moore for MPO staining, and Windy Allman for reading the chips. We thank Drs. Charles Timmons and Michelle Gill for stimulating discussions and Drs. L.C. Roy and A. Naveed from Children's Medical Center for their invaluable help with the statistical analysis. We thank Dr. Michael Ramsay and Kathy Brooks for their active support and Drs. Sophie Koutouzov, Alexis Mathian, and Bernard Piqueras for comments on the manuscript.
Supported by grants from the Baylor Health Care System Foundation to J. Banchereau and National Institutes of Health R01 AR46589-01 and NOI-AI-05412 to V. Pascual.
J. Banchereau and V. Pascual codirected the work.
Footnotes
Abbreviations used in this paper: DC, dendritic cell; JCA, juvenile chronic arthritis; SLE, systemic lupus erythematosus.
References
- 1.Kammer, G.M., and G.C. Tsokos. 1999. Lupus: Molecular and Cellular Pathogenesis. Humana Press, Totowa, NJ. 728 pp.
- 2.Lahita, R.G. 1999. Systemic Lupus Erythematosus. Academic Press. 3rd edition. San Diego, CA. 1051 pp.
- 3.Wakeland, E.K., K. Liu, R.R. Graham, and T.W. Behrens. 2001. Delineating the genetic basis of systemic lupus erythematosus. Immunity. 15:397–408. [DOI] [PubMed] [Google Scholar]
- 4.Shlomchik, M.J., J.E. Craft, and M.J. Mamula. 2001. From T to B and back again: positive feedback in systemic autoimmune disease. Nat. Rev. Immunol. 1:147–153. [DOI] [PubMed] [Google Scholar]
- 5.Davidson, A., and B. Diamond. 2001. Autoimmune diseases. N. Engl. J. Med. 345:340–350. [DOI] [PubMed] [Google Scholar]
- 6.Freed, J.H., A. Marrs, J. VanderWall, P.L. Cohen, and R.A. Eisenberg. 2000. MHC class II-bound self peptides from autoimmune MRL/lpr mice reveal potential T cell epitopes for autoantibody production in murine systemic lupus erythematosus. J. Immunol. 164:4697–4705. [DOI] [PubMed] [Google Scholar]
- 7.Kaliyaperumal, A., M.A. Michaels, and S.K. Datta. 2002. Naturally processed chromatin peptides reveal a major autoepitope that primes pathogenic T and B cells of lupus. J. Immunol. 168:2530–2537. [DOI] [PubMed] [Google Scholar]
- 8.Lipsky, P.E. 2001. Systemic lupus erythematosus: an autoimmune disease of B cell hyperactivity. Nat. Immunol. 2:764–766. [DOI] [PubMed] [Google Scholar]
- 9.Arce, E., D.G. Jackson, M.A. Gill, L.B. Bennett, J. Banchereau, and V. Pascual. 2001. Increased frequency of pre-germinal center b cells and plasma cell precursors in the blood of children with systemic lupus erythematosus. J. Immunol. 167:2361–2369. [DOI] [PubMed] [Google Scholar]
- 10.Rubin, R.L., F.L. Tang, E.K. Chan, K.M. Pollard, G. Tsay, and E.M. Tan. 1986. IgG subclasses of autoantibodies in systemic lupus erythematosus, Sjogren's syndrome, and drug-induced autoimmunity. J. Immunol. 137:2528–2534. [PubMed] [Google Scholar]
- 11.Casciola-Rosen, L.A., G. Anhalt, and A. Rosen. 1994. Autoantigens targeted in systemic lupus erythematosus are clustered in two populations of surface structures on apoptotic keratinocytes. J. Exp. Med. 179:1317–1330. [DOI] [PMC free article] [PubMed] [Google Scholar]
- 12.Amoura, Z., J.C. Piette, H. Chabre, P. Cacoub, T. Papo, B. Wechsler, J.F. Bach, and S. Koutouzov. 1997. Circulating plasma levels of nucleosomes in patients with systemic lupus erythematosus: correlation with serum antinucleosome antibody titers and absence of clear association with disease activity. Arthritis Rheum. 40:2217–2225. [DOI] [PubMed] [Google Scholar]
- 13.Banchereau, J., F. Briere, C. Caux, J. Davoust, S. Lebecque, Y. Liu, B. Pulendran, and K. Palucka. 2000. Immunobiology of dendritic cells. Annu. Rev. Immunol. 18:767–811. [DOI] [PubMed] [Google Scholar]
- 14.Steinman, R.M., S. Turley, I. Mellman, and K. Inaba. 2000. The induction of tolerance by dendritic cells that have captured apoptotic cells. J. Exp. Med. 191:411–416. [DOI] [PMC free article] [PubMed] [Google Scholar]
- 15.Blanco, P., A.K. Palucka, M. Gill, V. Pascual, and J. Banchereau. 2001. Induction of dendritic cell differentiation by IFN-alpha in systemic lupus erythematosus. Science. 294:1540–1543. [DOI] [PubMed] [Google Scholar]
- 16.Preble, O.T., R.J. Black, R.M. Friedman, J.H. Klippel, and J. Vilcek. 1982. Systemic lupus erythematosus: presence in human serum of an unusual acid-labile leukocyte interferon. Science. 216:429–431. [DOI] [PubMed] [Google Scholar]
- 17.Feldmann, M., and R.N. Maini. 2001. Anti-TNF alpha therapy of rheumatoid arthritis: what have we learned? Annu. Rev. Immunol. 19:163–196. [DOI] [PubMed] [Google Scholar]
- 18.Shaffer, A.L., A. Rosenwald, E.M. Hurt, J.M. Giltnane, L.T. Lam, O.K. Pickeral, and L.M. Staudt. 2001. Signatures of the immune response. Immunity. 15:375–385. [DOI] [PubMed] [Google Scholar]
- 19.Staudt, L.M., and P.O. Brown. 2000. Genomic views of the immune system. Annu. Rev. Immunol. 18:829–859. [DOI] [PubMed] [Google Scholar]
- 20.Nielsen, T.O., R.B. West, S.C. Linn, O. Alter, M.A. Knowling, J.X. O'Connell, S. Zhu, M. Fero, G. Sherlock, J.R. Pollack, et al. 2002. Molecular characterisation of soft tissue tumours: a gene expression study. Lancet. 359:1301–1307. [DOI] [PubMed] [Google Scholar]
- 21.Hanker, J.S., J. Laszlo, and J.O. Moore. 1978. The light microscopic demonstration of hydroperoxidase-positive Phi bodies and rods in leukocytes in acute myeloid leukemia. Histochemistry. 58:241–252. [DOI] [PubMed] [Google Scholar]
- 22.Verhoven, B., R.A. Schlegel, and P. Williamson. 1995. Mechanisms of phosphatidylserine exposure, a phagocyte recognition signal, on apoptotic T lymphocytes. J. Exp. Med. 182:1597–1601. [DOI] [PMC free article] [PubMed] [Google Scholar]
- 23.Zhou, Q., J. Zhao, T. Wiedmer, and P.J. Sims. 2002. Normal hemostasis but defective hematopoietic response to growth factors in mice deficient in phospholipid scramblase 1. Blood. 99:4030–4038. [DOI] [PubMed] [Google Scholar]
- 24.Griffith, T.S., S.R. Wiley, M.Z. Kubin, L.M. Sedger, C.R. Maliszewski, and N.A. Fanger. 1999. Monocyte-mediated tumoricidal activity via the tumor necrosis factor-related cytokine, TRAIL. J. Exp. Med. 189:1343–1354. [DOI] [PMC free article] [PubMed] [Google Scholar]
- 25.Leaman, D.W., M. Chawla-Sarkar, K. Vyas, M. Reheman, K. Tamai, S. Toji, and E.C. Borden. 2002. Identification of X-linked inhibitor of apoptosis-associated factor-1 (XAF1) as and interferon-stimulated gene that augments TRAIL (Apo2L)-induced apoptosis. J Biol Chem. 277:28504–28511. [DOI] [PubMed] [Google Scholar]
- 26.de Saint-Vis, B., J. Vincent, S. Vandenabeele, B. Vanbervliet, J.J. Pin, S. Ait-Yahia, S. Patel, M.G. Mattei, J. Banchereau, S. Zurawski, et al. 1998. A novel lysosome-associated membrane glycoprotein, DC-LAMP, induced upon DC maturation, is transiently expressed in MHC class II compartment. Immunity. 9:325–336. [DOI] [PubMed] [Google Scholar]
- 27.Cowland, J.B., and N. Borregaard. 1999. The individual regulation of granule protein mRNA levels during neutrophil maturation explains the heterogeneity of neutrophil granules. J. Leukoc. Biol. 66:989–995. [DOI] [PubMed] [Google Scholar]
- 28.Niwa, Y., T. Sakane, M. Shingu, and Y. Miyachi. 1985. Role of stimulated neutrophils from patients with systemic lupus erythematosus in tissue injury, with special reference to serum factors and increased active oxygen species generated by neutrophils. Inflammation. 9:163–172. [DOI] [PubMed] [Google Scholar]
- 29.Yang, D., O. Chertov, and J.J. Oppenheim. 2001. Participation of mammalian defensins and cathelicidins in anti-microbial immunity: receptors and activities of human defensins and cathelicidin (LL-37). J. Leukoc. Biol. 69:691–697. [PubMed] [Google Scholar]
- 30.Winoto, A., and D.R. Littman. 2002. Nuclear hormone receptors in T lymphocytes. Cell. 109(Suppl):S57–66. [DOI] [PubMed] [Google Scholar]
- 31.Ronnblom, L., and G.V. Alm. 2001. A pivotal role for the natural interferon alpha-producing cells (plasmacytoid dendritic cells) in the pathogenesis of lupus. J. Exp. Med. 194:F59–F63. [DOI] [PMC free article] [PubMed] [Google Scholar]
- 32.Rozzo, S.J., J.D. Allard, D. Choubey, T.J. Vyse, S. Izui, G. Peltz, and B.L. Kotzin. 2001. Evidence for an interferon-inducible gene, Ifi202, in the susceptibility to systemic lupus. Immunity. 15:435–443. [DOI] [PubMed] [Google Scholar]
- 33.Herrmann, M., R.E. Voll, and J.R. Kalden. 2000. Etiopathogenesis of systemic lupus erythematosus. Immunol. Today. 21:424–426. [DOI] [PubMed] [Google Scholar]
- 34.Suit, B.E., D. Axelrod, H.M. Moutsopoulos, J.L. Decker, and J.J. Hooks. 1983. Detection of anti-interferon antibodies in systemic lupus erythematosus. Clin. Exp. Rheumatol. 1:133–135. [PubMed] [Google Scholar]
- 35.Farkas, L., K. Beiske, F. Lund-Johansen, P. Brandtzaeg, and F.L. Jahnsen. 2001. Plasmacytoid dendritic cells (natural interferon-alpha/beta-producing cells) accumulate in cutaneous lupus erythematosus lesions. Am. J. Pathol. 159:237–243. [DOI] [PMC free article] [PubMed] [Google Scholar]
- 36.Blomberg, S., M.L. Eloranta, B. Cederblad, K. Nordlin, G.V. Alm, and L. Ronnblom. 2001. Presence of cutaneous interferon-alpha producing cells in patients with systemic lupus erythematosus. Lupus. 10:484–490. [DOI] [PubMed] [Google Scholar]
- 37.Hacbarth, E., and A. Kajdacsy-Balla. 1986. Low density neutrophils in patients with systemic lupus erythematosus, rheumatoid arthritis, and acute rheumatic fever. Arthritis Rheum. 29:1334–1342. [DOI] [PubMed] [Google Scholar]
- 38.Hetherington, S.V., and P.G. Quie. 1985. Human polymorphonuclear leukocytes of the bone marrow, circulation, and marginated pool: function and granule protein content. Am. J. Hematol. 20:235–246. [DOI] [PubMed] [Google Scholar]
- 39.Corssmit, E.P., R. Heijligenberg, C.E. Hack, E. Endert, H.P. Sauerwein, and J.A. Romijn. 1997. Effects of interferon-alpha (IFN-alpha) administration on leucocytes in healthy humans. Clin. Exp. Immunol. 107:359–363. [DOI] [PMC free article] [PubMed] [Google Scholar]
- 40.Fukuda, A., H. Kobayashi, K. Teramura, S. Yoshimoto, and N. Ohsawa. 2000. Effects of interferon-alpha on peripheral neutrophil counts and serum granulocyte colony-stimulating factor levels in chronic hepatitis C patients. Cytokines Cell. Mol. Ther. 6:149–154. [DOI] [PubMed] [Google Scholar]
- 41.Coxon, A., X. Cullere, S. Knight, S. Sethi, M.W. Wakelin, G. Stavrakis, F.W. Luscinskas, and T.N. Mayadas. 2001. Fc gamma RIII mediates neutrophil recruitment to immune complexes. a mechanism for neutrophil accumulation in immune-mediated inflammation. Immunity. 14:693–704. [DOI] [PubMed] [Google Scholar]
- 42.Hotta, O., T. Oda, Y. Taguma, H. Kitamura, S. Chiba, S. Miyazawa, and H. Nagura. 1996. Role of neutrophil elastase in the development of renal necrotizing vasculitis. Clin. Nephrol. 45:211–216. [PubMed] [Google Scholar]
- 43.Qasim, F.J., P.W. Mathieson, F. Sendo, S. Thiru, and D.B. Oliveira. 1996. Role of neutrophils in the pathogenesis of experimental vasculitis. Am. J. Pathol. 149:81–89. [PMC free article] [PubMed] [Google Scholar]
- 44.Courtney, P.A., A.D. Crockard, K. Williamson, A.E. Irvine, R.J. Kennedy, and A.L. Bell. 1999. Increased apoptotic peripheral blood neutrophils in systemic lupus erythematosus: relations with disease activity, antibodies to double stranded DNA, and neutropenia. Ann. Rheum. Dis. 58:309–314. [DOI] [PMC free article] [PubMed] [Google Scholar]