

Abstract
We report the identification of two novel minor histocompatibility antigens (mHAgs), encoded by two separate single nucleotide polymorphisms on a single gene, BCL2A1, and restricted by human histocompatibility leukocyte antigen (HLA)-A*2402 (the most common HLA-A allele in Japanese) and B*4403, respectively. Two cytotoxic T lymphocyte (CTL) clones specific for these mHAgs were first isolated from two distinct recipients after hematopoietic cell transplantation. Both clones lyse only normal and malignant cells within the hematopoietic lineage. To localize the gene encoding the mHAgs, two-point linkage analysis was performed on the CTL lytic patterns of restricting HLA-transfected B lymphoblastoid cell lines obtained from Centre d'Etude du Polymorphisme Humain. Both CTL clones showed a completely identical lytic pattern for 4 pedigrees and the gene was localized within a 3.6-cM interval of 15q24.3–25.1 region that encodes at least 46 genes. Of those, only BCL2A1 has been reported to be expressed in hematopoietic cells and possess three nonsynonymous nucleotide changes. Minigene transfection and epitope reconstitution assays with synthetic peptides identified both HLA-A*2402– and B*4403-restricted mHAg epitopes to be encoded by distinct polymorphisms within BCL2A1.
Keywords: minor histocompatibility antigen, hematopoietic cell transplantation, cytotoxic T lymphocyte, graft-versus-leukemia effect, linkage analysis
Introduction
Minor histocompatibility antigens (mHAgs)*are MHC-bound peptides derived from cellular proteins and encoded by normal polymorphic genes (1–3). Minor antigens with expression limited to hematopoietic cells represent attractive candidate targets for immunotherapy to induce favorable graft-versus-leukemia reactions without causing GVHD after hematopoietic cell transplantation (HCT; 3–7). Most mHAgs result from nonsynonymous single nucleotide polymorphisms (SNPs). Because many nonsynonymous polymorphisms have already been identified through genome sequencing, it is reasonable to expect that a similarly large number of mHAgs will eventually be defined. During the past decade only 12 human mHAgs have been identified at the molecular level (7–18) and among these, only 4 are encoded by autosomal genes (7–10, 17, 18). Most of the mHAgs so far characterized are restricted by HLA class I alleles commonly found in Caucasian populations.
Biochemical approaches using mass spectrometry for peptides eluted from HLA molecules (8–13) or cDNA expression cloning (7, 14–16) have been mostly used to identify human mHAgs. In addition, linkage analysis has been used to map the chromosomal locations of genes encoding several mHAgs by using EBV-transformed B cell lines (LCL) derived from genotypically mapped large pedigrees such as the Centre d'Etude du Polymorphisme Humain (CEPH) reference families (19, 20). This approach has become more informative since completion of a draft sequence of the human genome (21).
In this study we used linkage analysis as an initial approach toward identification of mHAgs recognized by two hematopoietic lineage-specific CTL clones, restricted by HLA-A*2402 (phenotype frequency: ∼65% in Japanese) and HLA-B44, respectively (unpublished data and 22). Surprisingly, these two CTL clones showed an identical segregation pattern of lysis among a panel of LCL from four CEPH families but showed distinct patterns among a panel of LCL from Japanese donors. Using linkage analysis and a variety of publicly accessible databases, we have identified a polymorphic gene encoding two mHAg epitopes recognized by these CTL clones. The gene, BCL2A1, which has been reported as an inhibitor of apoptosis (23–30), possesses three SNPs including two that encompass epitopes for the HLA-A*2402– and B*4403-restricted CTL clones. Our results not only show the first demonstration of multiple mHAgs encoded by distinct polymorphic sites on a single autosomal gene, but also the first successful application of the linkage analysis to identify a gene encoding mHAgs.
Materials and Methods
Cell Cultures and Antibodies.
HLA-B9.25 pt4403–restricted CTL clone 3B5/B44 was isolated from day 27 post-HCT PBMC of a recipient (PT03, 53-yr-old woman) receiving her HLA-identical brother's marrow for treatment of chronic myelocytic leukemia in accelerated phase (22). HLA-A*2402–restricted CTL clone 18B3/A24 was isolated from day 43 post-HCT PBMC of a recipient (PT18, 35-yr-old woman) receiving her HLA-identical sister's marrow for treatment of acute myelocytic leukemia in partial remission. An HLA-B*4403–restricted tyrosinase (SEIWRDIDF, amino acid position 192–200; reference 31)-specific CTL clone was generated by stimulating CD8+ cells from healthy donors with peptide-pulsed antigen presenting cells. These CD8+ CTLs were expanded as previously described (32) and frozen until use. LCL lines were derived from the donors and recipients, and normal volunteers. HLA restriction of the CTL clones had been determined by lytic activity against a panel of HLA-genotyped LCL. All blood or tissue samples were collected after written informed consent under a protocol approved by the Institutional Review Board of Aichi Cancer Center. CEPH LCL registered to the 13th International Histocompatibility Working Group (provided by P. Martin, Fred Hutchinson Cancer Research Center, Seattle, WA) were retrovirally transduced with restricting HLA cDNA for HLA-A*2402 or B*4403 by a method previously described (33). Numbers were assigned to each family member by University of Utah (34). LCL were maintained in RPMI 1640 medium (Sigma-Aldrich) supplemented with 10% FCS (Immuno-Biological Laboratory), 2 mM l-glutamine, 1 mM sodium pyruvate, and penicillin/streptomycin. mAbs, W6/32 (anti–pan HLA class I), HDR-1 (anti–HLA-DR), and A11.1M (anti–HLA-A24) were provided by K. Ito (Kurume University, Fukuoka, Japan).
Cytotoxic Assays.
Target cells were labeled with 0.1 mCi 51Cr for 2 h and 103 target cells/well were mixed with CTL at an E/T ratio of 10 (unless otherwise indicated) in a standard 4-h cytotoxicity assay using 96-well round-bottom plates. All assays were performed at least in duplicate. Cells were treated either with 100 U/ml IFN-γ (R&D Systems) or 10 ng/ml TNF-α (Genzyme) for 48 h as indicated. Percent-specific lysis was calculated as follows: (experimental cpm − spontaneous cpm)/(maximum cpm − spontaneous cpm) × 100. When HLA transfectants were used as targets, their nontransfectants were also included to exclude potential cross-recognition of allo-HLA molecules. HLA-A24– or HLA-B44–allospecific CTL were used to confirm the expression of transduced HLA cDNA.
Linkage Analysis and Search for Gene(s) Encoding the mHAgs.
CEPH LCL targets that were lysed by the CTL were scored as expressing the gene encoding the mHAg. Pairwise two-point linkage analysis was conducted using the MLINK subroutine of the FASTLINK (v.4.1p) program (35–39) as previously described (19–21). Cataloged genotypes for the CEPH LCL were obtained from the CEPH database V9.0 (http://www.cephb.fr/cephdb/; references 40 and 41). A codominant autosomal gene model was assumed for the mHAgs trait based on the CTL-defined segregation pattern in the CEPH families. The population frequency of the allele(s) encoding mHAgs was estimated at 0.5 and the penetrance was set at 0.9 as previously reported (21).
A genetic map of the CEPH families was retrieved from the Weizmann Institute of Science (http://bioinformatics.weizmann.ac.il/databases/ceph/). To search for candidate genes encoding the mHAgs in the region deduced from the linkage analysis, the University of California Santa Cruz (UCSC) genome browser (http://genome.ucsc.edu; reference 42) and the Map Viewer (http://www.ncbi.nlm.nih.gov:80/cgi-bin/Entrez/maps.cgi; reference 43) were used. Tissue distributions of gene expression and known sequence polymorphisms of the candidate genes were examined at the SAGEmap (http://www.ncbi.nlm.nih.gov/SAGE) and the dbSNP (http://www.ncbi.nlm.nih.gov/SNP/index.html) to refine the candidate genes.
Genotyping of CEPH LCL.
Primer sequences of selected microsatellite markers were obtained from the National Center for Biotechnology Information (NCBI) UniSTS (http://www.ncbi.nlm.nih.gov/genome/sts/). 10 ng of genomic DNA extracted from individual LCL was amplified in a total volume of 20 μl of 1X buffer (provided) containing 125 μM of each dNTP, 0.5 μM of R110-labeled dUTP (Applied Biosystems), 1.5 mM MgCl2, 0.5 μM of each primer, and 1 unit AmpliTaq Gold DNA polymerase (Applied Biosystems). PCR amplification (28 cycles) was performed on a GeneAmp PCR system 9700 (Applied Biosystems) with a predetermined annealing temperature for each primer pair. The PCR product was then denatured with formamide and the GeneScan 500 TAMRA size standard (Applied Biosystems) at 95°C for 2 min, and was analyzed with the use of an ABI model 310 (Applied Biosystems). Fragment sizes and peak heights were determined automatically by using GeneScan software (version 3.1; Applied Biosystems).
Sequence Analysis of Candidate Genes.
100 ng of genomic DNA was amplified in a total volume of 25 μl of 1X buffer (provided) containing 200 μM of each dNTP, 1.0 mM MgSO4, 0.3 μM of each primer, and 1 unit KOD-Plus-DNA polymerase (Toyobo). The PCR conditions were: 30 cycles of 94°C for 15 s, 58°C for 20 s, and 68°C for 1 min on a GeneAmp PCR system 9700 (Applied Biosystems). Primer sequences used to amplify BCL2A1 exon 1 were as follows: sense, 5′-CAGTGAGCATTCTCAGCACA-3′; antisense, 5′-CTTATAGGTATCCACATCCG-3′. PCR products were purified and directly sequenced with the same primers and BigDye Terminator kit (v3.0; Applied Biosystems) by the use of an ABI PRIZM 3100 (Applied Biosystems).
Construction of Minigenes and Truncated Genes for BCL2A1.
Minigene expression plasmids encoding the minimal or NH2 terminus–extended polypeptides of the predicted epitopes and their antigen-negative counterparts were constructed using the pEAK10 vector (Edge Biosystems) as previously described (10). The constructs all encoded a Kozak sequence and initiator methionine (CCGCC-ATG) and a stop codon (TAG). Pairs of sense and antisense oligonucleotides were designed to form cohesive ends for HindIII and NotI sites at the 5′ and 3′ ends after hybridization, respectively. Expression plasmids encoding the three allelic forms of the exon 1 of the BCL2A1 identified by sequencing as described above were also constructed by RT-PCR using primers as follows (HindIII and NotI sites are underlined, respectively): sense primer, 5′-ATAAGCTTCCACCATGACAGACTGTGAATTTGGA)-3′; antisense primer, 5′-ATGCGGCCGCTCAGCCTCCGTTTTGCCTTAT-3′. All products were ligated into HindIII-NotI cut pEAK10 vector and verified by sequencing. The vectors were then introduced into the donor LCL by electroporation, followed by selection with 0.7 μg/ml puromycin (Edge Bio Systems) for 3 d before use in cytotoxic assays.
Epitope Prediction and Epitope Reconstitution Assays.
Peptides spanning the polymorphic amino acid and predicted to bind with the corresponding HLA molecule by BIMAS software (http://bimas.dcrt.nih.gov/molbio/hla_bind/; reference 44) and/or SYFPEITHI software (http://www.syfpeithi.de; reference 45) were synthesized by standard methods. 51Cr-labeled mHAg− LCL from the HCT donors were incubated for 30 min in medium containing 10-fold serial dilutions of the peptides and 3 μg/ml human β2-microglobulin and then used as target cells in standard cytotoxic assays. For introduction of peptides into the cytosol, 7 × 10⁶ LCL were electroporated in 0.4 ml buffer containing graded concentrations of the peptides at 300 V, 500 μF, and allowed to rest for 1 h at 37°C before 51Cr labeling.
Northern Blot Analysis.
The 35-bp complementary oligonucleotide probe of BCL2A1 exon 1 (5′-CTCCTTATAGGTATCCACATCCGGGGCAATTTGCT-3′) was labeled with γ-32P-dATP using T4 polynucleotide kinase (Invitrogen) and purified with a CentriSep column (Princeton Separations). Human multiple tissue expression array (CLONTECH) was hybridized with the probe for 4 h at 57°C in 10 ml ExpressHyb (CLONTECH) supplemented with 300 μg sheared salmon testis DNA (Sigma-Aldrich). The array was washed in 2 × SSC, 1% SDS four times at room temperature for 15 min, and at 57°C for 10 min. The multiple tissue expression array were exposed to BioMax MS film (Kodak) overnight at −80°C with an intensifying screen.
PCR Analysis of BCL2A1 Gene Expression.
cDNA were synthesized from total RNA of bronchial epithelial cells, gastric mucosa, and ileal mucosa. The presence of BCL2A1, CD45 (46), and GAPDH messages were detected by PCR using the following primers: BCL2A1 sense, 5′-AGCCTACGCACGAAAGTGAC-3′; antisense, 5′-TGTTGGCAATCGTTTCCATATC-3′; CD45 sense, 5′-CTGAAGGAGACCATTGGTGA-3′; antisense 5′-GGTACTGGTACACAGTTCGA-3′; and GAPDH sense, 5′-GAAGGTGAAGGTCGGAGTC-3′; antisense, 5′-GAAGATGGTGATGGGATTTC-3′. Amplification products were electrophoresed in 2% agarose and visualized by ethidium bromide staining.
Results
Characterization of CTL.
To determine whether mHAgs recognized by the CTL clones isolated in this study were selectively presented by hematopoietic cells, CTL clones 18B3/A24 and 3B5/B44 were tested for lytic activity against recipient various target cells from hematopoietic and nonhematopoietic lineage. Both CTLs lysed recipient LCL, PHA-blasts, and CD40-activated B cells (only for CTL 3B5/B44) but not IFN-γ–treated dermal nor bone marrow fibroblasts generated from the corresponding recipients, whereas these nonhematopoietic cells were lysed by allo HLA-A24– and B44-specific CTLs, respectively. The addition of anti-pan HLA class I mAb (and anti–HLA-A24 mAb for clone 18B3/A24) but not anti–HLA-DR mAb significantly inhibited lysis of recipient LCL by both CTL clones, indicating that they were restricted by HLA class I molecules. NK activity-sensitive, HLA-defective K562 cells were not lysed. (Fig. 1, A and B) . They also lysed a fraction of restricting HLA-matched primary leukemic cells from other patients, and lysis of these cells increased after TNF-α treatment (Fig. 1, C and D). These results suggest that the mHAgs are selectively expressed by hematopoietic cells.
Figure 1.

Specificity of CTL clones analyzed in standard 51Cr release assays. (A) HLA-A*2402–restricted CTL 18B3/A24 and (B) HLA-B*4403–restricted CTL 3B5/B44 were tested against target cells derived from recipient (Rt) or donor (Do) normal tissues at an E/T ratio of 10:1. Recipient (Rt) dermal fibroblasts, bone marrow fibroblasts, and/or keratinocytes were incubated with 100 U/ml IFN-γ for 48 h before chromium labeling. Lysis by (A) allo HLA-A24– and (B) allo HLA-B44–specific CTL against nonhematopoietic cells are shown as open bars. Antibody blocking of the cytolysis was conducted with anti-HLA mAbs (E/T ratios: 1:1 for CTL 18B3/A24 and 10:1 for CTL 3B5/B44). (C) CTL 18B3/A24 and (D) CTL 3B5/B44 were tested against restricting HLA-matched primary leukemic cells. Frozen cryopreserved leukemic cells incubated with (solid bar) or without (hatched bar) 10 ng/ml TNF-α for 48 h before assay. PHA-stimulated T cell blasts (open bars) were generated from T cells contaminating in the corresponding leukemic blast. AML, acute myelocytic leukemia identified according to the French-American-British classification; ALL, acute lymphocytic leukemia; CMMoL, chronic myelomonocytic leukemia; CML (BC), chronic myelocytic leukemia in blast crisis.
The population frequency that expresses the mHAg-encoding genes was estimated by evaluating the lytic activity of each CTL clone against a panel of HLA-B*4403–transduced LCL from HLA-A*2402+ Japanese volunteers. CTL 18B3/A24 lysed 11 of 14 (79%) targets, whereas CTL 3B5/B44 lysed 7 of 14 targets (50%; not depicted), suggesting that the two mHAgs are defined by distinct SNPs.
Determination of mHAg Phenotype of CEPH Families by Cytotoxic Assays.
To determine which CEPH families were informative for linkage analysis, LCL from parental individuals of 12 CEPH families were transduced with restricting HLA alleles and screened. Families were selected for further analysis if one parent was positive and the other was negative because an informative segregation can be expected unless the proband is homozygous. The two CTL clones unexpectedly showed the identical lytic patterns (not depicted).
All available LCL from the selected four CEPH families were then transduced in the same way and tested as targets with CTL 18B3/A24 and 3B5/B44 in standard 51Cr release assays. The two CTL clones had identical lytic patterns when tested against these four families (only the results with CTL 18B3/A24 is shown in Fig. 2 A). These data suggest that the polymorphic gene(s) controlling the expression of the two mHAgs are closely located on a narrow chromosomal region or encoded by a single gene. It is unlikely that a single SNP encodes both mHAgs, however, because lytic patterns for the two clones against a panel LCL from Japanese donors were not identical.
Figure 2.

Linkage analysis. (A) The results of phenotyping for the pedigrees of CEPH families. Filled symbols (▪, males; •, females) represent individuals scored as positive in the 18B3/A24 cytotoxic assay and open symbols (□, males; ○, females) represent individuals scored as negative. Shaded symbols represent individuals from whom no LCL was available. Numbers above or below the symbols were assigned to each family member by the University of Utah (reference 34). The identical lysis pattern was also observed with CTL 3B5/B44. (B) Distribution of the LOD scores for each genetic marker on whole chromosomes are shown serially starting from the proximal end of chromosome 1. (C) Genetic map of distal chromosome 15q showing relative positions of marker loci, oriented with the 15q telomere at the bottom of the figure. LOD scores for each marker are indicated to the right of each marker. Because families other than 1362 have not been mapped extensively, families used to calculate the LOD scores are indicated in the parentheses. The location of the marker D15S96 that gave the highest LOD score has not been well defined, therefore its potential region on the map is indicated as a dashed line.
The Gene(s) Encoding the mHAgs Are Mapped to Chromosome 15q24.3–25.1.
Two-point linkage analysis was conducted in the four families: one family, 1362, was highly mapped (>10,000 markers/whole genome) whereas three families, 1346, 1349, and 1408, were mapped at lower density (<4,000 markers). Nevertheless, only one cluster of marker loci was found to be associated with the mHAg phenotype (Fig. 2 B). The markers around D15S96 on chromosome 15q24.3–25.1 gave LOD scores of 3 or higher, although most of the LOD scores were generated from family 1362 because the density of mapped markers was sparse within the region of interest in the remaining three families (Fig. 2 C).
By retrieving the available genotypes of all the individuals in the four families located around the marker D15S96 from the CEPH database (40, 41) and the Weizmann Institute of Science, it was possible to identify several informative individuals who had recombinant haplotypes. After genotyping these individuals by using microsatellite markers adjacent to D15S96, the recombinant haplotypes carrying the mHAgs allele could be characterized (Fig. 3) . The genetic region controlling the mHAg expression was estimated by comparing the recombinant haplotypes of the offspring with the mHAg phenotypes detected by CTL assays. For example, the father in family 1408 possessed the mHAg+ allele (Fig. 2 A). The recombinant paternal haplotypes inherited by individual 1694 implies that the gene(s) encoding the mHAg expression should lie telomeric to the marker D15S1023/AFMb347wa9. Similarly, the recombinant paternal haplotypes inherited by individual 1038 in family 1408 implies that the gene(s) should lie centromeric to the marker D15S154/AFM211xh2. Collectively these data suggest that the gene(s) must be encoded between these two markers, a distance corresponding to 3.6 cM on the Généthon map (47) or 5.5 Mbp.
Figure 3.

The gene(s) encoding the mHAgs defined by CTLs 18B3/A24 and 3B5/B44 are mapped to a 3.6-cM interval spanned by the markers D15S1023/AFMb347wa9 and D15S154/AFM211xh2. The parental probands and their informative offspring who had inherited recombinant haplotypes between the markers D15S965/AFMa139zb1 and D15S158/AFM234vf12 correspond to the region shown in Fig. 2 C. Genotypes of the requisite markers for family 1408 that were not available at the CEPH database (references 40 and 41) were examined in our laboratory. The genotypes are arranged by haplotype, with the paternally and maternally inherited haplotypes on the left and right, respectively. The appearance of a 0 in any haplotype indicates that no genotype was available and was not further examined. The susceptibility of individual LCL to the two CTL clones is indicated at the bottom of the figure. The parental haplotypes carrying gene(s) controlling mHAgs that were deduced by the segregation pattern (Fig. 2 A) in each family are shown in shaded blocks and their “antigen-negative” counterparts are shown in hatched blocks. Open blocks indicate regions that cannot be assigned to a parental haplotype. Thus, recombinant haplotypes are those composed of two blocks with different symbols, and the recombination event is thought to have occurred between the markers in different blocks.
Identification of Candidate Polymorphic Gene(s).
We set aside the possibility that the mHAgs detectable by CTLs 18B3/A24 and 3B5/B44 are formed by either SNPs located in a promoter region, intronic sequence, or congenital gene defect. Thus, to narrow the candidate gene(s) that might encode the mHAgs, we made the following assumptions: (a) Nonamer or decamer amino acid sequences spanning the nonsynonymous change with binding motifs for HLA-A*2402 and B*4403 should be found in the gene(s), (b) Two distinct nonsynonymous amino acid changes might be coded in the same gene or in closely linked genes near 15q24.3–25.1, and (c) The gene(s) are expressed only in cells of hematopoietic lineage, based on the tissue-specific pattern of lysis with the CTLs.
A search of the UCSC genome browser (42) and the Map Viewer (43) identified at least 46 genes that have been mapped to the region between the markers D15S1023/AFMb347wa9 and D15S154/AFM211xh2. Nine of these genes contained at least one nonsynonymous SNP (Table I). All nine potentially encode nonamer or decamer peptides spanning the nonsynonymous SNP with a predicted binding score of 1.0 or higher according to BIMAS software (44). On the other hand, only 2 of the 46 genes in the region of interest (BCL2A1 and HSPC073) are known to have expression limited to hematopoietic cells (and several solid tumor cells for BCL2A1), although data for some of the 9 candidate genes found in the SAGEmap database remain incomplete. BCL2A1 contained seven peptide motifs for HLA-A*2402 and six for HLA-B*4403 spanning one of three SNPs, whereas HSPC073 had no reported SNPs so far. Taken together, only BCL2A1 fulfilled our initial assumptions. Indeed, BCL2A1 (formally, BCL2-related protein A1) is known as a member of anti-apoptotic BCL2 family (25) and is up-regulated by TNF-α (26, 29, 30), which is consistent with the increased lysis of primary leukemic cells (Fig. 1, C and D).
Table I.
Genes with at Least One Nonsynonymous Coding SNP Mapped between the Markers D15S1023/AFMb347wa9 and D15S154/AFM211xh2
| Genea | Hematopoieticlineage restrictionb | Nonsynonymouscoding SNPsc | Peptide motifs forHLA-A*2402d | Peptide motifs forHLA-B*4403d |
|---|---|---|---|---|
| BCL2A1 | Yes | 3 | 7 | 6 |
| MTHFS | No | 1 | 0 | 1 |
| FLJ21140 | No | 1 | 4 | 2 |
| BG1 | No | 1 | 2 | 3 |
| ZNF291 | No | 2 | 14 | 5 |
| ETFA | No | 2 | 11 | 10 |
| AWP1 | No | 2 | 6 | 5 |
| PSMA4 | No | 1 | 0 | 2 |
| CHRNA5 | No | 1 | 4 | 1 |
Genes were retrieved from the RefSeq database based on the assembled human genome sequence databases available at http://genome.ucsc.edu (reference 42) and the NCBI Map Viewer (references 43).
Tissue-specific gene expression was searched by SAGEmap.
The number of nonsynonymous coding SNPs was searched by dbSNP.
Amino acid sequences of the genes were analyzed for nonamer or decamer peptides capable of binding to HLA-A*2402 and HLA-B*4403 using BIMAS software (reference 44), and only peptides with a binding score of 1.0 or higher were counted.
Two Nonsynonymous SNPs in the BCL2A1 Gene Determine CTL Recognition.
Because CTLs 18B3/A24 and 3B5/B44 demonstrated a different pattern of lysis in LCL from Japanese donors as described above, we analyzed the BCL2A1 exon 1 sequence (420 bp in length, Fig. 4) of six HLA-B*4403–transduced LCL from HLA-A*2402+ Japanese normal volunteers used in the CTL assay (see above) and four LCL from the recipients, PT18 and PT03 and their donors, and compared the results with the cDNA sequence identified in the GenBank database (sequence data are available from GenBank/EMBL/DDBJ under accession no. NM004049). As shown in Table II, susceptibility to CTL 18B3/A24 correlated completely with the presence of adenosine at nucleotide position 56 and guanosine at nucleotide position 116, whereas susceptibility to CTL 3B5/B44 correlated completely with the presence of adenosine at nucleotide position 245. These results suggest that the mHAg epitope recognized by CTL 18B3/A24 is encoded by a region spanning either nucleotide position 56 or 116, whereas the one recognized by CTL 3B5/B44 is encoded by the region spanning nucleotide position 245.
Figure 4.
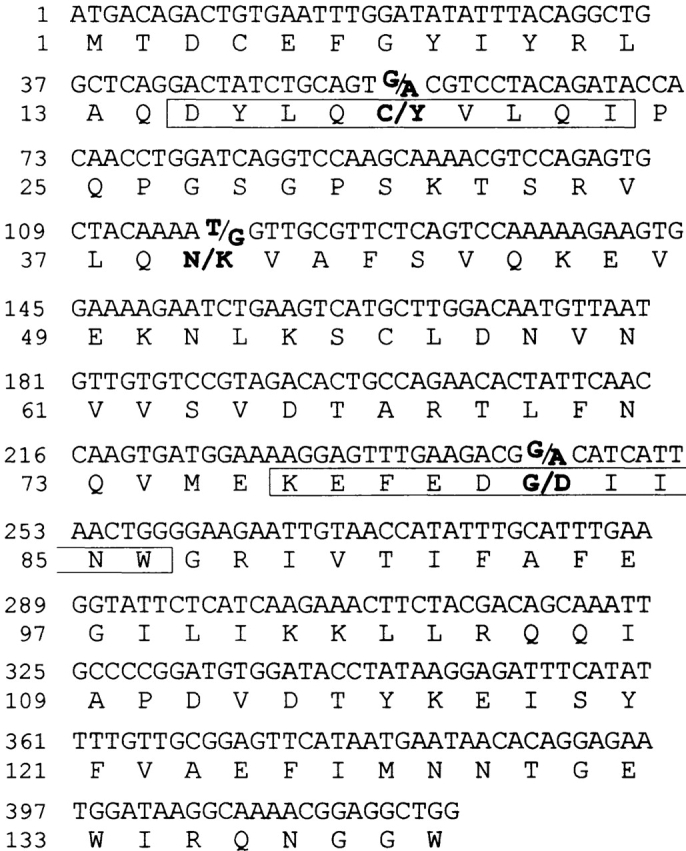
Nucleotide and deduced amino acid sequences of the human BCL2A1 exon 1 cDNA. The deduced amino acid sequence is shown in one-letter designation below the nucleotide sequence. All three reported nonsynonymous SNPs (positions 56, 116, and 245) and the corresponding amino acid residues (positions 19, 39, and 82) are indicated in bold type. The sequence corresponding to the CTLs 18B3/A24- and 3B5/B44-defined peptides is boxed.
Table II.
Correlation of BCL2A1 Sequence Polymorphisms with Susceptibility to the CTLs
| HLA-A*2402 and HLA-B*4403+ LCLa
,
b
|
||||||||||
|---|---|---|---|---|---|---|---|---|---|---|
| PT18 | PT18 | PT03 | PT03 | UR1 | UR2 | UR3 | UR4 | UR5 | UR6 | |
| Rt | Do | Rt | Do | |||||||
| Cytolysis by clones | ||||||||||
| 18B3/A24 | + | − | + | + | + | + | + | + | − | + |
| 3B5/B44 | + | − | + | − | − | − | + | + | − | − |
| Detected nucleotide polymorphismsc | ||||||||||
| 56 | G/A | G | A | G/A | G/A | G/A | G/A | A | G | G/A |
| 116 | T/G | T | G | T/G | T/G | T/G | T/G | G | T | T/G |
| 245 | G/A | G | G/A | G | G | G | G/A | A | G | G |
HLA-B*4403− LCL were transduced with the HLA-B*4403 cDNA.
Rt, recipient; Do, donor; UR, unrelated.
Nucleotide positions are shown starting at translation initiation codon.
To confirm these results, we constructed mammalian expression plasmids encoding the three identified allelic forms of exon 1 (i.e., designated as A-G-A, A-G-G, and G-T-G; nucleotides shown as a single alphabet) and transfected into the donor LCL corresponding to each CTL. CTL 18B3/A24 lysed the donor LCL transduced with plasmid encoding either A-G-A or A-G-G, whereas CTL 3B5/B44 lysed the donor LCL transduced only with plasmid encoding A-G-A (Fig. 5, A and B) . Therefore, we conclude that SNPs in BCL2A1 gene encode mHAgs recognized by 18B3/A24 and 3B5/B44.
Figure 5.

The two mHAg epitopes defined by CTLs 18B3/A24 and 3B5/B44 are encoded by a single gene BCL2A1. Mammalian expression plasmids encoding three allelic forms of the BCL2A1 exon 1 identified in the correlation study (refer to Table II) were transfected into (A) PT18 donor (Do) LCL and (B) PT03 donor LCL and their susceptibility to (A) CTL 18B3/A24 and (B) CTL 3B5/B44 was tested. Individual recipient (Rt) LCL was used as positive control. (C) Identification of CTL 18B3/A24-defined epitope. Susceptibility of PT18 donor LCL transduced with minigene constructs encoding BCL2A1 polymorphic peptides spanning amino acid 19 was assessed in a standard 51Cr release assay. Two pairs of nonamer peptides starting at amino acid positions 13 and 15 with binding score of 1.0 or higher were predicted by BIMAS software (reference 44). Polymorphic amino acids (Y or C) are underlined. CTL lysis of PT18 recipient (Rt) and donor (Do) is also shown. (D) mHAg epitope reconstitution with synthetic nonamer peptides with amino acid sequence starting at position 15. (E) Identification of CTL 3B5/B44-defined epitope. Susceptibility of PT03 donor LCL transduced with minigene constructs encoding two BCL2A1 polymorphic peptides (KEFEDDIINW and KEFEDGIINW, refer to Table III) was tested at various E/T ratio. Polymorphic amino acids (D or G) are underlined. CTL lysis of PT03 recipient (Rt) and donor (Do) is also shown. (F) mHAg epitope reconstitution with synthetic decamer peptides. Besides conventional peptide pulsing, direct delivery of synthetic peptides into the cytosol by electroporation was used (EP). As negative control, HLA-B*4403–restricted tyrosinase epitope (SEIWRDIDF; reference 31) was used. (G) An HLA-B*4403–restricted tyrosinase epitope (SEIWRDIDF)-specific CTL was generated from a normal donor and tested against autologous (Auto) LCL, autologous LCL transduced with minigene constructs encoding SEIWRDIDF, or HLA-B*4403–transduced Mel-501 melanoma cell line with intrinsic expression of tyrosinase. (H) Reconstitution assay for synthetic peptides using the tyrosinase-specific CTL.
Identification of HLA-A*2402–restricted mHAg Epitope.
Because cytotoxic activity of CTL 18B3/A24 was controlled by the SNPs either at nucleotide position 56 (amino acid position 19) or 115 (amino acid position 39), we searched for amino acid sequences spanning these SNPs using BIMAS software (44). Because most described HLA-A*2402 binding peptides contain nine amino acid residues (45), we examined two nonamer peptides, starting at amino acid positions 13 and 15 (AQDYLQYVL, DYLQYVLQI; polymorphic residue underlined) from mHAg+ allele (Fig. 4). Their predicted binding scores were 4.8 and 75, respectively. The mHAg− allele found in the donor encodes Cys(C) instead of Tyr(Y) at position 19. Binding scores for the C-containing peptide were similar to those for the Y-containing peptide. No nonamer HLA-A*2402 binding peptide motifs spanning amino acid position 39 were predicted. We constructed four minigenes encoding nonamer peptides with sequences predicted as above, and tested the donor LCL transfected with each of these minigenes in 51Cr-releasing assays with CTL 18B3/A24 (Fig. 5 B). Only the donor LCL carrying a minigene encoding DYLQYVLQI was recognized by the CTL. Thus, we next synthesized two nonamer peptides, DYLQYVLQI and DYLQCVLQI, and tested the cytotoxicity of CTL 18B3/A24 on the donor LCL by pulsing with graded amounts of each peptide. The titration of peptide DYLQYVLQI recognized by CTL 18B3/A24 gave half-maximal lysis at a concentration of 20 pM, whereas peptide DYLQCVLQI failed to sensitize the donor LCL at any of the concentrations tested (Fig. 5 D). Thus, DYLQYVLQI defines the HLA-A*2402–restricted 18B3/A24 epitope, and we designated it BCL2A1/A24Y. An MHC stabilization assay (48) using HLA-A*2402–transfected T2 cells pulsed with either of the two peptides demonstrated a closely similar increase in fluorescence intensity when stained with anti–HLA-A24 mAb (unpublished data), suggesting that both peptides could be presented on HLA-A*2402. Immunogenicity of DYLQCVLQI (BCL2A1/A24C) in donor recipient pairs with the reciprocal allele combination has not been determined.
Identification of HLA-B*4403–restricted mHAg Epitope.
The preferred HLA-B*4403 anchor residues are Glu(E) at position 2 and a Phe(F), Tyr(Y), or Trp(W) at position 9 or 10, and nearly half of the B*4403 peptides contain 10 amino acid residues (45, 49). Because three Glu(E) residues are close to the known polymorphic amino acid at position 82 of the BCL2A1 protein, we listed all nonamer or decamer peptides spanning the position 82 and constructed minigenes encoding peptides with a binding score of 1.0 or higher by BIMAS software (44). Lysis was observed only against PT03 donor LCL transfected with a minigene encoding a decamer peptide starting at amino acid position 77 and containing Asp(D) residue (KEFEDDIINW; Table III and Fig. 5 E). Regardless of a D or G residue at position 82, this decamer had the highest binding score not only by BIMAS software but also by SYFPEITHI software. To verify that synthetic peptide KEFEDDIINW can sensitize the PT03 donor LCL, we performed an epitope reconstitution assay. Half-maximal lysis was observed with 400 nM for peptide KEFEDDIINW, whereas peptide KEFEDGIINW or irrelevant HLA-B*4403–restricted tyrosinase epitope (SEIWRDIDF; reference 31) failed to sensitize the donor LCL even at 100 μM. When peptide KEFEDDIINW was introduced directly into the cytosol by electroporation, 10-fold less concentration was required to obtain the half-maximal lysis (Fig. 5 F). We also tested a CTL clone specific for SEIWRDIDF derived from tyrosinase. This CTL clone generated from a normal donor efficiently lysed not only autologous LCL transduced with minigene constructs encoding SEIWRDIDF, but also HLA-B*4403–transfected Mel-501, a melanoma cell line with intrinsic expression of tyrosinase. The concentration of the peptide SEIWRDIDF needed for half-maximal lysis was 1 μM, suggesting that HLA-B*4403 might not present exogenously pulsed peptides as efficiently as other HLA alleles. Taken together, KEFEDDIINW defines the HLA-B*4403–restricted 3B5/B44 epitope and was designated as BCL2A1/B44D.
Table III.
Minigene Sequences Encoding Nonamer or Decamer Peptides Spanning the BCL2A1 Polymorphic Regions (BIMAS Score of 1.0 or Higher) and Recognition of Their Transfectants by CTL 3B5/B44a
| Position | Peptide sequenceb | Length | BIMASscorec | SYFPEITHIscored | Specificlysis (percent)e |
|---|---|---|---|---|---|
| 75–83 | MEKEFEDDI | 9 | 4.0 | 18 | 3 |
| 75–84 | MEKEFEDDII | 10 | 4.0 | 18 | 0 |
| 77–85 | KEFEDDIIN | 9 | 1.2 | 14 | 1 |
| 77–86 | KEFEDDIINW | 10 | 12.0 | 27 | 66 |
| 77–86 | KEFEDGIINW | 10 | 12.0 | 27 | 3 |
| 81–89 | DDIINWGRI | 9 | 11.25 | 12 | −1 |
| 81–90 | DDIINWGRIV | 10 | 11.25 | 4 | 2 |
PT03 donor LCL were transfected with minigene constructs encoding the BCL2A1 polymorphic peptides listed.
Polymorphic amino acids are underlined.
Binding score to HLA-B*4403 was predicted by BIMAS software (reference 44).
Binding scores to HLA-B*4402 predicted by SYFPEITHI software (reference 45) are indicated because CTL 3B5/B44 could lyse targets in the context of HLA-B*4402 as well as HLA-B*4403.
Percent specific lysis by CTL 3B5/B44 performed at the E/T ratio of 10:1.
Selective Expression of the BCL2A1 Gene in Human Hematopoietic Tissues.
To determine the relative levels of expression of BCL2A1 in a more comprehensive manner, an RNA dot blot analysis was performed (Fig. 6 A). Array analysis indicated that the expression of BCL2A1 was strongly expressed by peripheral blood leukocytes, bone marrow, and to lesser extent, by lymph node and spleen. A weak signal was also detected in lung and gastrointestinal tract, but as shown in Fig. 6 B, an RT-PCR analysis showed parallel expression of BCL2A1 and CD45 messages in cultured bronchial epithelial cells (both negative), gastric glands (both weakly positive), and intestinal glands (both moderately positive), suggesting that BCL2A1 signal originated from contaminated hematopoietic cells in these tissues. No expression was detected in other tissues.
Figure 6.
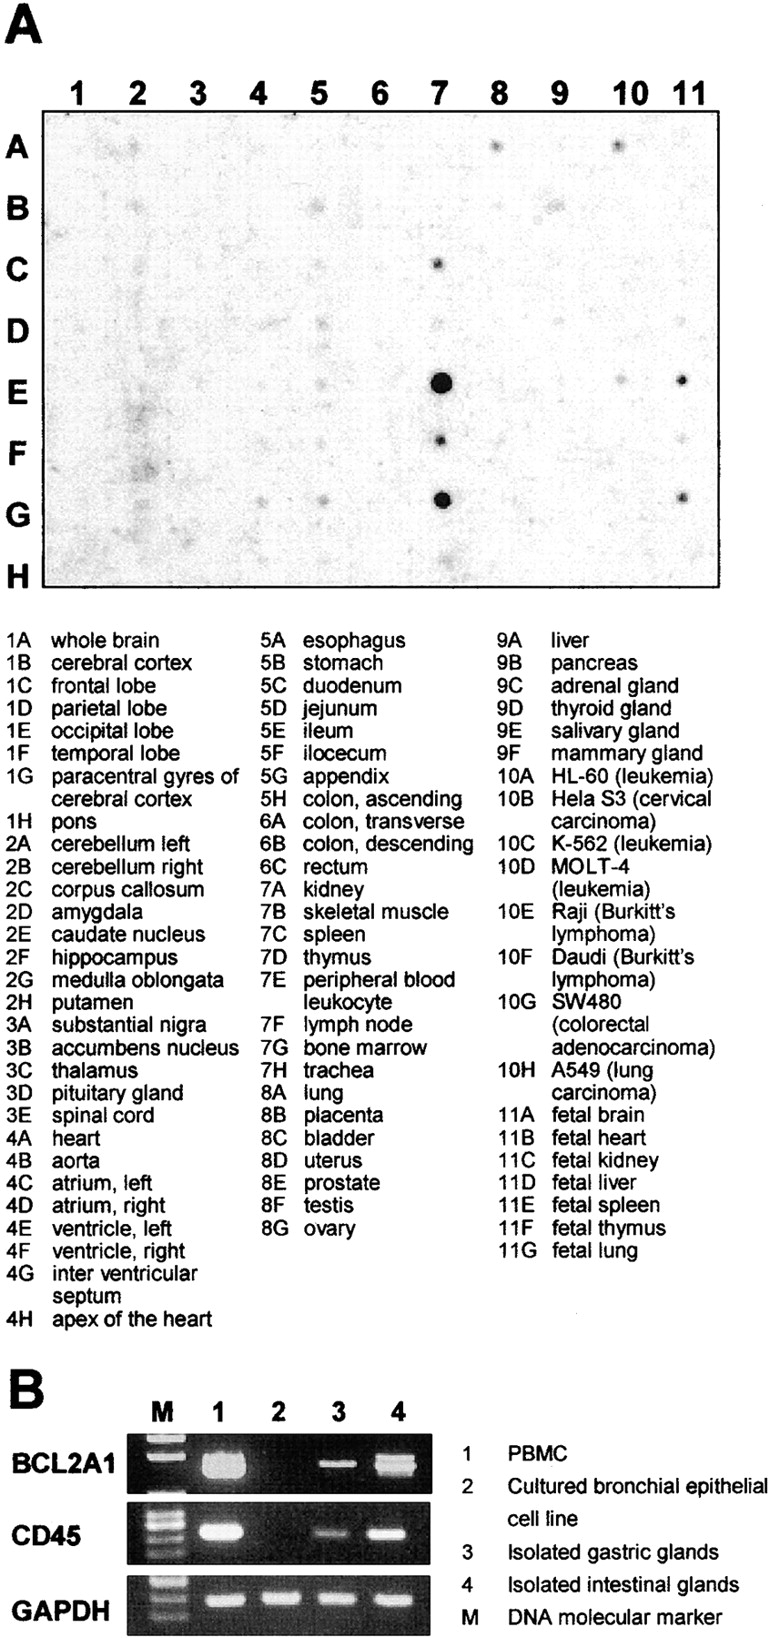
(A) RNA dot blot analysis of BCL2A1 gene expression in 68 distinct human tissues and 8 tumor cell lines. Tissue sources for the RNA are indicated below the blot. (B) BCL2A1 and CD45 expression of PBMC, cultured bronchial epithelial cell line, and isolated glands from stomach and intestine. Gene-specific RT-PCR was performed with a predetermined amount of each cDNA based on the PCR results for GAPDH.
Discussion
In this study, we identified a gene encoding two mHAgs by using linkage analysis. The feasibility of using linkage analysis as an initial approach to identify a single gene was recently suggested by analysis of the HA-8 mHAg encoded by KIAA0020 (21). To the best of our knowledge, our study is the first successful prospective identification of novel mHAgs by linkage analysis. The key to success with this approach depends on the accuracy and completeness of the available genome sequence databases. There were some gaps between map contigs in the UCSC Genome database (42; December 2001 Freeze), but the gaps decreased in a later version (April 2002 Freeze). Moreover, the order and chromosomal location of segments comprising of several genes in the region of interest changed dramatically between the two versions and in fact, the marker D15S1023/AFMb347wa9 used to define the centromeric border was not included in the former version. Although our strategy to select candidate genes based on their tissue-specific expression and the presence of HLA-A*2402 or HLA-B*4403 binding peptides with nonsynonymous SNPs has successfully led to the identification of mHAgs encoded by the BCL2A1 gene, incomplete database information still poses a challenge for the use of linkage analysis in identifying genes that potentially encode mHAg.
Theoretically, any genetic polymorphism that changes cell surface expression of the self-peptides directly or indirectly can be recognized as mHAg between recipients and their donors in the setting of allogeneic HCT (2). There are two major mechanisms involved: recognition by specific T cells and presentation by MHC molecules. In humans, HLA-B7–restricted HY (12), HLA-A1–restricted HY (13), and HB-1 (7, 18) mHAgs are examples where the fine specificity of a TCR distinguishes two alleles, each encoding peptides that can be presented by the relevant HLA molecule. Peptide polymorphisms can affect several steps involved in antigen processing, including binding affinity to the relevant HLA molecules, as demonstrated for HA-1 (8), translocation efficiency through transporter associated with antigen processing, as demonstrated for HA-8 (10), and proteasomal cleavage or another undetermined mechanism, as demonstrated for HA-2 (9).
In the case of the mHAg BCL2A1/A24, mHAg− donor cells pulsed with BCL2A1/A24C peptide were not recognized by the CTL, even though the BCL2A24C and BCL2A1/A24Y peptides both bind efficiently to HLA-A*2402. These observations indicate that the BCL2A1/A24C/Y polymorphism affects a TCR contact residue. We cannot exclude the possibility that the BCL2A1/A24C peptide is not produced properly or is destroyed by proteasomal cleavage. The two algorithms available for prediction of proteasomal cleavages (PAPROC, references 50, 51; NetChop, reference 52) indicate that the COOH terminus is not properly formed by proteasomes when the polymorphic residue is Cys(C), but not Tyr(Y), which suggests that the BCL2A1/A24C peptide might not be produced endogenously. Attempts to induce BCL2A1/A24C-specific CTL from HCT recipients are currently in progress.
Results in the epitope reconstitution assays showed that an unusually high peptide concentration was required for sensitization with BCL2A1/B44D, but the genetic data and minigene experiments strongly support the conclusion that the identified sequence is the epitope for clone 3B5/B44. The consensus peptide binding motif for HLA-B*4403 demonstrates a predominance for Glu(E) at position 2, and Tyr(Y) or Phe(F) at position 9 or 10 (45, 49). BCL2A1/B44D/G peptide contains a Glu(E) at position 2 but Try(W) at position 10, which is not a preferred residue (44). Interestingly, HB-1H/Y, a minor antigen that is also restricted by HLA-B*4403, and BCL2A1/B44D/G have identical residues at these positions and the binding scores predicted by BIMAS software (18.0 vs. 12.0) and SYFPEITHI software (25 vs. 27) are similar for the four peptides. The HB-1H peptide concentration required to obtain the half-maximal lysis is ∼10 nM (7, 18), nearly 40-fold lower than with the BCL2A1/B44D peptide (∼400 nM). Other previously identified HLA-B*4403–restricted epitopes also require peptide concentrations of 1–100 nM with one exception: tyrosinase (100 nM; reference 31), MAGE3 (40–100 nM; reference 53), and MUM1 (1 nM; reference 54) versus EBNA3C (<1 pM; reference 55). However, direct delivery of peptide into the cytosol by electroporation decreased the required peptide concentration by 10-fold. Moreover, nearly 1 μM peptide was necessary to sensitize target LCL for a tyrosinase-specific CTL that is considered to have a high affinity T cell receptor because it could lyse a melanoma cell line. A peptide-induced CTL clone specific for HB-1 mHAg also required 1 μM peptide (Dolstra, H., personal communication). Finally, the unique property of HLA-B*44 is supported by the fact that HLA-B*44 tetramer would not refold as posted in The National Institutes of Health (NIH) Tetramer Facility web page (http://www.emory.edu/WHSC/TETRAMER/faq.html). These facts suggest that HLA-B44 might not present exogenously pulsed peptides as efficiently as other HLA alleles, and only peptides with specific characteristics, such as loading in the ER, might be presented by this molecule.
Immunotherapy with BCL2A1-specific T cells would not be expected to cause GVHD after allogeneic HCT, once the normal hematopoietic cells expressing this gene in the recipient have been eliminated by the transplant procedure. It is conceivable, however, that normal nonhematopoietic cells might express BCL2A1 during the intense cytokine production that occurs during acute GVHD (56), potentially making these cells susceptible to attack by BCL2A1-specific CTL. Preliminary results showed that the incidence rates of acute or chronic GVHD were not increased among 49 patients with BCL2A1/A24 disparity compared with 158 recipients with no BCL2A1/A24 disparity. In addition, both recipients with advanced leukemia from whom the two clones were generated have remained in complete remission for more than a year after HCT without acute GVHD, although PT03 has mild oral chronic GVHD. Further testing will be needed to determine definitively whether BCL2A1 mismatching in a transplant recipient is associated with an increased risk of GVHD.
To date, only a limited number of human mHAgs have been fully characterized (7–18) and most of these are restricted by HLA-A*0201, HLA-A*0101, HLA-A*0301, HLA-B*0702, and HLA-B*0801. The identification of mHAgs restricted by HLA alleles that are common in certain ethnic groups such as the Asian population has not been reported. HLA-A*2402 is very common in Japanese (phenotype frequency ∼65%) and other Asian populations. The identification of HLA-A*2402-restricted mHAg may provide many patients in this ethnic group with the opportunity to have hematological malignancies treated by immunotherapy. In fact, we have already succeeded in generating BCL2A1/A24Y-specific CTL from PBMC of the recipient from whom CTL 18B3/A24 was cloned by stimulation with peptide-pulsed, donor-derived CD40-activated B cells. An HLA-A24 tetramer incorporating BCL2A1/A24Y peptide has also been constructed and has been used to identify the presence of tetramer-positive CD8+ cells (0.2% of CD8+ cells) among recipient PBMC on day 43 after HCT and to monitor the rapid expansion of mHAg-specific CD8+ cells after ex vivo stimulation (unpublished data). Because of the potential application to immunotherapy for various types of recurrent malignancies after allogeneic HCT, we are seeking to identify other HLA-restricted mHAg epitopes in BCL2A1.
Acknowledgments
The authors thank Dr. Paul J. Martin for critically reading the manuscript and Dr. Harry Dolstra for discussing unpublished findings. We acknowledge the kind gift of Mel-501 cell line from Dr. Yutaka Kawakami and surgical specimens of normal gastrointestinal tissues from Dr. Tetsuya Tsukamoto. We also thank Yumi Nakao, Yasue Matsudaira, and Keiko Nishida for their expert technical assistance.
This work was supported in part by a Grant-in-Aid for Scientific Research (C) (to Y. Akatsuka and T. Takahashi) and Scientific Research on Priority Areas (to T. Takahashi, K. Tsujimura, and Y. Akatsuka) from the Ministry of Education, Culture, Science, Sports, and Technology, Japan; Research on Human Genome, Tissue Engineering Food Biotechnology (to Y. Akatsuka, Y. Morishima, and Y. Kodera) and Second Team Comprehensive 10-year Strategy for Cancer Control (to T. Takahashi) from the Ministry of Health, Labor, and Welfare, Japan; a special project grant from Aichi Cancer Center (to Y. Akatsuka); Tatsuya Niimi Memorial Grant (to M. Yazaki); Nagono Medical Research Grant (to K. Kuzushima); and CEPH cell lines were made available with support from U.S. Public Health Service grant AI49213, awarded by the Department of Health and Human Services, NIH.
Y. Akatsuka and T. Nishida contributed equally to this work.
Footnotes
Abbreviations used in this paper: CEPH, Centre d'Etude du Polymorphisme Humain; HCT, hematopoietic cell transplantation; LCL, EBV-transformed B cell lines; mHAg, minor histocompatibility antigen; SNP, single nucleotide polymorphism.
References
- 1.Wallny, H.J., and H.G. Rammensee. 1990. Identification of classical minor histocompatibility antigen as cell-derived peptide. Nature. 343:275–278. [DOI] [PubMed] [Google Scholar]
- 2.Simpson, E., and D. Roopenian. 1997. Minor histocompatibility antigens. Curr. Opin. Immunol. 9:655–661. [DOI] [PubMed] [Google Scholar]
- 3.Goulmy, E. 1997. Human minor histocompatibility antigens: new concepts for marrow transplantation and adoptive immunotherapy. Immunol. Rev. 157:125–140. [DOI] [PubMed] [Google Scholar]
- 4.Niederwieser, D., A. Grassegger, J. Aubock, M. Herold, D. Nachbaur, A. Rosenmayr, A. Gachter, W. Nussbaumer, S. Gaggl, M. Ritter, et al. 1993. Correlation of minor histocompatibility antigen-specific cytotoxic T lymphocytes with graft-versus-host disease status and analysis of tissue distribution of their target antigens. Blood. 81:2200–2208. [PubMed] [Google Scholar]
- 5.Faber, L.M., S.A.P. van Luxemburg-Heijs, R. Willemze, and J.H.F. Falkenburg. 1992. Generation of leukemia-reactive cytotoxic T lymphocyte clones from the HLA-identical bone marrow donor of a patient with leukemia. J. Exp. Med. 176:1283–1289. [DOI] [PMC free article] [PubMed] [Google Scholar]
- 6.Warren, E.H., P.D. Greenberg, and S.R. Riddell. 1998. Cytotoxic T-lymphocyte-defined human minor histocompatibility antigens with a restricted tissue distribution. Blood. 91:2197–2207. [PubMed] [Google Scholar]
- 7.Dolstra, H, H. Fredrix, F. Maas, P.G. Coulie, F. Brasseur, E. Mensink, G.J. Adema, T.M. de Witte, C.G. Figdor, and E. van de Wiel-van Kemenade. 1999. A human minor histocompatibility antigen specific for B cell acute lymphoblastic leukemia. J. Exp. Med. 189:301-308. [DOI] [PMC free article] [PubMed] [Google Scholar]
- 8.den Haan, J.M., L.M. Meadows, W. Wang, J. Pool, E. Blokland, T.L. Bishop, C. Reinhardus, J. Shabanowitz, R. Offringa, D.F. Hunt, et al. 1998. The minor histocompatibility antigen HA-1: a diallelic gene with a single amino acid polymorphism. Science. 279:1054–1057. [DOI] [PubMed] [Google Scholar]
- 9.Pierce, R.A., E.D. Field, T. Mutis, T.N. Golovina, C. Von Kap-Herr, M. Wilke, J. Pool, J. Shabanowitz, M.J. Pettenati, L.C. Eisenlohr, et al. 2001. The HA-2 minor histocompatibility antigen is derived from a diallelic gene encoding a novel human class I myosin protein. J. Immunol. 167:3223–3230. [DOI] [PubMed] [Google Scholar]
- 10.Brickner, A.G., E.H. Warren, J.A. Caldwell, Y. Akatsuka, T.N. Golovina, A.L. Zarling, J. Shabanowitz, L.C. Eisenlohr, D.F. Hunt, V.H. Engelhard, et al. 2001. The immunogenicity of a new human minor histocompatibility antigen results from differential antigen processing. J. Exp. Med. 193:195–206. [DOI] [PMC free article] [PubMed] [Google Scholar]
- 11.Meadows, L., W. Wang, J.M. den Haan, E. Blokland, C. Reinhardus, J.W. Drijfhout, J. Shabanowitz, R. Pierce, A.I. Agulnik, C.E. Bishop, et al. 1997. The HLA-A*0201-restricted H-Y antigen contains a posttranslationally modified cysteine that significantly affects T cell recognition. Immunity. 6:273–281. [DOI] [PubMed] [Google Scholar]
- 12.Wang, W., L.R. Meadows, J.M. den Haan, N.E. Sherman, Y. Chen, E. Blokland, J. Shabanowitz, A.I. Agulnik, R.C. Hendrickson, C.E. Bishop, et al. 1995. Human H-Y: a male-specific histocompatibility antigen derived from the SMCY protein. Science. 269:1588–1590. [DOI] [PubMed] [Google Scholar]
- 13.Pierce, R.A., E.D. Field, J.M. den Haan, J.A. Caldwell, F.M. White, J.A. Marto, W. Wang, L.M. Frost, E. Blokland, C. Reinhardus, et al. 1999. Cutting edge: the HLA-A*0101-restricted HY minor histocompatibility antigen originates from DFFRY and contains a cysteinylated cysteine residue as identified by a novel mass spectrometric technique. J. Immunol. 163:6360–6364. [PubMed] [Google Scholar]
- 14.Warren, E.H., M.A. Gavin, E. Simpson, P. Chandler, D.C. Page, C. Disteche, K.A. Stankey, P.D. Greenberg, and S.R. Riddell. 2000. The human UTY gene encodes a novel HLA-B8-restricted H-Y antigen. J. Immunol. 164:2807–2814. [DOI] [PubMed] [Google Scholar]
- 15.Vogt, M.H., E. Goulmy, F.M. Kloosterboer, E. Blokland, R.A. de Paus, R. Willemze, and J.H. Falkenburg. 2000. UTY gene codes for an HLA-B60-restricted human male-specific minor histocompatibility antigen involved in stem cell graft rejection: characterization of the critical polymorphic amino acid residues for T-cell recognition. Blood. 96:3126–3132. [PubMed] [Google Scholar]
- 16.Vogt, M.H., J.W. van Den Muijsenberg, E. Goulmy, E. Spierings, P. Kluck, M.G. Kester, R.A. van Soest, J.W. Drijfhout, R. Willemze, and J.H. Falkenburg. 2002. The DBY gene codes for an HLA-DQ5-restricted human male-specific minor histocompatibility antigen involved in graft-versus-host disease. Blood. 99:3027–3032. [DOI] [PubMed] [Google Scholar]
- 17.Mommaas, B., J. Kamp, J.-W. Drijfhout, N. Beekman, F. Ossendorp, P. van Veelen, J. den Haan, E. Goulmy, and T. Mutis. 2002. Identification of a novel HLA-B60-restricted T cell epitope of the minor histocompatibility antigen HA-1 locus. J. Immunol. 169: 3131–3136. [DOI] [PubMed] [Google Scholar]
- 18.Dolstra, H., B.B. Rijke, H. Fredrix, A. Balas, F. Maas, F. Scherpen, M.J. Aviles, J.L. Vicario, N.J. Beekman, F. Ossendorp, et al. 2002. Bi-directional allelic recognition of the human minor histocompatibility antigen HB-1 by cytotoxic T lymphocytes. Eur. J. Immunol. 32:2748–2758. [DOI] [PubMed] [Google Scholar]
- 19.Gubarev, M.I., J.C. Jenkin, M.F. Leppert, G.S. Buchanan, B.E. Otterud, D.A. Guilbert, and P.G. Beatty. 1996. Localization to chromosome 22 of a gene encoding a human minor histocompatibility antigen. J. Immunol. 157:5448–5454. [PubMed] [Google Scholar]
- 20.Gubarev, M.I., J.C. Jenkin, B.E. Otterrud, M.F. Leppert, J.M. Schallheim, and P.G. Beatty. 1998. Localization to chromosome 11 of a gene encoding a human minor histocompatibility antigen. Exp. Hematol. 26:976–981. [PubMed] [Google Scholar]
- 21.Warren, E.H., B.E. Otterud, R.W. Linterman, A.G. Brickner, V.H. Engelhard, M.F. Leppert, P.J. Martin, and S.R. Riddell. 2002. Feasibility of using genetic linkage analysis to identify the genes encoding T cell–defined minor histocompatibility antigens. Tissue Antigens. 59:293–303. [DOI] [PubMed] [Google Scholar]
- 22.Akatsuka, Y., E. Kondo, H. Taji, Y. Morishima, M. Yazaki, Y. Obata, Y. Kodera, S.R. Riddell, and T. Takahashi. 2002. Targeted cloning of cytotoxic T cells specific for minor histocompatibility antigens restricted by HLA class I molecules of interest. Transplantation. 74:1773–1780. [DOI] [PubMed] [Google Scholar]
- 23.Lin, E.Y., A. Orlofsky, M.S. Berger, and M.B. Prystowsky. 1993. Characterization of A1, a novel hemopoietic-specific early-response gene with sequence similarity to bcl-2. J. Immunol. 151:1979–1988. [PubMed] [Google Scholar]
- 24.Choi, S.S., I.C. Park, J.W. Yun, Y.C. Sung, S.I. Hong, and H.S. Shin. 1995. A novel Bcl-2 related gene, Bfl-1, is overexpressed in stomach cancer and preferentially expressed in bone marrow. Oncogene. 11:1693–1698. [PubMed] [Google Scholar]
- 25.Lin, E.Y., A. Orlofsky, H-G. Wang, J.C Reed, and M.B. Prystowsky. 1996. A1, a Bcl-2 family member, prolongs cell survival and permits myeloid differentiation. Blood. 87:983–992. [PubMed] [Google Scholar]
- 26.Karsan, A., E. Yee, and J.M. Harlan. 1996. Endothelial cell death induced by tumor necrosis factor-alpha is inhibited by the Bcl-2 family member, A1. J. Biol. Chem. 271:27201–27204. [DOI] [PubMed] [Google Scholar]
- 27.Kenny, J.J., T.J. Knobloch, M. Augustus, K.C. Carter, C.A. Rosen, and J.C. Lang. 1997. GRS, a novel member of the Bcl-2 gene family, is highly expressed in multiple cancer cell lines and in normal leukocytes. Oncogene. 14:997–1001. [DOI] [PubMed] [Google Scholar]
- 28.Wang, C.Y., D.C. Guttridge, M.W. Mayo, and A.S. Baldwin, Jr. 1999. NF-κB induces expression of the Bcl-2 homologue A1/Bfl-1 to preferentially suppress chemotherapy-induced apoptosis. Mol. Cell. Biol. 19:5923–5929. [DOI] [PMC free article] [PubMed] [Google Scholar]
- 29.Zong, W.X., L.C. Edelstein, C. Chen, J. Bash, and C. Gelinas. 1999. The prosurvival Bcl-2 homologue Bfl-1/A1 is a direct transcriptional target of NF-κB that blocks TNFα-induced apoptosis. Genes Dev. 13:382–387. [DOI] [PMC free article] [PubMed] [Google Scholar]
- 30.Duriez, P.J., F. Wong, K. Dorovini-Zis, R. Shahidi, and A. Karsan. 2000. A1 functions at the mitochondria to delay endothelial apoptosis in response to tumor necrosis factor. J. Biol. Chem. 275:18099–18107. [DOI] [PubMed] [Google Scholar]
- 31.Brichard, V.G., J. Herman, A. Van Pel, C. Wildmann, B. Gaugler, T. Wolfel, T. Boon, and B. Lethe. 1996. A tyrosinase nonapeptide presented by HLA-B44 is recognized on a human melanoma by autologous cytolytic T lymphocytes. Eur. J. Immunol. 26:224–230. [DOI] [PubMed] [Google Scholar]
- 32.Walter, E.A., P.D. Greenberg, M.J. Gilbert, R.J. Finch, K.S. Watanabe, E.D. Thomas, and S.R. Riddell. 1995. Reconstitution of cellular immunity against cytomegalovirus in recipients of allogeneic bone marrow by transfer of T-cell clones from the donor. N. Engl. J. Med. 333:1038–1044. [DOI] [PubMed] [Google Scholar]
- 33.Akatsuka, Y., T.A. Goldberg, E. Kondo, E.G. Martin, Y. Obata, Y. Morishima, T. Takahashi, and J.A. Hansen. 2002. Efficient cloning and expression of HLA class I cDNA in human B-lymphoblastoid cell lines. Tissue Antigens. 59: 502–511. [DOI] [PubMed] [Google Scholar]
- 34.Broman, K.W., J.C. Murray, V.C. Sheffield, R.L. White, and J.L. Weber. 1998. Comprehensive human genetic maps: individual and sex-specific variation in recombination. Am. J. Hum. Genet. 63:861–869. [DOI] [PMC free article] [PubMed] [Google Scholar]
- 35.Cottingham, R.W., Jr., R.M. Idury, and A.A. Schaffer. 1993. Faster sequential genetic linkage computations. Am. J. Hum. Genet. 53:252–263. [PMC free article] [PubMed] [Google Scholar]
- 36.Schaffer, A.A., S.K. Gupta, K. Shriram, and R.W. Cottingham, Jr. 1994. Avoiding recomputation in linkage analysis. Hum. Hered. 44:225–237. [DOI] [PubMed] [Google Scholar]
- 37.Lathrop, G.M., J.M. Lalouel, C. Julier, and J. Ott. 1984. Strategies for multilocus analysis in humans. Proc. Natl. Acad. Sci. USA. 81:3443–3446. [DOI] [PMC free article] [PubMed] [Google Scholar]
- 38.Lathrop, G.M., and J.M. Lalouel. 1984. Easy calculations of LOD scores and genetic risks on small computers. Am. J. Hum. Genet. 36:460–465. [PMC free article] [PubMed] [Google Scholar]
- 39.Lathrop, G.M., J.M. Lalouel, and R.L. White. 1986. Construction of human genetic linkage maps: likelihood calculations for multilocus analysis. Genet. Epidemiol. 3:39–52. [DOI] [PubMed] [Google Scholar]
- 40.Murray, J.C., K.H. Buetow, J.L. Weber, S. Ludwigsen, T. Scherpbier-Heddema, F. Manion, J. Quillen, V.C. Sheffield, S. Sunden, G.M. Duyk, et al. 1994. A comprehensive human linkage map with centimorgan density. Cooperative Human Linkage Center (CHLC). Science. 265:2049–2054. [DOI] [PubMed] [Google Scholar]
- 41.Dausset, J., H. Cann, D. Cohen, M. Lathrop, J.M. Lalouel, and R. White. 1990. Centre d'etude du polymorphisme humain (CEPH): collaborative genetic mapping of the human genome. Genomics. 6:575–577. [DOI] [PubMed] [Google Scholar]
- 42.Kent, W.J., C.W. Sugnet, T.S. Furey, K.M. Roskin, T.H. Pringle, A.M. Zahler, and D. Haussler. 2002. The human genome browser at UCSC. Genome Res. 12:996–1006. [DOI] [PMC free article] [PubMed] [Google Scholar]
- 43.Wheeler, D.L., D.M. Church, A.E. Lash, D.D. Leipe, T.L. Madden, J.U. Pontius, G.D. Schuler, L.M. Schriml, T.A. Tatusova, L. Wagner, et al. 2001. Database resources of the National Center for Biotechnology Information. Nucleic Acids Res. 29:11–16. [DOI] [PMC free article] [PubMed] [Google Scholar]
- 44.Parker, K.C., M.A. Bednarek, and J.E. Coligan. 1994. Scheme for ranking potential HLA-A2 binding peptides based on independent binding of individual peptide side-chains. J. Immunol. 152:163–175. [PubMed] [Google Scholar]
- 45.Rammensee, H.-G., J. Bachmann, N.P.N. Emmerich, O.A. Bachor, and S. Stevanovic. 1999. SYFPEITHI: database for MHC ligands and peptide motifs. Immunogenetics. 50:213–219. [DOI] [PubMed] [Google Scholar]
- 46.Klein, C.A., M. Wilke, J. Pool, C. Vermeulen, E. Blokland, E. Burghart, S. Krostina, N. Wendler, B. Passlick, G. Riethmueller, et al. 2002. The hematopoietic system-specific minor histocompatibility antigen HA-1 shows aberrant expression in epithelial cancer cells. J. Exp. Med. 196:359–368. [DOI] [PMC free article] [PubMed] [Google Scholar]
- 47.Dib, C., S. Faure, C. Fizames, D. Samson, N. Drouot, A. Vignal, P. Millasseau, S. Marc, J. Hazan, E. Seboun, et al. 1996. A comprehensive genetic map of the human genome based on 5,264 microsatellites. Nature. 380:152–154. [DOI] [PubMed] [Google Scholar]
- 48.Khanna, R. S.R. Burrows, J. Nicholls, and L.M. Poulsen. 1998. Identification of cytotoxic T cell epitopes within Epstein-Barr virus (EBV) oncogene latent membrane protein 1 (LMP1): evidence for HLA A2 supertype-restricted immune recognition of EBV-infected cells by LMP1-specific cytotoxic T lymphocytes. Eur. J. Immunol. 28:451–458. [DOI] [PubMed] [Google Scholar]
- 49.Fleischhauer, K., D. Avila, F. Vilbois, C. Traversari, C. Bordigno, and H.J. Wallny. 1994. Characterization of natural peptide ligands for HLA-B*4402 and -B*4403: implications for peptide involvement in allorecognition of a single amino acid change in the HLA-B44 heavy chain. Tissue Antigens. 44:311–317. [DOI] [PubMed] [Google Scholar]
- 50.Kuttler, C., A.K. Nussbaum, T.P. Dick, H.-G. Rammensee, H. Schild, and K.P. Hadeler. 2000. An algorithm for the prediction of proteasomal cleavages. J. Mol. Biol. 298:417–429. [DOI] [PubMed] [Google Scholar]
- 51.Nussbaum, A.K., C. Kuttler, K.P. Hadeler, H.-G. Rammensee, and H. Schild. 2001. PAProC: a prediction algorithm for proteasomal cleavages available on the WWW. Immunogenetics. 53:87–94. [DOI] [PubMed] [Google Scholar]
- 52.Kesmir, C., A. Nussbaum, H. Schild, V. Detours, and S. Brunak. 2002. Prediction of proteasome cleavage motifs by neural networks. Protein Eng. 15:287–296. [DOI] [PubMed] [Google Scholar]
- 53.Herman, J., P. van der Bruggen, I.F. Luescher, S. Mandruzzato, P. Romero, J. Thonnard, K. Fleischhauer, T. Boon, and P.G. Coulie. 1996. A peptide encoded by the human MAGE3 gene and presented by HLA-B44 induces cytolytic T lymphocytes that recognize tumor cells expressing MAGE3. Immunogenetics. 43:377–383. [DOI] [PubMed] [Google Scholar]
- 54.Coulie, P.G., F. Lehmann, B. Lethe, J. Herman, C. Lurquin, M. Andrawiss, and T. Boon. 1995. A mutated intron sequence codes for an antigenic peptide recognized by cytolytic T lymphocytes on a human melanoma. Proc. Natl. Acad. Sci. USA. 92:7976–7980. [DOI] [PMC free article] [PubMed] [Google Scholar]
- 55.Morgan, S.M., G.W. Wilkinson, E. Floettmann, N. Blake, and A.B. Rickinson. 1996. A recombinant adenovirus expressing an Epstein-Barr virus (EBV) target antigen can selectively reactivate rare components of EBV cytotoxic T-lymphocyte memory in vitro. J. Virol. 70:2394–2402. [DOI] [PMC free article] [PubMed] [Google Scholar]
- 56.Ferrara, J.L. 1993. Cytokine dysregulation as a mechanism of graft versus host disease. Curr. Opin. Immunol. 5:794–799. [DOI] [PubMed] [Google Scholar]