

Abstract
We have used cDNA arrays to investigate gene expression patterns in peripheral blood mononuclear cells from patients with leukemic forms of cutaneous T cell lymphoma, primarily Sezary syndrome (SS). When expression data for patients with high blood tumor burden (Sezary cells >60% of the lymphocytes) and healthy controls are compared by Student's t test, at P < 0.01, we find 385 genes to be differentially expressed. Highly overexpressed genes include Th2 cells–specific transcription factors Gata-3 and Jun B, as well as integrin β1, proteoglycan 2, the RhoB oncogene, and dual specificity phosphatase 1. Highly underexpressed genes include CD26, Stat-4, and the IL-1 receptors. Message for plastin-T, not normally expressed in lymphoid tissue, is detected only in patient samples and may provide a new marker for diagnosis. Using penalized discriminant analysis, we have identified a panel of eight genes that can distinguish SS in patients with as few as 5% circulating tumor cells. This suggests that, even in early disease, Sezary cells produce chemokines and cytokines that induce an expression profile in the peripheral blood distinctive to SS. Finally, we show that using 10 genes, we can identify a class of patients who will succumb within six months of sampling regardless of their tumor burden.
Keywords: cDNA microarrays, discriminant analysis, class prediction, prognosis, CTCL
Introduction
Cutaneous T cell lymphoma (CTCL)* is the most common of the T cell lymphomas, and ∼1,500–2,000 new cases are reported in the United States each year. Causative roles in the development of CTCL have been suggested for various environmental factors and infectious agents, but the etiology of the disease remains unknown (1, 2). CTCL is characterized by the accumulation of malignant cells with a low mitotic index, suggesting that the regulatory defect allowing these cells to accumulate may reside in the apoptotic pathways (3, 4).
Mycosis fungoides (MF) and Sezary syndrome (SS) are the two major clinical variants of CTCL. MF, the most common form, is skin-associated and progresses through increasing cutaneous, and finally organ, involvement. Although treatable in early stages, MF is frequently misdiagnosed because of similarities to more benign forms of skin disease. Even with early diagnosis, 10% of MF patients with limited disease and ∼25% of those with extensive patches or plaques will develop progressive disease, eventually succumbing despite extensive therapy (5, 6). SS, a leukemic and erythrodermic variant of CTCL, is characterized by the presence of circulating lymphocytes with atypical cerebriform nuclei (Sezary cells) in the skin, lymph nodes, and peripheral blood. It is a more aggressive form of CTCL with a mean survival of 3 yr from the time of diagnosis. Immunophenotyping and genotyping of Sezary cells indicate that they arise as a clonal expansion of mature helper memory T cells (3, 4). They express cytokines characteristic of Th2, including IL-4, IL-5, and IL-10 (7–10), and fail to express Th1 cytokines, IL-12, and IFN-γ (10). Patients with MF can have blood findings typically observed in SS, and in rare cases, MF can evolve into SS, confirming a close relationship between the two conditions; information from studies on SS is likely to be applicable to MF.
Therapies using biological response modifiers, such as extracorporeal photopheresis and IFN-α, have improved survival of patients with SS (11, 12). However, 50% of patients with advanced disease do not respond to therapy, and >25% of those who respond initially will relapse and progress to fatal disease. There are presently no well-defined clinical markers for CTCL that permit an early identification of patients most likely to develop progressive disease.
We have used cDNA arrays to study gene expression patterns in patients with leukemic phase CTCL to identify markers that will be useful for diagnosis, prognosis, and providing new targets for therapy. We describe the analysis of gene expression in patients with high Sezary cell counts as they compare with Th2-skewed control cells from healthy volunteers, and we identify the most informative differentially expressed genes. We demonstrate that penalized discriminant analysis (PDA; references 13, 14), trained on patients with high Sezary cell counts, identifies genes that can correctly classify patients with low (5%) Sezary cell counts from controls. In addition, we use PDA to identify a 10-gene panel whose expression patterns distinguish patients with short survival times, regardless of the blood tumor burden when they were sampled.
Materials and Methods
Purification of PBMCs from CTCL Samples and Preparation of Normal Controls.
PBMCs were obtained by Ficoll gradient separation from peripheral blood of both normal volunteers and leukemic phase CTCL (15). A total of 48 viably frozen CTCL patient samples with Sezary cells ranging from 5 to 99% of the lymphocyte population were analyzed (Table S1 available at http://www.jem.org/cgi/content/full/jem.20021726/DCI). The Ficoll-purified PBMC fraction from high SS patients was 60–95% CD4+ malignant cells with a predominantly Th2 phenotype, and in decreasing abundance, small percentages of B cells, monocytes, and dendritic cells. Th2-skewed PBMCs, prepared by culturing for 4 d in IL-4 and anti–IL-12, were used as controls for the high Sezary cell patients, as many characteristics of advanced disease are associated with a Th2-polarized immune response. Under these conditions, >95% of the CD4+ T cells express the Th2 phenotype (16–18). Th1-skewed PBMCs were prepared by culturing in IL-12 and anti–IL-4 for 4 d (19). CTCL patients are described as high or low Sezary with reference to the blood tumor burden, and were selected based on percent circulating Sezary cells, regardless of whether erythroderma was also present. All samples were collected with appropriate patient consent and Institutional Review Board approval.
cDNA Arrays.
The cDNA filter arrays were purchased from The Wistar Institute Genomics facility. Three 2.5 × 7.5–cm nylon filters, HA-01, -02, and -03, carrying a total of 6,600 probes for 4,500 individual genes were used to analyze the 18 high Sezary count (>60% Sezary cells) samples, and 12 samples from healthy controls. The 30 samples were hybridized as a single batch on sequentially printed arrays. An additional 30 low Sezary count samples and 8 controls were analyzed only on gene filter HA03. All arrays used in this work were printed from the same PCR preparations. Reproducibility papers show a >90% correlation between samples hybridized in triplicate. Sequence-verified clones were purchased from Research Genetics. Clones for significant genes (SG) were sequenced for verification.
RNA Isolation, Amplification, and Hybridization.
RNA was isolated using Tri-reagent (Molecular Research Center) and total RNA samples were amplified (aRNA) using a modified T7 protocol (20), which can be accessed at the Stanford University Microarray protocols website. 0.5 μg aRNA target was labeled with 33P, 3,000–5,000 Ci/mM using reverse transcriptase. Hybridization was in 2.5 ml Micro-Hyb (Research Genetics) at 42°C for 18 h. HA-01 and -03 filters were hybridized with the same labeled target. HA-02 was hybridized separately with the same aRNA preparation. Filters were exposed to a PhosphorImager screen for 4 d, scanned at 50-μm resolution on a Storm PhosphorImager, and visualized using ImageQuant (Molecular Dynamics).
Real-time PCR.
The cDNAs were generated from 0.5 μg aRNA using Superscript II (Life Technologies). Gene-specific primers (IDT, Inc.) are listed in Table S2, available at http://www.jem.org/cgi/content/full/jem.20021726/DCI. PCR was performed in a Light Cycler (Roche Diagnostics). Cycle parameters were as follows: 94°C, 3-min hot start and 40 cycles of 94°C, 10 s; 56°C or 60°C, 10 s; and 72°C, 25 s. Product specificity was checked by melting curve analysis and gel electrophoresis, and relative gene expression levels were determined by comparison with a standard curve and normalized by dividing the relative gene expression by the mean expression of three housekeeping genes, SF3A1, CCT3, and MBD4.
Array Analysis.
The data for each array were analyzed with ArrayVision (Imaging Research), using the median pixel for each spot and local background correction. Expression values for each array were normalized by the background-corrected signal median spot of the array and transformed to corresponding z-scores for clustering. Student's t tests, frequency analysis, and permutations were done using Excel and Visual Basic. Dynamic range of signals was, on average, 10–20,000 (normalized median density of 0.15–3,000). The detection limit for these conditions and arrays was calibrated by quantitative PCR (QPCR) with a plasmid standard of ∼0.03 molecules per cell.
PDA.
Supervised classification of genes and arrays was performed using PDA (13, 14) as provided by CLEAVER (Classification of Expression Array Version 1.0 available at http://classify-dev.stanford.edu). This program, a variant of linear discriminant analysis, classifies unknown samples based on the information from a two-class training set used to identify genes, whose expression levels have a maximum variation between the training classes, and a minimal variation within each training class. PDA adds a “penalty” in the form of a diagonal matrix, which is added to the covariance matrix, allowing the latter to be inverted even though genes greatly outnumber samples. We found that the exact value of this penalty (between 100 and 1,000) did not significantly alter the ranks of the informative genes. The implementation of PDA used in CLEAVER limits the number of genes used in training and subsequent classification to the 500 whose expression best distinguishes between the positive (patient) and negative (control) examples. Although more genes may be inputted to the program and are correlated with the training classes, no more than 500 are used in classification. The program outputs two sets of results: a positive or negative score that indicates how well a sample is assigned to a particular class and a “predictive power” assigned to each gene as a measure of its ability to discriminate the two classes. After demonstrating 100% cross-validation accuracy with a complete gene set, we applied a Student's t test filter of P < 0.1 to the input data to help identify the best classifiers by eliminating genes that contribute a disproportionate amount of noise to the analysis.
Selection of Correlated Gene Clusters.
Clusters of genes whose expression patterns among patients were highly correlated with selected seed genes in a microarray data set were selected as follows. An average expression profile for the seed was calculated as a weighted sum of the gene expression values for all genes that have a correlation coefficient with the seed gene higher than 0.7. The correlation coefficients were used as weights for this calculation. Then, the correlation coefficients between the computed average profile and each gene in the dataset was determined. The correlation coefficients were binned, and their distribution were determined to permit assignment of genes to the cluster that are above a selected correlation coefficient. Each gene in the dataset was used as a seed. When this analysis was repeated on permuted expression values for each gene, there was no correlation over 0.7.
Online Supplemental Material.
We provide here a more detailed description of patients and controls used in this paper as well as sequences of the PCR primers used to obtain the results shown in Table I. In addition, we include the detailed results of analysis described in the text, including several classifications and the members of gene signatures for AHRB, CD1D, and FDFT1. Online supplemental material is available at http://www.jem.org/cgi/content/full/jem.20021726/DC1.
Table I.
Verification of Array Using Quantitative Real-time PCR
| Genes
|
Array experiment
|
Real-time experiment
|
|||||||
|---|---|---|---|---|---|---|---|---|---|
| Name | Symbol | Th2 Mean ± SD |
Patient Mean ± SD |
Ratio | P valuea | Th2 Mean ± SD |
Patient Mean ± SD |
Ratio | P valuea |
| Dual specificity phosphatase 1 | DUSP1 | 0.2 ± 0.1 | 3.9 ± 2.9 | 25 | <0.001 | 0.1 ± 0.1 | 1.8 ± 1.5 | 31 | <0.001 |
| Plastin T | PLS3 | 0.7 ± 0.2 | 10 ± 9.7 | 14 | <0.001 | 0.01 ± 0.01 | 3.5 ± 6.4 | 479 | 0.034 |
| Rho B | ARHB | 0.3 ± 0.2 | 3.4 ± 3.7 | 11 | 0.002 | 0.2 ± 0.1 | 1.6 ± 1.6 | 8 | 0.002 |
| Jun B | JUNB | 1 ± 0.3 | 4.9 ± 3.2 | 5 | <0.001 | 0.3 ± 0.2 | 3.1 ± 2.9 | 10 | <0.001 |
| Integrin β1 | ITGB1 | 1 ± 0.7 | 4.6 ± 5.4 | 4.5 | 0.013 | 0.1 ± 0.1 | 1.4 ± 1.5 | 12 | 0.003 |
| TRAIL/APO-2 ligand | TNFSF10 | 0.7 ± 0.2 | 3 ± 3.5 | 4.2 | 0.015 | 0.3 ± 0.1 | 1.7 ± 1.4 | 6 | <0.001 |
| CX3C receptor 1 | CX3CR1 | 0.7 ± 0.4 | 3.4 ± 3.4 | 4.5 | 0.006 | 0.3 ± 0.2 | 2.1 ± 2.4 | 8 | 0.004 |
| Interferon-stimulated protein | ISG15 | 1 ± 0.3 | 4 ± 4.0 | 4.2 | 0.005 | 0.4 ± 0.3 | 3.4 ± 4.2 | 9 | 0.009 |
| Cyclin-dependent kinase I 2D | CDKN2D | 1 ± 0.4 | 2.8 ± 1.6 | 2.7 | <0.001 | 0.4 ± 0.1 | 1.7 ± 0.9 | 4.3 | <0.001 |
| Intercellular adhesion mol. 2 | ICAM2 | 3.7 ± 1.2 | 9.8 ± 3.8 | 2.7 | <0.001 | 0.4 ± 0.2 | 1.4 ± 0.8 | 3.3 | <0.001 |
| CD1D | CD1D | 0.4 ± 0.1 | 0.9 ± 0.7 | 2.6 | 0.005 | 0.1 ± 0.1 | 2.4 ± 2.5 | 16 | 0.001 |
| GATA3 | GATA3 | 1.3 ± 0.6 | 3.2 ± 1.6 | 2.5 | <0.001 | 0.3 ± 0.2 | 2.2 ± 1.5 | 7 | <0.001 |
| Selectin L | SELL | 5.4 ± 2.2 | 10.8 ± 4.6 | 2 | <0.001 | 0.6 ± 0.4 | 1.8 ± 1.1 | 2.8 | <0.001 |
| CD44 | CD44 | 13.3 ± 3.7 | 7.3 ± 3.0 | −1.8 | 0.001 | 2.3 ± 2.3 | 1 ± 0.6 | −2.3 | 0.188 |
| CD8+α | CD8A | 1.4 ± 0.7 | 0.6 ± 0.3 | −2.2 | 0.01 | 1.3 ± 0.7 | 0.1 ± 0.1 | −14 | <0.001 |
| Chemokine (C-C motif) Rec. 1 | CCR1 | 6.8 ± 3.6 | 2.7 ± 4.4 | −2.5 | 0.019 | 1.4 ± 1.0 | 0.9 ± 1.4 | −1.6 | 0.277 |
| Signal trans. & act. of trans. 4 | STAT4 | 2.7 ± 1.6 | 0.7 ± 0.8 | −3.7 | 0.005 | 1.4 ± 0.4 | 0.3 ± 0.3 | −4.5 | <0.001 |
| Interleukin 1 receptor type II | IL1R2 | 2 ± 0.8 | 0.5 ± 0.2 | −3.8 | <0.001 | 2.2 ± 1.3 | 0.1 ± 0.1 | −26 | 0.001 |
| CD8+β | CD8B | 3.7 ± 2.2 | 0.7 ± 0.3 | −5 | 0.004 | 1.7 ± 0.8 | 0.4 ± 0.3 | −4.6 | <0.001 |
| CD26 | DPP4 | 1.5 ± 0.6 | 0.2 ± 0.1 | −7 | <0.001 | 1.5 ± 0.9 | 0.1 ± 0.1 | −19 | 0.001 |
| CD40 | TNFRSF5 | 3.3 ± 1.8 | 0.5 ± 0.3 | −7 | 0.001 | 1.9 ± 0.9 | 0.3 ± 0.3 | −6 | <0.001 |
| Cytochrome P450 1B1 | CYB1B1 | 15 ± 13.4 | 1.1 ± 1.0 | −13 | 0.015 | 1.7 ± 1.3 | 0.2 ± 0.2 | −6 | 0.001 |
| Interleukin 1 receptor type I | IL-1R1 | 4.0 ± 3.9 | 0.6 ± 0.2 | −18 | 0.032 | 2.1 ± 1.8 | 0.2 ± 0.2 | −11 | 0.014 |
| IκBα | NFKBIA | 7.2 ± 2.9 | 9.5 ± 6.2 | 1.3 | 0.193 | 0.5 ± 0.4 | 1.1 ± 1.6 | 2.2 | 0.135 |
| Rac/Cdc42 GEF 6 | ARHGEF6 | 5.9 ± 2.3 | 7.8 ± 2.4 | 1.3 | 0.066 | 0.7 ± 0.2 | 1.5 ± 1.2 | 2.2 | 0.013 |
| Zinc finger protein 161 | ZNF161 | 2.8 ± 0.7 | 3.1 ± 0.5 | 1.1 | 0.366 | 1.3 ± 1.0 | 1.5 ± 1.2 | 1.2 | 0.586 |
| Superoxide dismutase 1 | SOD1 | 14 ± 5.2 | 14.8 ± 5.8 | 1.1 | 0.737 | 1.1 ± 0.9 | 2.4 ± 2.4 | 2.2 | 0.051 |
| Cyclophilin A | PPIA | 10.8 ± 3.6 | 10.7 ± 3.6 | 1 | 0.939 | 1 ± 1.3 | 1.6 ± 1.2 | 1.7 | 0.207 |
| NFκB1 (p105) | NFKB1 | 2.7 ± 0.8 | 2.8 ± 1.4 | 1 | 0.875 | 0.7 ± 0.6 | 0.5 ± 0.3 | −1.4 | 0.408 |
| Maltase-glucoamylase | MGAM | 1 ± 0.4 | 0.9 ± 0.4 | −1.2 | 0.368 | 0.8 ± 1.2 | 1.3 ± 1.3 | 1.7 | 0.314 |
| Fas | TNFRSF6 | 1.1 ± 0.5 | 0.9 ± 0.4 | −1.2 | 0.374 | 0.7 ± 0.6 | 0.6 ± 0.6 | −1.2 | 0.631 |
| Plastin L | LCP1 | 40.4 ± 25 | 24.0 ± 11 | −1.7 | 0.095 | 0.9 ± 0.4 | 0.9 ± 0.3 | −1 | 0.958 |
| CD40 ligand | TNFSF5 | na | na | na | na | 0.3 ± 0.1 | 1.5 ± 2.0 | 6 | 0.015 |
| IL-18 | IL-18 | na | na | na | na | 1 ± 0.9 | 1.5 ± 1.0 | 1.5 | 0.22 |
| Fas ligand | TNFSF6 | na | na | na | na | 1.2 ± 0.6 | 0.5 ± 0.5 | −2.4 | 0.014 |
Determined by Student's t test.
Results
Selection of Patients and Controls.
The 18 samples from 17 patients used for the initial studies were selected to have high Sezary cell counts, ranging from 60 to 99% of total circulating lymphocytes. Two samples from patient S118 were taken 1 yr apart. All patients had ratios of CD4+/CD8+ T cells >10. This extreme departure from the normal 3:2 CD4+/CD8+ ratio is characteristic of leukemic phase disease. Th2-skewed PBMCs were selected as controls for the high Sezary cell patients as many characteristics of advanced disease are associated with a Th2-polarized immune response including: (a) high serum levels of IgE and IgA; (b) increasing serum levels of antiinflammatory cytokines IL-4, IL-5, and IL-10; (c) a general loss of T cell responsiveness to mitogens and antigens (21); and (d) lack of expression of the β2 chain of the IL-12 receptor (15). For the discriminant analysis of samples with low Sezary cell counts, we included data for untreated PBMCs and Th1-skewed controls where indicated, to provide greater diversity within our control population.
Statistical Analysis of Array Data.
To find candidate differentially expressed genes, normalized expression levels were compared between 18 high Sezary cell samples and 9 Th2-skewed controls. The dataset was first analyzed gene-by-gene with a univariate Student's t test. Fig. 1 A shows the number of SG detected as a function of the P value. At P < 0.01, 385 unique genes were found to be significantly up-regulated or down-regulated in patients relative to the controls, rising to 1,400 genes at P < 0.10. To estimate the number of false-positive genes, we permuted the experimental and control labels (10,000 times), performed the Student's t test on each permutation, and determined the number of SG that would arise by chance if patients and controls were drawn from the same population. The median number of these SG, which are false positives (FP) relative to the original dataset, was calculated for each permutation at each P value cutoff as shown. The median number of FP at P < 0.01 is 27, or ∼8% of the 385 SG at that P value (Fig. 1 A). The number of true positive genes (the number of observed SG minus the number of FP [SG − FP]) rises to a near-constant value of ∼1,000 at P = 0.15. This ignores the number of false negative genes arising in the observed data that would increase the number of truly positive genes. If this value is compared with the number of true positives at a given P value, we can see that if we only consider the genes detected at P < 0.01, many potentially SG would be missed (Fig. 1; MG).
Figure 1.

Genes differentially expressed by a Student's t test in PBMCs from SS patients compared with Th2 controls. (A) Significant genes (SG) were detected at each P value. False positives (FP) were estimated by permuting the sample labels 10,000 times; (SG − FP) estimates of the number of true positives (TP). The true positive curve attains a maximum value of 1,000, suggesting that a significant number of differentially expressed genes are present at P values >0.01. The number of missed genes (MG, defined as 1,000 − [SG − FP]) is <100 at P = 0.10. (B) The number of observed SG corrected by the maximum number of SG found in permuted data as a function of P value cutoff and percentile of the permutations.
If stringency is increased and higher percentiles of permutations are used (60–95th), and these values are subtracted from SG, fewer and fewer true positive genes are reported (Fig. 1 B). However, even if the 95th percentile of the permuted samples is used, 300 true positive genes are still identified at P < 0.01.
Genes With Highly Altered Expression Levels in Patients with High Sezary Cell Counts.
Of the 385 differentially expressed genes identified at P < 0.01, the average changes in expression relative to Th2 controls range from 25-fold for overexpression to 7-fold for underexpression. Fig. 2 is a TreeView (22) showing the variation in expression of the 135 P < 0.01 genes that are either over- or underexpressed in patients more than twofold. The most highly changed expression levels are for dual specificity phosphatase 1 (DUSP1), 25-fold overexpressed, and CD40 (TNFRSF5), 7-fold underexpressed. Other genes overexpressed >10-fold in patients are as follows: versican, a cell surface protein that binds L-selectin and regulates chemokine function (23); plastin T (PLS3), an actin-bundling protein not normally expressed in T cells (24); and the small GTP-binding protein, RhoB (ARHB), involved in cytoskeleton reorganization and signal transduction (25–27). In addition, the message levels for the receptor for IL-11 and the TNF related cytokine, TRAIL (TNFSF10), are significantly increased. IL-11 is a strong inducer of Th2 differentiation, and signals the down-regulation of IL-12 (28), both characteristic of Sezary cells. Underexpressed genes include CD26 (DPP4), whose loss has been suggested to be a strong marker for CTCL (29). Both CD8+α and CD8+β message levels are also down, which is consistent with the observed decrease in CD8+ T cell numbers (30) with advancing disease. Other significantly down-regulated genes include the IL-1 receptors, signal transducer and activator of transcription 4 (STAT4), and the IL-2 receptor β chain.
Figure 2.
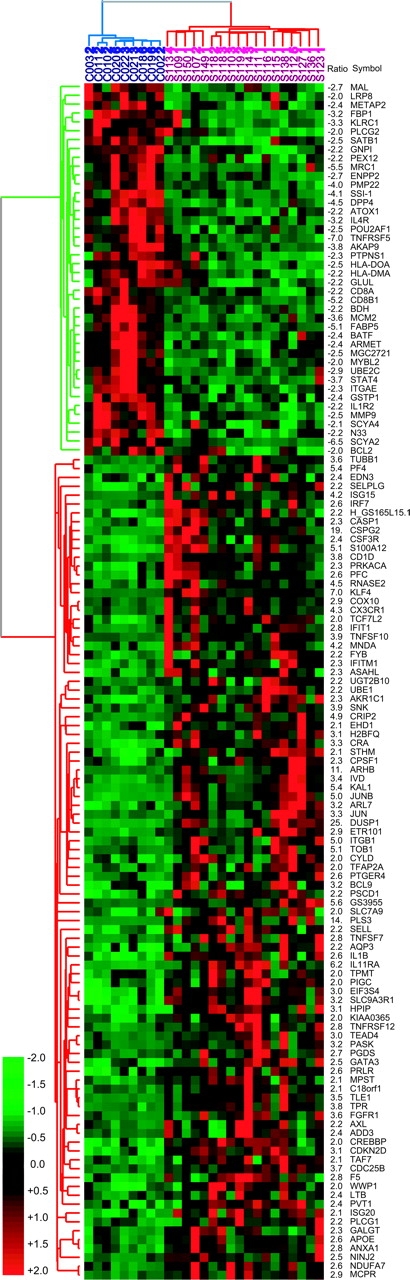
TreeView of P < 0.01 SG up- or down-regulated greater than twofold in 18 high tumor burden patients (red) compared with 9 Th2-skewed controls (blue). Gene symbols are taken from Source (http://genome-www5.stanford.edu/cgi-bin/SMD/source//BatchSearch). The green cluster identifies down-regulated genes and the red cluster identifies up-regulated genes in patients versus controls. Values for fold increases (+) or decreases (−) precede the gene symbols.
Validation of Array Results Using Quantitative Real-time PCR.
To determine the accuracy of changes in gene expression reported by our arrays, selected genes were assayed by QPCR for the 18 high Sezary cell samples and 9 Th2 controls. The direction of change by PCR was in agreement for every gene tested. Of the 32 genes tested, only 1 gene, PLS3, showed an important difference in the two assays (500-fold up by QPCR and only 14-fold up by array), probably attributable to some crosshybridization that raised the array control values. Over the remaining 31 genes, for ∼75%, the two ratios agreed within a factor of two, the average of the microarray ratio to the QPCR ratio was 0.70, and the median was 0.61. The comparison of the PCR and microarray assay, (Table I) shows that the arrays give a highly reliable estimate of the direction of change in gene expression with a tendency to underestimate quantitative differences.
Expression Profiles of a Small Number of Genes Identified by PDA Correctly Classify High Sezary Patients and Normal Control Samples.
We used PDA, as implemented by CLEAVER (13, 14), to identify genes with the highest power to correctly distinguish patients from controls. To identify the best genes for distinguishing the two sample classes, we first trained the PDA program on the 18 high Sezary cell samples versus 9 Th2-skewed and 3 untreated controls. Cross-validation of the samples in these two classes is 100% accurate (Figure S1 available at http://www.jem.org/cgi/content/full/jem.20021726/DCI).
To select the best features for classification, we applied a P < 0.10 P value cutoff to eliminate genes that contribute a disproportionate number of FP. The genes identified by Student's t test at P < 0.10 were used rather than the 385 P < 0.01 gene set in order to include genes with higher variance that might be good class predictors. To assess the total number of genes that were good classifiers, the genes were ranked according to the absolute value of their assigned predictive power. When the logarithm of the predictive power was plotted against the logarithm of the rank, 200 genes were found to have a faster rise in predictive power than in rank (Figure S2 available at http://www.jem.org/cgi/content/full/jem.20021726/DCI). According to Zipf's law (31), these 200 genes are expected to most effectively differentiate patients from controls. As few as four of these genes, for example, either (a) STAT4, TOB1, CD26, and TRAIL, or (b) STAT4, TOB1, SEC61A1, and GS3686, can be used for correct classification. The 90 best classifiers for this gene set are shown in Fig. 3 . It is important to note that half of the 90 genes are in the P < 0.10 dataset, but not the more restricted P < 0.01 dataset.
Figure 3.
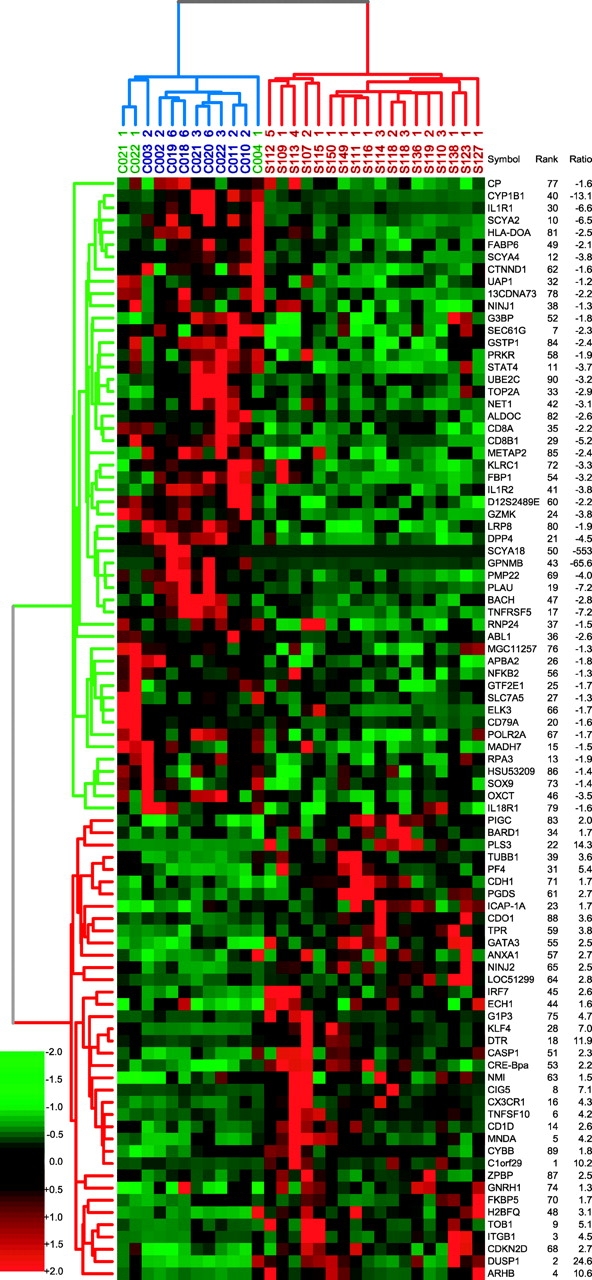
Dendrogram of the most informative 90 genes that discriminate high Sezary patients from normal controls using PDA. Patient labels are shown in red, Th2 controls in blue, and untreated PBMCs in green. Rank is a measure of the predictive power, and ratio is the average fold change between patients and controls; the minus indicates down-regulation in patients.
Classification of Sezary Patients with Low Tumor Burden.
Having achieved a 100% cross-validation on our high blood tumor burden dataset, we used PDA to classify a holdout set of 27 patient samples with 5–53% circulating Sezary cells, and 8 additional controls, including 1 untreated PBMC and 7 Th1-skewed PBMCs. The high Sezary cell samples were used again as the training set. Because the additional patients and controls had been analyzed using only the genes on human array HA-03, we used the 500 genes from HA-03, which were in the P < 0.10 dataset to train the PDA. We posed two questions: (a) Can predictors identified on the patients with high Sezary cell counts be used to classify patients with low Sezary cell counts? (b) How many genes are required to achieve accurate classification?
To determine the minimal number of genes needed to classify the holdout set, we progressively removed the up- and down-regulated genes with lower predictive powers, as determined by the training set. Fig. 4 A shows the effect of reducing the number of genes used for classification from 500 to 8 genes. From 40 to 500 genes, the classification is virtually identical, and classification is 100% accurate. When the classification set is reduced to 20 genes, 1 patient sample, S139.1, is classified as a control (see Discussion). This patient was subsequently found to suffer from a peripheral T cell lymphoma resembling Kimura's disease (32), not SS. If we reduce the number to eight genes, we find that one normal control, C022–1, is misclassified (Fig. 4 A, arrow). To determine whether the 20 genes with the highest predictive powers were uniquely required for accurate classification, we reversed our procedure and sequentially removed genes with the highest, rather than the lowest, predictive power from the 500-gene dataset. We find that the best 85 genes, equally divided between positive and negative classifiers, can be removed before classification becomes <100% (unpublished data). This shows that although many more genes are required, the 300 genes with lower predictive powers can still classify accurately.
Figure 4.

Classification of low tumor burden CTCL patients using PDA. (A) Effect of decreasing the number of class predictors on classification. Seven measurements are included in the 40–500 genes tracing, 500, 400, 300, 200, 100, 80, and 40 genes. Each point represents the average predictive score for the aforementioned seven classifiers, and the error bars show one standard deviation. Data are shown separately for 20- and 8-gene classifiers. The lower curve shows the percent Sezary cells in each analyzed sample. For each classifier, the predictive scores are normalized by the average predictive score of patients. The shaded areas indicate values for replicate samples from the training set. (B) Classification of 27 low CTCL patients and 14 controls with 40 genes (PBMCs = untreated). Negative values indicate the expression profiles that define the negative or control class and positive values identify samples assigned to the positive or patient class. The height of the columns measure how well each sample is classified by the list of 40 genes. Percent Sezary cells are indicated for each sample. (C) List of the 40 best classifiers. Genes are listed top to bottom, sorted by the value of their predictive power. Genes up-regulated in patients are in the right column; genes down-regulated in patients are in the left column.
Fig. 4 B shows the classification when the number of controls in the training set was reduced to four Th2 and two untreated PBMC controls. This allowed us to include more of the Th2 controls in the test set. The 40 genes identified in the training set with fewer controls also perfectly classify the additional 27 CTCL patients and 14 normal controls. If we reduce the number of classifiers to the top 20 genes, once again the Kimura's disease sample fails to classify as a CTCL patient. The list of the 40 genes used for the classification is shown in Fig. 4 C.
Expression Patterns for Clusters of Genes Are Found to Vary Coordinately among CTCL Patients.
Among the differentially expressed genes in our CTCL patients, overexpressed genes exhibit much greater patient-to-patient variability in expression levels than underexpressed genes do. This is evident from the TreeView shown in Fig. 2. The alternating expression levels across patient samples for some of our top classifiers and highly differentially expressed genes appeared to be highly correlated, for example, RHOB with DUSP1. These correlations could be important for the identification of patient subsets, so we identified clusters of genes with highly correlated expression among the up-regulated genes in our P < 0.10 dataset. To identify an expression cluster for a seed gene, we first calculated an average profile for this gene, and included all the genes that had a correlation with the average profile that was >0.7 in the cluster. The rationale for using 0.7 as a cutoff is given in Fig. 5 A, which compares the degree of correlation of expression values among genes in our observed dataset with that in a dataset in which the expression values for each gene were randomly permuted. Fig. 5 A shows the mean and 95th percentile distributions of correlation coefficients on a dataset containing only up-regulated genes from P < 0.10 dataset and the same distributions calculated on the same dataset but with the expression values randomly permuted. The distributions of correlated genes obtained on the permuted dataset show no genes with correlation coefficients >0.7, even for the 95th percentile of permutations. The distributions obtained on the real dataset have a substantial number of genes with correlation coefficients >0.7, suggesting that they do not belong to a cluster by chance. We calculated correlated clusters for all 1,065 up-regulated genes in the dataset and identified only three clusters that included a significant number of members with correlations >0.7 (Table S3 available at http://www.jem.org/cgi/content/full/jem.20021726/DCI). Many of the genes included are genes from the P < 0.01 dataset. The cluster identified using the RhoB (Fig. 5 B) as the seed gene contains DUSP1, v-JUN, IEP, JunB, JunD, and DNAj (Fig. 5 B), all are immediate early genes. The cluster identified with farnesyldiphosphate farnesyltransferase 1(FDFTase1) as the seed gene includes small GTP binding proteins, vav2 and cdc42, which are modified by this enzyme, but not RhoB, which is also modified by FDFTAse1 (Fig. 5 C). Finally, there is a cluster with CD1D including caspase 1, versican, and S100A12, all are included in the P < 0.01 gene list (Fig. 5 D).
Figure 5.

Clusters of correlated genes. (A) Distribution of the number of genes in patients that correlates with an average expression profile calculated for each of 1,065 P < 0.1 genes: closed symbols, observed expression values; open symbols, permuted expression values; circles, 50th percentile of observations; and triangles, 95th percentile of observations. (B–D) Weighted average expression profiles for the three largest clusters. The clusters were calculated on gene expression for the patients only. The patient samples are sorted according to survival. The 6 ST survivors are on the left and the 12 LT survivors are on the right.
Patients That Survive Less Than Six Months From the Time of Sampling Define a Distinct State of the Disease.
We also evaluated whether disease progression could be correlated with gene expression patterns. For this analysis, the 17 high Sezary cell patients were divided into two groups based on the observed survival. 6 patients who died between 1 and 6 mo from the time the sample was taken were designated short-term (ST) survivors; 11 patients who survived >12 mo (24 mo to >5 yr) were designated long-term (LT) survivors. A Student's t test analysis of the gene expression profiles for the two groups was calculated on the 4,500 genes analyzed, and identified 400 genes that were differentially expressed at P < 0.01. Based on 1,500 permutations of the patient labels, there is a <1% probability that this number of differentially expressed genes could occur by chance. There were 1,400 genes that were identified at P < 0.10 as being differentially expressed, and we applied PDA to this dataset to find the most informative genes for distinguishing between the ST and LT patients. The 38 genes with the highest predictive power are shown in the TreeView in Fig. 6 .
Figure 6.
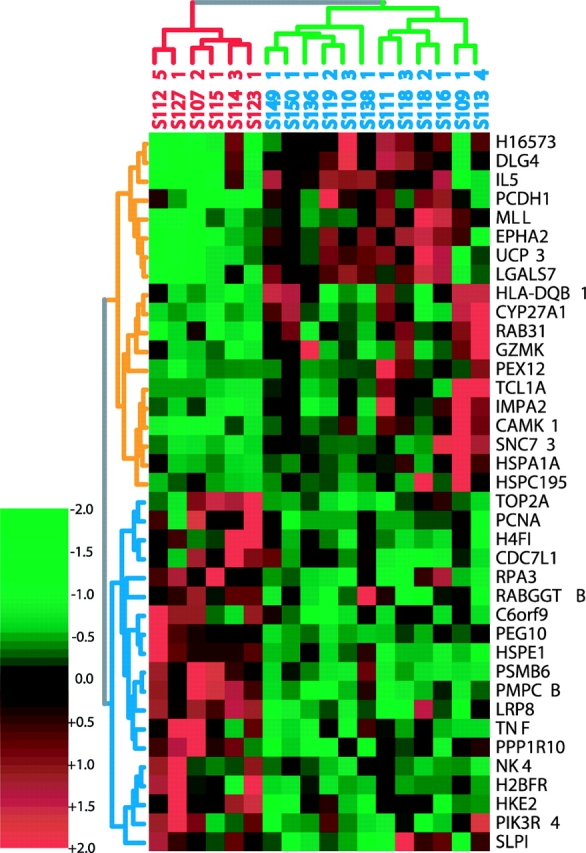
Clustering of the 38 genes whose expression levels best distinguish ST from LT CTCL survivors and the high tumor burden patients that they classify. ST survivors are labeled red, LT survivors are blue (green cluster). The genes most overexpressed in LT survivors are at the top (yellow clusters).
We extended our analysis to include patients with low Sezary cell counts, again using the data from only the HA-03 array. The 48 samples in this dataset were divided into three groups based on survival: 12 ST (1–6 mo), 25 LT (>40 mo), and 11 samples with intermediate (MT) survivals (12–40 mo). The ST and LT groups were used as a training set and the 12 MT samples were withheld for classification. When all genes on the HA03 array were used for training, the accuracy of cross-validation between ST and LT survivors was >90%, and the MT patients were classified as LT survivors (Figure S3 available at http://www.jem.org/cgi/content/full/jem.20021726/DCI). This suggests that the patients who survived <6 mo are significantly different from those that survive 12 mo or longer.
To determine which genes were the best class predictors, we performed 20 jackknife permutations of PDA on the 37 LT and ST patients with the 2,032 genes on HA03. For each permutation, we chose a random two thirds of each class for training and the remaining one third for validation. The predictive powers of the genes were ranked for each permutation, and the mean and standard deviation of the ranks were determined. The 40 genes with the highest mean ranks, and the lowest standard deviation of ranks were again used for 20 jackknife permutations of PDA (Table S4 available at http://www.jem.org/cgi/content/full/jem.20021726/DCI). This set achieves 100% accuracy in cross-validation of ST and LT survivors and as few as 10 genes from this set are enough for perfect classification (Fig. 7) . Thus, a small number of genes can be used to distinguish ST survivors from LT survivors, despite the fact they vary widely (5–99%) in Sezary cell tumor burden and clinical history.
Figure 7.

Classification of all CTCL patients by PDA according to survival. (left) Results of cross-validation using the 40 most informative genes (20 most positive and 20 most negative). Positive scores indicate ST survivors. The first 12 bars represent the ST survivors. (right) The genes used for classification. Left column, overexpressed in LT survivors; right column, overexpressed in ST survivors. The top 10 genes, 5 from each column are sufficient for 100% accurate cross-validation.
Discussion
Selection of SG.
We focused initially on patients with very high Sezary cell counts and used Th2-skewed PBMCs as our standard for comparison because of the overwhelming evidence of the Th2 nature of Sezary cells. In this way, we expected to minimize the detection of differences that were related to Th2 differentiation rather than the development of CTCL. In comparing Th2-skewed controls to patients, we find significant changes in gene expression for <10% of the genes on our arrays. We find a comparable number of changes (unpublished data) when comparing normal PBMCs to PBMC-skewed to a Th1 or Th2 response, suggesting that very few events are required to alter expression of so many genes. Because our patients have been tested against only 4,500 unique genes, it is possible that the genes responsible for the initial transformation event are not on our arrays. Nevertheless, the changes in expression we see account for many of the observed characteristics of the disease, provide markers for diagnosis and prognosis, and may also provide targets for therapy.
We used a univariate Student's t test as a primary screen to determine the number of genes that are differentially expressed between the high Sezary cell patients and Th2-skewed controls. We set two thresholds of significance that were used for the different analyses we performed (33). The genes selected at the P < 0.01 threshold include few FP, exhibit low variance among patients, and are likely to be the most useful for understanding the biology of CTCL and for designing single gene diagnostic reagents. Some of these genes are described in the following paragraphs. Because of patient variability, the most accurate class distinctions between patients and controls or early and late stage disease must be based on expression levels of many genes. We used PDA for these studies, and found numerous genes with P > 0.01 that were informative as a group, even though their individual variability was high.
Expression of Genes Associated with Th2 Differentiation.
Our array studies confirm and extend evidence of the skin homing and Th2 nature of Sezary cells. Overexpressed genes required for Th2 differentiation include transcription factors Gata-3, which also suppresses Th1 development (34, 35) and JunB required for Th2-specific IL-4 transcription (36). Amplification and overexpression of JunB has been described recently in a subset of CTCL patients (37). Overexpressed genes that are important for tissue-specific homing characteristic of Th2 cells include selectin-L ligand, preferentially found on CD4+ cells expressing Th2 cytokines (38); selectin-P ligand, which forms the skin-homing cutaneous lymphocytic antigen when modified by α-fucosyl transferase (39); and integrin β-1 (40, 41), another marker for skin-homing T cells.
Genes That Affect Apoptosis.
There has been much speculation that CTCL cells may be defective in their apoptotic pathways. However, observations at the message level from our array studies are not, in all cases, consistent with this hypothesis. We find the antiapoptotic gene Bcl2 to be underexpressed in our samples and, whereas Fas ligand message levels are decreased, T cell–associated Fas message levels are essentially unchanged. However, we do find several other patterns of gene expression that could contribute to a defect in the apoptotic pathways.
The overexpression of the proinflammatory cytokine IL-1β, a primary activator of T cell death pathways (42), and caspase 1 required for IL-1β activation, was unexpected in light of the primarily antiinflammatory phenotype exhibited by patients. However, IL-1β overexpression is offset by the underexpression of both IL-1 receptors (IL-1Rs) in patients, suggesting that this important apoptotic pathway is inactive in CTCL cells. The significance of the underexpression of the IL-1Rs to CTCL is supported by PDA studies that identify the reduction in IL-1R expression as second only to that of STAT4 in classifying patients and controls.
The chemokine receptor CX3CR1 is normally expressed on Th1 but not on Th2 (43), yet we find it to be overexpressed by more than fourfold in patients. In the central nervous system, CX3CR1 on microglia is suggested to prevent Fas-mediated cell death in response to stress (44). If CX3CR1 has a similar function in Sezary cells, this could also contribute to the proposed apoptotic defect in these cells. ICAM2, also overexpressed, has been shown to suppress TNF-α– and Fas-mediated apoptosis through its activation of the PI3K–AKT pathway (45). AKT overexpression has been associated with a variety of different cancers. The combined up-regulation of genes known to interfere with apoptosis, such as CX3CR1 and ICAM2, and down-regulation of the IL-1Rs could contribute to the observed resistance to apoptosis in Sezary cells.
Genes Not Normally Expressed in Th2.
There are presently no CTCL-specific markers. Identification of genes expressed in the malignant T cells, which are not normally expressed in that cell type, can be very useful for diagnosis and perhaps act as targets for intervention. The plastin gene family has three known members that function as actin-bundling proteins and have tissue-restricted expression patterns (46). PLS3 is expressed in a variety of tissues but not in normal lymphoid cells, which express lymphoid cell plastin instead. We find lymphoid cell plastin to be abundantly expressed in both patients and controls, but inappropriate PLS3 expression is restricted to the CTCL samples. PLS3 expression was detected in 35 out of the 45 patient samples surveyed by arrays. Both lymphoid and PLS3s were coexpressed in all cases. Transfection papers have suggested that these highly related proteins have differences in localization patterns and in their interactions with cytoskeletal accessory proteins and, therefore, may have somewhat different functions (47). The inappropriate expression of a nonlymphoid marker, such as PLS3, and a non-Th2 marker, such as CX3CR1, in the malignant cells could be used as robust markers for diagnosis.
Genes That Have High Predictive Power to Classify Patients and Controls.
We reported previously the loss of STAT4 expression in CD4+ Sezary cells in a small group of patients (15). We have now confirmed and extended those studies to the 45 patient samples analyzed in this work. The loss of expression of STAT-4, which is required for Th1 T cell differentiation (48, 49), is one of the most significant characteristics of CTCL patent samples. STAT4 is one of two genes that can be used in PDA to classify high Sezary cell patients from controls by themselves and one of eight genes that classify patients with low percentages of circulating Sezary cells, suggesting that the loss of STAT4 may be an early event in the development of CTCL.
The small GTPase RhoB is another of the top classifiers identified in the PDA studies. Like PLS3, RhoB interacts with the actin cytoskeleton. As a GTP-binding protein, RhoB has the capacity to modulate downstream events, and its activity is dependent on posttranslational modifications that can be catalyzed by either farnesyl transferases or geranylgeranyltransferases. Farnesyl transferase inhibitors have been under intense scrutiny for their potential in treating cancers that harbor Ras mutations. Although there are some observations that contradict the model (46), there is a large body of evidence that supports the hypothesis that the efficacy of these inhibitors in treating cancers is due to their effects on RhoB (50–52).
Although we were able to accurately classify our high Sezary cell patients and controls with as few as two genes (STAT4 and RhoB), one of our main objectives was to develop biomarkers that could identify patients with low tumor burdens that are more difficult to recognize clinically. We found that when the classification gene set was reduced to the 20 top genes, all controls and all but 1 patient were properly classified. On reexamination, the misclassified patient had skin findings typical of Kimura's disease (53) but blood findings in keeping with leukemic phase CTCL, including a high CD4+/CD8+ ratio, eosinophilia, and a circulating T cell clone identified by a chromosomal abnormality. Despite the many similarities to SS, this Kimura's patient was properly identified by PDA. Expression patterns of STAT-4 and RhoB alone could be used to correctly classify 26 out of the 29 CTCL patients and all but 1 untreated control, but there are many sets of 10 genes that are as good as or better classifiers than these 2 genes.
Classification of ST Survivors.
We also found that patients who are ST survivors, and are usually resistant to additional therapy, have a detectably different gene expression pattern from patients classified as MT and LT survivors, independent of their tumor burden. The finding of a “terminal signature” in these patients has a number of implications. Perhaps the most obvious and important is that an accumulation of a high percentage of Sezary cells is not an optimal index of the severity of disease. Because CTCL patients may die from a number of different causes, it is striking that a characteristic gene expression pattern can be detected in their peripheral immune cells when death is imminent. If this pattern is confirmed using additional patient samples, it should be used to identify patients who might benefit from more aggressive therapies that would otherwise not be recommended until later times.
The ability to identify patients with as few as 5% circulating Sezary cells using PDA suggests that the malignant cells, as a function of the cytokines and chemokines they release, induce a pattern of gene expression in the peripheral blood that is distinctive to CTCL. Comparable diagnostic signatures may be detectable in the immune cells of patients with other cancers, and other types of diseases. A systematic examination of the gene expression profiles of peripheral immune cells from a variety of patients should be undertaken.
Acknowledgments
We wish to thank S. Raychaudhuri for helpful discussions of CLEAVER, L. Montaner for critically reading the manuscript, and The Wistar Editorial Department for preparing the manuscript.
This work was supported by grants U01 CA85060, R21 CA81370, and the Pennsylvania Tobacco Settlement grant ME 01-740 to L. Showe; A. Loboda is supported by the National Cancer Institute training grant T32 CA09171; and The Wistar Institute Array Facility is supported in part by grant P30 CA10815-34S3. We would also like to acknowledge the support of the Microarray Network grant NSF-RCN 0090286 to M.K. Showe.
L. Kari, A. Loboda, and M. Nebozhyn contributed equally to this work.
The online version of this article includes supplemental material.
Footnotes
Abbreviations used in this paper: CTCL, cutaneous T cell lymphoma; DUSP1, dual specificity phosphatase 1; FP, false positives; IL-1R, IL-1 receptor; LT, long-term; MF, mycosis fungoides; MT, intermediate; PDA, penalized discriminant analysis; PLS3, plastin T; QPCR, quantitative PCR; SG, significant genes; SS, Sezary syndrome; ST, short-term; STAT4, signal transducer and activator of transcription 4.
References
- 1.Li, G., B.R. Vowels, B.M. Benoit, A.H. Rook, and S.R. Lessin. 1996. Failure to detect human T-lymphotropic virus type-I proviral DNA in cell lines and tissues from patients with cutaneous T-cell lymphoma. J. Invest. Dermatol. 107:308–313. [DOI] [PubMed] [Google Scholar]
- 2.Kim, Y.H., and R.T. Hoppe. 1999. Mycosis fungoides and the Sezary syndrome. Semin. Oncol. 26:276–289. [PubMed] [Google Scholar]
- 3.Dereure, O., P. Portales, J. Clot, and J.J. Guilhou. 2000. Decreased expression of Fas (APO-1/CD95) on peripheral blood CD4+ T lymphocytes in cutaneous T-cell lymphomas. Br. J. Dermatol. 143:1205–1210. [DOI] [PubMed] [Google Scholar]
- 4.Edelson, R.L. 2001. Cutaneous T cell lymphoma: the helping hand of dendritic cells. Ann. NY Acad. Sci. 941:1–11. [PubMed] [Google Scholar]
- 5.Kim, Y.H., K. Bishop, A. Varghese, and R.T. Hoppe. 1995. Prognostic factors in erythrodermic mycosis fungoides and the Sezary syndrome. Arch. Dermatol. 131:1003–1008. [PubMed] [Google Scholar]
- 6.Kim, Y.H., S. Chow, A. Varghese, and R.T. Hoppe. 1999. Clinical characteristics and long-term outcome of patients with generalized patch and/or plaque (T2) mycosis fungoides. Arch. Dermatol. 135:26–32. [DOI] [PubMed] [Google Scholar]
- 7.Dummer, R., P.W. Heald, F.O. Nestle, E. Ludwig, E. Laine, S. Hemmi, and G. Burg. 1996. Sezary syndrome T-cell clones display T-helper 2 cytokines and express the accessory factor-1 (interferon-gamma receptor beta-chain). Blood. 88:1383–1389. [PubMed] [Google Scholar]
- 8.Nickoloff, B.J., D.P. Fivenson, S.L. Kunkel, R.M. Strieter, and L.A. Turka. 1994. Keratinocyte interleukin-10 expression is upregulated in tape-stripped skin, poison ivy dermatitis, and Sezary syndrome, but not in psoriatic plaques. Clin. Immunol. Immunopathol. 73:63–68. [DOI] [PubMed] [Google Scholar]
- 9.Rook, A.H., B.R. Vowels, C. Jaworsky, A. Singh, and S.R. Lessin. 1993. The immunopathogenesis of cutaneous T-cell lymphoma. Abnormal cytokine production by Sezary T cells. Arch. Dermatol. 129:486–489. [PubMed] [Google Scholar]
- 10.Vowels, B.R., S.R. Lessin, M. Cassin, C. Jaworsky, B. Benoit, J.T. Wolfe, and A.H. Rook. 1994. Th2 cytokine mRNA expression in skin in cutaneous T-cell lymphoma. J. Invest. Dermatol. 103:669–673. [DOI] [PubMed] [Google Scholar]
- 11.Rook, A.H., K.R. Suchin, D.M. Kao, E.K. Yoo, W.H. Macey, B.J. DeNardo, P.G. Bromely, Y. Geng, J.M. Junkins-Hopkins, and S.R. Lessin. 1999. Photopheresis: clinical applications and mechanism of action. J. Investig. Dermatol. Symp. Proc. 4:85–90. [DOI] [PubMed] [Google Scholar]
- 12.Gottlieb, S.L., J.T. Wolfe, F.E. Fox, B.J. DeNardo, W.H. Macey, P.G. Bromley, S.R. Lessin, and A.H. Rook. 1996. Treatment of cutaneous T-cell lymphoma with extracorporeal photopheresis monotherapy and in combination with recombinant interferon alfa: a 10-year experience at a single institution. J. Am. Acad. Dermatol. 35:946–957. [DOI] [PubMed] [Google Scholar]
- 13.Hastie, T., A. Buja, and R. Tibshirani. 1995. Penalized discriminant analysis. Annals of Statistics. 23:73–102. [Google Scholar]
- 14.Raychaudhuri, S. 2001. Penalized discriminant analysis. TIBS. 19:189–193. [Google Scholar]
- 15.Showe, L.C., F.E. Fox, D. Williams, K. Au, Z. Niu, and A.H. Rook. 1999. Depressed IL-12-mediated signal transduction in T cells from patients with Sezary syndrome is associated with the absence of IL-12 receptor beta 2 mRNA and highly reduced levels of STAT4. J. Immunol. 163:4073–4079. [PubMed] [Google Scholar]
- 16.Nakamura, T., Y. Kamogawa, K. Bottomly, and R.A. Flavell. 1997. Polarization of IL-4- and IFN-gamma-producing CD4+ T cells following activation of naive CD4+ T cells. J. Immunol. 158:1085–1094. [PubMed] [Google Scholar]
- 17.Nakamura, T., R.K. Lee, S.Y. Nam, E.R. Podack, K. Bottomly, and R.A. Flavell. 1997. Roles of IL-4 and IFN-gamma in stabilizing the T helper cell type 1 and 2 phenotype. J. Immunol. 158:2648–2653. [PubMed] [Google Scholar]
- 18.Gerosa, F., C. Nisii, S. Righetti, R. Micciolo, M. Marchesini, A. Cazzadori, and G. Trinchieri. 1999. CD4(+) T cell clones producing both interferon-gamma and interleukin-10 predominate in bronchoalveolar lavages of active pulmonary tuberculosis patients. Clin. Immunol. 92:224–234. [DOI] [PubMed] [Google Scholar]
- 19.Gerosa, F., C. Paganin, D. Peritt, F. Paiola, M.T. Scupoli, M. Aste-Amezaga, I. Frank, and G. Trinchieri. 1996. Interleukin-12 primes human CD4 and CD8 T cell clones for high production of both interferon-γ and interleukin-10. J. Exp. Med. 183:2559–2569. [DOI] [PMC free article] [PubMed] [Google Scholar]
- 20.Van Gelder, R.N., M.E. von Zastrow, A. Yool, W.C. Dement, J.D. Barchas, and J.H. Eberwine. 1990. Amplified RNA synthesized from limited quantities of heterogeneous cDNA. Proc. Natl. Acad. Sci. USA. 87:1663–1667. [DOI] [PMC free article] [PubMed] [Google Scholar]
- 21.Vowels, B.R., M. Cassin, E.C. Vonderheid, and A.H. Rook. 1992. Aberrant cytokine production by Sezary syndrome patients: cytokine secretion pattern resembles murine Th2 cells. J. Invest. Dermatol. 99:90–94. [DOI] [PubMed] [Google Scholar]
- 22.Eisen, M.B., P.T. Spellman, P.O. Brown, and D. Botstein. 1998. Cluster analysis and display of genome-wide expression patterns. Proc. Natl. Acad. Sci. USA. 95:14863–14868. [DOI] [PMC free article] [PubMed] [Google Scholar]
- 23.Hirose, J., H. Kawashima, O. Yoshie, K. Tashiro, and M. Miyasaka. 2001. Versican interacts with chemokines and modulates cellular responses. J. Biol. Chem. 276:5228–5234. [DOI] [PubMed] [Google Scholar]
- 24.Lin, C.S., A. Lau, T. Huynh, and T.F. Lue. 1999. Differential regulation of human T-plastin gene in leukocytes and non-leukocytes: identification of the promoter, enhancer, and CpG island. DNA Cell Biol. 18:27–37. [DOI] [PubMed] [Google Scholar]
- 25.Ridley, A.J. 2001. Rho proteins: linking signaling with membrane trafficking. Traffic. 2:303–310. [DOI] [PubMed] [Google Scholar]
- 26.Small, J.V., K. Rottner, and I. Kaverina. 1999. Functional design in the actin cytoskeleton. Curr. Opin. Cell Biol. 11:54–60. [DOI] [PubMed] [Google Scholar]
- 27.Narumiya, S., T. Ishizaki, and N. Watanabe. 1997. Rho effectors and reorganization of actin cytoskeleton. FEBS Lett. 410:68–72. [DOI] [PubMed] [Google Scholar]
- 28.Bozza, M., J.L. Bliss, A.J. Dorner, and W.L. Trepicchio. 2001. Interleukin-11 modulates Th1/Th2 cytokine production from activated CD4+ T cells. J. Interferon Cytokine Res. 21:21–30. [DOI] [PubMed] [Google Scholar]
- 29.Jones, D., N.H. Dang, M. Duvic, L.T. Washington, and Y.O. Huh. 2001. Absence of CD26 expression is a useful marker for diagnosis of T-cell lymphoma in peripheral blood. Am. J. Clin. Pathol. 115:885–892. [DOI] [PubMed] [Google Scholar]
- 30.Bernengo, M.G., P. Quaglino, M. Novelli, N. Cappello, G.C. Doveil, F. Lisa, A. De Matteis, M.T. Fierro, and A. Appino. 1998. Prognostic factors in Sezary syndrome: a multivariate analysis of clinical, haematological and immunological features. Ann. Oncol. 9:857–863. [DOI] [PubMed] [Google Scholar]
- 31.Zipf, G. 1949. Human Behavior and Principle of Least Effort: An Introduction to Human Ecology. Addison Wesley, Cambridge, MA.
- 32.Gilliam, A.C., and G.S. Wood. 2000. Cutaneous lymphoid hyperplasias. Semin. Cutan. Med. Surg. 19:133–141. [DOI] [PubMed] [Google Scholar]
- 33.Allison, D.B., G.L. Gadbury, M. Heo, J.R. Fernandez, C.-K. Lee, T.A. Prolla, and R. Weindruch. 2002. A mixture model approach for the analysis of microarray gene expression data. Computational Statistics and Data Analysis. 39:1–20. [Google Scholar]
- 34.Grogan, J.L., M. Mohrs, B. Harmon, D.A. Lacy, J.W. Sedat, and R.M. Locksley. 2001. Early transcription and silencing of cytokine genes underlie polarization of T helper cell subsets. Immunity. 14:205–215. [DOI] [PubMed] [Google Scholar]
- 35.Rao, A., and O. Avni. 2000. Molecular aspects of T-cell differentiation. Br. Med. Bull. 56:969–984. [DOI] [PubMed] [Google Scholar]
- 36.Li, B., C. Tournier, R.J. Davis, and R.A. Flavell. 1999. Regulation of IL-4 expression by the transcription factor JunB during T helper cell differentiation. EMBO J. 18:420–432. [DOI] [PMC free article] [PubMed] [Google Scholar]
- 37.Mao, X., G. Orchard, D.M. Lillington, R. Russell-Jones, B.D. Young, and S.J. Whittaker. 2003. Amplification and overexpression of JUNB is associated with primary cutaneous T-cell lymphomas. Blood. 101:1513–1519. [DOI] [PubMed] [Google Scholar]
- 38.Kannagi, R. 2000. Selectins and their carbohydrate ligands in cellular recognition. Seikagaku. 72:1399–1415. [PubMed] [Google Scholar]
- 39.Pober, J.S., M.S. Kluger, and J.S. Schechner. 2001. Human endothelial cell presentation of antigen and the homing of memory/effector T cells to skin. Ann. NY Acad. Sci. 941:12–25. [DOI] [PubMed] [Google Scholar]
- 40.Jaspars, L.H., R.C. Beljaards, P. Bonnet, R. Willemze, and C.J. Meijer. 1996. Distinctive adhesion pathways are involved in epitheliotropic processes at different sites. J. Pathol. 178:385–392. [DOI] [PubMed] [Google Scholar]
- 41.Clissi, B., D. D'Ambrosio, J. Geginat, L. Colantonio, A. Morrot, N.W. Freshney, J. Downward, F. Sinigaglia, and R. Pardi. 2000. Chemokines fail to up-regulate beta 1 integrin-dependent adhesion in human Th2 T lymphocytes. J. Immunol. 164:3292–3300. [DOI] [PubMed] [Google Scholar]
- 42.Luft, T., M. Jefford, P. Luetjens, H. Hochrein, K.A. Masterman, C. Maliszewski, K. Shortman, J. Cebon, and E. Maraskovsky. 2002. IL-1 beta enhances CD40 ligand-mediated cytokine secretion by human dendritic cells (DC): a mechanism for T cell-independent DC activation. J. Immunol. 168:713–722. [DOI] [PubMed] [Google Scholar]
- 43.Fraticelli, P., M. Sironi, G. Bianchi, D. D'Ambrosio, C. Albanesi, A. Stoppacciaro, M. Chieppa, P. Allavena, L. Ruco, G. Girolomoni, et al. 2001. Fractalkine (CX3CL1) as an amplification circuit of polarized Th1 responses. J. Clin. Invest. 107:1173–1181. [DOI] [PMC free article] [PubMed] [Google Scholar]
- 44.Boehme, S.A., F.M. Lio, D. Maciejewski-Lenoir, K.B. Bacon, and P.J. Conlon. 2000. The chemokine fractalkine inhibits Fas-mediated cell death of brain microglia. J. Immunol. 165:397–403. [DOI] [PubMed] [Google Scholar]
- 45.Perez, O.D., S. Kinoshita, Y. Hitoshi, D.G. Payan, T. Kitamura, G.P. Nolan, and J.B. Lorens. 2002. Activation of the PKB/AKT pathway by ICAM-2. Immunity. 16:51–65. [DOI] [PubMed] [Google Scholar]
- 46.Namba, Y., M. Ito, Y. Zu, K. Shigesada, and K. Maruyama. 1992. Human T cell L-plastin bundles actin filaments in a calcium-dependent manner. J. Biochem. (Tokyo). 112:503–507. [DOI] [PubMed] [Google Scholar]
- 47.Arpin, M., E. Friederich, M. Algrain, F. Vernel, and D. Louvard. 1994. Functional differences between L- and T-plastin isoforms. J. Cell Biol. 127:1995–2008. [DOI] [PMC free article] [PubMed] [Google Scholar]
- 48.Frucht, D.M., M. Aringer, J. Galon, C. Danning, M. Brown, S. Fan, M. Centola, C.Y. Wu, N. Yamada, H. El Gabalawy, and J.J. O'Shea. 2000. Stat4 is expressed in activated peripheral blood monocytes, dendritic cells, and macrophages at sites of Th1-mediated inflammation. J. Immunol. 164:4659–4664. [DOI] [PubMed] [Google Scholar]
- 49.Fukao, T., D.M. Frucht, G. Yap, M. Gadina, J.J. O'Shea, and S. Koyasu. 2001. Inducible expression of Stat4 in dendritic cells and macrophages and its critical role in innate and adaptive immune responses. J. Immunol. 166:4446–4455. [DOI] [PubMed] [Google Scholar]
- 50.Crul, M., G.J. de Klerk, J.H. Beijnen, and J.H. Schellens. 2001. Ras biochemistry and farnesyl transferase inhibitors: a literature survey. Anticancer Drugs. 12:163–184. [DOI] [PubMed] [Google Scholar]
- 51.Prendergast, G.C. 2001. Actin' up: RhoB in cancer and apoptosis. Nat. Rev. Cancer. 1:162–168. [DOI] [PubMed] [Google Scholar]
- 52.Sebti, S.M., and A.D. Hamilton. 2000. Farnesyltransferase and geranylgeranyltransferase I inhibitors in cancer therapy: important mechanistic and bench to bedside issues. Expert Opin. Investig. Drugs. 9:2767–2782. [DOI] [PubMed] [Google Scholar]
- 53.Lichter, H., K. Segal, C. Mor, and R. Feinmesser. 1998. [Kimura's disease and angiolymphoid hyperplasia with eosinophilia–on disease with different expressions?]. Harefuah. 134:760–762, 832. [PubMed]