

Abstract
Multiple sclerosis (MS) is considered to be an autoimmune disease of the central nervous system (CNS) that in many patients first presents clinically as optic neuritis. The relationship of optic neuritis to MS is not well understood. We have generated novel T cell receptor (TCR) transgenic mice specific for myelin oligodendrocyte glycoprotein (MOG). MOG-specific transgenic T cells are not deleted nor tolerized and are functionally competent. A large proportion (>30%) of MOG-specific TCR transgenic mice spontaneously develop isolated optic neuritis without any clinical nor histological evidence of experimental autoimmune encephalomyelitis (EAE). Optic neuritis without EAE could also be induced in these mice by sensitization with suboptimal doses of MOG. The predilection of these mice to develop optic neuritis is associated with higher expression of MOG in the optic nerve than in the spinal cord. These results demonstrate that clinical manifestations of CNS autoimmune disease will vary depending on the identity of the target autoantigen and that MOG-specific T cell responses are involved in the genesis of isolated optic neuritis.
Keywords: MOG, experimental autoimmune encephalomyelitis, multiple sclerosis, autoimmunity of CNS, disease model
Introduction
Multiple sclerosis (MS)*is considered to be an autoimmune disease in which central nervous system (CNS) myelin is the target of an immune attack resulting in inflammation and demyelination in the CNS. It has become increasingly recognized that MS may not be a single disease entity, but instead involves different immunopathological processes manifested as different clinical phenotypes that include relapsing-remitting and progressive forms (1). The first clinical presentation in a significant proportion of MS patients is optic neuritis, which is then followed by the development of relapsing-remitting MS (2, 3). The underlying immunological basis for different clinical forms of MS and its association with optic neuritis are not well defined. In particular, whether optic neuritis is a different disease entity that predisposes patients to develop subsequent involvement of CNS myelin, or whether it is part of a continuum of disease process that initially involves myelin in the optic nerve and is then followed by involvement of brain and spinal cord white matter, is not well understood. Whether an autoimmune response to a specific myelin antigen results in the preferential induction of optic neuritis has not been addressed.
Experimental autoimmune encephalomyelitis (EAE) serves as an animal model that recapitulates many features of MS. It can be induced by immunization of susceptible animals with a number of myelin antigens including myelin basic protein (MBP; 4), proteolipid protein (PLP; 5–7), and myelin oligodendrocyte glycoprotein (MOG; 8). MOG, although a minor component of the myelin sheath, has been shown to be a potent encephalitogenic protein that induces EAE in many strains and species of experimental animals (9–13) and is also implicated in the pathogenesis of MS (14, 15). In EAE, the identity of the target autoantigen at least in part determines the disease phenotype and pattern of lesion distribution in the CNS. For example, immune responses to MBP or PLP induces lesions located predominantly in the spinal cord whereas immunization with MOG generates optic nerve and spinal cord lesions (16).
Optic nerve lesions have been reported in some forms of EAE, but have always been associated with the presence of inflammation and demyelination of the brain and spinal cord (17–21). In these EAE models, development of optic neuritis required active immunization and it is unclear whether optic neuritis preceded or followed the development of EAE. Several different TCR transgenic mice have been generated that express TCRs specific for MBP or PLP peptides including one that expresses TCRs specific for human MBP in the context of HLA-DR2 (22–25). These transgenic mice develop spontaneous EAE with different frequencies, but none have been reported to develop spontaneous isolated optic neuritis. In this report, we describe the generation of a TCR transgenic mouse (2D2) specific for the MOG 35–55 peptide on the C57Bl/6 background. A large proportion of mice develop spontaneous optic neuritis without evidence of clinical nor histological EAE, suggesting the role for MOG-specific T cell responses in the induction of optic neuritis.
Materials and Methods
Antigens.
The peptide MOG 35–55 (MEVGWYRSPFSRVVHLYRNGK) and OVA 323–336 (ISQAVHAAHAEINE) were synthesized by D. Teplow at the Biopolymer Facility, Center for Neurologic Diseases, Boston, MA. The extracellular domain of murine MOG was produced as an HIS-tagged recombinant protein and was provided by Genetics Institute.
Generation of the 2D2 Clone.
C57Bl/6 mice were immunized with 100 μg MOG 35–55 peptide emulsified in CFA. 10 d later, lymph nodes from immunized mice were collected and stimulated with 20 μg/ml peptide. These T cells were restimulated three times in vitro with the same amount of peptide and cloned by limiting dilution. We analyzed TCR expression on the surface of these T cell clones using various commercially available anti-TCRVα and anti-TCRVβ antibodies. The 2D2 clone was selected for generation of TCR transgenic mice because it expressed a TCR combination (Vα3.2 and Vβ11) for which specific antibodies are available.
Generation of TCR Transgenic Mice.
The rearranged TCRα and TCRβ chains from 2D2 genomic DNA were analyzed by sequencing. The amino acid sequence of the CDR3 regions is as follows: TCRα, VYF CALRSY NFG; TCRβ, CASS LDCG ANP. The Vα3.2Jα18 and Vβ11DJβ1.1 regions of 2D2 TCR were amplified by PCR from genomic DNA with specific primers. PCR products were cloned into TCR expression cassettes (26). Linearized TCR containing plasmids were injected directly into the pronuclei of fertilized C57Bl/6 oocytes. Transgenic founders were identified by PCR using specific primers for 2D2 Vα-Jα and Vβ-Jβ regions. Transgenic founder mice were bred with C57Bl/6 mice (The Jackson Laboratory). Alternatively, 2D2 TCR transgenic mice were bred with C57Bl/6 RAG-1−/− (The Jackson Laboratory) and then intercrossed to generate 2D2 TCR transgenic RAG-1−/− mice. Routine screening to identify the transgenic mice was performed by FACS® analysis from blood using specific antibodies to Vβ11 or Vα3.2. For phenotyping, the blood was always drawn from the tail and not from the eyes of these animals. Mice were housed in a specific pathogen-free/viral antibody-free animal facility at the Harvard Institutes of Medicine. All breeding and experiments were performed in accordance with the guidelines of the committee on Animals of Harvard Medical School.
Flow Cytometry.
Single cell suspension from thymi and spleens were prepared and cells were stained with FITC, PE, or tricolor-conjugated antibodies for 30 min at 4°C (anti-TCRβ, anti-TCRVα3.2, anti-TCRVβ11, and anti-CD8 antibodies; BD Biosciences and anti-CD4 antibody; Caltag Laboratories). After washing they were analyzed on a FACS® sort flow cytometer (Becton Dickinson).
Proliferation Assays and Cytokine ELISA.
Cells were grown in RPMI 10% FCS supplemented with 5 × 10⁻⁵ M β-mercaptoethanol, l-glutamine, gentamicin sulfate, and 100 U/μg penicillin/streptomycin. For proliferation assays, splenocytes (5 × 10⁵ cells/well) were cultured for 72 h in 96-well plates in the presence of the indicated concentration of peptide. Cells were pulsed with 1 μCi [3H]thymidine for the last 16 h of incubation and mean thymidine incorporation in triplicate wells was measured using a β counter (model LS 5000; Beckman Coulter). The concentration of cytokines (IFN-γ, IL-10, IL-5, and IL-4) was determined in culture supernatants by cytokine ELISA according to the manufacturer's guidelines (BD Biosciences).
Induction and Assessment of EAE and Optic Neuritis.
Mice were examined routinely for the development of spontaneous disease. Three different protocols were used to induce disease in transgenic and nontransgenic mice. Mice were immunized with 100 μg MOG 35–55 emulsified in CFA (CFA supplemented with 400 μg/ml Mycobacterium tuberculosis) and injected intravenously on days 0 and 2 with 150 ng pertussis toxin. In a second protocol, mice received only injections of pertussis toxin. In a third protocol, mice were immunized with either 10 or 100 μg MOG 35–55 peptide emulsified in CFA without any pertussis toxin. Clinical assessment of EAE was performed daily according to the following criteria: 0, no disease; 1, decreased tail tone; 2, hind limb weakness or partial paralysis; 3, complete hind limb paralysis; 4, front and hind limb paralysis; 5, moribund state.
Mice developing spontaneous optic neuritis presented eyelid redness and swelling associated with tearing. In some cases these signs evolved to a partial or complete atrophy of the eye.
Western Blot Analysis.
Optic nerve and spinal cord homogenates from adult female C57Bl/6 mice were prepared in PBS in the presence of a protease inhibitor cocktail (Sigma-Aldrich) and 20 U/μl DNase. Protein concentrations were measured photometrically by the Bradford assay. Equal amounts of protein were loaded on 15% SDS-polyacrylamide gels and after SDS-PAGE they were blotted on a nitrocellulose membrane (Amersham Biosciences). After blocking with Tris-buffered saline (TBS)/5% milk powder, the membrane was incubated with a MOG-specific rabbit antiserum (27) overnight at 4°C. The membrane was then washed extensively and incubated with a peroxidase-conjugated goat anti–rabbit IgG (Dianova). The blot was developed using an enhanced chemiluminescent system (Amersham Biosciences) and the signal was detected and quantified using a computer-linked CCD-Camera (LAS-1000; Fujifilm). Antibodies were then stripped from the membrane by washing in TBS followed by incubation for 30 min at 50°C in 62.5 mM Tris/HCl, pH 6.7, containing 100 mM β-mercaptoethanol and 2% SDS. Membranes were then washed with TBS and blocked with TBS/5% milk powder before being reprobed with an immunopurified rabbit anti–PLP antibody (28) and assayed as described above.
Histology.
Animals were killed at the termination of the induced disease or after at least 2 wk of spontaneous EAE or optic neuritis. Brains, spinal cords, eyes, and associated optic nerves were removed and fixed in 10% formalin. Paraffin-embedded sections were stained with hematoxylin and eosin, Luxol fast blue stains, and by Bielschowsky preparation for light microscopy. Immunohistochemistry on cryosections from selected transgenic and nontransgenic mice was performed using antibodies to CD4 and TCRVβ11 as previously described (24).
Results
Selection of T Cells in MOG-specific TCR Transgenic Mice.
We derived a CD4+ MOG 35–55–specific T cell clone called 2D2 from C57Bl/6 mice. The 2D2 clone expressed a TCR composed of Vα3.2 and Vβ11. The rearranged TCRα and TCRβ chains of this clone were cloned in expression cassettes and injected into C57Bl/6 oocytes (H-2b) to generate 2D2 TCR transgenic mice.
There was no difference in cellularity in the thymi and spleens between the 2D2 TCR transgenic mice and the nontransgenic littermate control mice. CD4, CD8, and specific TCR expression were analyzed on cells isolated from thymi and spleens from 2D2 TCR transgenic mice and nontransgenic control littermates. As shown in Fig. 1 A, the ratio between CD4+ and CD8+ single positive thymocytes is biased toward the CD4 compartment in 2D2 TCR transgenic mice compared with nontransgenic littermates. In addition, the majority of thymocytes in 2D2 TCR transgenic mice expressed high and intermediate levels of TCR indicating efficient positive selection of transgenic T cells (Fig. 1 B). Analysis of splenocytes also revealed a skewing toward CD4+ cells in the 2D2 TCR transgenic mice compared with the nontransgenic littermates (Fig. 1 C). In addition, the majority of CD4+ T cells from these 2D2 transgenic mice expressed the transgenic TCR defined by Vα3.2 and Vβ11 (Fig. 1 C). The analysis of 2D2 TCR transgenic mice on RAG-1−/− background showed that transgenic Vα3.2+ Vβ11+ T cells are positively selected in the thymus and do not undergo detectable deletion. Transgenic Vα3.2+ Vβ11+ T cells represented >98% of CD3+ T cells (not depicted).
Figure 1.

T cell populations in 2D2 MOG-specific TCR transgenic mice. Thymocytes (A and B) or splenocytes (C) from 6–8-wk-old 2D2 TCR transgenic mice (2D2 Tg) or nontransgenic littermates (NT) were stained with antibodies to CD4, CD8, TCRβ, Vβ11, and Vα3.2 and cells were analyzed by flow cytometry. The dot plots show two-color flow cytometry analysis of the thymocytes or splenocytes. B contains histograms showing TCR expression on total thymocytes.
Transgenic T Cells from 2D2 TCR Transgenic Mice Proliferate in Response to MOG 35–55 Peptide and MOG Protein.
To determine if the T cells were specific and responsive to MOG antigen in the peripheral lymphoid organs, we tested the proliferative response of spleen cells with the peptide MOG 35–55 and whole MOG protein. As shown in Fig. 2, A and B , spleen cells from naive 2D2 TCR transgenic mice with no sign of CNS autoimmune disease show a strong proliferative response to the peptide MOG 35–55 and to the MOG protein. However, they do not proliferate to a control peptide OVA 323–336. We also tested the production of various cytokines (IFN-γ, IL-4, IL-10, and IL-5) from these transgenic T cells in response to the encephalitogenic peptide. Spleen cells from unimmunized 2D2 TCR transgenic mice produce high levels of IFN-γ but no other cytokines were detected in the supernatant in response to the peptide MOG 35–55 (Fig. 2 C). The source of the IFN-γ appears to be from memory/primed T cells because production of IFN-γ was considerably reduced when sorted naive CD4+ CD62Lhigh transgenic T cells were activated in vitro with the MOG 35–55 peptide (unpublished data). Memory/primed transgenic T cells (Vα3.2+ CD4+ CD62Llow) represent ∼10% of the CD4+ transgenic T cell population. This percentage increases as the animals age. These results show that T cells from 2D2 TCR transgenic mice are able to respond to MOG antigen (peptide and protein) and that they are not tolerized in vivo. Furthermore, the data suggest that transgenic T cells have a tendency to develop into a Th1 phenotype.
Figure 2.

Response of transgenic T cells to MOG 35–55 and MOG protein. Splenocytes from unimmunized mice were cultured with indicated concentrations of MOG 35–55 peptide (A) or recombinant protein MOG (B). T cell proliferation was determined by [3H]thymidine incorporation in triplicate wells in a 72-h proliferation assay. The mean cpm's in the presence of 50 μg/ml OVA 323–336 control peptide were 12,401 for TCR transgenic mice and 14,278 for the control littermates. Splenocytes produce IFN-γ in response to indicated concentrations of peptide MOG 35–55 (C). IFN-γ was measured on supernatants harvested 48 h after activation by ELISA. 2D2 Tg, 2D2 transgenic; NT, nontransgenic.
2D2 TCR Transgenic Mice Develop Spontaneous Optic Neuritis.
We evaluated the development of spontaneous disease in 72 2D2 MOG-specific TCR transgenic mice housed under specific pathogen-free/viral antibody-free conditions. The incidence of spontaneous EAE in these mice is low in that only 4% (3/72) of transgenic mice developed spontaneous EAE (Table I , group A). In the 2D2 TCR transgenic mice that developed spontaneous disease, the first clinical signs of EAE were a limp tail followed by hind limb paralysis. These signs appeared between 2.5 and 5 mo of age. Transgenic mice with clinical EAE had typical inflammatory/demyelinating lesions and associated edema in their brains and spinal cords (Table I, group A, and Fig. 3 A). CD4+ and TCRVβ11+ infiltrating T cells were identified by immunohistochemistry in the lesions (Fig. 3, B and C). Histopathological examination of optic nerve from these mice also showed inflammatory/demyelinating lesions of optic neuritis (Fig. 3 E).
Table I.
Spontaneous Optic Neuritis in 2D2 TCR Transgenic Mice
| Clinical
|
Histological
|
|||
|---|---|---|---|---|
| EAE | Opticneuritis | EAE | Opticneuritis | |
| Group A Mice with EAE |
4% (n = 72)a |
ND | 100% (n = 3) |
100% (n = 3) |
| Group B Mice without EAE |
0% (n = 69) |
35% (n = 37)b |
0% (n = 15)c |
47% (n = 15)c |
2D2 TCR transgenic mice were monitored for signs of EAE and optic neuritis.
72 TCR transgenic mice were monitored for EAE. Based on clinical signs of EAE, two groups of mice were distinguished. Group A represents mice that developed spontaneous clinical EAE (n = 3) and group B represents mice that never showed any signs of spontaneous EAE (n = 69).
Among the 69 transgenic mice that did not develop EAE, 37 were examined closely for up to 1 yr for clinical signs of optic neuritis as described in Materials and Methods.
The eyes, optic nerves, brain, and spinal cord from 15 TCR transgenic mice with or without clinical signs of optic neuritis were analyzed by histology. Mice were killed at 6.3 ± 2.5 mo of age. Most mice (67%) with clinical optic neuritis had histological lesions in the optic nerve.
Figure 3.
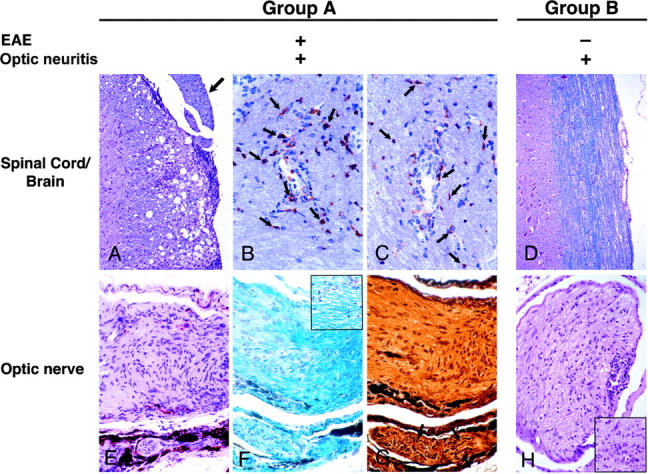
Histological analysis of CNS tissues from 2D2 TCR transgenic mice. (A) Typical meningeal and parenchymal mononuclear cell infiltrates associated with demyelination and edema in spinal cord of mouse with optic neuritis and clinical EAE. A spinal nerve root (peripheral nerve myelin) as indicated by an arrow is spared. Luxol fast blue and hematoxylin and eosin stain, ×206. (B) CD4+ cells (arrows) infiltrate cerebellar white matter. Cryosection with mAb GK1.5 immuno-peroxidase stain, ×308. (C) Similar numbers of cells in a section adjacent to B stain for TCR Vβ11. Cryosection with mAb RR3–15 immuno-peroxidase stain, ×308. (D) Intact spinal cord from mouse with optic neuritis but no clinical nor histologic EAE. Luxol fast blue and hematoxylin and eosin stain, ×206. (E) Longitudinal section of optic nerve from mouse with optic neuritis and EAE. Portions of an uninvolved oculomotor nerve (peripheral nerve myelin) are in the lower portion of the field. Hematoxylin and eosin stain, ×308. (F) Adjacent section to E demonstrating demyelination (pale area in left side of field) in optic neuritis. Blue staining on right side and in oculomotor nerve indicates preserved myelin. Inset: diffuse vacuolation of optic nerve myelin associated with few inflammatory cells. Klüver-Barrera stain, ×308. (G) Adjacent section to E and F showing intact silver-positive axons (arrows) in oculomotor nerve. Axons are lost in the optic nerve (center). Bielschowsky preparation, ×308. (H) Subpial and diffuse endoneurial mononuclear cell infiltrate in cross section of optic nerve of a transgenic mouse without EAE. Inset: higher power of an endoneurial mononuclear cell infiltrate. Hematoxylin and eosin stain, ×206; inset, ×308.
69 of the 72 mice examined did not show any signs of clinical EAE (Table I, group B). During routine care and evaluation of these TCR transgenic mice, we observed the development of superficial inflammation around the eyelids, eyelid swelling, and tearing. These lesions were unilateral and only seen in 2D2 TCR transgenic mice and not in control littermates. The signs were often associated with a progressive atrophy of the eye. Therefore, we randomly selected 37 TCR transgenic mice in this group of mice that did not develop EAE and monitored them closely for the signs of ocular disease. Surprisingly, a significant proportion (35%) of these otherwise healthy TCR transgenic animals developed these ocular abnormalities in the absence of any sign of spontaneous EAE when observed for periods of up to 1 yr (Table I, group B).
To determine the cause of these signs, we performed a blinded detailed histological analysis of the brain, spinal cord, eyes, and associated optic nerves collected from 2D2 TCR transgenic mice (n = 15) chosen at random from group B. Consistent with the absence of clinical signs of EAE, histopathological analysis of brains and spinal cords from these mice demonstrated no or very few lesions in these tissues. However, 7 of the 15 (47%) TCR transgenic mice with no clinical evidence of EAE had histological evidence of optic neuritis without any detectable lesions in the brain and spinal cord (Table I, group B, and Fig. 3 D). Histological examination of optic nerves from these animals revealed inflammatory/demyelinating lesions equivalent to those seen in the optic nerves of mice with clinical EAE. These lesions consisted of subpial and endoneurial mononuclear cell infiltrates with active demyelination indicated by the presence of foamy macrophages (Fig. 3, E and H). Myelin stains demonstrated patchy and diffuse plaque-like patterns of myelin loss (Fig. 3 F) and there were varying degrees of axonal injury and loss (Fig. 3 G). Adjacent oculomotor nerves containing peripheral nervous system myelin, which lacks MOG, were free of lesions and the eyes showed normal histology. Some mice with optic neuritis also showed nonspecific chronic inflammation in adjacent skin and periorbital tissues, possibly secondary to local trauma. Histological findings correlated with clinical observations because 67% of TCR transgenic mice with superficial eye lesions also had optic neuritis. The small size of these nerves and the patchy nature of lesions may have precluded histologic demonstration of optic neuritis in some mice with clinical optic neuritis. These observations are specific to the 2D2 MOG-specific TCR transgenic mice because we did not observe any clinical ocular abnormalities or lesions in the brains, spinal cords, or optic nerve of nontransgenic littermates (not depicted).
Suboptimal Immunization Regimen Triggers Optic Neuritis but not EAE.
To understand the mechanisms responsible for induction of optic neuritis in the 2D2 transgenic mice and the relationship of optic neuritis to EAE, we studied the effects of different immunization protocols on the development of EAE versus optic neuritis in the mice. First, we determined whether EAE could be induced in the MOG TCR transgenic mice by the standard immunization protocol that included MOG 35–55 peptide emulsified in CFA and the injection of pertussis toxin. As shown in Fig. 4 A and Table II , 2D2 TCR transgenic mice developed more severe EAE when immunized with the full regimen compared with the nontransgenic littermates. This was associated with a higher mortality, accelerated onset, and more numerous CNS inflammatory foci. Next, we investigated whether by reducing the immunogenicity of the emulsion we would be able to induce optic neuritis in the absence of EAE. First, we injected 2D2 MOG-specific TCR transgenic mice with pertussis toxin alone. With this regimen, 39% of the TCR transgenic mice developed typical clinical EAE and 56% developed histological EAE. None of the negative littermates showed any signs of disease (Fig. 4 B and Table II). In this and the preceding experiment, EAE was associated with the development of optic neuritis. 80% of the mice immunized with the standard regimen and 50% of the animals injected with pertussis toxin developed EAE associated with optic neuritis (Fig. 5) .
Figure 4.

Induced EAE in 2D2 TCR transgenic mice. 2D2 TCR transgenic mice and nontransgenic littermates were immunized with MOG 35–55 peptide emulsified in CFA and injected with pertussis toxin (A) or injected with pertussis toxin only (B) and observed for the development of EAE over time. The data are presented as the mean disease score in each group during the course of observation. 2D2 Tg, 2D2 transgenic; NT, nontransgenic.
Table II.
EAE Induced in 2D2 TCR Transgenic Mice and Negative Control Littermates
| Clinical EAE
|
Histological EAE
|
||||||
|---|---|---|---|---|---|---|---|
| Treatmenta | Incidence | Mortality | Mean day of onsetb | Mean maximal scorec | Incidenced | Mean number of focie | |
| MOG35–55 + PT | Tg | 9/10 (90%) | 4/10 (40%) | 11.9 ± 1.2 | 4.0 ± 0.3 | 8/10 (80%) | 170.9 ± 38.3 |
| NT | 9/11 (82%) | 0/11 (0%) | 14.5 ± 2.2 | 2.6 ± 0.4 | 8/10 (80%) | 78.9 ± 24.9 | |
| PT alone | Tg | 9/23 (39%) | 3/23 (13%) | 14.1 ± 2.1 | 3.8 ± 0.3 | 9/16 (56%) | 39.3 ± 11.4 |
| NT | 0/6 (0%) | 0/6 (0%) | NA | NA | 1/5 (20%) | 5.5 ± 4.1 | |
| MOG35–55 100 μg | Tg | 0/9 (0%) | 0/9 (0%) | NA | NA | 0/9 (0%) | 2.4 ± 0.9 |
| NT | 0/9 (0%) | 0/9 (0%) | NA | NA | 1/5 (20%) | 5.0 ± 2.9 | |
| MOG35–55 10 μg | Tg | 0/9 (0%) | 0/9 (0%) | NA | NA | 0/9 (0%) | 2.3 ± 1.0 |
| NT | 1/9 (11%) | 0/9 (0%) | 23 ± 0 | 2 ± 0 | 4/10 (40%) | 16.9 ± 7.2 | |
2D2 TCR transgenic (Tg) and nontransgenic (NT) littermates were immunized by various regimens including MOG35–55 peptide in CFA and pertussis toxin (PT), PT alone, or MOG peptide alone in CFA. The animals were then monitored for signs of EAE.
Data are presented as mean ± SE.
Data are presented as mean maximal clinical scores for the animals showing clinical disease.
Mice with >10 lesions in brain and spinal cord were considered positive.
Data are presented as mean number of meningeal and parenchymal inflammatory lesions in brain and spinal cord.
Figure 5.

Suboptimal immunization protocols trigger optic neuritis but not EAE in 2D2 TCR transgenic mice. 2D2 TCR transgenic mice were immunized with 100 μg MOG 35–55 peptide emulsified in CFA and injected with pertussis toxin, immunized with 10 or 100 μg of the MOG 35–55 peptide alone, or injected with pertussis toxin only. The proportion of mice developing EAE or optic neuritis was evaluated by histological analysis of brains, spinal cords, and optic nerves. The number of mice developing EAE or optic neuritis in each group is indicated in parentheses on the right side of the histogram bar.
Next, we immunized the mice with two different doses of MOG 35–55 peptide emulsified in CFA without any additional pertussis toxin. With this regimen, none of the transgenic mice developed clinical signs of EAE (Table II). Consistent with this observation, the brains and spinal cords of peptide-immunized 2D2 TCR transgenic mice showed minimal or no inflammatory foci (Table II). Interestingly, immunization with either dose of MOG35–55 in CFA induced histological optic neuritis at a very high frequency (Fig. 5). 55 and 78% of mice immunized with 100 and 10 μg MOG35–55 peptide, respectively, had lesions in the optic nerves. These results show that activation of transgenic T cells under milder conditions is sufficient to trigger optic neuritis while sparing the remainder of the CNS. This provides a reproducible method for induction of optic neuritis in MOG-specific TCR transgenic mice, without concomitant induction of EAE.
MOG Is More Expressed in the Optic Nerve than in the Spinal Cord.
The predilection of 2D2 TCR transgenic mice to develop optic neuritis is apparently antigen specific because isolated optic neuritis was not reported in MBP- and PLP-specific TCR transgenic mice (22–25). To investigate whether this was due to differential expression of MOG in the optic nerve and spinal cord, we compared the levels of MOG and PLP in these tissues by semiquantitative Western blotting. Spinal cord was analyzed because lesions in mice with EAE are consistently found in the spinal cord. This approach revealed significantly higher levels of MOG in the optic nerve than the spinal cord (Fig. 6 , left). The signal obtained for MOG was 51% higher in the optic nerve than in the spinal cord (P = 0.00596). In contrast, PLP levels/μg total protein were very similar in the two tissues (Fig. 6, right). These results suggest that the development of spontaneous optic neuritis in these MOG-specific TCR transgenic mice might be related to an increased autoantigen expression in the optic nerves.
Figure 6.

MOG is more expressed in the optic nerve than in the spinal cord. Optic nerves and spinal cords homogenates were assayed by SDS-PAGE for MOG and PLP expression using respective-specific antibodies. Histograms represent mean relative expression of MOG and PLP in optic nerves and spinal cords pooled from five C57Bl/6 mice and assayed in quadruplicates. The data presented were obtained at a protein loading of 16.6 μg/well and are representative of multiple analysis of three independent experiments. NS, not significant.
Discussion
In this report, we describe the generation of a new MOG 35–55–specific TCR transgenic mouse on the C57Bl/6 background. In these TCR transgenic mice, CD4+ T cells appear to develop normally and do not undergo central nor peripheral tolerance. Although MOG protein expression has not been detected in the thymus (29), the presence of MOG mRNA has been reported in a subpopulation of medullary thymic epithelial cells (30). Our results would suggest that the MOG protein may not be translated in thymic cells or that the expression level is not sufficient to induce tolerance of MOG-specific T cells to this autoantigen.
We show that a large proportion of MOG-specific TCR transgenic mice develop spontaneous optic neuritis without any clinical nor histological sign of EAE. These mice also develop EAE when immunized with the full immunization regimen of encephalitogenic peptide plus pertussis toxin but developed optic neuritis without EAE when immunized under suboptimal immunization conditions (encephalitogenic peptide emulsified in CFA but no pertussis toxin). Thus, these mice not only provide a model to investigate the role and nature of the MOG-specific self-reactive repertoire, but also to study optic neuritis and its relationship to the development of autoimmunity in the CNS.
Different forms of clinical EAE can be induced in experimental animals depending on the genetic background and immunizing myelin antigen. The clinical phenotypes reported in EAE range from monophasic (in Lewis rats with MBP immunization) to relapsing-remitting (in SJL mice immunized with PLP or dark agouti rats immunized with MOG; 5, 31) or chronic/chronic progressive forms (in C57Bl/6 or NOD mice immunized with MOG; 8). These disease forms in EAE correspond to various clinical phenotypes observed in MS. Optic neuritis is a common initial sign in 30–60% of patients with MS (2, 32). Optic neuritis is observed in EAE as well but is often associated with inflammation in the brain or spinal cord after immunization with myelin antigens (17–21). In contrast, our MOG TCR transgenic mice provide an experimental model in which spontaneous optic neuritis develops without any clinical nor histological evidence of EAE. This situation is comparable to what occurs in many MS patients before the involvement of the brain or spinal cord and the onset of relapsing-remitting disease.
Several transgenic mice with TCRs specific for other myelin antigens have been generated. Although MOG-specific TCR transgenic mice develop spontaneous optic neuritis, none of the MBP- nor PLP-specific TCR transgenic mice have been reported to develop spontaneous optic neuritis (22–25). Several hypotheses can explain this difference. First, the differences might be related to the genetic background (non-MHC) of the animals. Previous work has shown that the pathology of EAE and incidence of optic neuritis differ in MOG-immunized BN and LEW.1N rats which express identical MHC but different non-MHC background genes (33).
Accumulating evidence also suggest that immune responses for different target antigens might induce different types of immunopathology and disease signs in EAE (34, 35). For example, immunization of rats with MOG induces a spectrum of CNS pathology (33). The majority of animals (∼80%) developed lesions involving the spinal cord and the optic nerve similar to human neuromyelitis optica. However, only a limited number of MOG-immunized rats developed optic neuritis in the absence of lesions in the brain and spinal cord (33). These data in rats and our finding of spontaneous optic neuritis in the MOG-specific TCR transgenic mice suggest that anti-MOG autoimmune responses may have a role in the induction of human optic neuritis.
The low incidence of spontaneous EAE compared with the high incidence of optic neuritis in the MOG-specific TCR transgenic mice suggest that infiltration by MOG-specific T cells is achieved more readily in the optic nerve than in the brain and spinal cord. This might relate to differences in the nature of blood-tissue barriers between optic nerve and the CNS proper, to the level/proportion of activated myelin-reactive T cells that are required for the induction of optic neuritis compared with EAE, local differences in antigen concentration, or a combination of these factors. Our results suggest that the predilection of 2D2 transgenic mice to develop spontaneous optic neuritis may in part explained by higher expression of MOG in the optic nerve than in the spinal cord. These differences in MOG concentration correlate with its localization in the myelin sheath. MOG is expressed in the outermost surface of the oligodendrocyte myelin sheath. In the optic nerve, where the volume to surface ratio of the myelin is low, MOG expression is increased relative to protein such as PLP, which is concentrated in the compact myelin. Effects of differential antigen concentration could become clinically significant in the context of suboptimal T cell responses. Indeed, our data show that a low grade activation by a suboptimal immunization regimen of MOG-specific transgenic T cells is sufficient to result in the development of optic neuritis without EAE. By contrast, with the full immunization regimen (peptide plus pertussis toxin), the transgenic mice develop EAE in addition to optic neuritis. This suggests that the progression of optic neuritis to full-fledged EAE is a continuum in the development of CNS pathology, with a low frequency of activated autoreactive T cells favoring the development of optic neuritis and a higher frequency of activated MOG-reactive T cells favoring development of full-blown EAE. Similarly, this might also be one of the reasons why many MS patients initially develop optic neuritis, presumably because they only have a low frequency of activated T cells specific for MOG. They may later develop relapsing-remitting disease because of epitope spreading (36). Epitope spreading after this initial insult may then be responsible for the subsequent development of lesions in the brain and spinal cord and progression of clinical disease.
In conclusion, 2D2 MOG-specific TCR transgenic mice will not only allow us to study the autoimmune response to an important myelin antigen, but also provide a unique model to study spontaneous optic neuritis and its relationship to the development of EAE. The results with TCR transgenic mice demonstrate that clinical manifestations of CNS-specific autoimmune disease will vary depending on the involvement of the target autoantigen.
Acknowledgments
We thank Dr. A. Sharpe for the microinjection of DNA constructs into mice oocytes and L. Nicholson for comments on the manuscript. We also thank Sabine Kosin for excellent technical assistance and Dr. Hartmut Wekerle for his comments and enthusiastic support.
This work was supported by grants from the National Institutes of Health (RO1 NS 30843, RO1 NS 35685, and RO1 NS 38037), the MS Society (NMSS RG#2571C7/1 and NMSS RG#3055), the European Union (Biomed 2; contract no. BMH4-97-2027), and the Deutsche Forschungsgemeinschaft (SFB 517, project C14).
Footnotes
Abbreviations used in this paper: CNS, central nervous system; EAE, experimental autoimmune encephalomyelitis; MBP, myelin basic protein; MOG, myelin oligodendrocyte glycoprotein; MS, multiple sclerosis; PLP, proteolipid protein; TBS, Tris-buffered saline.
References
- 1.Lassmann, H. 1998. Pathology of multiple sclerosis. McAlpine's Multiple Sclerosis. A. Compston, G. Ebers, H. Lassmann, I. McDonald, B. Matthews, and H. Wekerle, editors. Churchill Livingstone, Hong Kong. 323–358.
- 2.Ghezzi, A., V. Martinelli, V. Torri, M. Zaffaroni, M. Rodegher, G. Comi, A. Zibetti, and N. Canal. 1999. Long-term follow-up of isolated optic neuritis: the risk of developing multiple sclerosis, its outcome, and the prognostic role of paraclinical tests. J. Neurol. 246:770–775. [DOI] [PubMed] [Google Scholar]
- 3.Soderstrom, M. 2001. Optic neuritis and multiple sclerosis. Acta Ophthalmol. Scand. 79:223–227. [DOI] [PubMed] [Google Scholar]
- 4.Zamvil, S.S., D.J. Mitchell, A.C. Moore, K. Kitamura, L. Steinman, and J.B. Rothbard. 1986. T-cell epitope of the autoantigen myelin basic protein that induces encephalomyelitis. Nature. 324:258–260. [DOI] [PubMed] [Google Scholar]
- 5.Tuohy, V.K., Z. Lu, R.A. Sobel, R.A. Laursen, and M.B. Lees. 1989. Identification of an encephalitogenic determinant of myelin proteolipid protein for SJL mice. J. Immunol. 142:1523–1527. [PubMed] [Google Scholar]
- 6.Greer, J.M., V.K. Kuchroo, R.A. Sobel, and M.B. Lees. 1992. Identification and characterization of a second encephalitogenic determinant of myelin proteolipid protein (residues 178–191) for SJL mice. J. Immunol. 149:783–788. [PubMed] [Google Scholar]
- 7.Greer, J.M., R.A. Sobel, A. Sette, S. Southwood, M.B. Lees, and V.K. Kuchroo. 1996. Immunogenic and encephalitogenic epitope clusters of myelin proteolipid protein. J. Immunol. 156:371–379. [PubMed] [Google Scholar]
- 8.Mendel, I., N. Kerlero de Rosbo, and A. Ben-Nun. 1995. A myelin oligodendrocyte glycoprotein peptide induces typical chronic experimental autoimmune encephalomyelitis in H-2b mice: fine specificity and T cell receptor V beta expression of encephalitogenic T cells. Eur. J. Immunol. 25:1951–1959. [DOI] [PubMed] [Google Scholar]
- 9.Linington, C., T. Berger, L. Perry, S. Weerth, D. Hinze-Selch, Y. Zhang, H.C. Lu, H. Lassmann, and H. Wekerle. 1993. T cells specific for the myelin oligodendrocyte glycoprotein mediate an unusual autoimmune inflammatory response in the central nervous system. Eur. J. Immunol. 23:1364–1372. [DOI] [PubMed] [Google Scholar]
- 10.Amor, S., N. Groome, C. Linington, M.M. Morris, K. Dornmair, M.V. Gardinier, J.M. Matthieu, and D. Baker. 1994. Identification of epitopes of myelin oligodendrocyte glycoprotein for the induction of experimental allergic encephalomyelitis in SJL and Biozzi AB/H mice. J. Immunol. 153:4349–4356. [PubMed] [Google Scholar]
- 11.Kerlero de Rosbo, N., I. Mendel, and A. Ben-Nun. 1995. Chronic relapsing experimental autoimmune encephalomyelitis with a delayed onset and an atypical clinical course, induced in PL/J mice by myelin oligodendrocyte glycoprotein (MOG)-derived peptide: preliminary analysis of MOG T cell epitopes. Eur. J. Immunol. 25:985–993. [DOI] [PubMed] [Google Scholar]
- 12.Genain, C.P., and S.L. Hauser. 1996. Allergic encephalomyelitis in common marmosets: pathogenesis of a multiple sclerosis-like lesion. Methods. 10:420–434. [DOI] [PubMed] [Google Scholar]
- 13.Adelmann, M., J. Wood, I. Benzel, P. Fiori, H. Lassmann, J.M. Matthieu, M.V. Gardinier, K. Dornmair, and C. Linington. 1995. The N-terminal domain of the myelin oligodendrocyte glycoprotein (MOG) induces acute demyelinating experimental autoimmune encephalomyelitis in the Lewis rat. J. Neuroimmunol. 63:17–27. [DOI] [PubMed] [Google Scholar]
- 14.Kerlero de Rosbo, N., R. Milo, M.B. Lees, D. Burger, C.C. Bernard, and A. Ben-Nun. 1993. Reactivity to myelin antigens in multiple sclerosis. Peripheral blood lymphocytes respond predominantly to myelin oligodendrocyte glycoprotein. J. Clin. Invest. 92:2602–2608. [DOI] [PMC free article] [PubMed] [Google Scholar]
- 15.Sun, J., H. Link, T. Olsson, B.G. Xiao, G. Andersson, H.P. Ekre, C. Linington, and P. Diener. 1991. T and B cell responses to myelin-oligodendrocyte glycoprotein in multiple sclerosis. J. Immunol. 146:1490–1495. [PubMed] [Google Scholar]
- 16.Berger, T., S. Weerth, K. Kojima, C. Linington, H. Wekerle, and H. Lassmann. 1997. Experimental autoimmune encephalomyelitis: the antigen specificity of T lymphocytes determines the topography of lesions in the central and peripheral nervous system. Lab. Invest. 76:355–364. [PubMed] [Google Scholar]
- 17.Raine, C.S., U. Traugott, R.B. Nussenblatt, and S.H. Stone. 1980. Optic neuritis and chronic relapsing experimental allergic encephalomyelitis: relationship to clinical course and comparison with multiple sclerosis. Lab. Invest. 42:327–335. [PubMed] [Google Scholar]
- 18.Hayreh, S.S., R.M. Massanari, T. Yamada, and S.M. Hayreh. 1981. Experimental allergic encephalomyelitis. I. Optic nerve and central nervous system manifestations. Invest. Ophthalmol. Vis. Sci. 21:256–269. [PubMed] [Google Scholar]
- 19.Hayreh, S.S. 1981. Experimental allergic encephalomyelitis. II. Retinal and other ocular manifestations. Invest. Ophthalmol. Vis. Sci. 21:270–281. [PubMed] [Google Scholar]
- 20.O'Neill, J.K., D. Baker, M.M. Morris, S.E. Gschmeissner, H.G. Jenkins, A.M. Butt, S.L. Kirvell, and S. Amor. 1998. Optic neuritis in chronic relapsing experimental allergic encephalomyelitis in Biozzi ABH mice: demyelination and fast axonal transport changes in disease. J. Neuroimmunol. 82:210–218. [DOI] [PubMed] [Google Scholar]
- 21.Hu, P., J. Pollard, N. Hunt, J. Taylor, and T. Chan-Ling. 1998. Microvascular and cellular responses in the optic nerve of rats with acute experimental allergic encephalomyelitis (EAE). Brain Pathol. 8:475–486. [DOI] [PMC free article] [PubMed] [Google Scholar]
- 22.Lafaille, J.J., K. Nagashima, M. Katsuki, and S. Tonegawa. 1994. High incidence of spontaneous autoimmune encephalomyelitis in immunodeficient anti-myelin basic protein T cell receptor transgenic mice. Cell. 78:399–408. [DOI] [PubMed] [Google Scholar]
- 23.Goverman, J., A. Woods, L. Larson, L.P. Weiner, L. Hood, and D.M. Zaller. 1993. Transgenic mice that express a myelin basic protein-specific T cell receptor develop spontaneous autoimmunity. Cell. 72:551–560. [DOI] [PubMed] [Google Scholar]
- 24.Waldner, H., M.J. Whitters, R.A. Sobel, M. Collins, and V.K. Kuchroo. 2000. Fulminant spontaneous autoimmunity of the central nervous system in mice transgenic for the myelin proteolipid protein-specific T cell receptor. Proc. Natl. Acad. Sci. USA. 97:3412–3417. [DOI] [PMC free article] [PubMed] [Google Scholar]
- 25.Madsen, L.S., E.C. Andersson, L. Jansson, M. Krogsgaard, C.B. Andersen, J. Engberg, J.L. Strominger, A. Svejgaard, J.P. Hjorth, R. Holmdahl, et al. 1999. A humanized model for multiple sclerosis using HLA-DR2 and a human T-cell receptor. Nat. Genet. 23:343–347. [DOI] [PubMed] [Google Scholar]
- 26.Kouskoff, V., K. Signorelli, C. Benoist, and D. Mathis. 1995. Cassette vectors directing expression of T cell receptor genes in transgenic mice. J. Immunol. Methods. 180:273–280. [DOI] [PubMed] [Google Scholar]
- 27.Linington, C., M. Webb, and P.L. Woodhams. 1984. A novel myelin-associated glycoprotein defined by a mouse monoclonal antibody. J. Neuroimmunol. 6:387–396. [DOI] [PubMed] [Google Scholar]
- 28.Gunn, C.A., M.K. Richards, and C. Linington. 1990. The immune response to myelin proteolipid protein in the Lewis rat: identification of the immunodominant B cell epitope. J. Neuroimmunol. 27:155–162. [DOI] [PubMed] [Google Scholar]
- 29.Mor, F., G.L. Boccaccio, and T. Unger. 1998. Expression of autoimmune disease-related antigens by cells of the immune system. J. Neurosci. Res. 54:254–262. [DOI] [PubMed] [Google Scholar]
- 30.Derbinski, J., A. Schulte, B. Kyewski, and L. Klein. 2001. Promiscuous gene expression in medullary thymic epithelial cells mirrors the peripheral self. Nat. Immunol. 2:1032–1039. [DOI] [PubMed] [Google Scholar]
- 31.Weissert, R., K.L. de Graaf, M.K. Storch, S. Barth, C. Linington, H. Lassmann, and T. Olsson. 2001. MHC class II-regulated central nervous system autoaggression and T cell responses in peripheral lymphoid tissues are dissociated in myelin oligodendrocyte glycoprotein-induced experimental autoimmune encephalomyelitis. J. Immunol. 166:7588–7599. [DOI] [PubMed] [Google Scholar]
- 32.Soderstrom, M., J. Ya-Ping, J. Hillert, and H. Link. 1998. Optic neuritis: prognosis for multiple sclerosis from MRI, CSF, and HLA findings. Neurology. 50:708–714. [DOI] [PubMed] [Google Scholar]
- 33.Storch, M.K., A. Stefferl, U. Brehm, R. Weissert, E. Wallstrom, M. Kerschensteiner, T. Olsson, C. Linington, and H. Lassmann. 1998. Autoimmunity to myelin oligodendrocyte glycoprotein in rats mimics the spectrum of multiple sclerosis pathology. Brain Pathol. 8:681–694. [DOI] [PMC free article] [PubMed] [Google Scholar]
- 34.Sobel, R.A. 2000. Genetic and epigenetic influence on EAE phenotypes induced with different encephalitogenic peptides. J. Neuroimmunol. 108:45–52. [DOI] [PubMed] [Google Scholar]
- 35.Muller, D.M., M.P. Pender, and J.M. Greer. 2000. A neuropathological analysis of experimental autoimmune encephalomyelitis with predominant brain stem and cerebellar involvement and differences between active and passive induction. Acta Neuropathol. (Berl.). 100:174–182. [DOI] [PubMed] [Google Scholar]
- 36.Vanderlugt, C.L., and S.D. Miller. 2002. Epitope spreading in immune-mediated diseases: implications for immunotherapy. Nat. Rev. Immunol. 2:85–95. [DOI] [PubMed] [Google Scholar]