

Abstract
The immune response of naive CD4 T cells to influenza virus is initiated in the draining lymph nodes and spleen, and only after effectors are generated do antigen-specific cells migrate to the lung which is the site of infection. The effector cells generated in secondary organs appear as multiple subsets which are a heterogeneous continuum of cells in terms of number of cell divisions, phenotype and function. The effector cells that migrate to the lung constitute the more differentiated of the total responding population, characterized by many cell divisions, loss of CD62L, down-regulation of CCR7, stable expression of CD44 and CD49d, and transient expression of CCR5 and CD25. These cells also secrete high levels of interferon γ and reduced levels of interleukin 2 relative to those in the secondary lymphoid organs. The response declines rapidly in parallel with viral clearance, but a spectrum of resting cell subsets reflecting the pattern at the peak of response is retained, suggesting that heterogeneous effector populations may give rise to corresponding memory populations. These results reveal a complex response, not an all-or-none one, which results in multiple effector phenotypes and implies that effector cells and the memory cells derived from them can display a broad spectrum of functional potentials.
Keywords: memory, inflammation, migration, chemokine receptors, cytokines
Introduction
Adoptive transfer models, often using T cell receptor transgenic (Tg)* donor cells, have enabled the study of primary immune responses in situ which have begun to yield new insights into the mechanisms involved in that response. Studies from Jenkins' laboratory have visualized the CD4 T cell response in the lymph nodes and spleen, highlighting the initial interaction of naive CD4 T cells, with dendritic cells presenting antigen, followed by the movement of the donor cells to other sites (1). A number of transfer studies with CD8 T cells have suggested that initial effective encounter with antigen in vivo, is sufficient to support activation and multiple rounds of cell division (2–4). The latter study suggested that CD8 T cells may respond in an all-or-none fashion. However, other studies have been more compatible with a heterogeneous response in vivo (5). A number of recent studies have indicated that during a primary immune response, effector cells become widely distributed to multiple sites (6–9), where they may have different functional potentials (6, 10–12). Lanzavecchia and colleagues have proposed a division of memory T cells into central memory cells residing in secondary lymphoid tissues and identified by presence of CCR7 and effector memory residing in tertiary tissue sites and identified by the absence of CCR7 (10, 13). The pathways giving rise to these different populations and the factors influencing such possible pathways are largely undefined.
We have analyzed the primary CD4 T cell response to influenza virus to determine whether the effector cells generated are heterogeneous and whether different subsets of effectors have different functional and phenotypic attributes and abilities to be recruited to a tertiary inflammatory site.
We have used Thy1 disparate donor TCR Tg cells specific for viral hemagglutinin, adoptively transferred into normal BALB/c mice. Naive donor cells were labeled with a vital dye to detect their subsequent division in response to influenza virus. The transferred population was identified by using both the Thy1 difference and Ab to the TCR. The model described here has several distinct features. Influenza virus is administered intranasally where it first infects airway epithelial cells. The virus replicates only in these cells (14, 15), so virus and inflammation are colocalized in the lung. Both CD4 and CD8 T cells respond vigorously to influenza infection and both can participate in clearing virus (16–18). Because the sublethal dose of the virus used is cleared effectively (18), antigen is present only for a limited time, allowing an acute primary response, followed by a resolution of that response and development of memory.
The CD4 T cell response was visualized by the changes in a variety of key phenotypic markers. The response was broadly heterogeneous, beginning in the draining LNs and spleen and then spreading to other secondary lymphoid sites. By 6 d, a cohort of this effector population, defined by many rounds of cell division and the most extensive phenotypic conversion, was recruited into the lungs and bronchial alveolar lavage (BAL). This phenotypic and functional heterogeneity was maintained to the end of the response after virus had been cleared and effectors had acquired a resting phenotype. These studies revealed that even a homogeneous population of naive cells responded in a heterogeneous fashion in vivo, that there was a broad spectrum of possible responses defined by multiple criteria and that only a cohort of effectors were recruited into the site of infection and inflammation, where they participated in the antiviral response. Moreover these studies suggest that when response subsides, a small population of resting cells, representing a spectrum of heterogeneous subsets which reflect the effector pattern, persist and are likely to be the origin of multiple memory subsets.
Materials and Methods
Mice.
BALB/c mice were purchased from The Jackson Laboratory at 6–8 wk of age. HNT TCR transgenic mice were generated and characterized as described previously (19). CD4 T cells from these mice express Vβ8.3 TCR transgene derived from clone T2.5–5 specific for the hemagglutinin peptide 126–138 (HNTNGVTAACSHE) presented on I-Ad (20). HNT mice were bred and obtain from the Trudeau Institute's Animal Breeding facility. They were backcrossed for at least 12 generations to BALB/c mice and to BALB/c Thy1.1 mice, originally obtained from Dr. Jonathan Sprent (The Scripps Research Institute, La Jolla, CA).
Purification of Naive Influenza-specific CD4 T Cells.
Naive CD4 T cells were purified from HNT BALB/c.Thy1.1 mice. Cell suspensions from spleen and LN were passed over nylon wool column followed by separation on a percoll gradient with layers 80–62–53–40%. T cells recovered from the 80–62% interface were further enriched using a CD4 subset column (R&D Systems) as described by manufacturer. The naive CD4 T cell population obtained was >97% HNT TCRpositive and expressed a characteristic naive phenotype, including small size as detected by FACS® analysis, high levels of L-selectin and CD45RB and low expression of CD25.
Adoptive Cell Transfer and Virus Infection.
Naive CD4 T cells were labeled with carboxyfluorescein diacetate succinimidyl ester (CFSE; Molecular Probes, Inc.) as described previously (21). Each BALB/c recipient received 5 × 10⁶ CFSE-labeled cells in 0.2 ml of PBS by intravenous injection in the tail. Influenza A virus (A/PR/8/34) was grown in the allantoic fluid of 10-d old embryonated chicken eggs, from an aliquot originally obtained from Dr. David Morgan (The Scripps Research Institute, La Jolla, CA). Adoptively transferred mice were inoculated intranasally during light isoflurane anesthesia with 0.5× LD50 of virus, corresponding to a 1:30,000 dilution of a stock containing 3 × 10⁶ PFU/ml, in 100 μl of PBS.
Tissue Preparation.
At different time points after virus infection, 3 to 5 mice per group were exsanguinated, under deep isoflurane anesthesia, by perforation of the abdominal aorta. Cells from the BAL were collected by lavage of the airways, three times with 1 ml of cold RPMI. Lungs were then perfused by injecting 3 ml of PBS in the left ventricle of the heart. Lungs, spleen, draining LN (mediastinal LN [MLN]), and a pool of non-draining peripheral LN (pLN) including mesenteric, axillary, brachial, inguinal, and periaortic, were taken from each mouse. Single cell suspensions were prepared by passing the organs through a nylon cell strainer. Leukocytes were separated from lung suspensions by resuspending the cells in 80% percoll, overlaid with 40% percoll. After centrifugation at 1,700 rpm for 20 min, cells at the 80–40% interface were collected, washed, counted, and analyzed further by flow cytometry.
Viral Plaque Assay.
Viral titer in infected lungs were determined using a modified Madin Darby canine kidney (MDCK) cell plaque assay (16). At the indicated times, lungs were snap frozen in liquid nitrogen and stored at −70°C until ready for use. MDCK monolayers were grown in DMEM supplemented with 10% FCS, 0.01 mM MEM, nonessential amino acids, 1 mM sodium pyruvate (GIBCO BRL), and PSG (200 IU/ml of penicillin, 200 μg/ml streptomycin, and 4 mM glutamine). 10-fold dilutions of the lung homogenates were prepared in DMEM supplemented with 0.2% BSA, 2 mg/ml NaHCO3, 2 mM Hepes and PSG. 100 μl of each dilution was added to confluent monolayers of MDCK cells in 12 well plates in duplicates for 1 h 37°C, 7% CO2. Each well received 1 ml of an agar overlay medium containing DMEM with 0.2% BSA, 2 mg/ml NaHCO3, 2 mM Hepes, PSG, 0.5% agar (Sigma Aldrich), 0.01% DEAE Dextran, and 0.5 μg/ml trypsin. After 3 d of incubation at 37°C, cells were fixed with 0.5ml Carnoy's fixative (3:1) methanol/glacial acetic acid for 20 min. The agar overlay was then removed and fixed monolayers stained by adding 1:10 dilution of 2% crystal violet prepared in 20% ethanol. The results are presented as PFU/ml = (mean number of plaques /0.1) × (1/dilution factor).
Flow Cytometry.
The percentages of donor HNT TCR Tg CD4 Thy1.1+ cells in each organ was determined by FACS® analysis. Cell suspensions were first incubated 10 μl of anti-CD16/CD32 (BD Biosciences) to block Fc receptors. The cells were then stained with anti-Thy1.1-biotin followed by streptavidin-allophycocyanin (APC), anti-Vβ8.3-PE, and anti-CD4-Cyc. The following mAb were used for phenotype staining: anti-CD44-PE, anti-CD62L-PE, anti-CD49d-PE, anti-CCR5-PE, and a mixture of anti-IgG1-PE, anti-IgG2a-PE, anti-IgG2b-PE, and anti-IgG2c-PE were used as isotype controls (BD Biosciences). CCR7 expression was detected using the recombinant ligand, ELC-Ig, obtained from von Andrian's laboratory (22). To stain for CCR7 cell suspensions were incubated with ELC-Ig (1 μg/ml) followed by goat anti–human Fc biotin and streptavidin-APC (22). In this particular staining, donor cells were identified using anti-Thy1.1-PE and CD4 PerCP. Flow cytometry was performed using FACSCalibur™ and the data were analyzed with CELLQuest™ software (Becton Dickinson). The total number of donor cells per organ were calculated by assessing percentage of donor Thy1.1+ cells by FACS®, multiplied by total number of cells recovered from each organ.
5′-Bromo-2′-Deoxyuridine Staining.
T cell proliferation in vivo was measured by 5′-bromo-2′-deoxyuridine (BrdU) incorporation. BALB/c recipient mice were feed orally with BrdU (Sigma-Aldrich) dissolved in water (1 mg/ml) every day. Oral delivery of BrdU by gavage was more effective than BrdU in the drinking water since the infected mice often would not drink a dependable volume of water. At 2 d intervals, organs were collected and donor cells were enumerated by staining with anti-CD4 cychrome, anti-Thy1.1 biotin, and streptavidin-APC. BrdU incorporation was detected as described previously (23) by staining with anti-BrdU-PE mAb and isotype control anti-IgG1-PE mAb antibody (BD Biosciences).
Intracellular Cytokine Staining.
Staining for intracellular cytokines was performed using a modification of standard techniques (24). Briefly, cell suspensions from different organs were resuspended at 10−7 cells/ml in tissue culture media and restimulated with or without PMA (50 ng/ml) and Ionomycin (1 μg/ml) for 4 h. Brefeldin A (Epicentre Technologies) was added (10 μg/ml) to the cultures for the last 2 h. After 4 h, cells were collected, blocked with monoclonal antibodies to FcRIII/II receptor, and surface stained with anti-CD4 and anti-Thy1.1 biotin followed by streptavidin-APC (BD Biosciences) in PBS containing 1% BSA. After fixing (4% paraformaldehyde) and permeabilization (0.1% saponin, 1% fetal bovine serum in PBS), cells were stained with anti-IFN-γ-PE, anti-IL-2-PE, and the respective isotype controls anti-IgG1-PE and anti-IgG2a-PE (BD Biosciences) incubated for 30 min at room temperature. Flow cytometry was performed as above.
Results
Kinetics of Expansion and Recruitment of Responding CD4 T Cells.
Naive influenza-specific CD4 T cells were labeled with the CFSE which segregates equally between daughter cells, resulting in half the fluorescent intensity per cell with each cell division (21). 5 × 10⁶ CFSE-labeled cells were transferred by intravenous injection into syngeneic BALB/c mice. Recipient mice were infected with influenza virus A/PR8/34 by intranasal inoculation within a day (25). The kinetics of recovery and division of donor T cells was quantified by flow cytometry.
In control, uninfected mice examined at day 1, naive donor cells were found in pLN (axillary, brachial, inguinal, and MLNs, 3–5 × 10⁵) and spleen (1–2 × 10⁵) with few donor cells in other sites (unpublished data, but see reference 26). Fig. 1 A shows absolute number of T cells expressing CD4 and the Thy1.1 marker that were recovered from each tissue, at days 2, 4, 6, and 8 after infection. At 4 d, the most dramatic expansion of donor CD4 T cells had occurred in the draining MLN and spleen, where there were 16 and fourfold expansions, respectively, compared with numbers of cells present in uninfected control mice at day 1. No donor cells were detected in lung tissues or BAL on days 2 and 4 (Fig. 1 A) or in uninfected mice (unpublished data). By day 6, specific donor cell numbers peaked in all organs with an expansion of 24-fold in spleen and 45-fold in MLN, coupled with an abrupt appearance of donor cells in the lung and BAL. The largest number of donor cells was found in the spleen (>4 × 10⁶) and the next highest in the lung and the BAL (5 × 10⁵; Fig. 1 A). However the percentage of donor CD4 T cells compared with total lymphocytes, was greater in the lung (10%) and BAL (15%) than the spleen (2%; Fig. 1 B). Absolute donor cell numbers in all organs tested had declined abruptly by day 8. An analysis of donor cells after day 8 in other sites (bone marrow, peritoneum, and fat pads) supported the concept that total numbers per animal decreased rapidly after day 6 (unpublished data). Naive donor cells recovered from lymphoid organs of an uninfected control group remained CFSE high. At day 6 naive donor cells transferred to mice that remained uninfected were recovered mostly in spleen (2–5 × 10⁵) and pLNs (1–2 × 10⁴).
Figure 1.

Kinetics of expansion and recruitment of in vivo generated effectors. 5 × 10⁶ naive CFSE-labeled, CD4 T cells from HNT.Thy1.1 mice, were transferred into normal BALB/c hosts. Recipient mice were infected intranasally with 0.5 LD50 of A/PR8/34 (PR8, H1N1) influenza A virus 1 d later. At the indicated time points after infection, mice were killed and spleen, a pool of nondraining LN (pLN), MLN, lungs, and BAL were harvested. The total number of cells and percentage of CD4+Thy1.1+ (donor cells) was calculated. (A) Absolute cell numbers of donor cells in the organs indicated over time after influenza infection calculated using the percentages in B. Each bar represents three individual mice per group and is representative of three independent experiments. (B) The percentages of donor cells obtained from each organ. (C) The virus titer in the lungs of BALB/c mice from day 2 to 8. Data represent mean titers from lungs of three individual mice analyzed per time point.
To analyze whether the rise and fall of effector T cells was correlated to viral titer we measured the levels of influenza virus in the lung at different times after infection. The number of influenza PFU increased rapidly after inoculation reached a plateau by day 2 (∼109 PFU) and remained high until day 6, coincident with maximum accumulation of donor cells. Virus clearance began after day 6 and titers dropped to only several hundred PFU on day 8 (Fig. 1 C) with no detectable virus after day 10 (unpublished data), paralleling the decline in responding effector cells.
Kinetics of Division of CD4 T Cells.
The kinetics of cell recovery suggested that the influenza-specific cells might be responding first in the draining LN and spleen. To directly analyze cell division in vivo, we combined analysis of kinetics of CFSE loss and BrdU incorporation. BrdU was given orally to the infected hosts of CFSE-labeled naive CD4 T cells, daily for two days intervals from 0 to 12 d after infection and cells recovered from these mice were analyzed for CFSE intensity and BrdU incorporation 1 d after the final dose (Fig. 2 A). During the first 2 d after infection, there was no change in the CFSE profile or BrdU incorporation among transferred cells from any site analyzed (Fig. 2 A, day 2). From day 2 to 4, 58% of donor cells recovered from the MLN had divided as indicated both by BrdU incorporation and a shift in CFSE profile. A lower proportion of less-divided cells were found in the spleen (25%). Whether the dividing cells in the spleen came from the MLN or were generated in the spleen is not clear, however the higher total number of donor cells in the spleen (Fig. 1 A) and the fact that they had undergone fewer divisions, argues against the MLN as a primary source (Fig. 2 A). Many donor cells in the spleen had not yet started to divide (BrdUnegative and CFSEhigh). At day 4, there was no evidence of cell division in nondraining LN and there were no donor T cells recovered from lung or BAL. These results point to initial cell division in the draining LN followed in a day or two by response in the spleen.
Figure 2.
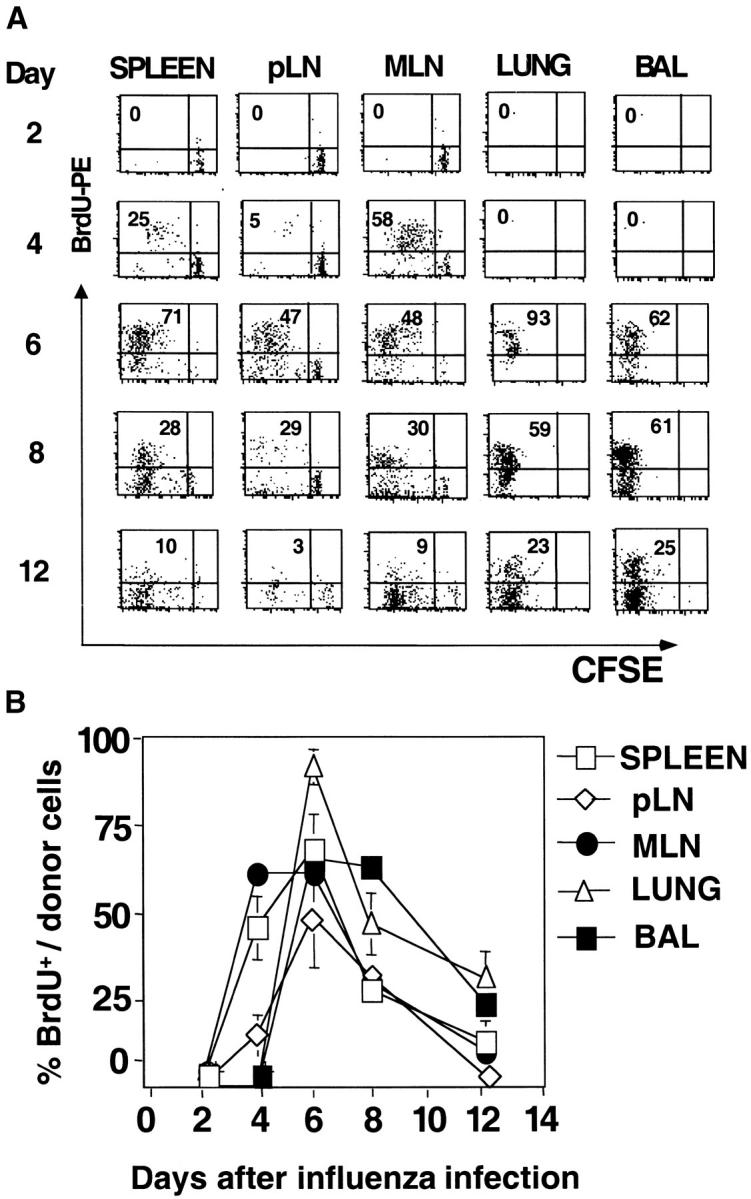
Kinetics of division of donor CD4 T cells. Infected recipient mice were generated as in Fig. 1. BrdU incorporation was analyzed at 48 h intervals, starting immediately after influenza infection up to day 12. Each group of mice was fed orally for 2 d. On days 2, 4, 6, and 8 mice were killed and tissue processed as described. (A) Kinetics of cell division, dot plots of BrdU incorporation and CFSE profiles in the indicated organs gated on CD4+ Thy1.1+ cells. The numbers in the top left quadrant indicate the percentages of donor T cells that incorporated BrdU over a 48-h period. Data are representative of three mice per group and two independent experiments. (B) Percentages of BrdU+ donor cells at the time points indicated.
In the interval from day 4 to 6, high levels of BrdU incorporation continued indicating recent division among donor cells in all sites and CFSE profiles indicated that the majority of donor cells in both MLN and spleen had undergone three or more rounds of division, but there was a persistent population of undivided cells in pLN spleen and MLN. The progressive loss of CFSE from day 2 to 6 in MLN and spleen and a relative loss of the undivided population with time suggested that naive cells were being recruited into the response over several days, which is consistent with a higher undivided, naive donor population that is found in uninfected mice in spleen (2–5 × 10⁵) and pLNs (1–2 × 10⁴). At day 6, donor cells first appeared in the lung and BAL and only the most highly divided cells were found in these sites. Division continued past day 6, as indicated by the BrdU+ population recovered at day 8, but had mostly ceased by day 10 (Fig. 2, A and B). It is not possible to conclude from this analysis whether division actively occurred in the lung and the BAL, or whether all division occurred before the donor cell entry (Fig. 2 B).
After day 15, BrdU incorporation among donor cells returns to levels comparable to uninfected mice (unpublished data).
Phenotype of Responding Donor Cells in Secondary Lymphoid Organs versus Lung.
To define the heterogeneity of the T cells responding to influenza, we analyzed the cell surface phenotype of the donor cells in different sites. By monitoring the number of cell divisions together with the phenotypic changes that occur, we could correlate expression of different molecules required for the recruitment of effector cells into the inflammatory site with division. We focused first on the expression of adhesion molecules and chemokine receptors at the peak of the immune response (day 6; Fig. 3) . The cells in secondary lymphoid organs (both spleen and MLN) were very heterogeneous for CFSE. There was a rapid upregulation of the adhesion molecule CD44 which interacts with epithelial hyaluronate (27, 28) after the first division and levels of expression increased slightly as the cells underwent further divisions. All the donor cells found in lung and BAL expressed high levels of CD44 (Fig. 3 A).
Figure 3.
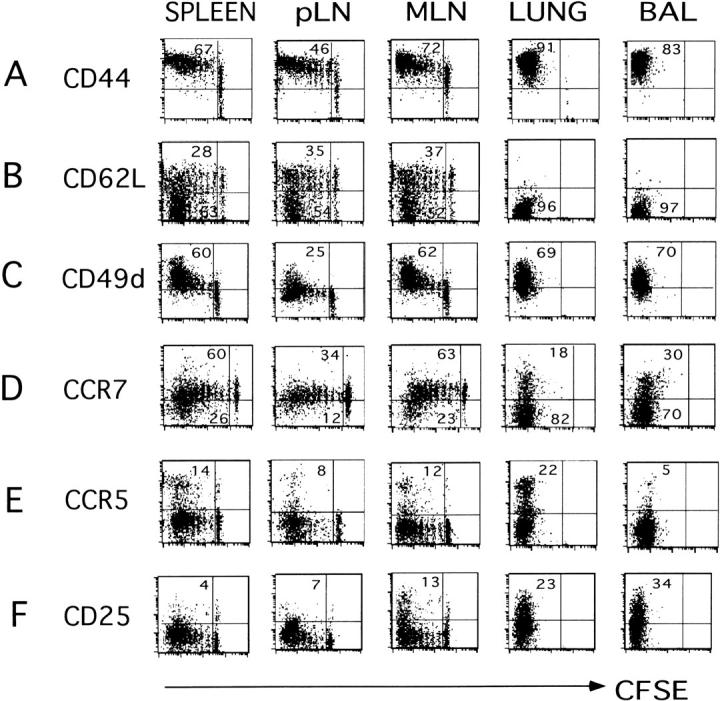
Phenotype of responding donor cells in different sites infected recipient mice were generated as in Fig. 1. After 6 d, cell suspensions from spleen, pLN, MLN, lung, and BAL were prepared and donor cells were identified by staining with anti-Thy1.1-Biotin followed by streptavidin-APC and anti-CD4-Cychrome. Expression of activation markers and CFSE fluorescence of gated donor cells was analyzed. Markers were: (A) CD44-PE, (B) CD62L-PE, (C) CD49d-PE, (D) CCR7, detected using the ELC-Ig chimera followed by anti–human-APC, (E) CCR5-PE, and (F) CD25-PE. Quadrants were set relative to isotype controls. The numbers in the top and bottom left quadrants indicate the percentages of cells expressing the indicated marker. Three individual mice were analyzed in each experiment, all were similar, one is shown. Data are representative two different experiments.
Extravasation of naive T cells through high endothelial venuoles into LNs is mediated in part by CD62L (29) which interacts with peripheral-node addressin (PNAd) present on Glycam-1, CD34, and podocalixin (30, 31). CD4 effectors that had divided less than 5–6 times rarely lost CD62L (Fig. 3 B), but after 8 divisions a large proportion of the responding donor cells were CD62Llow. Even 6 d after infection, a proportion (34 to 41%) of cells in the spleen and LN that divided up to 8 times remained CD62Lhigh (Fig. 3 B), revealing heterogeneity even among the most divided donor cells (Table I). Strikingly, almost all of the CD4 effector T cells that were found in the lung and airways had down-regulated CD62L.
Table I.
Phenotype of Donor Cells Which Have Undergone >6 Divisions
| CD44 high |
CD62L low |
CD49d high |
CCR7 low |
CCR5 high |
CD25 high |
|
|---|---|---|---|---|---|---|
| Spleen | 100 | 73 | 97 | 74 | 15 | 4 |
| pLN | 100 | 42 | 69 | 56 | 13 | 16 |
| MLN | 100 | 83 | 86 | 59 | 4 | 17 |
| Lung | 100 | 95 | 90 | 85 | 13 | 26 |
| BAL | 100 | 95 | 83 | 86 | 7 | 37 |
The data from Fig. 3 was used to derive data on the cells which had divided six or more times. We show the percentage of the divided cells with each phenotype.
Firm adhesion of lymphocytes after initial selectin-mediated tethering and rolling requires up-regulation of integrins including members of the very late antigen subfamily, such as CD49d (α4β1) and CD49e (α5β1) have been implicated as the major players in firm adhesion by binding to their ligands such as VCAM-1 and fibronectin (FN; reference 32). We found that between 60–70% of responding donor cells expressed CD49d, and levels increased progressively after 2 rounds of division. The majority of highly divided cells in spleen, MLN, and lung expressed high levels of CD49d (Table I). A high level of expression of CD49d was seen in all donor cells that were recovered from the lung and airways. CD49e was not up-regulated with division or more highly expressed in the lung CD4 T cells (unpublished data).
Chemokine receptor expression is also expected to play a role in dictating T cell localization. Naive CD4 T cells express CCR7 which binds to ligands, SLC (CCL21) and ELC/MIP-3β (CCL19), which are expressed on high endothelial venules favoring retention in the secondary tissues (33–35). Loss of CCR7 has been suggested as a marker to define the “effector memory” T cell subset, which is located in nonlymphoid sites (10). We used the recombinant CCR7 ligand, ELC-Ig chimeric molecule developed in von Andrian's laboratory, to detect CCR7 expression on donor CD4 T cells (22). CCR7 was expressed on naive donor T cells at high levels that were maintained for up to 7 cell divisions (Fig. 3 D). At day 6 and after 8 cell divisions a small percentage of cells in secondary lymphoid tissues had down-regulated CCR7: spleen (26%), pLN (12%), and MLN (23%). In contrast, the majority of donor T cells (70–80%) that were recovered from the lung and BAL were CCR7negative. CCR7 expression was still heterogeneous among highly divided cells in LN (Table I). Thus, both CD62L and CCR7 down-regulation were events which occurred only on a fraction of the most highly divided donor T cells and loss of both markers occurs late in the response and is positively correlated with migration to the lung (Fig. 3, and unpublished data).
CCR5 ligands: CCL3 (MIP-1α), CCL4 (MIP-1β), and CCL5 (RANTES) are involved in transendothelial migration. All of these are induced in the lung early after influenza infection (unpublished data). CCR5 has also been reported to be preferentially expressed on Th1 effector cells (36, 37). Of all the markers analyzed, CCR5 expression was the most rare and it was highly expressed only on the responding cells that had divided repeatedly. Between 8–14% of the donor T cells responding to influenza virus in spleen and LNs expressed CCR5 at the peak of the immune response (Fig. 3 E). A higher proportion of CD4 T cells expressing CCR5 were found in the lung (22%). Interestingly, in the BAL, few cells expressed CCR5 (5%; Fig. 3 E), despite the fact that the cells at this site were highly activated by other criteria.
CD25, the IL-2Rα, is up-regulated in response to optimum T cell stimulation or high levels of IL-2. When effectors are deprived of stimulation they quickly lose CD25 expression (26). At day 6 after influenza infection, we found expression of CD25 on a fraction of responding donor cells in MLN (13%), but it was expressed on few cells in spleen or pLN (4 and 7%, respectively; Fig. 3 F). Interestingly, a larger fraction of donor cells in lung and BAL expressed CD25 at day 6 (23 and 34%, respectively; Fig. 3 F) and levels were highest among the most divided cells in the lung and BAL (Table I). The higher expression of CD25 on donor effectors in the lung and BAL suggests that recruited cells are reencountering antigen and/or cytokines in the lung.
Phenotypic Heterogeneity After the Acute Phase of the Immune Response.
By day 15, donor cell numbers were low, cell division had ceased and virus had been cleared. Phenotypic analysis of the donor cells remaining at this time indicated they were small cells (unpublished data) and that much of the heterogeneity seen at day 6 still persisted (Fig. 4 A). The CFSE profile remained much as it was at day 6 and expression of CD44 and CD62L also showed a similar spectrum (Fig. 4 A). In contrast, CCR5 and CD25 were down-regulated as the response waned (Fig. 4 B).
Figure 4.

Phenotypic heterogeneity after the acute phase of the immune response infected recipient mice were prepared as in Figs. 1–3 and harvested at various days up to day 15. Donor cells, CFSE, and phenotypic markers were identified as in Fig. 3. (A) Expression of CD44 and CD62L on gated donor cells versus CFSE fluorescence on organs harvested 15 d after influenza virus infection. (B) Kinetics of expression of CCR5 and CD25 at indicated days after influenza infection. Percentages of donor cells expressing CCR5 and CD25 based on the total cell number obtained per organ. Each point represents the mean of three mice per group.
Further studies over 4 wk after infection indicated that CFSE profiles remain heterogeneous and similar to those at 15 d, as do CD44 and CD62L profiles (unpublished data).
Cytokine Production by Responding Donor Cells.
We also analyzed cytokine production in spleen, pLN, MLN, lung, and BAL at the peak of the response to influenza (day 6). In all organs, the proportion of IFN-γ–producing cells increased with greater numbers of cell division. At the peak of response, day 6, the donor effector cells that had accumulated at the inflammation site were able to produce particularly high amounts of IFN-γ (lung 42%, BAL 46%). Most striking was the observation that cells recovered from the lungs and the BAL were able to produce IFN-γ without any restimulation in vitro (Fig. 5 A). The kinetics of the ability to produce cytokine parallels the overall response. By day 9 there was a dramatic decline in the number of cells that can produce both IFN-γ and IL-2 (Fig. 5 B). This decrease correlated with clearance of virus from the lung (Fig. 1 C). IL-2–producing cells increased in number at secondary sites with cell division, whereas cells recovered from lung and BAL produced less IL-2 than those in the spleen and LN (Fig. 5 B).
Figure 5.

Cytokine production by responding donor cells. Infected recipient mice were prepared as in Fig. 3. At day 6, donor cells in spleen, a pool of nondraining (pLN), MLN, lung, and BAL were analyzed for their capacity to produce cytokines in vitro after restimulation with and without PMA and Ionomycin for 4 h in the presence of BFA for the last 2 h. (A) IFN-γ–producing cells gated on donor cells. (B) IL-2–producing cells gated on donor cells. (C) Kinetic analysis of absolute numbers of donor cells expressing the indicated cytokine at different days after influenza infection.
Discussion
The results from this study support several major conclusions. First, despite the fact that influenza virus is localized exclusively to the lung, the primary response of the homogeneous population of naive antigen-specific TCR transgenic CD4 T cells is broadly systemic, occurring in draining MLNs, but also in the spleen, with less response only in nondraining pLNs. Second, the response is vigorous with extensive expansion of donor cells and it is extremely heterogeneous. The effector cells generated show a broad spectrum of number of cell divisions they have undergone, of several key phenotypic markers involved in migration and function and of cytokine production. The picture seen suggests multiple subsets which represent progressive stages of differentiation and argue strongly against an “all-or-none” model of response. Third, only a cohort of the effector cells, which have divided most and have acquired a phenotype of high and stable CD44 and CD49d expression, transient expression of CCR5 and CD25, and low expression of CD62L and CCR7, are subsequently recruited into the lung and airways. The donor cells recovered from the lung also produced the highest levels of IFN-γ and lowest levels of IL-2 and appear to represent the most highly differentiated effector cells. Fourth, the distinctive heterogeneous profile of donor cells in the secondary sites versus the lungs was maintained at least to day 15, 5 d after viral clearance, indicating effectors can become “frozen” along a differentiation pathway once stimulation is removed and suggesting that memory heterogeneity may be a direct reflection of effector heterogeneity. These results suggest that the effector response is by nature heterogeneous and that because extravasation into tertiary sites requires a unique pattern of selectins, adhesion molecules, and chemokine receptors, the cells reaching the lung and forming memory in that site are a unique cohort of the total spectrum in secondary sites. We suggest that these phenomenon are likely to be responsible for the development of memory subsets which have been previously labeled “central” and “effector” memory (13).
Division and Expansion in Different Sites.
A key feature of the response to influenza is a rapid and extensive division of the stimulated naive CD4 T cells, which results in a very large effector population, but which nonetheless results in a series of effector subsets which differ in the number of divisions they have experienced. The first divisions of the donor Tg CD4 T cells occurred in the draining LN, followed closely by division in the spleen, then nondraining nodes (Fig. 2 A). The peak of specific CD4 T cell division paralleled the accumulation of large donor effector cell populations in the spleen and only at this time did donor cells become detectable in lung and BAL. When donor cells appeared in the lung/airway they had recently divided and they represented the cells that had undergone the most divisions (Fig. 2 A). The largest absolute numbers of donor cells were found in the spleen (over 4 million), but the highest representation of donor CD4 T cells was in the lung and BAL (Fig. 1 B). These observations are most compatible with the concept that the high numbers of effectors were generated in the multiple secondary sites and subsequently the cohort of most divided and differentiated effector cells migrated into the lung. This correlation does not necessarily imply that large numbers of divisions are required for cells to be recruited into the inflammatory site (5). Instead we suggest that the cells that have undergone multiple rounds of division are also most likely to be the cells expressing other characteristics enabling them to be recruited (see below). Our results in fact support the concept that T cell division is not strictly linked to recruitment, as many effector cells found in the secondary sites by day 4 had divided at least eight times, but none were recruited into the lung until later and only the cells which had lost CD62L regardless of division were found in the lung even late in the response (Fig. 4 A).
The systemic nature of the response to influenza contrasts with that recently reported to Salmonella (38) in that CD4 T cells responded in spleen and many LNs even though virus is confined to the lung, while in the Salmonella study, infection was disseminated, but the response was confined to the intestinal mucosa. It is not clear if the distribution of the responding cells vary because the organisms trigger different types of inflammatory response or because the TCR affinities for the antigens are different.
Another dramatic feature of the influenza-induced response is that it rapidly declines after the peak at day 6. After day 8, new division is less frequent, which correlates with the abrupt drop in viral titer between day 6 and 8 (no virus is detectable by day 10). After viral clearance the initiation of responses of new naive cells ceases. This is consistent with the concept that dendritic cells survive and present antigen in peripheral sites only for a short time (39, 40). At the same time as division slows and then stops, there is a marked and coordinated decline in donor cell numbers in all organs tested. It is unlikely this decline is due to relocation because it occurs concurrently in all sites and it is thus likely due to the programmed cell death of donor effector cells. Activation-induced cell death may be important in the lung where the activation state and constitutive cytokine production, suggest ongoing presentation of antigen, but the dramatic decline in peripheral sites is likely to occur without the need for antigen, suggesting it is part of the intrinsic death program of effectors as has been suggested for in vitro–generated Th1 effectors (41).
Adhesion, Homing, and Chemokine Receptors Profiles in Different Sites.
There are both strong and weak correlations between cell surface phenotype and the location of the effector populations, which suggest that some of these may be directly involved in migration of effectors to the lung. Overall, more CD4 effector cells in the lung expressed higher levels of CD44, CD49d, and CCR5 and lower levels CD62L and CCR7 than the total population in spleen and MLN in keeping with a number of earlier studies of migration to inflammatory sites (27, 28, 31, 32). The cells recruited into the lung were all CD44 high, but since CD44 was up-regulated early on all the cells that divided and many CD44 high cells were not recruited to the lung, high CD44 expression could be necessary but not sufficient for lung recruitment. The integrin CD49d, showed increasing expression with time (unpublished data) and cell division but there was a wide spectrum of CD49d expression levels among the highly divided population. Donor CD4 cells found at the site of inflammation were mostly CD49d high, so this integrin could potentially be involved in recruitment. In secondary lymphoid sites, loss of CD62L was only seen late and on highly divided donor cells and even on the most divided cells, up to 40% still expressed CD62L. The heterogeneity in the expression of CD62L in donor cells recovered from secondary lymphoid tissue, even in the most highly divided population, suggests that signals beyond those needed for division are required for CD62L down-regulation. Donor cells recovered from the lung and BAL, were uniformly CD62L low and thus down-regulation of CD62L selectin may be necessary for T cells to escape lymphoid sites and be recruited into nonlymphoid sites. After response has ended, the donor cells found in spleen and other secondary lymphoid organs remain heterogeneous in expression of CD62L (Fig. 4 A), while those in the lung all remain low.
The chemokine receptor, CCR7 displays a similar pattern to CD62L in the secondary lymphoid organs, though a smaller fraction of the highly divided cells have lost CCR7. In the lung, the majority of donor cells detected were CCR7 negative, but some cells expressed low levels of CCR7. This imperfect correlation suggests that CCR7 loss is not absolutely required for recruitment into the lung, although its loss may be associated with other changes which favor this recruitment. It is notable that the expression of CCR7 in the secondary site versus the lung mirrors that described earlier for memory cells in secondary Vs tissue sites (11). It will be interesting to determine whether particular chemokine receptor expression patterns represent heritable traits or whether they are under constant regulation by local signals.
CCR5 is up-regulated on a small fraction of the most divided donor cells responding in spleen and LN and the population found in the lung is enriched in cells expressing CCR5. It is possible that cells that enter the lung are invariably higher in CCR5 expression, but that the receptor is then down-regulated as it encounters its ligands induced in the lung by viral infection (42). Indeed the cells in the BAL, which transit through the lung, do not express CCR5. Alternatively, CCR5 may be only one of several chemokine receptors involved in lung entry as suggested by the fact that humans and mice with deficiencies of the CCR5 molecule do not have markedly defective immune responses (43). With time after the peak of response, CCR5 expression decreases, suggesting that CCR5 expression may be associated with an activated state (Fig. 4 B). Earlier studies using human cells derived from different inflammatory conditions analyzed the expression of CCR7, CD27, CD62L, together with CD27 and CD11b, and also found a series of heterogeneous overlapping populations (44). Further studies will be needed to determine which chemokine receptors play active roles in recruitment to the lung.
During the differentiation of CD4 effectors in vivo, CD25 expression is weak and transient (unpublished data). CD25 (the IL-2Rα) expression can be upregulated by exposure to antigen and to IL-2 itself (45, 46), but ambient in vivo levels of IL-2 may be low or negligible. Thus, it was striking that there was a clear population of CD25-expressing cells detectable at the peak of the response on donor cells in lung and BAL (Fig. 3 F). This population was as high as 75% on day 5 (Fig. 4 B) and then declined, whereas little expression was seen in secondary sites (Fig. 3 F). We suggest this high expression of CD25 is due to recent exposure of the responding cells in lung and BAL to antigen. This is also suggested by the production of cytokine ex vivo without restimulation by these same populations (see below) and with the fact that expression is lost by day 10 when antigen is no longer present (Fig. 4 B).
Overall the phenotypic patterns suggest that only after repeated division and maximum differentiation do effectors express the pattern of integrins, selectins, and chemokine receptors which enable their recruitment to the lung, and by inference other tertiary, nonlymphoid sites. It is important to focus on how to achieve this maximum differentiation, as the cell which can go to the site of infection are the ones that can participate in viral clearance. Also of interest is that even in this vigorous response, a broad spectrum of effectors which range over the gamut of properties are retained in spleen and LN and a fraction of each is retained after viral clearance. This multipotential population may have some advantage in a secondary response.
Cytokine Polarization and Production in Different Sites.
The link between division and cytokine expression by T cells remains controversial. Cytokine expression by T cells involves epigenetic changes in chromatin structure, locus accessibility, and DNA methylation that occur during T cell differentiation (47). Production of high levels of IFN-γ and IL-4 production require S phase entry and are often well-correlated in vitro with multiple rounds of cell division (48–50). However, others have reported that T cell division is not strictly linked to effector function. When CD4 T cells cannot divide in vivo because antigen-specific T cells are overrepresented, they nonetheless can acquire the capacity to produce IFN-γ (5) and similar results were observed in an in vitro model examining IL-4 production (51). In our studies, we have found that cell division correlated well with the capacity to produce IFN-γ, although this does not imply a causal link. More effector cells found in the lung produced IFN-γ compared with those from the secondary lymphoid tissues. Previous observations from Jenkins (9) suggested that memory cells isolated from nonlymphoid tissues were more efficient producers of IFN-γ. The antiviral responses we examined clearly favored development of a Th1-polarized response. No IL-4 or IL-5 production was found by ex vivo intracellular cytokine staining (ICCS; unpublished data), and as with the most differentiated effectors in vitro (52), IL-2 was relatively down-regulated on the cells recruited to the lung.
Heterogeneity of Effector Response.
What accounts for the striking heterogeneity seen in the effectors derived from the homogeneous naive CD4 TCR Tg T cells? One factor could be time. Division and progressive loss of the CFSE high undivided population of cells continued in the spleen through day 8 (Fig. 2 A), suggesting that naive cells continue to be recruited into the response. Perhaps with more time there is an increase in the probability that an individual naive cell will encounter an appropriate APC. Such changes ceased abruptly after day 8 in parallel with viral clearance, supporting a short half-life of antigen-presenting capacity and the obligatory role of continuing antigen stimulation in driving the overall response. It appears as if differentiation stops as antigen presenting cells die and that responding cells can become fixed in an incompletely differentiated state. The fact that a diverse spectrum of cells is retained through day 15 (Fig. 4) supports this model.
Although the starting enriched naive population is >95% Tg+, there are sometimes small population of CD62L donor cells (up to 10%) and it could be argued that this heterogeneity in the starting population contributes to the heterogeneity observed. This seems unlikely. We have FACS®-sorted CD62L high (the major naive population) and CD62L low (the minor contaminating population) and both give rise to heterogeneous effectors, with a spectrum indistinguishable from the unsorted population shown in these experiments (unpublished data).
Diversity within the APC populations could also result in heterogeneity. APCs might differ either in expression of costimulatory receptors or in the density of viral hemagglutinin they present. This might lead to a partial response by naive cells encountering the suboptimal APCs. The cytokines produced by individual APCs or in particular milieus could also be distinct. The concept that different cytokines will lead to different effector and memory populations has recently been put forth by von Andrian's laboratory (17). We are testing different antigen doses to see to what extent antigen density on APC may influence heterogeneity of naive CD4 T cell response.
The heterogeneity of response argues against the “all-or-none” response model suggested by Ahmed (4) studying LCMV and others (2, 3) and instead indicates that, at least for CD4 T cells, the responding cells need multiple signals for full differentiation and that they will become arrested in division and differentiation when they do not encounter the later signals in the chain. This kind of progression is easily detected in vitro where it has been shown that antigen and costimulation together drive initial activation and division of responding naive CD4 T cells, but that IL-2, or perhaps other signals, are required for further division and differentiation to fully polarized effectors (52, 53). The difference in our study and the CD8 studies with LCMV, could be due to the nature of the pathogen used. Influenza clearance is effective and abrupt, curtailing further response. The heterogeneity of the effector response may be a useful adaptation in that the less differentiated cells may retain the plasticity to respond in different ways to reencounter with antigen. Whether the different populations found have different potential in secondary responses needs to be further explored. It will also be important in future studies to define what markers and functions represent stable, heritable traits and which are transiently regulated regardless of state of differentiation.
Effector cells generated during a primary immune response can either remain in the lymphoid tissue or migrate to peripheral tissues including inflammatory sites and other nonlymphoid sites distributed widely throughout the body (8, 9). Recently it has been suggested that cells in the lung can persist to some degree and function as protective memory cells in a recall response (6). Moreover, Lanzavecchia and colleagues have proposed that memory cells can be usefully divided into two major subpopulations that can be distinguished by the differential expression of CD62L and the chemokine receptor CCR7 (10). The “central memory” cells express CCR7 and CD62L and are found in spleen and other secondary lymphoid organs and “effector memory” cells which are CCR7 and CD62L negative are found in peripheral tissues (10). Our studies suggest that the primary response generates a broad spectrum of effector cell subsets, varying in a large number of functionally significant phenotypic markers and abilities to migrate into inflammatory sites and that those cells able to enter the lung represent those cohorts of the effector cells which have divided the most, have lost CD62L and CCR7, express high levels of activation markers and integrins, and have high expression of the effector cytokine IFN-γ and loss of IL-2. Although this pattern corresponds roughly with Lanzavecchia's depiction of “effector memory,” the picture here is somewhat more complex. All types of effectors, including cells that resemble the cohort in the lung, seem to be found in secondary sites, especially the spleen, and much heterogeneity is retained at for at least 15 d, days past the time virus is cleared and donor cells have reverted to a nondividing small cells. We predict this heterogeneity will be maintained longer and that memory in secondary sites will likewise includes a large spectrum of subsets. It should be noted that even in the lung, there is considerable heterogeneity in CD62L, in CCR5, and in CCR7 expression. This suggests that effectors go through progressive stages of differentiation and acquire properties which dictate their subsequent location, leading to distinct central Vs peripheral populations. This argues against a simple dichotomy of central versus peripheral effector and memory cells which are the result of two lineages, and instead imply that the cohort in the periphery represent the most differentiated subsets of the broader spectrum of subsets in secondary lymphoid sites.
These studies reveal a here-to-fore unappreciated complexity of the primary antiviral response which results in a spectrum of effectors with a phenotypic diversity suggesting a broad range of functional potentials.
Acknowledgments
We wish to thank Drs. David Woodland, Marcia Blackman, and Richard Dutton for their advice and useful comments, Michel Tighe for his technical assistance, and the Trudeau Institute Animal Facility for animal care.
This work was supported by the National Institutes of Health grant HL63925 and by the Trudeau Institute.
Footnotes
Abbreviations used in this paper: APC, allophycocyanin; BAL, bronchial alveolar lavage; BrdU, 5′-bromo-2′-deoxyuridine; CFSE, carboxyfluorescein diacetate succinimidyl ester; ICCS, intracellular cytokine staining; MDCK, Madin Darby canine kidney; MLN, mediastinal LN; pLN, pooled nondraining peripheral LN; Tg, transgenic.
References
- 1.Jenkins, M.K., A. Khoruts, E. Ingulli, D.L. Mueller, J.S. McSorley, R.L. Reinhardt, A. Itano, and K.A. Pape. 2001. In vivo activation of antigen-specific CD4 T cells. Annu. Rev. Immunol. 19:23–45. [DOI] [PubMed] [Google Scholar]
- 2.Mercado, R., S. Vijh, S.E. Allen, K. Kerksiek, I.M. Pilip, and E.G. Pamer. 2000. Early programming of T cell populations responding to bacterial infection. J. Immunol. 165:6833–6839. [DOI] [PubMed] [Google Scholar]
- 3.Van Stipdonk, M.J.B., E.E. Lemmens, and S.P. Schoenberger. 2001. Naive CTLs require a single brief period of antigenic stimulation for clonal expansion and differentiation. Nat. Immunol. 2:423–429. [DOI] [PubMed] [Google Scholar]
- 4.Kaech, S.M., and R. Ahmed. 2001. Memory CD8+ T cell differentiation: initial antigen encounter triggers a developmental program in naive cells. Nat. Immunol. 2:415–422. [DOI] [PMC free article] [PubMed] [Google Scholar]
- 5.Laouar, Y., and I.N. Crispe. 2000. Functional flexibility in T cells: Independent regulation of CD4+ T cell proliferation and effector function in vivo. Immunity. 13:291–301. [DOI] [PubMed] [Google Scholar]
- 6.Hogan, R.J., W. Zhong, E.J. Usherwood, T. Cookenham, A.D. Roberts, and D. Woodland. 2001. Protection from respiratory virus infections can be mediated by antigen-specific CD4 T cells that persist in the lungs. J. Exp. Med. 193:981–986. [DOI] [PMC free article] [PubMed] [Google Scholar]
- 7.Marshall, D.R., S.J. Turner, G.T. Belz, S. Wingo, S. Andreansky, M.Y. Sangster, J.M. Riderdy, T. Liu, M. Tan, and P.C. Doherty. 2001. Measuring the diaspora for virus-specific CD8+ T cells. Proc. Natl. Acad. Sci. USA. 98:6313–6318. [DOI] [PMC free article] [PubMed] [Google Scholar]
- 8.Masopust, D., V. Vezys, A.L. Marzo, and L. LeFrancois. 2001. Preferential localization of effector memory cells in nonlymphoid tissue. Science. 291:2413–2417. [DOI] [PubMed] [Google Scholar]
- 9.Reinhardt, R.L., A. Khoruts, R. Merica, T. Zell, and M.K. Jenkins. 2001. Visualizing the generation of memory CD4 T cells in the whole body. Nature. 410:101–105. [DOI] [PubMed] [Google Scholar]
- 10.Sallusto, F., D. Lenig, R. Foster, M. Lipp, and A. Lanzavecchia. 1999. Two subsets of memory T lymphocytes with distinct homing potentials and effector functions. Nature. 401:708–712. [DOI] [PubMed] [Google Scholar]
- 11.Baumgarth, N., M. Egerton, and A. Kelso. 1997. Activated T cells from draining lymph nodes and effector site differ in their response to TCR stimulation. J. Immunol. 159:1182–1191. [PubMed] [Google Scholar]
- 12.Harris, N.L., V. Watt, F. Ronchese, and G. Le Gros. 2002. Differential T cell function and fate in lymph node and nonlymphoid tissues. J. Exp. Med. 195:317–326. [DOI] [PMC free article] [PubMed] [Google Scholar]
- 13.Lanzavecchia, A., and F. Sallusto. 2000. Dynamics of T lymphocyte responses: intermediates, effectors, and memory cells. Science. 290:92–97. [DOI] [PubMed] [Google Scholar]
- 14.Walker, J.A., T. Sakaguchi, Y. Matsuda, T. Yoshida, and Y. Kawaoka. 1992. Localization and character of the cellular enzyme that cleaves the hemagglutinin of a virulent avian influenza virus. Virology. 190:278–287. [DOI] [PubMed] [Google Scholar]
- 15.Horimoto, T., and Y. Kawaoka. 1995. The hemagglutinin cleavability of a virulent avian influenza virus by subtilisin-like endoproteases is influenced by the amino acid immediately downstream of the cleavage site. Virology. 210:466–470. [DOI] [PubMed] [Google Scholar]
- 16.Luckacher, A.E., V.L. Braciale, and T.J. Braciale. 1984. In vivo function of influenza virus-specific cytotoxic T lymphocyte clones is highly specific. J. Exp. Med. 160:814–826. [DOI] [PMC free article] [PubMed] [Google Scholar]
- 17.Doherty, P.C., D.J. Topham, R.A. Tripp, R.D. Cardin, J.W. Brooks, and P.G. Stevenson. 1997. Effector CD4+ and CD8+ T-cell mechanisms in the control of respiratory virus infections. Immunol. Rev. 159:105–117. [DOI] [PubMed] [Google Scholar]
- 18.Eichelberger, M.C., M. Wang, W. Allan, R.G. Webster, and P.C. Doherty. 1991. a. Influenza virus RNA in the lung and lymphoid tissue of immunological intact and CD4-depleted mice. J. Gen. Virol. 73:1453–1459. [DOI] [PubMed] [Google Scholar]
- 19.Scott, B., R. Liblau, S. Degermann, L.A. Marcani, L. Ogata, A.J. Caten, O. McDevitt, and D. Lo. 1994. A role for non-MHC polymorphism in susceptibility to spontaneous autoimmunity. Immunity. 1:73–82. [DOI] [PubMed] [Google Scholar]
- 20.Gerhard, W., A.M. Haberman, P.A. Scherle, A.H. Taylor, G. Palladino, and A.J. Caton. 1991. Identification of eight determinants in the hemagglutinin molecule of influenza virus A/PR/8/34 (H1N1) which are recognized by Class II-restricted T cells from BALB/c mice. J. Virol. 65:364–372. [DOI] [PMC free article] [PubMed] [Google Scholar]
- 21.Weston, S.A., and C.R. Parish. 1990. New fluorescent dyes for lymphocyte migration studies. Analysis by flow cytometry and fluorescence microscopy. J. Immunol. Methods. 133:87–97. [DOI] [PubMed] [Google Scholar]
- 22.Manjunath, N., P. Shankar, J. Wan, W. Weninger, M.A. Crowley, K. Hieshima, T.A. Springer, X. Fan, H. Shen, J. Lieberman, and U.H. von Andrian. 2001. Effector differentiation is not prerequisite for generation of memory cytotoxic T lymphocytes. J. Clin. Invest. 108:871–878. [DOI] [PMC free article] [PubMed] [Google Scholar]
- 23.Mohri, H., S. Bonhoeffer, S. Monard, A.S. Perelson, and D.D. Ho. 1998. Rapid turnover of T lymphocytes in SIV-infected rhesus macaques. Science. 279:1223–1227. [DOI] [PubMed] [Google Scholar]
- 24.Openshaw, P., E.E. Murphy, N.A. Hosken, V. Maino, K. Davis, K. Murphy, and A. O'Garra. 1995. Heterogeneity of intracellular cytokine synthesis at the single cell level in polarized T helper 1 and T helper 2 populations. J. Exp. Med. 182:1357–1367. [DOI] [PMC free article] [PubMed] [Google Scholar]
- 25.Cerwenka, A., T.M. Morgan, A.G. Harmsen, and R.W. Dutton. 1999. Migration kinetics and final destination of type 1 and type 2 CD8 effectors cells predict protection against pulmonary virus infection. J. Exp. Med. 189:423–434. [DOI] [PMC free article] [PubMed] [Google Scholar]
- 26.Hui, H., G. Huston, D. Duso, N. Lepak, E. Roman, and S.L. Swain. 2001. CD4 T cells effectors can become memory cells with high efficiency and without further division. Nat. Immunol. 2:705–710. [DOI] [PubMed] [Google Scholar]
- 27.DeGrendele, H.C., P. Estess, and M.H. Siegelman. 1997. Requirement for CD44 in activated T cell extravasation into an inflammatory site. Science. 278:672–675. [DOI] [PubMed] [Google Scholar]
- 28.DeGrendele, H.C., M. Kosfiszer, P. Estess, and M.H. Siegelman. 1997. a. CD44 activation and associated primary adhesion is inducible via T cell receptor stimulation. J. Immunol. 159:2549–2553. [PubMed] [Google Scholar]
- 29.Bradley, L.M., S.R. Watson, and S. Swain. 1994. Entry of naive CD4 T cells into peripheral lymph nodes requires L-selectin. J. Exp. Med. 180:2401–2406. [DOI] [PMC free article] [PubMed] [Google Scholar]
- 30.von Andrian, U.H., and C.R. Mackay. 2000. T cell function and migration. N. Engl. J. Med. 343:1020–1034. [DOI] [PubMed] [Google Scholar]
- 31.Campbell, J.J., and E.C. Butcher. 2000. Chemokines in tissue-specific and microenvironment-specific lymphocyte homing. Curr. Opin. Immunol. 12:336–341. [DOI] [PubMed] [Google Scholar]
- 32.Siegelman, M.H., D. Stanescu, and P. Estess. 2000. The CD44-initiated pathway of T cell extravasation uses VLA-4 but not LFA-1 for firm adhesion. J. Clin. Invest. 105:683–691. [DOI] [PMC free article] [PubMed] [Google Scholar]
- 33.Föster, R., D. Schubel, E. Breitfeld, I. Kremmer, E. Renner-Muller, E. Wolf, and M. Lipp. 1999. CCR7 coordinates the primary immune responses by establishing functional microenvironments in secondary lymphoid organs. Cell. 99:23–33. [DOI] [PubMed] [Google Scholar]
- 34.Stein, J.V., A. Rot, Y. Luo, M. Narasimhaswamy, H. Nakano, M.D. Gunn, A Matsuzawa, E.J. Quackenbush, M.E. Dorf, and U.H. von Andrian. 2000. The CC chemokine thymus-derived chemotactic agent 4 (TCA-4, secondary lymphoid tissue chemokine, 6Ckine, exodus-2) triggers lymphocyte function-associated antigen 1-mediated arrest of rolling T lymphocytes in peripheral lymph node high endothelial venules. J. Exp. Med. 191:61–76. [DOI] [PMC free article] [PubMed] [Google Scholar]
- 35.Baekkevold, E.S., T. Yamanaka, R.T. Palframan, H.S. Carlsen, F.P. Reinholt, U.H. von Andrian, P. Brandtzaeg, and G. Haraldsen. 2001. The CCR7 ligand ELC (CCL19) is transcytosed in high endothelial venules and mediates T cell recruitment. J. Exp. Med. 193:1105–1111. [DOI] [PMC free article] [PubMed] [Google Scholar]
- 36.Siveke, J.T., and A. Hamann. 1998. T helper 1 and T helper 2 cells respond differentially to chemokines. J. Immunol. 160:550–554. [PubMed] [Google Scholar]
- 37.Bonecchi, R., G. Bianchi, P. Panina-Bordignon, D. D'Ambrosio, R. Lang, A. Borsatti, S. Sozzani, P. Allavena, P.A. Gray, A. Mantovani, and F. Sinigaglia. 1998. Differential expression of chemokine receptors and chemotactic responsiveness of type 1 T helper cells (Th1s) and Th2s. J. Exp. Med. 187:129–134. [DOI] [PMC free article] [PubMed] [Google Scholar]
- 38.McSorley, S.J., S. Asch, M. Costalonga, R.L. Reinhardt, and M.K. Jenkins. 2002. Tracking Salmonella-specific CD4 T cells in vivo reveals a local mucosal response to a disseminated infection. Immunity. 16:365–377. [DOI] [PubMed] [Google Scholar]
- 39.Ingulli, E., A. Mondino, A. Khoruts, and M.K. Jenkins. 1997. In vivo detection of dendritic cell antigen presentation to CD4 T cells. J. Exp. Med. 185:2133–2141. [DOI] [PMC free article] [PubMed] [Google Scholar]
- 40.De Smedt, T., B. Pajak, G.G.B. Klaus, R.J. Noelle, J. Urbani, O. Leo, and M. Moser. 1998. Antigen-specific T lymphocytes regulate lipopolysaccharide-induced apoptosis of dendritic cells in vivo. J. Immunol. 161:4476–4479. [PubMed] [Google Scholar]
- 41.Zhang, X., T. Brunner, L. Carter, R.W. Dutton, P. Rogers, L. Bradley, T. Sato, J. Reed, D. Green, and S.L. Swain. 1997. Unequal death in T helper cell (Th)1 and Th2 effectors: Th1, but not Th2, effectors undergo rapid Fas/FasL-mediated apoptosis. J. Exp. Med. 185:1837–1849. [DOI] [PMC free article] [PubMed] [Google Scholar]
- 42.Aramori, I., S.S. Ferguson, P.D. Bieniasz, J. Zhang, B. Cullen, and M.G. Cullen. 1997. Molecular mechanism of desensitization of the chemokine receptor CCR-5: receptor signaling and internalization are dissociable from its role as an HIV-1 co-receptor. EMBO J. 16:4606–4616. [DOI] [PMC free article] [PubMed] [Google Scholar]
- 43.Dean, M., M. Carrington, C. Winkler, G.A. Huttley, M.W. Smith, R. Allikmets, J.J. Goedert, S.P. Buchbinder, E. Vittinghoff, E. Gompers, et al. 1996. Genetic restriction of HIV-1 infection and progression to AIDS by a deletion allele of the CKR5 structural gene. Hemophilia Growth and Development Study, Multicenter AIDS Cohort Study, Multicenter Hemophilia Cohort Study, San Francisco City Cohort, ALIVE Study. Science. 273:1856–1862. [DOI] [PubMed] [Google Scholar]
- 44.Campbell, J.J., K.E. Murphy, E.J. Kunkel, C.E. Brightling, D. Soler, Z. Shen, J. Boisvert, H.B. Greenberg, M.A. Vierra, S.B. Goodman, et al. 2002. CCR7 expression and memory T cell diversity in humans. J. Immunol. 166:877–884. [DOI] [PubMed] [Google Scholar]
- 45.Smith, K.A., and D.A. Cantrell. 1985. Interleukin 2 regulates its own receptors. Proc. Natl. Acad. Sci. USA. 82:864–868. [DOI] [PMC free article] [PubMed] [Google Scholar]
- 46.Leonard, W.J., J.M. Depper, M. Kanehisa, M. Kronke, N.J. Peffer, P.B. Svetlik, M. Sullivan, and W.C. Greene. 1985. Structure of the human interleukin-2 receptor gene. Science. 230:633–639. [DOI] [PubMed] [Google Scholar]
- 47.Avni, O., and A. Rao. 2000. T cell differentiation: a mechanistic view. Curr. Opin. Immunol. 12:654–659. [DOI] [PubMed] [Google Scholar]
- 48.Bird, J.J., D.R. Brown, A.C. Mullen, N.H. Moskowitz, M.A. Mahowald, J.R. Sider, T.F. Gajawski, C.-R. Wang, and S.L. Reiner. 1998. Helper T cell differentiation is controlled by the cell cycle. Immunity. 9:229–237. [DOI] [PubMed] [Google Scholar]
- 49.Gett, A.V., and P.D. Hodgkin. 1998. Cell division regulates the T cell cytokine repertoire revealing a mechanism underlying immune class regulation. Proc. Natl. Acad. Sci. USA. 95:9448–9493. [DOI] [PMC free article] [PubMed] [Google Scholar]
- 50.Ritcher, A., M. Lohning, and A. Radbruch. 1999. Instruction for cytokine expression in T helper lymphocytes in relation to proliferation and cell cycle progression. J. Exp. Med. 190:1439–1450. [DOI] [PMC free article] [PubMed] [Google Scholar]
- 51.Ben-Sasson, S.Z., R. Gerstel, J. Hu-Li, and W.E. Paul. 2001. Cell division is not a “clock” measuring acquisition of competence to produce IFNγ or IL-4. J. Immunol. 166:112–120. [DOI] [PubMed] [Google Scholar]
- 52.Rogers, P.R., and M. Croft. 2000. CD28, Ox-40, LFA-1, and CD4 modulation of Th1/Th2 differentiation is directly dependent on the dose of antigen. J. Immunol. 164:2955–2963. [DOI] [PubMed] [Google Scholar]
- 53.Jelley-Gibbs, D., N.M. Lepak, M. Yen, and S.L. Swain. 2000. Two distinct stages in the transition from naive CD4 T cells to effectors, early antigen dependent and late cytokine-driven expansion and differentiation. J. Immunol. 165:5017–5026. [DOI] [PubMed] [Google Scholar]