

Abstract
CD4+ T cell responses are associated with disease control in chronic viral infections. We analyzed human immunodeficiency virus (HIV)-specific responses in ten aviremic and eight viremic patients treated during primary HIV-1 infection and for up to 6 yr thereafter. Using a highly sensitive 5-(and-6)-carboxyfluorescein diacetate-succinimidyl ester–based proliferation assay, we observed that proliferative Gag and Nef peptide-specific CD4+ T cell responses were 30-fold higher in the aviremic patients. Two subsets of HIV-specific memory CD4+ T cells were identified in aviremic patients, CD45RA− CCR7+ central memory cells (Tcm) producing exclusively interleukin (IL)-2, and CD45RA− CCR7− effector memory cells (Tem) that produced both IL-2 and interferon (IFN)-γ. In contrast, in viremic, therapy-failing patients, we found significant frequencies of Tem that unexpectedly produced exclusively IFN-γ. Longitudinal analysis of HIV epitope–specific CD4+ T cells revealed that only cells that had the capacity to produce IL-2 persisted as long-term memory cells. In viremic patients the presence of IFN-γ–producing cells was restricted to periods of elevated viremia. These findings suggest that long-term CD4+ T cell memory depends on IL-2–producing CD4+ T cells and that IFN-γ only–producing cells are short lived. Our data favor a model whereby competent HIV-specific Tcm continuously arise in small numbers but under persistent antigenemia are rapidly induced to differentiate into IFN-γ only–producing cells that lack self-renewal capacity.
Keywords: T cell memory, T cell proliferation, primary HIV-1 infection, HAART
Introduction
Infection by HIV-1 inexorably leads to severe immunodeficiency caused mostly by the loss of CD4+ T cells (1, 2). The deletion of CD4+ T cells is thought to be a consequence of the cytopathic effect of HIV although several studies have highlighted the important contribution of hyperimmune activation to the loss of CD4+ T cells (3). Analyses of T cell dynamics during chronic HIV and simian immunodeficiency virus (SIV) infection using ex vivo staining with Ki67, as well as in vivo BrdU or [3H]glucose incorporation, have demonstrated the high turnover rate of CD4+ T cells in humans (4, 5) and in nonhuman primates (6, 7). Whether enhanced T cell turnover is the consequence of CD4 depletion or its cause has been debated. Recent analysis of the immune response in the natural hosts of SIV, the sooty mangabey, and African green monkey, suggest that the absence of disease progression in these species is causally related to their failure to develop a generalized state of immune activation and elevated T cell turnover despite high levels of SIV viremia (8). Moreover, in some patients infected with HIV-2, which is associated with a less aggressive clinical course, high levels of immune activation comparable to those seen in HIV-1 infection may also develop and are then associated with comparable levels of CD4 cell depletion (9).
In this report, we have investigated the impact of the constant activation and turnover of HIV-specific CD4+ memory cells in HIV-1–infected patients on their phenotype and function, both as a model and because of the potential implications for understanding the immunopathogenesis underlying disease progression. CD4+ T cells are involved in protection from many viral infections (10). They play a major role in the induction of the immune response through their capacity to produce IL-2, to activate APCs via CD40–CD40L interaction, and to provide help to responding CD8+ T cells (11–14). In HIV-infected patients, Rosenberg et al. (15) demonstrated strong CD4+ T cell proliferative responses against the HIV-1 Gag protein in long-term nonprogressors and in early highly active antiretroviral therapy (HAART)-treated patients. The magnitude of HIV-specific proliferative response was inversely correlated to plasma viral load, suggesting that the absence of an HIV-specific proliferative response is due to the deletion of HIV-specific CD4+ T lymphocytes. Indeed, HIV-specific CD4+ T cells are the preferential targets of infection by HIV-1 (16). However, Pitcher et al. (17) showed that Gag-specific CD4+ T lymphocytes capable of producing IFN-γ were detectable in most HIV-infected patients including viremic individuals, whereas such cells were undetectable in patients treated during chronic infection. Recently, several studies have shown discrepancies between the frequencies of HIV-specific IFN-γ–producing CD4+ T cells and HIV-specific lymphoproliferation in viremic HIV-infected patients (18–20), suggesting that the absence of HIV-specific CD4+ T cell proliferative responses is due to dysfunction of HIV-specific CD4+ T cells rather than their absolute loss. Whether this dysfunction is related to maturation/differentiation of HIV-specific CD4+ T cells or to other mechanisms is not known.
Memory CD4+ T cells have been subdivided into central (Tcm) and effector (Tem) memory based on the expression of CCR7, CD62L, and CD45RA, and on their ability to produce cytokines and proliferate. CD4+ Tcm were shown to produce exclusively IL-2 and have a high capacity to proliferate, whereas Tem produce mainly IFN-γ and have limited proliferative capacity (21). To determine the impact of HIV-1 infection on the persistence and maturation of the HIV-specific memory CD4+ T cell response, we monitored HIV epitope–specific CD4+ T cells using a 5-(and-6)-carboxyfluorescein diacetate-succinimidyl ester (CFSE)-based proliferation assay as well as by intracellular cytokine staining (ICS) in HAART-treated patients that had been infected from 1 to up to 6 yr and who were successful or not in controlling their viremia. We show that persistent HIV-1 generates a high frequency of IFN-γ+ HIV-specific CD4+ T cells, lowers the frequency of IL-2–producing cells, and interferes with the establishment and/or maintenance of long-lived memory.
Materials and Methods
Study Population.
All patients signed informed consent approved by the Royal Victoria Hospital review board. The aviremic and viremic patients were treated with HAART within the first 6 mo of infection. The approximate onset of HIV-1 infection was determined by clinical symptoms and the detuned assay (22). Aviremic patients (n = 10) maintained undetectable viral loads, measured using the Amplicor HIV-1 Monitor UltraSensitive Method (Roche) from the initiation of HAART and during up to 72 mo of follow-up. Viremic patients (n = 8) had several viral rebounds (median, 5; range, 4–7) due to interruption/failure of anti–HIV-1 drug treatment. The median CD4 T cell count for the aviremic patients was 671 cells/μl at the time of apheresis. The median viral load of the viremic patients was 45,295 copies/ml and the median CD4 T cell count 485 cells/μl. Patients' characteristics are described (see Table I).
Table I.
Patients' Characteristics
| Patient | HIV RNAa | CD4 countb | HLA-DRB1 | HAARTc | Treatmentd |
|---|---|---|---|---|---|
| Group 1 | |||||
| 12C | <50 | 677 | *0901, *11 | 48 | DdI, D4T EFV |
| 12B | <50 | 667 | *0101, *07 | 60 | D4T, 3TC, RIT |
| 11C | <50 | 1,037 | *0101, *08 | 48 | EFV (DMP 266-06), IND |
| 13C | <50 | 461 | *0401, *11 | 48 | D4T, 3TC, IND |
| 10C | <50 | 789 | *11, *15 | 12 | RIT, IND, Comb (AZT/3TC) |
| 09B | <50 | 400 | *0401, *1501 | 13 | D4T, 3TC, NFV |
| 02B | <50 | 604 | ND | 14 | 3TC, VER, NFV, D4T |
| 03C | <50 | 1,064 | *0401, *07 | 12 | 3TC, AZT, ABC |
| 11B | <50 | 574 | *13, *15 | 12 | Comb (AZT/3TC), NFV |
| 07B | <50 | 443 | *07, *15 | 12 | D4T, 3TC, RIT |
| Group 2 | |||||
| 111 | 45,000 | 420 | *13, *13 | 72 | AZT, 3TC |
| 112 | 30,000 | 529 | *03, *04 | 60 | AZT, 3TC |
| 113 | 65,000 | 606 | *11, *15 | 24 | D4T, 3TC, IND |
| 114 | 40,000 | 406 | *0103, *07 | 60 | D4T, 3TC, IND |
| 115 | 10,000 | 771 | *07, *11 | 60 | 3TC, AZT, EFV |
| 116 | 33,452 | 420 | *14, *14 | 48 | 3TC, AZT, EFV |
| 117 | 65,007 | 344 | *04, *13 | 48 | ND |
| 118 | 73,902 | 386 | ND | 72 | 3TC, AZT, ABC |
Group 1, patients with therapy success and no viral rebounds; Group 2, patients with therapy failure due to several viral rebounds throughout therapy.
Copies of HIV-1 RNA/ml of plasma at the time of study.
Peripheral CD4+ T lymphocyte count at the time of study.
Duration of current regimen (months).
Antiretroviral drug abbreviations: ABC, abacavir; AZT, zidovudine; D4T, savudine; EFV, efavirenz; IND, indinavir; NFV, nelfinavir; 3TC, lamivudine.
CD4+ T Cell Proliferation Assay.
Gag (HXB2) and Nef (BRU) 15-mer peptides were obtained from the National Institutes of Health (NIH) AIDS Research & Reference Reagent Program (Rockville, MD) and the Canvac Core Facility (Montréal, Canada), respectively. Estimated purity of the peptides was >90% as measured by HPLC and mass spectrometry. Individual peptides were diluted in DMSO (Sigma-Aldrich) at 100 mg/ml and stored at −80°C. PBMCs were isolated from peripheral blood or apheresis donor packs by sodium diatrizoate density centrifugation (Amersham Biosciences). Frozen samples were cryopreserved using patients' plasma supplemented with 10% DMSO. Cryopreserved samples were maintained in liquid nitrogen and thawed for use in the proliferation assay. 10–50 × 106 PBMCs were labeled with a predetermined concentration of CFSE (Molecular Probes). The final concentration of CFSE used for PBMC labeling varied between 0.7 and 1.5 μM. Cells were washed twice in PBS and resuspended in RPMI media supplemented with 10% human serum (Sigma-Aldrich). 106/ml CFSE-labeled PBMCs were incubated in 96–deep well plates (Nunc) in the presence of Gag or Nef peptide pools (2 ug/ml/peptide) or 10 μg/ml individual peptides. 1 μg/ml CMV lysate (Biowhittaker) or 50 ng/ml SEA (Toxin Technology) were used as positive controls. Cells were stained with anti-CD4 APC and anti-CD3 PE (Becton Dickinson) after 6 d of in vitro incubation at 37°C, 5% C02. A minimum of 3–5 × 10⁵ events, gated on CD3+ CD4+ viable T lymphocytes, were collected on a FACSCalibur™ dual laser cytometer (Becton Dickinson) and analyzed using FlowJo® software (TreeStar).
Previous reports indicated that CD4+ T cells begin to divide after 36–48 h (23, 24) of stimulation with average doubling time of 18 ± 7.5 h (unpublished data). Based on these numbers, it is possible to estimate that between five to nine divisions occurred during 6 d of in vitro proliferation. Similar estimates of cell division numbers have been reported (25–27). Indeed, by comparing baseline frequencies of CD4+ T cells producing IL-2 to the percentages of peptide-specific CFSElow CD4+ T cells in aviremic HIV-1–infected patients, we were able to estimate that seven to eight divisions of epitope-specific CD4+ T cells occur within the 6-d CFSE test. Therefore, the baseline frequency corresponding to 1% of CFSElow CD4+ T cells after 6 d would range between 0.007 to 0.003% of the total CD3+ CD4+ T cells.
ICS.
Frozen PBMCs were rapidly thawed in complete media and 106 PBMCs were distributed in 96–deep well plates and incubated at 37°C for 2 h before stimulation. PBMCs were stimulated with 10 μg/ml peptides, anti-CD28, and anti-CD49d (1 μg/ml; BD Biosciences) for 12 h. Golgi-stop (Becton Dickinson) was added after 2 h of stimulation. Cells were collected and stained with anti-CD4 PerCP (Becton Dickinson), anti–IFN-γ PE (BD Biosciences), anti–IL-2 FITC (BD Biosciences), and anti-CD69 APC (Becton Dickinson). The six color analysis was performed using the following antibodies: CD4-APC-Cy7 (DakoCytomation), biotinylated CCR7 (Becton Dickinson) followed by streptavidin PE-Cy7 (DakoCytomation), IL-2 PE (Becton Dickinson), IFN-γ APC (BD Biosciences), and CD69 FITC (BD Biosciences). A minimum of 1–3 × 10⁵ events, gated on CD4+ lymphocytes, were collected on LSR dual laser cytometer (Becton Dickinson) and analyzed using FlowJo™ software (TreeStar).
Human Class II Molecular MHC Typing.
HLA typing was performed using conventional genotyping SSP-PCR low/high resolution kits (QIAamp Kit; QIAGEN). In brief, DNA was extracted from blood using the QIAamp 96 blood kit followed by an intermediate resolution SSOP-PCR typing and high resolution SSP-PCR subtyping.
Statistical Analysis.
The exact Mann-Whitney and Spearman correlation statistical tests were performed using Prism V2 software (GraphPad). Differences were considered statistically significant when P ≤ 0.05.
Results
High Proliferative Capacity of HIV-specific CD4+ T Cells in Aviremic Compared with Viremic Patients.
The overall frequency of HIV-specific CD4+ T cells decreases throughout HAART treatment to the point where these cells become undetectable by current assays (17, 28–33). Previous reports have suggested that early treatment leads to the preservation of HIV-specific proliferative CD4+ T cell responses (15, 34–36), although adequate characterization of the memory T cell compartment has not been addressed. To monitor HIV peptide–specific CD4+ T cell responses, we developed a highly sensitive proliferation assay based on the labeling of T cells with the cell tracking dye CFSE. To study the function and the maintenance of HIV-specific memory CD4+ T cells, we initially performed a cross-sectional study on patients who had been infected for up to 6 yr and who had been treated early after infection. Because the CD4 T cell count is usually low in untreated patients, proliferative CD4+ T cell responses were analyzed in aviremic HAART-successful and in viremic HAART-failing patients. Both groups have similar CD4 T cell count but differ primarily by the presence or absence of viral rebounds. The CD4 T cell analysis was performed after an average of 28 and 55.5 mo of HAART, respectively (Table I, Group 1 and Group 2). In aviremic patients, HIV-specific CD4+ T cell responses were analyzed at 48 (Table I, patients 11C, 12C, and 13C) and 60 (Table I, patient 12B) mo after HAART initiation. A matrix (37) of 170 overlapping peptides (15-mer with an 11–amino acid overlap) spanning the entire Gag (122 peptides) and Nef (48 peptides) proteins was generated. PBMCs from HAART-treated aviremic and viremic patients were stimulated with peptide pools (10–12 peptides/pool) and CD4+ T cell proliferation was assessed using the CFSE-based proliferation assay. Single Gag and Nef peptides able to induce the highest percentage of CFSElow CD4+ T cells were selected in every patient. Control experiments in uninfected individuals showed that these peptides did not induce >0.05% of CFSElow cells. Proliferative responses scoring >0.1% of CD3+ CD4+ CFSElow cells were considered positive. We observed major differences in the proliferative capacity of HIV-specific CD4+ T cells from viremic versus aviremic patients (Fig. 1) . For example, although CD4+ T cells from aviremic patients 12C, 12B, and 11C expanded extensively after stimulation with the G067 peptide (20, 5, and 6% CFSElow CD4+ T cells, respectively), PBMCs from viremic patients 111, 112, and 113 barely proliferated in response to this peptide (0.13, 0.12, and 0.26% CFSElow CD4+ T cells, respectively). Assuming that all HIV-specific T cell precursors undergo proliferation at similar rates, the percentages of CFSElow cells approximately reflect baseline frequencies of 0.0005, 0.0005, and 0.001% of G067 responding CD4+ T cells in viremic patients 111, 112, and 113 (Table III and refer to Materials and Methods), respectively, as compared with frequencies of 0.11, 0.05, and 0.07% in aviremic patients 12C, 12B, and 11C, respectively (Table II and refer to Materials and Methods). The reduction in CD4+ T cell proliferative responses in viremic patients is not due to differences in HLA-DR allelic polymorphism between aviremic and viremic patients because the G067 peptide binds 13 different HLA-DR alleles (38). The reduced proliferation of CD4+ T cells in viremic patients was also observed with other Gag peptides such as G054, G008, and G065 (0.23, 0.3, and 0.53%, respectively), whereas PBMCs from aviremic patients maintain the ability to proliferate in response to many Gag peptides such as G076 (8% in patient 12B) or G065 (5% in patients 12C and 11C). Similar results were obtained with Nef peptides with a significant proliferative capacity of CD4+ T cells in aviremic but not viremic patients (Tables II and III). The results were reproduced in additional seven aviremic and five viremic patients as indicated in Fig. 1 b. The median percentage of CFSElow CD4+ T cells in aviremic patients was 9.2% (n = 20; range, 6–20%), whereas the median response in viremic patients was 0.3% (n = 16; range, 0.2–0.5%). Our results indicate that the reduced proliferative response in viremic patients is neither restricted to a single peptide nor to a single HIV protein because reduced HIV-specific proliferative responses were detected with Gag- as well as Nef-derived peptides (Fig. 1 b and Table III). Overall, a 30-fold difference in the proliferative capacity of epitope-specific CD4+ T cells was observed between aviremic and viremic patients. Of note is the fact that the negative impact of HIV viremia on CD4+ T cell proliferation was observed only in HIV-specific T cell responses. Indeed, analysis of CMV- or SEA-specific responses in aviremic and viremic patients failed to show any statistical difference in the frequency of CFSElow cells (P = 0.1 and 0.6, respectively; Fig. 1 b).
Figure 1.

Ability of HIV-specific CD4+ T cells to proliferate in vitro. (a) Comparison between aviremic (12C, 12B, and 11C) and viremic (111, 112, and 113) patients for the ability of CD4+ T cells to proliferate in vitro. PBMCs from aviremic and viremic patients were labeled with CFSE and stimulated for 6 d with the selected Gag peptides G067 (WIILGLNKIVRMYSP), G076 (YKTLRAEQASQEVKN), G065 (PVGEIYKRWIILGLN), G054 (DRVHPVHAGPIAPGQ), and G008 (YKLKHIVWASRELER). The numbers indicated in each quadrant are the percentage of CD3+ CD4+ CFSElow T cells. NS, media stimulation; SEA, staphylococcal enterotoxin. The data are representative of five different experiments. (b) Proliferative response of CFSE-labeled PBMCs from aviremic (•) and viremic (○) patients to HIV, CMV lysate, and SEA antigen. Two peptides (Gag and Nef peptides) were chosen per patient for their ability to induce the highest percentage of CFSElow CD4+ T cells in both aviremic and viremic patients. The sequences of the peptides are listed in Tables II and III. Median percentage of CFSElow HIV-1 CD4+ T cells in aviremic patients is 9.2% (n = 20; range, 6–20%), whereas the median response in viremic patients is 0.3% (n = 16; range, 0.2–0.5%). CMV lysate median CD4+ T cell responses are 11% in aviremic (n = 10; range, 5–30%) and 12.5% in viremic patients (n = 8; range, 5–32%). Median CD4+ T cells responses with SEA stimulation are 50% in aviremic (n = 8; range, 44–60%) and 47.5% in viremic patients (n = 8; range, 40–60%). Statistical significance is determined by the exact Mann-Whitney test.
Table III.
Proliferation and Cytokine Production by HIV Peptide–specific CD4+ T Cells in Viremic Patients
| Patient | Peptide | Sequence | Percent CFSElow CD4+ |
DBLFa | CD69+ IL-2+ | CD69+ IFN-γ1 | IL-2+/IFN-γ1 | IL-2+ | IFN-γ1 |
|---|---|---|---|---|---|---|---|---|---|
| 111 | G054 | DRVHPVHAGPIAPGQ | 0.02 | 0.0008 | <0.01 | 0.40 | <0.01 | <0.01 | 0.35 |
| G067 | WIILGLNKIVRMYSP | 0.1 | 0.0005 | <0.01 | 0.12 | <0.01 | <0.01 | 0.15 | |
| 112 | G008 | YKLKHIVWASRELER | 0.3 | 0.001 | <0.01 | 0.10 | <0.01 | <0.01 | 0.15 |
| G067 | WIILGLNKIVRMYSP | 0.1 | 0.0005 | <0.01 | 0.10 | <0.01 | <0.01 | 0.17 | |
| 113 | G065 | PVGEIYKRWIILGLN | 0.5 | 0.002 | <0.01 | 0.30 | <0.01 | <0.01 | 0.35 |
| G067 | WIILGLNKIVRMYSP | 0.3 | 0.001 | <0.01 | 0.40 | <0.01 | <0.01 | 0.46 | |
| 114 | G053 | AAEWDRVHPVHAGPI | 0.5 | 0.002 | <0.01 | 0.10 | <0.01 | <0.01 | 0.19 |
| G076 | YKTLRAEQASQEVKN | 0.4 | 0.002 | <0.01 | 0.10 | <0.01 | <0.01 | 0.17 | |
| 115 | G067 | WIILGLNKIVRMYSP | 0.4 | 0.002 | <0.01 | 0.20 | <0.01 | <0.01 | 0.21 |
| G061 | STLQEQIGWMTNNPP | 0.2 | 0.0008 | <0.01 | 0.20 | <0.01 | <0.01 | 0.26 | |
| 116 | N048 | LAFHHVARELHPEYF | 0.35 | 0.001 | <0.01 | 0.12 | <0.01 | <0.01 | 0.15 |
| G065 | PVGEIYKRWIILGLN | 0.3 | 0.001 | <0.01 | 0.11 | <0.01 | <0.01 | 0.17 | |
| 117 | G004 | LDRWEKIRLPRGGKK | 0.5 | 0.002 | <0.01 | 0.42 | <0.01 | <0.01 | 0.40 |
| N036 | WCYKLVPVEPDKVEE | 0.4 | 0.002 | <0.01 | 0.31 | <0.01 | <0.01 | 0.30 | |
| 118 | N022 | VDLSHFLKEKGGLEG | 0.4 | 0.002 | <0.01 | 0.20 | <0.01 | <0.01 | 0.23 |
| G057 | PGQMREPRGSDIAGT | 0.2 | 0.0008 | <0.01 | 0.23 | <0.01 | <0.01 | 0.24 | |
| Median | 0.321 | 0.001 | NA | 0.21 | NA | NA | 0.24 |
Values of percent CFSElow CD4+ are the medians of five independent experiments. The percentages of cytokine production were measured after 12 h after stimulation of patients' PBMCs with HIV-specific peptides. The data depicted are the medians of three separate experiments. Values <0.01 indicate undetectable frequencies. NA, not applicable.
DBLF, deduced baseline frequency derived from the 6-d CFSE-based proliferation assay.
Table II.
Proliferation and Cytokine Production by HIV Peptide–specific CD4+ T Cells in Aviremic Patients
| Patient | Peptide | Sequence | PercentCFSElow CD4+ | DBLFa | CD69+ IL-2+ | CD69+ IFN-γ1 | IL-2+/IFN-γ1 | IL-2+ | IFN-γ1 |
|---|---|---|---|---|---|---|---|---|---|
| 12C | G067 | WIILGLNKIVRMYSP | 20 | 0.11 | 0.1 | 0.05 | 0.05 | 0.05 | <0.01 |
| G065 | PVGEIYKRWIILGLN | 15 | 0.08 | 0.07 | 0.03 | 0.03 | 0.04 | <0.01 | |
| 12B | G076 | YKTLRAEQASQEVKN | 8 | 0.05 | 0.05 | 0.02 | 0.02 | 0.03 | 0.03 |
| G067 | VDLSHFLKEKGGLEG | 6 | 0.05 | 0.05 | 0.02 | 0.02 | 0.03 | <0.01 | |
| 11C | G065 | IYKRWIILGLNKIVR | 8 | 0.07 | 0.07 | 0.03 | 0.03 | 0.04 | <0.01 |
| G067 | WIILGLNKIVRMYSP | 7.5 | 0.04 | 0.05 | 0.02 | 0.02 | 0.03 | <0.01 | |
| 13C | G067 | DRVHPVHAGPIAPGQ | 7 | 0.03 | 0.05 | 0.02 | 0.02 | 0.03 | <0.01 |
| N010 | LEKHGAITSSNTAAT | 6.5 | 0.03 | 0.04 | 0.02 | 0.02 | 0.02 | <0.01 | |
| 10C | N012 | SSNTAATNAACAWLE | 7.5 | 0.05 | 0.04 | 0.02 | 0.02 | 0.02 | <0.01 |
| G072 | IRQGPKEPFRDYVDR | 6 | 0.03 | 0.04 | 0.02 | 0.02 | 0.02 | <0.01 | |
| 09B | G057 | PGQMREPRGSDIAGT | 10 | 0.05 | 0.06 | 0.03 | 0.03 | 0.03 | <0.01 |
| G040 | KVVEEKAFSPEVIPM | 7 | 0.03 | 0.05 | 0.02 | 0.02 | 0.03 | <0.01 | |
| 02B | N010 | LEKHGAITSSNTAAT | 9 | 0.05 | 0.06 | 0.03 | 0.03 | 0.03 | <0.01 |
| G055 | PVHGPIAPGQMREP | 7.5 | 0.04 | 0.04 | 0.02 | 0.02 | 0.02 | <0.01 | |
| 03C | N048 | LAFHHVARELHPEYF | 11 | 0.06 | 0.07 | 0.04 | 0.04 | 0.03 | <0.01 |
| G040 | KVVEEKAFSPEVIPM | 6.3 | 0.04 | 0.04 | 0.02 | 0.02 | 0.02 | <0.01 | |
| 11B | G065 | IYKRWIILGLNKIVR | 15 | 0.08 | 0.08 | 0.04 | 0.04 | 0.04 | <0.01 |
| N012 | SSNTAATNAACAWLE | 8 | 0.04 | 0.05 | 0.02 | 0.02 | 0.03 | <0.01 | |
| 07B | N017 | EVGFPVIPQVPLRPM | 12 | 0.06 | 0.07 | 0.04 | 0.04 | 0.03 | <0.01 |
| G057 | PGQMREPRGSDIAGT | 6.7 | 0.03 | 0.04 | 0.02 | 0.02 | 0.02 | <0.01 | |
| Median | 9.2 | 0.051 | 0.056 | 0.026 | 0.026 | 0.029 | NA |
Values of percent CFSElow CD4+ are the medians of five independent experiments. The percentages of cytokine production were measured after 12 h after stimulations of patients' PBMCs with HIV-specific peptides. The data depicted are the medians of three separate experiments. Values <0.01 indicate undetectable frequencies. NA, not applicable.
DBLF, deduced baseline frequency derived from the 6-d CFSE-based proliferation assay.
Altogether, these results demonstrate that HIV-specific CD4+ T cell proliferative response is impaired in patients who are viremic. This is either due to the absence of HIV-specific CD4+ T cells, to the virus-mediated killing of the proliferating cells during the in vitro stimulation, or to intrinsic proliferative defect of these cells. Moreover, the results clearly indicate that CD4+ T cell proliferative responses are maintained in HAART-treated patients even 5 yr after treatment initiation, suggesting that the control of viremia allows the persistence of a pool of long-term HIV-specific CD4+ memory T cells.
High Frequency of HIV-specific CD4+ T Cells Producing IFN-γ in Viremic Patients.
Next, we investigated the cytokine secretion potential of HIV-specific CD4+ T cells in aviremic and viremic patients. As shown in Fig. 2 a, stimulation of PBMCs from aviremic patient 12C with 2 Gag peptides induced the production of both IL-2 (0.1 and 0.07%) and IFN-γ (0.05 and 0.03%). In contrast, stimulation of PBMCs from viremic patient 111 with the same peptides led to the exclusive production of IFN-γ (0.2 and 0.4%; Fig. 2 b). Analysis of intracellular IL-2 and IFN-γ production in ten aviremic and eight viremic patients demonstrates that HIV-specific CD4+ T cells secreting IL-2 are only detected in aviremic patients (median, 0.05%; range, 0.1–0.04; Fig. 2 c and Table II). HIV-specific responses in all aviremic patients included CD4+ T cells producing either IL-2 alone (median, 0.03%; range, 0.02–0.05) or both IL-2 and IFN-γ (median, 0.03%; range, 0.02–0.05; Table II). Interestingly, we could not detect a subset of cells producing only IFN-γ in most of the aviremic patients (Table II). This is in sharp contrast to the cytokine production capacity of CD4+ T cells from viremic patients that secrete exclusively IFN-γ (median, 0.2%; range, 0.1–0.4; Fig. 2 C and Table III).
Figure 2.

Four-parameter FACS® analysis of epitope-specific CD4+ T cells in aviremic and viremic patients. (a and b) Detection of epitope-specific CD4+ T cells by intracellular IL-2 and IFN-γ staining of PBMCs from aviremic (12C) and viremic (111) patients. PBMCs were stimulated with 10 μg/ml of the indicated peptides or 200 ng/ml SEA, or unstimulated (NS) for 12 h in the presence of Brefeldin A. Numbers in each quadrant represent the frequency of CD69+ cytokine+. (c) Frequency of CD69+ IL-2+ HIV-specific CD4+ T cells (○) or CD69+ IFN-γ+ (•) after 12 h of peptide stimulation of PBMCs from aviremic and viremic patients. Single epitope responses (two per patient) are depicted. Data are derived from Tables II and III. Statistical significance is determined by the exact Mann-Whitney test. 5 × 10⁴–105 CD4+ T cell gated events are shown. Data are representative of three different experiments.
These data demonstrate that the reduction of proliferative responses in viremic patients is not due to the absence of HIV-specific CD4+ T cells because high frequencies of IFN-γ–producing CD4+ T cells were detected by ICS after stimulation with HIV peptides. Our results also show that upon viral control, HIV-specific IFN-γ+ IL-2− CD4+ T cells are not detected in aviremic HAART-successful patients. Rather, cells producing IL-2 or both IL-2 and IFN-γ are detected even several years after the infection.
IL-2 Restores the Proliferation of HIV-specific IFN-γ+ IL-2− CD4+ T Cells.
The results illustrated in Fig. 2 clearly show the significant differences in cytokine production patterns observed between viremic and aviremic patients. Taken together these results and those illustrated in Fig. 1 suggest that the inability to produce IL-2 might be responsible for the absence of proliferative responses in viremic patients. Supporting this hypothesis, a strong positive correlation was observed (P < 0.0001, R = 0.81, n = 20) between the baseline frequencies of Gag and Nef peptide–specific CD4+ T cells, as measured by the ability to produce IL-2 and the percentage of CFSElow epitope–specific CD4+ T cells in aviremic patients after in vitro stimulation (Fig. 3 a). Because HIV-specific CD4+ T cells in aviremic patients produce both IL-2 and IFN-γ when stimulated with the indicated peptides, a positive correlation (P < 0.0001, R = 0.86) was also generated when plotting together frequencies of IFN-γ–secreting CD4+ T cells and of CFSElow cells generated after in vitro peptide stimulations (Fig. 3 b). This is in contrast to IFN-γ+ CD4+ T cells in viremic patients where no correlation was found (P = 0.4) between the frequency of HIV-specific IFN-γ–producing cells at baseline and the proliferative response after 6 d. The absence of correlation is most likely due to lack of IL-2 production by HIV-specific CD4+ T cells from viremic patients.
Figure 3.

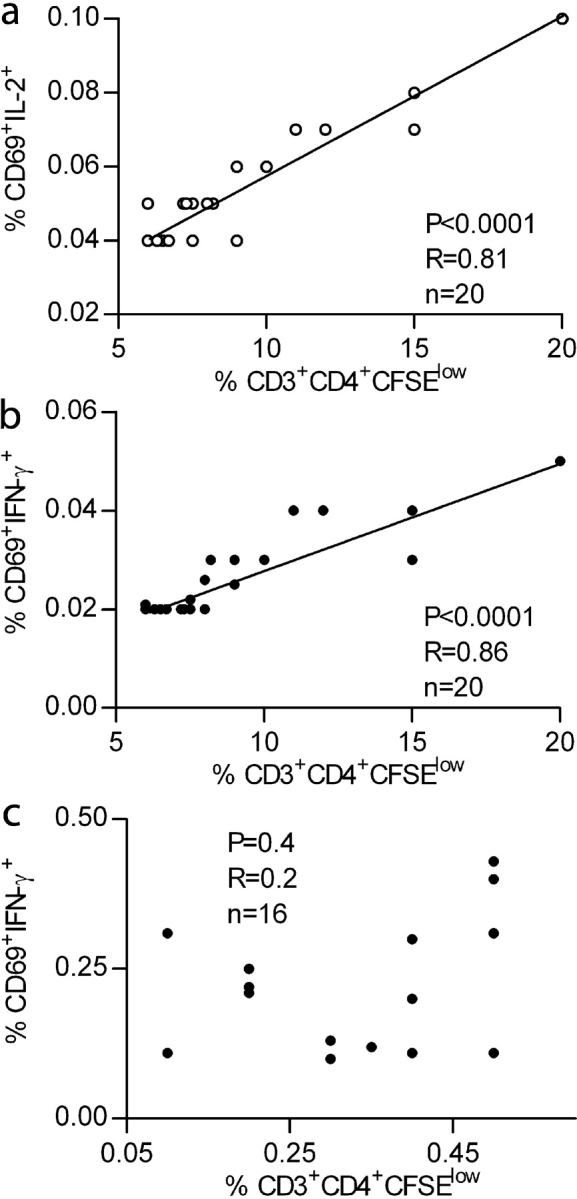
Correlation between the frequency of HIV-1 epitope-specific CD4+ T cells monitored by IL-2 (○) or IFN-γ cytokine (•) deleted after 12 h and the frequency of CFSElow CD4+ T cells after 6-d in vitro proliferation in aviremic (a and b) and viremic (c) patients. Statistical significance of each correlation was calculated using Spearman test. (d) IL-2 restores the proliferation of IFN-γ+ IL-2− HIV-specific CD4+ T cells. PBMCs from viremic patients (111, 112, and 113) were labeled with CFSE and stimulated for 6 d using a pool of HIV-specific peptides (10 overlapping peptides spanning the entire immunodominant region GSDIAGTTSTLQEQIGWMTNNPPIPVGEIYKRWIILGLNKIVRMYSPTSIL) with or without 10 U/ml of IL-2. The numbers in each quadrant represent percentages of dividing T cells. 2–3 × 10⁴ events gated on live CD3+ CD4+ lymphocytes were collected and analyzed.
To test if the presence of IL-2 could restore the proliferation of these cells, we stimulated CD4+ T cells from viremic patients (111, 112, and 113) with a pool of peptides containing the G067 peptide, which gave strong IFN-γ responses in these three patients (Table III), in the presence of exogenous IL-2. As illustrated in Fig. 3 d, the addition of IL-2 during the in vitro peptide stimulation dramatically increased the fraction of proliferating cells. Comparison of the percentage of CFSElow cells induced by IL-2 alone versus peptides plus IL-2 demonstrated that although IL-2 alone induced some CD4+ T cell proliferation nonspecifically, it definitely restored the proliferation of peptide-specific CD4+ T cells from viremic patients. This experiment strongly suggests that the impaired proliferation of CD4+ T cells from viremic patients is not caused by a virus-mediated destruction of proliferating cells.
These results indicate that HIV-specific IL-2 and IL-2/IFN-γ CD4+ T cells have the capacity to proliferate in response to antigen, whereas IFN-γ+ IL-2− HIV-specific CD4+ T cells, found mostly in viremic patients, have a diminished ability to divide that can be restored by exogenous IL-2. Collectively, the data presented in Figs. 1, 2, and 3 demonstrate that the lack of HIV-specific CD4+ T cell proliferation in viremic patients is caused neither by the absence of HIV-specific cells nor by their virus-mediated killing, but rather by their inability to produce IL-2.
HIV-specific CD4+ T Cells with a Central Memory Phenotype Are Detected Exclusively in Aviremic Patients.
Next, we investigated to what extent the difference in the cytokine expression profile of CD4+ T cells from viremic and aviremic patients could be explained by the fact that these cells are at distinct stages of effector/memory differentiation. It is now well established that expression of CD45RA and CCR7 defines T cell subsets endowed with distinct proliferative capacities and cytokine production profiles (21, 39). To assess the impact of viremia on the differentiation state of HIV-specific memory CD4+ T cells, we analyzed their phenotype in three aviremic (12C, 12B, and 11C) and three viremic (111, 112, and 113) patients after in vitro stimulation with the G067 peptide. Frequencies of CD69+ IL-2+ or CD69+ IFN-γ+ CD4+ T cells were quantified in the different subsets using a six color flow cytometry assay. Fig. 4 a shows a representative distribution of IL-2+ and IFN-γ+ CD4+ T cells among the CD4+ T cell subsets from an aviremic (12C) and a viremic (111) patient. Analysis of cytokine production in patient 12C showed that IL-2–producing cells are found in both the CD45RA− CCR7+ (0.06%) and CD45RA− CCR7− (0.1%) subsets. In the viremic patient 111, none of the memory T cell subsets was able to produce IL-2 upon peptide stimulation (as expected from results presented in Figs. 1 and 2), whereas the majority of IFN-γ–secreting cells had an effector memory (CD45RA− CCR7−) phenotype (0.2%). These results were reproduced in an additional two aviremic (12B and 11C) and two viremic patients (112 and 113). Similar results were also obtained with other HIV peptides (G065, G076, G054, and G008; not depicted).
Figure 4.


Six color FACS® analysis of HIV-specific CD4+ T cells in aviremic and viremic patients. (a) Representative pseudo color plots of phenotypic analysis of G067-specific CD4+ T cells in PBMCs from aviremic (12C) and viremic (111) patients. Numbers above 0.01% in each plot were considered positive. Patients' PBMCs were stimulated with G067 peptide for 12 h in the presence of Brefeldin A and stained with biotinylated anti-CCR7 followed by streptavidin PE-Cy7, anti-CD4 APC-Cy7. Anti–IL-2 PE, anti–IFN-γ APC, and anti-CD69 FITC were added after fixation/permeabilization of the cells. 3 × 10⁵ gated CD4+ T cell events are shown. (b) Schematic representation of IL-2+ and/or IFN-γ+ CD4+ T cell distributions and the expression of CCR7/CD45RA in three aviremic and three viremic patients after stimulation with G067 peptide. Data are representative of three different experiments.
These results do not exclude an overlap in the differentiation state of IL-2–producing and nonproducing cells found in the aviremic and viremic patients, respectively. One possibility is that the latter belong to the Tem subset but that their ability to produce IL-2 is impaired by their persistent interaction with antigen.
HIV-specific IL-2–secreting CD4+ T Cells in Aviremic Patients Stably Persist during the Course of HIV Infection.
Next, we evaluated in a longitudinal analysis the impact of HIV viremia on the establishment/maintenance of HIV-specific memory CD4+ T cells. To carry out a longitudinal analysis we selected highly conserved epitopes. Based on the Los Alamos database (http://hiv-web.lanl.gov) and on other studies (38, 40), sequence alignment of the G065-G067 Gag region revealed that this sequence is highly conserved in 208 HIV-1 strains of different clades, a characteristic that validates the use of G065 and G067 peptides (94% conservation in 37 clade B strains and 85% in total HIV-1 strains). Fig. 5 illustrates the frequency of HIV-specific CD4+ T cells detected by IL-2 and IFN-γ at different time points of infection in three aviremic and three viremic patients. Aviremic patients 12C, 12B, and 11C maintained low viral load (<50 copies/ml) from the initiation of HAART until the most recent time points (i.e., 48 and 60 mo after HAART initiation). As shown in Fig. 5 a, significant and reproducible frequencies of IL-2+ and IL-2+/IFN-γ+ HIV-specific CD4+ T cells were detected after stimulation of PBMCs from these patients with the G067 peptide. The overall frequency of IL-2+ and IL-2+/IFN-γ+ G067-specific CD4+ T cells remained stable for up to 5 yr in patients 12C, 12B, and 11C (Fig. 5 a). Similar results were obtained with G065- and G076-specific CD4+ T cells (Fig. 5 a, right).
Figure 5.
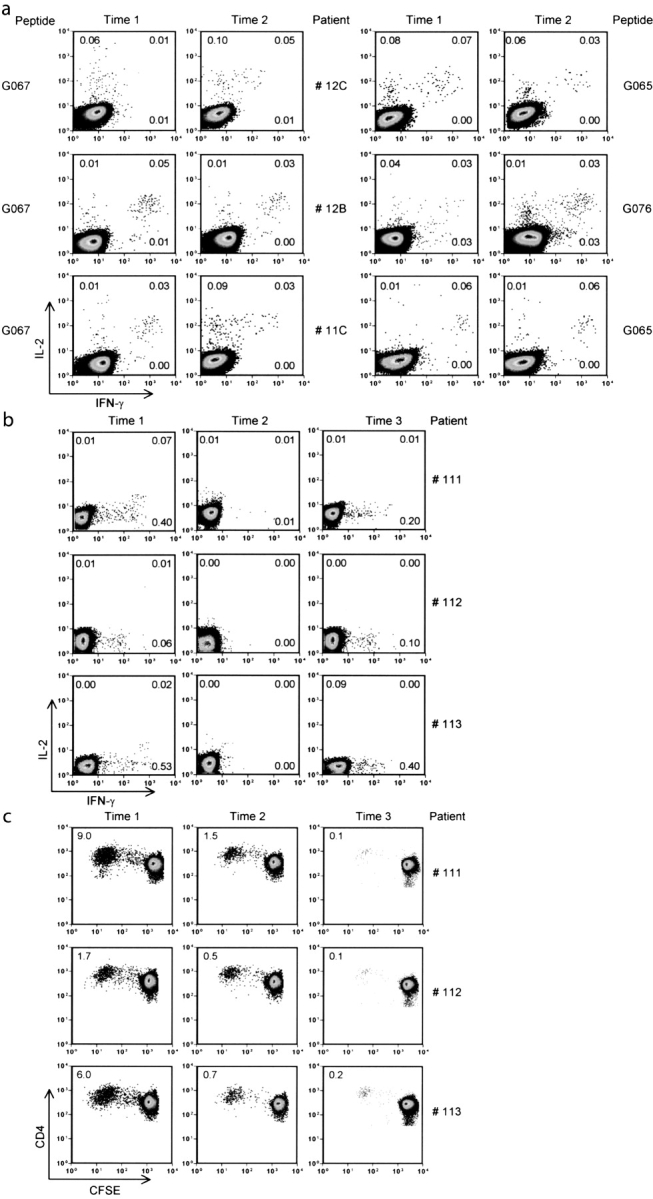
Longitudinal analysis of epitope-specific CD4+ T cells in three aviremic (11C, 12C, and 13 C) and three viremic (111, 112, and 113) patients by intracellular IL-2 and IFN-γ staining and a CFSE-based proliferation assay. (a) Pseudo color plots from aviremic patients stimulated with G067 peptide or G065 and G076 peptide showing the detection of IL-2/IFN-γ and IL-2 1 yr (Time 1) and 4–5 yr (Time 2) after HAART initiation. (b) Pseudo color plots showing the frequency of G067-specific CD4+ T cells from viremic patients by IL-2/IFN-γ ICS at time points before therapy (Time 1), 1 yr (Time 2), and 6 yr (Time 3) after therapy initiation. Numbers in each quadrant represent the percentage of IL-2– and/or IFN-γ–producing CD4+ T cells after stimulation with G067 peptide. Data are representative of three different experiments. Media stimulation was ≤0.01% in all experiments. Between 5 × 10⁴ and 2 × 10⁵ events, gated on CD4+ T cells, were collected and analyzed. (c) Pseudo color plots showing the proliferative responses of G067-specific CD4+ T cells at the same time points as in b. 2–5 × 10⁴ gated CD3+ CD4+ T cells were collected after 6-d in vitro incubation and analyzed.
Longitudinal analysis of PBMCs from viremic therapy-failing patients (111, 112, and 113) showed a very different pattern. As illustrated in Fig. 5 b, frequencies of G067-specific IFN-γ CD4+ T cells predominate over IL-2 CD4+ T cells before HAART initiation (viral load >75,000 copies/ml, time point 1). However, cytokine-secreting cells were not found 1 yr after therapy initiation, at time points when viremia was <1,000 copies/ml, in the three therapy-failing patients (Fig. 5 b, middle, time point 2). It is important to note that between time points 1 and 2, a median of two viral rebounds were observed in the plasma of the three viremic patients analyzed. 5–6 yr after HAART initiation, when viremia levels were >30,000 copies/ml, we could again detect G067-specific CD4+ T cells secreting exclusively IFN-γ (Fig. 5 b, right). It appears that the presence of IFN-γ+/IL-2− HIV-specific CD4 T cells is restricted to time points of high viremia in therapy-failing patients.
Proliferation of G067-specific CD4+ T cells was measured (Fig. 5 c) at the same time points as in Fig. 5 b. In therapy-failing patients 111, 112, and 113, G067-specific CD4+ T cells were detected before HAART initiation, as illustrated by the significant percentages of CFSElow cells at this time point (9, 2, and 6%, respectively; Fig. 5 c, left). Interestingly, in the two patients (111 and 113) showing the highest percentages of CFSElow CD4+ T cells (9 and 6%, respectively), we could detect significant levels of IL-2–secreting cells by direct ex vivo ICS (Fig. 5, b and c, time point 1). It is important to note that despite the fact that we could observe CD4+ T cell proliferation at the two later time points, the level of IL-2–producing cells was too low to be detectable by ICS, demonstrating the sensitivity of the CFSE-based proliferation assay. At later time points (more than 1 yr after therapy initiation), G067-specific CD4+ T cells barely proliferated (average of 1.5% of CFSElow cells; Fig. 5 c, middle). This was particularly evident after 6 yr of therapy, when the average proliferative response was ∼0.1%.
Together, these results indicate that in the course of the infection, HIV viral persistence lowers the frequency of IL-2–producing HIV-specific CD4+ T cells that possess a high proliferative potential. Our results indicate that IL-2 production by HIV-specific CD4+ T cells is associated with the persistence of a stable T cell memory compartment for up to 5 yr. Moreover, it appears that IL-2− IFN-γ+ HIV-specific CD4+ T cells are short-lived effector T cells.
Discussion
In this report we show that chronic viremia has a major impact on the maintenance of antigen-specific memory T cells endowed with proliferative and IL-2 secretion capacities. Cross-sectional and longitudinal analyses clearly showed that peptide-specific CD4+ T cell responses leading to proliferation and IL-2 production were affected in viremic patients. In contrast, a pool of CD4+ memory T cells, known to possess expansion potential, stably persists in aviremic patients for up to 5 yr.
Previous studies reported a low frequency of antigen-specific CD4+ T cells in HAART-treated patients (17, 28–33). Our data contradict this notion because we have been able to reproducibly detect frequencies of up to 0.1% of HIV-specific CD4+ T cells. Two major factors could account for this difference. First, our study population mostly included patients who had been treated early during HIV infection. As reported (15, 35, 36), it is likely that early treatment prevents the depletion of HIV-specific CD4+ T cells mediated by a direct cytopathic effect of the virus or through chronic hyperimmune activation. Moreover, exogenous loading of single peptides circumvents problems related to competition for MHC class II binding that can be encountered when using peptide pools and to inefficient protein processing and peptide presentation when using intact proteins on frozen PBMCs. In fact, we have observed that the sum of the proliferative responses of individual peptide stimulations (i.e., the percentages of CFSElow CD4+ T cells) was consistently higher than the responses obtained with Gag protein or with Gag and Nef peptide pools (unpublished data). Indeed, we believe that our experimental strategy has allowed us to overcome a major sensitivity barrier encountered in other assays. We estimate the proliferation assay described here to be 100–1,000-fold more sensitive than other currently used assays such as direct ex vivo ICS assays or MHC class II tetramers staining.
In aviremic patients, we established a positive correlation (P < 0.0001; R = 0.81) between the frequency of HIV-specific CD4+ T cells secreting IL-2 and the CD4+ T cell proliferative responses. By contrast, there was no correlation (P = 0.4) between the percentages of HIV-specific, IFN-γ+ IL-2− CD4+ T cells and the level of virus-specific proliferation in viremic patients. Thus, our data corroborate previously published studies showing discrepancies between the frequency of HIV-specific CD4+ T cells, as detected by IFN-γ ICS, and the proliferative responses of HIV-specific CD4+ T cells in viremic patients (18–20). Our findings strongly support the view that the reduction in HIV-specific lymphoproliferation in subjects with active viral replication is not due to the absence of HIV-specific CD4+ T cells, but rather to their proliferative “dysfunction,” caused by an inability to produce IL-2. Indeed, the addition of IL-2 to these cells restored their proliferative capacity (Fig. 3 d), which is abrogated in the presence of high viremia. Interestingly, IL-2–mediated rescue of nonproliferating HIV-specific CD4+ T cells has been observed in another cohort of viremic patients (41), indicating that this phenomenon is not restricted to the patients studied here. Although IL-2 could restore the proliferative potential of IFN-γ+ IL-2− CD4+ T cells, results presented in Fig. 5 b strongly suggest that these cells do not persist for a prolonged period of time in viremic patients. In fact, HIV-specific IFN-γ+ IL-2− CD4+ T cells are detected in the peripheral blood of viremic patients only at time points when the viral load is elevated. Although we cannot exclude the possibility that IFN-γ–producing cells might reside in peripheral tissues (44) and recirculate through the blood only when viremia increases, it is more likely that these cells are short lived and fail to stably persist as long-term memory T cells.
The association of persistent exposure to high viral loads with the disappearance of antigen-specific IL-2–producing T cells has also been observed in a murine model. Fuller and Zajac (42) recently showed that the frequency of lymphocytic choriomeningitis virus (LCMV)-specific CD4+ T cells producing IL-2 gradually decreased to undetectable levels in mice chronically exposed to high viral loads, but not in acutely infected mice. Similarly, LCMV-specific, TCR transgenic CD4+ T cells transferred to chronically infected mice gradually lost the ability to secrete IL-2, to proliferate, and to mediate B cell help (43). Importantly, transfer of these cells into naive, antigen-free mice did not restore their proliferative and IL-2 secretion ability, strongly suggesting that this state of “unresponsiveness” does not depend on the continued presence of virus, but rather reflects intrinsic functional properties of the cells due to previous exposure to high antigenemia (43).
A major finding of our study is that HIV-specific CD4+ T cells having a central memory phenotype (CD45RA− CCR7+) and secreting IL-2 are found in aviremic but not viremic patients. A current model of memory T cell differentiation predicts that persistent antigenic stimulation prevents the establishment of a stable pool of functional long-term memory cells (46). The proposed mechanism was blocking, by persistent antigenic stimulation, of the differentiation of effectors into long-lived memory cells of the Tcm phenotype (46). An interpretation of our results according to this model is illustrated in Fig. 6 a. Alternatively, the “balance of growth and differentiation” model (47) would suggest that activation of HIV-specific naive cells, or of a small number of competent memory cells that are sustained by self-renewal, frequently occurs, but that HIV antigenemia in the therapy-failing patients rapidly induces differentiation of the activated cells into short-lived effector cells (Fig. 6 b) after a burst of proliferation (48). It is even possible that significant numbers of IL-2–producing memory cells (Tcm and Tem) exist in viremic patients but are rendered unresponsive through chronic stimulation-mediated tuning of activation thresholds (48). According to the results of our longitudinal study (Fig. 5), only viral loads that exceed a certain threshold might break this unresponsiveness, inducing proliferation/differentiation bursts that end up in IFN-γ only–producing cells. Similarly, some of the IFN-γ only–producing cells may regain capacity for IL-2 production after the viral load is sufficiently reduced.
Figure 6.

Alternative differentiation schemes describing the impact of HIV viremia on the size of memory/effector CD4+ T cell pools. (a) According to an extension of a general differentiation scheme proposed for CD8 T cells by Kaech et al. (reference 46), HIV-specific central memory CD4+ T cells (Tcm) are derived in aviremic patients from effectors (Tem1) elicited during the acute phase of the infection. Transient activation episodes and IL-2 production–dependent self-renewal would facilitate maintenance of a stable steady state of this memory pool, in equilibrium with the Tem1 pool, after viremia has been controlled. When viremia persists, naive CD4+ T cells are constantly recruited and differentiate into effectors (Tem1). Constant antigenic stimulation prevents the differentiation of these effectors into Tcm. Instead, they differentiate into more differentiated cells, Tem2, which lack the capacity to produce IL-2 and to self-renew, but are able to produce IFN-γ. (b) Alternatively, the order of differentiation is always from naive to Tcm to Tem, as proposed by Lanzavecchia and Sallusto (reference 45). In aviremic patients, Tcm and Tem1 are maintained, as in the other model, by self-renewal and occasional activation and differentiation events (limited ongoing division counters the slow rate of death in the population). In the viremic patients, activation of HIV-specific naive and resting memory cells is enhanced, but according to the “balance of growth and differentiation” model (see Discussion), accumulation of Tcm and Tem1 memory cells through self-renewal division is prohibited because these proliferating cells are preferentially induced to differentiate into the IFN-γ only–producing Tem2 cells. The relative rates of self-renewal and differentiation are crudely reflected in the figure by the thickness of the arrows representing cellular flow. The relative size of the different pools is indicated by the size of the circles representing these pools.
Alternatively, the absence of HIV-specific Tcm in viremic patients could be explained by the fact that these cells are highly susceptible to HIV-1 infection and might ultimately be deleted by virus-mediated killing. Although this possibility cannot be excluded, it should be noted that exhaustion of IL-2–secreting CD4+ T cells was also observed in a non-CD4+ T cell tropic infection such as LCMV, suggesting that chronic stimulation rather than virus-mediated killing leads to the decline of IL-2+ HIV-specific CD4+ T cells.
We have observed that the cytokine secretion profile of CD4+ T cells with an effector memory phenotype (CD45RA− CCR7−) differs between viremic and aviremic patients (Fig. 4). CD4+ CD45RA− CCR7− T cells from both aviremic and viremic patients produced IFN-γ, but only cells from aviremic patients maintained the ability to secrete IL-2. These results suggest that viral persistence not only impedes the establishment/maintenance of central memory CD4 T cells, but also alters the IL-2 production capacity of effector memory cells.
The incapacity of HIV-specific CD4+ T cells to produce IL-2 probably may limit their ability to express T cell help functions and may in particular affect anti-HIV CD8 T cell–mediated responses. Defects in the differentiation of HIV-specific CD8+ T cells during HIV chronic infection have been reported (39, 49) and this might be partly due to lack of HIV-specific IL-2–secreting CD4+ T cells. This is supported by the recent finding that administration of IL-2 in chronically LCMV-infected mice rescued CD8+ T cell function and induced protection (50). The continuous antigen-driven differentiation of proliferation-competent, IL-2–secreting, HIV-specific CD4+ T cells into IFN-γ only–producing cells with impaired proliferative and helper ability might be either a mechanism of viral evasion from immune control or merely a “normal” manifestation of chronic immune activation.
Acknowledgments
We thank R. Cheynier, D. Weiner, E. Haddad, and L. Cohen for critical review of the manuscript. We acknowledge the invaluable help of M. Connors, C. Estrela, and L. Kalfayan.
This work was supported by NIH, Canadian Institutes of Health Research (CIHR), Fonds de la Recherche en Santé du Québec (FRSQ), Genome Canada, and Canvac grants awarded to R.-P. Sékaly. R.-P. Sékaly is the Canada Research chair in Human Immunology. A.R. Dumont holds a CIHR Doctoral Research Award. This work was supported in part by a grant from Valorisation Recherche Québec. J.-P. Routy is a scientific scholar receiving support from the FRSQ.
Abbreviations used in this paper: CFSE, 5-(and-6)-carboxyfluorescein diacetate-succinimidyl ester; HAART, highly active antiretroviral therapy; ICS, intracellular cytokine staining; LCMV, lymphocytic choriomeningitis virus; SIV, simian immunodeficiency virus; Tcm, central memory CD4+ T cell(s); Tem, effector memory CD4+ T cell(s).
References
- 1.Douek, D.C., L.J. Picker, and R.A. Koup. 2003. T cell dynamics in HIV-1 infection. Annu. Rev. Immunol. 21:265–304. [DOI] [PubMed] [Google Scholar]
- 2.Pope, M., and A.T. Haase. 2003. Transmission, acute HIV-1 infection and the quest for strategies to prevent infection. Nat. Med. 9:847–852. [DOI] [PubMed] [Google Scholar]
- 3.Grossman, Z., M. Meier-Schellersheim, A.E. Sousa, R.M. Victorino, and W.E. Paul. 2002. CD4+ T-cell depletion in HIV infection: are we closer to understanding the cause? Nat. Med. 8:319–323. [DOI] [PubMed] [Google Scholar]
- 4.Mohri, H., A.S. Perelson, K. Tung, R.M. Ribeiro, B. Ramratnam, M. Markowitz, R. Kost, A. Hurley, L. Weinberger, D. Cesar, et al. 2001. Increased turnover of T lymphocytes in HIV-1 infection and its reduction by antiretroviral therapy. J. Exp. Med. 194:1277–1287. [DOI] [PMC free article] [PubMed] [Google Scholar]
- 5.Kovacs, J.A., R.A. Lempicki, I.A. Sidorov, J.W. Adelsberger, B. Herpin, J.A. Metcalf, I. Sereti, M.A. Polis, R.T. Davey, J. Tavel, et al. 2001. Identification of dynamically distinct subpopulations of T lymphocytes that are differentially affected by HIV. J. Exp. Med. 194:1731–1741. [DOI] [PMC free article] [PubMed] [Google Scholar]
- 6.Mohri, H., S. Bonhoeffer, S. Monard, A.S. Perelson, and D.D. Ho. 1998. Rapid turnover of T lymphocytes in SIV-infected rhesus macaques. Science. 279:1223–1227. [DOI] [PubMed] [Google Scholar]
- 7.Rosenzweig, M., M.A. DeMaria, D.M. Harper, S. Friedrich, R.K. Jain, and R.P. Johnson. 1998. Increased rates of CD4(+) and CD8(+) T lymphocyte turnover in simian immunodeficiency virus-infected macaques. Proc. Natl. Acad. Sci. USA. 95:6388–6393. [DOI] [PMC free article] [PubMed] [Google Scholar]
- 8.Silvestri, G., D.L. Sodora, R.A. Koup, M. Paiardini, S.P. O'Neil, H.M. McClure, S.I. Staprans, and M.B. Feinberg. 2003. Nonpathogenic SIV infection of sooty mangabeys is characterized by limited bystander immunopathology despite chronic high-level viremia. Immunity. 18:441–452. [DOI] [PubMed] [Google Scholar]
- 9.Sousa, A.E., J. Carneiro, M. Meier-Schellersheim, Z. Grossman, and R.M. Victorino. 2002. CD4 T cell depletion is linked directly to immune activation in the pathogenesis of HIV-1 and HIV-2 but only indirectly to the viral load. J. Immunol. 169:3400–3406. [DOI] [PubMed] [Google Scholar]
- 10.Kalams, S.A., and B.D. Walker. 1998. The critical need for CD4 help in maintaining effective cytotoxic T lymphocyte responses. J. Exp. Med. 188:2199–2204. [DOI] [PMC free article] [PubMed] [Google Scholar]
- 11.Bourgeois, C., B. Rocha, and C. Tanchot. 2002. A role for CD40 expression on CD8+ T cells in the generation of CD8+ T cell memory. Science. 297:2060–2063. [DOI] [PubMed] [Google Scholar]
- 12.Bennett, S.R., F.R. Carbone, F. Karamalis, R.A. Flavell, J.F. Miller, and W.R. Heath. 1998. Help for cytotoxic-T-cell responses is mediated by CD40 signalling. Nature. 393:478–480. [DOI] [PubMed] [Google Scholar]
- 13.Ridge, J.P., F. Di Rosa, and P. Matzinger. 1998. A conditioned dendritic cell can be a temporal bridge between a CD4+ T-helper and a T-killer cell. Nature. 393:474–478. [DOI] [PubMed] [Google Scholar]
- 14.Schoenberger, S.P., R.E. Toes, E.I. van der Voort, R. Offringa, and C.J. Melief. 1998. T-cell help for cytotoxic T lymphocytes is mediated by CD40-CD40L interactions. Nature. 393:480–483. [DOI] [PubMed] [Google Scholar]
- 15.Rosenberg, E.S., J.M. Billingsley, A.M. Caliendo, S.L. Boswell, P.E. Sax, S.A. Kalams, and B.D. Walker. 1997. Vigorous HIV-1-specific CD4+ T cell responses associated with control of viremia. Science. 278:1447–1450. [DOI] [PubMed] [Google Scholar]
- 16.Douek, D.C., J.M. Brenchley, M.R. Betts, D.R. Ambrozak, B.J. Hill, Y. Okamoto, J.P. Casazza, J. Kuruppu, K. Kunstman, S. Wolinsky, et al. 2002. HIV preferentially infects HIV-specific CD4+ T cells. Nature. 417:95–98. [DOI] [PubMed] [Google Scholar]
- 17.Pitcher, C.J., C. Quittner, D.M. Peterson, M. Connors, R.A. Koup, V.C. Maino, and L.J. Picker. 1999. HIV-1-specific CD4+ T cells are detectable in most individuals with active HIV-1 infection, but decline with prolonged viral suppression. Nat. Med. 5:518–525. [DOI] [PubMed] [Google Scholar]
- 18.McNeil, A.C., W.L. Shupert, C.A. Iyasere, C.W. Hallahan, J.A. Mican, R.T. Davey, and M. Connors. 2001. High-level HIV-1 viremia suppresses viral antigen-specific CD4(+) T cell proliferation. Proc. Natl. Acad. Sci. USA. 98:13878–13883. [DOI] [PMC free article] [PubMed] [Google Scholar]
- 19.Palmer, B.E., E. Boritz, N. Blyveis, and C.C. Wilson. 2002. Discordance between frequency of human immunodeficiency virus type 1 (HIV-1)-specific gamma interferon-producing CD4(+) T cells and HIV-1-specific lymphoproliferation in HIV-1-infected subjects with active viral replication. J. Virol. 76:5925–5936. [DOI] [PMC free article] [PubMed] [Google Scholar]
- 20.Wilson, J.D., N. Imami, A. Watkins, J. Gill, P. Hay, B. Gazzard, M. Westby, and F.M. Gotch. 2000. Loss of CD4+ T cell proliferative ability but not loss of human immunodeficiency virus type 1 specificity equates with progression to disease. J. Infect. Dis. 182:792–798. [DOI] [PubMed] [Google Scholar]
- 21.Sallusto, F., D. Lenig, R. Forster, M. Lipp, and A. Lanzavecchia. 1999. Two subsets of memory T lymphocytes with distinct homing potentials and effector functions. Nature. 401:708–712. [DOI] [PubMed] [Google Scholar]
- 22.Machado, D.M., E.L. Delwart, R.S. Diaz, C.F. de Oliveira, K. Alves, B.D. Rawal, M. Sullivan, M. Gwinn, K.A. Clark, and M.P. Busch. 2002. Use of the sensitive/less-sensitive (detuned) EIA strategy for targeting genetic analysis of HIV-1 to recently infected blood donors. AIDS. 16:113–119. [DOI] [PubMed] [Google Scholar]
- 23.Rogers, P.R., C. Dubey, and S.L. Swain. 2000. Qualitative changes accompany memory T cell generation: faster, more effective responses at lower doses of antigen. J. Immunol. 164:2338–2346. [DOI] [PubMed] [Google Scholar]
- 24.London, C.A., M.P. Lodge, and A.K. Abbas. 2000. Functional responses and costimulator dependence of memory CD4+ T cells. J. Immunol. 164:265–272. [DOI] [PubMed] [Google Scholar]
- 25.Novak, E.J., S.A. Masewicz, A.W. Liu, A. Lernmark, W.W. Kwok, and G.T. Nepom. 2001. Activated human epitope-specific T cells identified by class II tetramers reside within a CD4high, proliferating subset. Int. Immunol. 13:799–806. [DOI] [PubMed] [Google Scholar]
- 26.Gudmundsdottir, H., A.D. Wells, and L.A. Turka. 1999. Dynamics and requirements of T cell clonal expansion in vivo at the single-cell level: effector function is linked to proliferative capacity. J. Immunol. 162:5212–5223. [PubMed] [Google Scholar]
- 27.Danke, N.A., and W.W. Kwok. 2003. HLA class II-restricted CD4(+) T cell responses directed against influenza viral antigens postinfluenza vaccination. J. Immunol. 171:3163–3169. [DOI] [PubMed] [Google Scholar]
- 28.Pontesilli, O., S. Kerkhof-Garde, N.G. Pakker, D.W. Notermans, M.T. Roos, M.R. Klein, S.A. Danner, and F. Miedema. 1999. Antigen-specific T-lymphocyte proliferative responses during highly active antiretroviral therapy (HAART) of HIV-1 infection. Immunol. Lett. 66:213–217. [DOI] [PubMed] [Google Scholar]
- 29.Binley, J.M., D.S. Schiller, G.M. Ortiz, A. Hurley, D.F. Nixon, M.M. Markowitz, and J.P. Moore. 2000. The relationship between T cell proliferative responses and plasma viremia during treatment of human immunodeficiency virus type 1 infection with combination antiretroviral therapy. J. Infect. Dis. 181:1249–1263. [DOI] [PubMed] [Google Scholar]
- 30.Valentine, F.T., A. Paolino, A. Saito, and R.S. Holzman. 1998. Lymphocyte-proliferative responses to HIV antigens as a potential measure of immunological reconstitution in HIV disease. AIDS Res. Hum. Retroviruses. 14:S161–S166. [PubMed] [Google Scholar]
- 31.Plana, M., F. Garcia, T. Gallart, J.M. Miro, and J.M. Gatell. 1998. Lack of T-cell proliferative response to HIV-1 antigens after 1 year of highly active antiretroviral treatment in early HIV-1 disease. Immunology Study Group of Spanish EARTH-1 Study. Lancet. 352:1194–1195. [DOI] [PubMed] [Google Scholar]
- 32.Rinaldo, C.R., J.M. Liebmann, X.L. Huang, Z. Fan, Q. Al Shboul, D.K. McMahon, R.D. Day, S.A. Riddler, and J.W. Mellors. 1999. Prolonged suppression of human immunodeficiency virus type 1 (HIV-1) viremia in persons with advanced disease results in enhancement of CD4 T cell reactivity to microbial antigens but not to HIV-1 antigens. J. Infect. Dis. 179:329–336. [DOI] [PubMed] [Google Scholar]
- 33.Ghanekar, S.A., S.A. Stranford, J.C. Ong, J.M. Walker, V.C. Maino, and J.A. Levy. 2001. Decreased HIV-specific CD4 T cell proliferation in long-term HIV-infected individuals on antiretroviral therapy. AIDS. 15:1885–1887. [DOI] [PubMed] [Google Scholar]
- 34.Altfeld, M., E.S. Rosenberg, R. Shankarappa, J.S. Mukherjee, F.M. Hecht, R.L. Eldridge, M.M. Addo, S.H. Poon, M.N. Phillips, G.K. Robbins, et al. 2001. Cellular immune responses and viral diversity in individuals treated during acute and early HIV-1 infection. J. Exp. Med. 193:169–180. [DOI] [PMC free article] [PubMed] [Google Scholar]
- 35.Oxenius, A., D.A. Price, P.J. Easterbrook, C.A. O'Callaghan, A.D. Kelleher, J.A. Whelan, G. Sontag, A.K. Sewell, and R.E. Phillips. 2000. Early highly active antiretroviral therapy for acute HIV-1 infection preserves immune function of CD8+ and CD4+ T lymphocytes. Proc. Natl. Acad. Sci. USA. 97:3382–3387. [DOI] [PMC free article] [PubMed] [Google Scholar]
- 36.Rosenberg, E.S., M. Altfeld, S.H. Poon, M.N. Phillips, B.M. Wilkes, R.L. Eldridge, G.K. Robbins, R.T. D'Aquila, P.J. Goulder, and B.D. Walker. 2000. Immune control of HIV-1 after early treatment of acute infection. Nature. 407:523–526. [DOI] [PubMed] [Google Scholar]
- 37.Betts, M.R., D.R. Ambrozak, D.C. Douek, S. Bonhoeffer, J.M. Brenchley, J.P. Casazza, R.A. Koup, and L.J. Picker. 2001. Analysis of total human immunodeficiency virus (HIV)-specific CD4(+) and CD8(+) T-cell responses: relationship to viral load in untreated HIV infection. J. Virol. 75:11983–11991. [DOI] [PMC free article] [PubMed] [Google Scholar]
- 38.Wilson, C.C., B. Palmer, S. Southwood, J. Sidney, Y. Higashimoto, E. Appella, R. Chesnut, A. Sette, and B.D. Livingston. 2001. Identification and antigenicity of broadly cross-reactive and conserved human immunodeficiency virus type 1-derived helper T-lymphocyte epitopes. J. Virol. 75:4195–4207. [DOI] [PMC free article] [PubMed] [Google Scholar]
- 39.Champagne, P., G.S. Ogg, A.S. King, C. Knabenhans, K. Ellefsen, M. Nobile, V. Appay, G.P. Rizzardi, S. Fleury, M. Lipp, et al. 2001. Skewed maturation of memory HIV-specific CD8 T lymphocytes. Nature. 410:106–111. [DOI] [PubMed] [Google Scholar]
- 40.Altfeld, M., T.M. Allen, X.G. Yu, M.N. Johnston, D. Agrawal, B.T. Korber, D.C. Montefiori, D.H. O'Connor, B.T. Davis, P.K. Lee, et al. 2002. HIV-1 superinfection despite broad CD8+ T-cell responses containing replication of the primary virus. Nature. 420:434–439. [DOI] [PubMed] [Google Scholar]
- 41.Iyasere, I., J.C. Tilton, A.J. Johnson, S.A. Younes, B. Yassine-Diab, R.P. Sekaly, W.W. Kwok, S.A. Migueles, A.C. Laborico, W.L. Shupert, et al. 2003. Diminished proliferation of HIV-specific CD4+ T cells is associated with diminished IL-2 production and recovered by exogenous IL-2. J. Virol. 77:10900–10909. [DOI] [PMC free article] [PubMed] [Google Scholar]
- 42.Fuller, M.J., and A.J. Zajac. 2003. Ablation of CD8 and CD4 T cell responses by high viral loads. J. Immunol. 170:477–486. [DOI] [PubMed] [Google Scholar]
- 43.Oxenius, A., R.M. Zinkernagel, and H. Hengartner. 1998. Comparison of activation versus induction of unresponsiveness of virus-specific CD4+ and CD8+ T cells upon acute versus persistent viral infection. Immunity. 9:449–457. [DOI] [PubMed] [Google Scholar]
- 44.Reinhardt, R.L., A. Khoruts, R. Merica, T. Zell, and M.K. Jenkins. 2001. Visualizing the generation of memory CD4 T cells in the whole body. Nature. 410:101–105. [DOI] [PubMed] [Google Scholar]
- 45.Lanzavecchia, A., and F. Sallusto. 2002. Progressive differentiation and selection of the fittest in the immune response. Nat. Rev. Immunol. 2:982–987. [DOI] [PubMed] [Google Scholar]
- 46.Kaech, S.M., E.J. Wherry, and R. Ahmed. 2002. Effector and memory T-cell differentiation: implications for vaccine development. Nat. Rev. Immunol. 2:251–262. [DOI] [PubMed] [Google Scholar]
- 47.Grossman, Z., and W.E. Paul. 2000. Self-tolerance: context dependent tuning of T cell antigen recognition. Semin. Immunol. 12:197–203. [DOI] [PubMed] [Google Scholar]
- 48.Grossman, Z., M.B. Feinberg, and W.E. Paul. 1998. Multiple modes of cellular activation and virus transmission in HIV infection: a role for chronically and latently infected cells in sustaining viral replication. Proc. Natl. Acad. Sci. USA. 95:6314–6319. [DOI] [PMC free article] [PubMed] [Google Scholar]
- 49.Appay, V., D.F. Nixon, S.M. Donahoe, G.M. Gillespie, T. Dong, A. King, G.S. Ogg, H.M. Spiegel, C. Conlon, C.A. Spina, et al. 2000. HIV-specific CD8+ T cells produce antiviral cytokines but are impaired in cytolytic function. J. Exp. Med. 192:63–75. [DOI] [PMC free article] [PubMed] [Google Scholar]
- 50.Blattman, J.N., J.M. Grayson, E.J. Wherry, S.M. Kaech, K.A. Smith, and R. Ahmed. 2003. Therapeutic use of IL-2 to enhance antiviral T-cell responses in vivo. Nat. Med. 9:540–547. [DOI] [PubMed] [Google Scholar]