

Abstract
Circulating levels of leptin correlate with food intake and adiposity. A decline in serum leptin associated with calorie restriction instigates behavioral and metabolic adaptation, increasing appetite and conserving energy. Brain melanocortin-4 receptors (Mc4rs) are important mediators of leptin’s effects on appetite and energy expenditure. Because subtle changes in function associated with heterozygous null mutations for either the Leptin (Lep-HET) or Mc4r genes (Mc4r-HET) increase adiposity, we tested the hypothesis that combined heterozygous mutations (Dbl-HET) would severely exacerbate diet-induced obesity (DIO) and insulin resistance in C57BL/6J mice. Serum leptin levels were lower as a function of adiposity in heterozygous Leptin mutants (Lep-HET, Dbl-HET) matched with mice homozygous for the wild-type (WT) Lep gene (Mc4r-HET). Evidence for an additive interaction on adiposity in Dbl-HET mice maintained on a low-fat diet was observed at 10 wk of age. Male but not female mice developed DIO and insulin resistance on a high-fat diet. Compared with WT mice, DIO was more severe in Mc4r-HET but not Lep-HET mice, regardless of sex. However, the response of male and female Dbl-HET mice was different, with males being less and females being more responsive relative to Mc4r-HET. Glucose tolerance of Dbl-HET mice was not significantly different from WT mice in either sex. These results show a complex interaction between the Leptin and Mc4r genes that is influenced by age, gender, and diet. Remarkably, while heterozygous Lep mutations initially exacerbate obesity, in situations of severe obesity, reduced leptin levels may act oppositely and have beneficial effects on energy homeostasis.
THE MELANOCORTIN SYSTEM is the best-characterized pathway involved in the central regulation of energy homeostasis (1). The precursor peptide proopiomelanocortin (Pomc) is expressed in neurons in the arcuate nucleus of the hypothalamus and in a smaller population in the caudal region of the nucleus tractus solitarius in the brainstem. Pomc is processed into neuropeptides with diverse physiological and behavioral functions, including the MSHs (α-, β-, and γ-MSH) that are melanocortin receptor agonists (2). A second group of arcuate neurons expresses the melanocortin receptor antagonist and inverse agonist, agouti-related peptide (AgRP) (3,4). Regulation of energy homeostasis by MSH and AgRP involves two seven-transmembrane receptors [melanocortin-3 receptor (Mc3r), Mc4r] expressed in the brain (5).
The Mc4r has been the most intensively studied melanocortin receptor expressed in the brain. Centrally administered melanocortin receptor agonists suppress food intake and stimulate energy expenditure through activation of Mc4r (6,7,8). While under active investigation, melanocortin neurons distributed throughout the central nervous system regulate energy balance, coordinating energy expenditure and feeding behavior with peripheral signals of energy status (8,9,10,11,12). Mc4r knockout mice (Mc4r−/−) are obese, hyperphagic, have increased longitudinal growth, and develop insulin resistance (12,13,14,15,16). A partial reduction in the synthesis of endogenous Mc4r agonists also predisposes to obesity in mice and humans (17,18). A gene-dosage effect on obesity was observed during analysis of outbred mice, with heterozygous (Mc4r-HET) exhibiting an intermediate obese phenotype compared with homozygous Mc4r knockouts (14). Current estimates suggest that up to 5% of severe childhood obesity may be due to MC4R haploinsufficiency (19). The severity of the obese phenotype in these subjects also correlates with the degree to which mutations affect receptor function. Therefore, adaptation to daily variations in energy intake and expenditure may involve small incremental changes in Mc4r activity. Conversely, minor impairment in Mc4r function can have long-term implications on body weight (BW).
Pomc and AgRP neurons are involved in the regulation of energy homeostasis by leptin, a hormone secreted predominantly by adipocytes (20,21). Leptin stimulates arcuate Pomc neurons, increasing activity of downstream melanocortin receptors by promoting MSH synthesis and release (22,23,24). Leptin also inhibits AgRP synthesis and secretion, reducing an inhibitory input to Mc4r (22,25). Melanocortin receptor antagonists or deletion of the Mc4r gene attenuates the anorectic actions of leptin (7,26,27).
Leptin secretion from adipocytes correlates with adiposity and food intake (20,28). Complete leptin deficiency observed in the Lepob/Lepob mouse and in a small number of human cases results in severe early-onset obesity and hyperphagia (29,30,31). Partial loss of leptin production also increases adiposity in humans (32) and chow-fed heterozygous Lepob/Lep+ (Lep-HET) mice (33). Lep-HET mice exhibit an intermediate phenotype, are moderately hyperinsulinemic, and have impaired glucose tolerance (34). Increased adiposity in Lep-HET mice and humans heterozygous for null LEP mutations may be a homeostatic response to increase circulating leptin to normal levels.
Most countries are experiencing an epidemic of obesity and obesity associated metabolic disorders, including type 2 diabetes (35). Transition to a sedentary lifestyle and easy access to calorie dense foods are potentially contributing to the epidemic. Genetics may also be important for determining propensity for obesity (19,36). However, null mutations in individual genes account for only a small percentage of extreme obesity (19). Genome scans indicate that BW and predisposition to obesity are influenced by many genes (37). Environmental and epigenetic factors also interact with genes to affect BW and susceptibility to diet-induced obesity (DIO) (38). Thus, predisposition to obesity and type 2 diabetes is a polygenic disorder, influenced by the interaction of many genes with environmental variables.
We and others have used mouse models to investigate the hypothesis that mutations reducing leptin production and Mc4r signaling will have additive effects on adiposity and DIO. These studies focused on homozygous Lepob mutants with or without Mc4r deficiency due to targeted gene deletion or expression of an Mc4r antagonist (27,39). Double Mc4r+/− Lepob/Lep+ heterozygotes (Dbl-HET) fed low-fat diets (LFDs) also exhibited a modest additive effect on obesity (27). However, the analysis of Dbl-HET mice was limited to young animals (10 wk) and did not investigate glucose homeostasis. Moreover, the long-term consequences of carrying heterozygous mutations in the Mc4r and Lep genes on obesity and insulin resistance were not examined.
The current study further investigated obesity and insulin resistance in Dbl-HET C57BL/6J (B6) mice fed either a LFD or high-fat diet (HFD). The results are surprising in suggesting that the outcome of the interaction between heterozygous null Mc4r and Lep mutations is affected by age and dietary fat content. In young (10 wk) mice and in females, Dbl-HET exhibited a more severe obese phenotype relative to Mc4r-HET and Lep-HET. However, in males by 7 months, obesity was most severe with heterozygous Mc4r mutations, regardless of diet. In contrast, Lep-HET mice exhibited increased adiposity on a LFD, but not a HFD. Remarkably, whereas Lep-HET reduced circulating leptin levels as a function of fat mass (FM), it actually attenuated DIO and glucose intolerance observed Mc4r-HET mice. Heterozygous Lep mutations may also have beneficial effects on glucose homeostasis in females, independent of a reduction in adiposity. These data suggest that while a reduction in circulating leptin increases adiposity in the early stages of obesity, it may be beneficial in situations of severe obesity. In the severely obese state, hyperleptinemia may further exacerbate deficits in energy homeostasis and glucose homeostasis.
Materials and Methods
Experimental animals
B6 Mc4r+/− (Mc4r-HET) mice maintained at the Pennington Biomedical Research Center were crossed with B6.V Lepob/Lep+ mice purchased from the Jackson Laboratory (Bar Harbor, ME) to generate wild-type (WT), Mc4r-HET, Lepob/Lep+ (Lep-HET), and Lepob/Lep+Mc4r+/− (Dbl-HET) progeny. Genotyping of Mc4r-HET and Lep-HET was performed by PCR and has been previously described (16). The presence of the Lepob mutation in Lep-HET mice was also confirmed by DNA sequencing (Applied Biosystems, Foster City, CA). Mice were housed on a 12-h light-dark period (lights on 0600–1800 h). WT (n = 8 male, n = 7 female), Mc4r-HET (n = 5 for male and female), Lep-HET (n = 8 male, n = 5 female), and Dbl-HET (n = 4 male, n = 8 female) mice were maintained on either LFD (10% energy from fat; Research Diets no. 12450B; Research Diets, Inc., New Brunswick, NJ) from weaning until 28 wk of age. Another group of WT (n = 8 male and female), Mc4r-HET (n = 6 male, n = 7 female), Lep-HET (n = 11 male, n = 7 female), and Dbl-HET (n = 5 for male and female) were maintained on a LFD until 17 wk of age, and then switched to a HFD (60% energy from fat; Research Diets no. 12492) until approximately 28 wk of age. Mice were killed after an overnight fast. FM, fat-free mass (FFM), and adiposity (percent body fat) were measured in live mice using nuclear magnetic resonance (Bruker Mice Minispec NMR Analyzer; Bruker Optics Inc., Billerica, MA) (40). Measures were made in triplicate. Percent FM was determined by dividing FM by total BW.
All experiments were approved by the Pennington Biomedical Research Center Institutional Animal Care and Use Committee.
Serum assays
Fasting blood glucose was measured using a Glucometer (Bayer Glucometer Elite; Bayer Corp., Tarrytown, NY). Total serum insulin and leptin levels were measured by ELISA performed in duplicate (Crystal Chem Inc., Downers Grove, IL). Homeostasis model assessment of insulin resistance (HOMA-IR) was calculated using the following equation: {[fasting insulin (ng/ml) × 22.5] × [fasting glucose (mg/dl)/18]}/22.5.
Glucose tolerance tests
Mice were fasted overnight; a baseline blood sample was taken and then injected with 2 g/kg glucose solution ip. Blood glucose was sampled every 15 min for 60 min using a Glucometer Elite XL (Bayer Corp., Elkhart, IN).
Analysis of gene expression
Total RNA from retroperitoneal adipose tissue was isolated using TRI Reagent (Molecular Research Centre Inc., Cincinnati, OH) and reverse transcribed using Superscript III RT system (Invitrogen, Carlsbad, CA). Oligonucleotide primers (Integrated DNA Technologies, Coralville, IA) were designed using Primer Express 2.0 software (Applied Biosystems). Quantitation of target gene mRNA using cyclophilin B as a reference was performed in 384-well plates using SYBR Green, or TaqMan Universal, PCR Master Mix (Applied Biosystems), and an ABI PRISM 7900 HT Sequence Detection System (Applied Biosystems). Sequences of primers and probes used for expression analyses have been previously reported (41).
Statistics
All data are presented as mean ± sem. SigmaStat software (SPSS, Inc., Chicago, IL) or GraphPad Prism 4.0 (GraphPad Software Inc., San Diego, CA) was used for one-way and two-way ANOVA. Tukey or Student-Newman-Keuls post hoc tests were performed for data exhibiting homogeneous, or nonhomogeneous, variance, respectively. Regression analysis of serum leptin levels in individual mice was performed using SAS version 9.1.3 (SAS Institute Inc., Cary, NC). The slope of the regression and y-axis intercepts from the relationship between leptin concentration (log) and body FM (%) between groups were analyzed by covariance analysis. Significance was assumed for P values less than 0.05.
Results
Effects of Dbl-HET null mutations in the Mc4r and Lep genes on obesity in mice maintained on a LFD are not maintained with age
Previous studies indicated an additive effect of Dbl-HET mutations on BW up to 10 wk of age (27). The objective of this study was to examine the long-term effects of Dbl-HET mutations, and to further stress systems involved in energy homeostasis by exposure to a HFD. BW and adiposity [percent (%) FM] were measured in mice up to 6–7-months of age, maintained on a purified LFD (10% energy/fat), or a HFD (60% energy/fat) for 3 months before termination. This protocol was previously used for analysis of melanocortin receptor knockout mice on the B6 background (16).
At 7 months of age, the effects of Mc4r-HET on BW are severe in mice maintained on a LFD. BW was significantly increased in Mc4r-HET and Dbl-HET mice (males, Fig. 1A; females, Fig. 2A). BW of Lep-HET mutants was not significantly different from WT, and there was no evidence for interaction in Dbl-HET mice. There were significant effects of sex and genotype on BW (two-way ANOVA, effects of genotype P < 0.001, sex P < 0.001), with a significant interaction between sex and genotype (P < 0.05). Males were significantly heavier then females, regardless of genotype (all P < 0.001). Mc4r-HET had a proportionately greater effect to increase BW relative to WT in males. Compared with WT, BW was increased in Mc4r-HET by 13.2 g (49%) in males, and 7.1 g (35%) in females. In Lep-HET mice the increase in BW was similar in males (+3.2 g, or 12%) and females (+2.2 g or 11%).
Figure 1.

Effects of single and Dbl-HET mutations on BW in male mice fed a LFD. BW (A), FFM (B), FM (C), and increase in adiposity (FM adjusted for BW) relative to WT mice (D). Male WT, Mc4r-HET, Lep-HET, and Dbl-HET mice were maintained on a LFD for 28 wk. Statistical significance is indicated by the presence of different superscripts. Groups labeled “a” are statistically different from groups labeled “b” (P < 0.05); groups that share “a” are not significantly different from each other.
Figure 2.

Effects of single and Dbl-HET mutations on BW in female mice fed a LFD. BW (A), FFM (B), FM (C), and increase in adiposity (FM adjusted for BW) relative to WT mice (D). Female WT, Mc4r-HET, Lep-HET, and Dbl-HET mice maintained on a LFD for 28 wk. Groups labeled “a” are statistically different from groups labeled “b” (P < 0.05); groups that share “a” are not significantly different from each other.
Analysis of body composition showed increased FM and FFM in both Mc4r-HET and Dbl-HET mice (Figs. 1, B–D, and 2, B–D). Lep-HET mice exhibited significantly greater FM compared with WT, which was statistically significant for females (Figs. 1C and 2C). To adjust for increased lean mass in Mc4r-HET mice, percent FM was calculated and then expressed as a ratio relative to WT mice. In males the increase in percent FM in Mc4r-HET and Dbl-HET mice relative to WT was proportional to that observed in Lep-HET mice (Fig. 1D). In females the increase in percent FM relative to WT was comparable for all three mutants (Fig. 2D). Analysis using two-way ANOVA indicated strong effects of genotype (P < 0.001) and a tendency for an effect of sex (P = 0.077). Post hoc analysis indicates that Mc4r-HET mice exhibited a greater increase in percent FM in males (2.4-fold increase relative to WT) compared with females (1.8-fold increase) (P < 0.05).
Results from the analysis of 7-month mice differ from previous studies using young mice in which an additive interaction in Dbl-HET mice was observed. However, in the mice used for these studies, there was evidence for an interaction at 9 wk of age. Dbl-HET mice exhibited the highest percent FM at this age (least square means of percent FM at 9 wk of age based on genotype: WT, 12.4 ± 0.5, n = 9 for males and females; Mc4r-HET, 14.3 ± 0.6, n = 6/7; Lep-HET, 14.6 ± 0.5, n = 11/7; and Dbl-HET, 17.0 ± 0.7, n = 5/5). Two-way ANOVA indicated a significant effect of genotype on percent FM (P < 0.001), but not sex. Percent FM of Dbl-HET mice was significantly greater compared with all other groups (P < 0.05 vs. Lep-HET, Mc4r-HET; P < 0.001 vs. WT). There were also significant effects of sex and genotype on BW in 9-wk-old mice (least square means of BW by sex: males 20.1 ± 0.2 g, females 16.7 ± 0.2 g; for BW by genotype: WT 17.4 ± 0.3 g; Mc4r-HET, 18.7 ± 0.3 g; Lep-HET, 18.1 ± 0.3 g; Dbl-HET, 19.5 ± 0.4 g; statistical analysis by two-way ANOVA: genotype P < 0.001; sex P < 0.001; interaction between sex and genotype P = 0.111). Analysis of the female mice using one-way ANOVA indicated a tendency (P = 0.055) for increased BW of Dbl-HET compared with Mc4r-HET (data not shown).
The effect of the interaction of heterozygous Mc4r and Lep mutations on obesity with a HFD is gender specific
B6 mice are a congenic strain frequently used for studying obesity and diabetes (42). Male B6 fed a HFD develop DIO (compare Fig. 1A with Fig. 3A) (BW of males fed a LFD, 27.4 ± 0.8 g; fed a HFD, 36.3 ± 1.3 g; P < 0.01). The weight gain of males fed a HFD was associated with increased percent FM (27.3 ± 1.7% on a HFD compared with 14.3 ± 1.7% on a LFD; P < 0.01). Female B6 mice resist DIO (compare Fig. 2A with Fig. 4A). Although BW of females fed a HFD tended to be moderately higher compared with the LFD group (23.0 ± 0.7 g compared with 20.6 ± 0.6 g; P = 0.063), there was no difference in percent FM (14.8 ± 0.9% compared with 13.6 ± 1.1%).
Figure 3.

Effects of single and Dbl-HET mutations on DIO in male B6 mice. BW (A) and FFM (B) of male WT, Mc4r-HET, Lep-HET, and Dbl-HET mice maintained on a LFD from weaning until 17 wk and then switched to a HFD until 28 wk of age. Growth curve analysis of FM (C) and adiposity (percent body fat) (D) during exposure to the HFD. E, Endpoint data of adiposity expressed relative to WT mice. F, FM gained (g/wk) during high-fat feeding. Groups labeled “a” are statistically different from groups labeled “b” (P < 0.05); groups that share “a” are not significantly different from each other. *, P < 0.01 Mc4r-HET compared with WT, †, P < 0.05 compared with Lep-HET.
Figure 4.

Effects of single and Dbl-HET mutations on DIO in female B6 mice. BW (A) and FFM (B) of female WT, Mc4r-HET, Lep-HET, and Dbl-HET mice maintained on a LFD from weaning until 17 wk and then switched to a HFD until 28 wk of age. Growth curve analysis of FM (C) and adiposity (FM as a function of BW) (D) during maintenance on a HFD. Endpoint data of adiposity expressed relative to WT (E) and FM gained (g/wk) for time exposed to a HFD (F). Groups labeled “a” are statistically different from groups labeled “b” (P < 0.05); groups that share “a” are not significantly different from each other. *, P < 0.05 compared with WT, Lep-HET mice.
Male Mc4r-HET mice had significantly higher BW, FFM, FM, percent FM, and weekly gain in FM compared with both WT and Lep-HET mice (Fig. 3). However, male Dbl-HET did not exhibit the significant exacerbation of DIO observed in Mc4r-HET mice, due to a reduction in FM. Dbl-HET and Mc4r-HET exhibited similar increases in FFM (Fig. 3B). Lep-HET mice had normal BW and adiposity (Fig. 3).
Female Mc4r-HET and Dbl-HET mice had significantly greater BW, FM, FFM, percent FM, and weekly gain in FM compared with WT and Lep-HET mice (Fig. 4). The BW of Dbl-HET mice was significantly greater compared with Mc4r-HET (Fig 4A). FFM was significantly elevated in Dbl-HETs, but not single Mc4r-HET, compared with WT and Lep-HET mice (Fig. 4B). FM, percent FM relative to WT, and weekly gain in FM also appeared to be increased in Dbl-HET relative to Mc4r-HET mice, although the differences did not achieve statistical significance (Fig. 4, C–F).
Analysis using two-way ANOVA to investigate the effects of sex and genotype on BW and percent FM in the HFD fed group indicated a significant interaction between sex and genotype (genotype P < 0.001, sex P < 0.001, interaction between sex and genotype P < 0.05 for BW, P < 0.001 for percent FM). Percent FM was significantly increased related to controls in female Dbl-HET (P < 0.001), but not in males.
Heterozygous Lep mutations improve glucose homeostasis in DIO Mc4r-HET mice
Glucose homeostasis data were analyzed by performing two-way ANOVA using either sex and genotype, or diet and genotype as the sources of variation. As expected, DIO was associated with deterioration of glucose homeostasis in males. There was a significant effect of diet on blood glucose (P < 0.001), fasting insulin (P < 0.01), and HOMA-IR (P < 0.01) in male B6 mice.
In males fed a LFD, fasting blood glucose was significantly increased in Mc4r-HET and Dbl-HET mice (Table 1). However, on a HFD, fasting blood glucose levels were increased in Mc4r-HET mice compared with all other genotypes. On a HFD, Mc4r-HET exhibited significantly higher fasting insulin compared with WT controls; fasting insulin levels in Lep-HET and Dbl-HET were not significantly different from WT controls (Table 1).
Table 1.
Fasting blood glucose, and serum insulin and leptin values for male WT, Mc4r-HET, Lep-HET, and Dbl-HET mice maintained on a LFD for 28 wk or a HFD from 17–28-wk of age
| Males | Glucose (mg/dl) | Insulin (ng/ml) | Leptin (ng/ml) |
|---|---|---|---|
| LFD | |||
| WT | 91 ± 7a | 0.2 ± 0.1 | 1.4 ± 0.6 |
| Mc4r-HET | 137 ± 13b | 1.1 ± 0.4 | 4.6 ± 2.1 |
| Lep-HET | 92 ± 3a | 0.5 ± 0.3 | 0.6 ± 0.1 |
| Dbl-HET | 124 ± 5b | 0.8 ± 0.4 | 3.5 ± 2.5 |
| HFD | |||
| WT | 127 ± 6a,a | 1.2 ± 0.4a | 17.1 ± 6.4a,a |
| Mc4r-HET | 189 ± 13b,a | 4.0 ± 0.6b,a | 44.4 ± 8.2b,a |
| Lep-HET | 142 ± 9a,a | 2.0 ± 0.5a | 6.2 ± 1.9a |
| Dbl-HET | 143 ± 12a | 3.2 ± 0.9a | 10.2 ± 2.6a |
Data were analyzed using two-way ANOVA, with genotype and diet as source of variation. Within diet, groups labeled ″a″ are statistically different from groups labeled ″b″ (P < 0.05); groups that share ″a″ are not significantly different from each other.
, Significant effect of diet within genotype (P < 0.01).
Diet had minor effects on glucose homeostasis in females, with a tendency for a modest effect on fasting blood glucose (P = 0.051) and no significant effect on insulin or HOMA-IR. In female mice fed a LFD, there was no significant difference in fasting glucose or insulin between groups (Table 2). For females fed a HFD, there was a significant interaction between diet and genotype on fasting blood glucose (P < 0.05). On a HFD, fasting blood glucose was significantly higher in female Mc4r-HET and Dbl-HET, compared with WT and Lep-HET (Table 2). However, fasting insulin levels were not significantly affected by genotype in females fed a HFD.
Table 2.
Fasting blood glucose, and serum insulin and leptin values for female WT, Mc4r-HET, Lep-HET, and Dbl-HET maintained on a LFD for 28 wk or switched to a HFD from 17–28 wk of age
| Females | Glucose (mg/dl) | Insulin (ng/ml) | Leptin (ng/ml) |
|---|---|---|---|
| LFD | |||
| WT | 86 ± 4 | 0.2 ± 0.1 | 0.7 ± 0.4 |
| Mc4r-HET | 97 ± 6 | 0.1 ± 0.0 | 3.0 ± 1.0 |
| Lep-HET | 100 ± 5 | 0.6 ± 0.3 | 0.8 ± 0.2 |
| Dbl-HET | 92 ± 5 | 1.3 ± 1.0 | 2.0 ± 0.8 |
| HFD | |||
| WT | 83 ± 5a | 1.0 ± 0.4 | 1.8 ± 0.4a,c |
| Mc4r-HET | 130 ± 5b,a | 1.3 ± 0.5 | 25.5 ± 5.1b,a |
| Lep-HET | 90 ± 7a | 0.7 ± 0.3 | 1.2 ± 0.3a |
| Dbl-HET | 132 ± 13b,a | 0.8 ± 0.3 | 19.2 ± 6.7b,c,a |
Data were analyzed using two-way ANOVA, with genotype and diet as source of variation. Groups labeled ″a″ are statistically different from groups labeled ″b″ (P < 0.01); groups that share ″a″ are not significantly different from each other.
, Significant effect of diet within genotype (P < 0.01).
Glucose homeostasis in mice fed a HFD was further assessed using ip glucose tolerance tests. Glucose tolerance appeared to be impaired in male and female Mc4r-HET compared with WT, and Lep-HET (Fig. 5). Two-way ANOVA indicated significant effects of sex and genotype, with the effects of genotype not affected by gender. Males were more glucose intolerant then females [least square means for area under the curve (AUC) in mg/dl for males, 548 ± 19; for females, 451 ± 19; P < 0.001]. The AUC for glucose was significantly increased in Mc4r-HET compared with WT and Lep-HET mice (both P < 0.05), with no significant difference between the other groups (least square means for AUC by genotype: WT, 451 ± 23; Mc4r-HET, 568 ± 28; Lep-HET, 465 ± 24; and Dbl-HET, 514 ± 32).
Figure 5.

Mc4r heterozygosity results in perturbed glucose tolerance in mice fed a HFD. Intraperitoneal glucose tolerance test data for male (A) and female (B) WT, Mc4r-HET, Lep-HET, and Dbl-HET mice maintained on a HFD. *, P < 0.05 compared with WT. Calculation for total AUC is presented for the same male (C) and female (D) mice. *, P < 0.05 compared with WT; P = 0.053 compared with Lep-HET.
The relationship between deteriorating glucose homeostasis and obesity was also investigated using HOMA-IR (Fig. 6). When the data are analyzed grouped by genotype and diet, the deterioration of glucose homeostasis in males indicated by higher HOMA-IR is proportional to obesity (Fig. 6A). Male Mc4r-HET mice exhibited increased HOMA-IR (48.3 ± 10.0) compared with WT (10.4 ± 4.2; P < 0.05) and Lep-HET mice (18.9 ± 5.2; P < 0.05). HOMA-IR values for Dbl-HET mice were not significantly different compared with any group. In females, obesity did not severely affect HOMA-IR values (Fig. 6B).
Figure 6.

Relationship between adiposity and glucose metabolism (A and B) or leptin (C–H) in heterozygous carriers of the Lepob mutation. Scatterplot showing the relationship between adiposity (percent FM) and HOMA-IR in male (A) and female (B) WT, Mc4r-HET, Lep-HET, and Dbl-HET mice maintained on LFDs or HFDs. Scatterplot showing the relationship between adiposity and leptin in male (C) and female (D) mice fed a LFD or HFD. In mice fed a HFD, the Lepob mutation was associated with a disproportionate reduction in circulating leptin levels regardless of Mc4r genotype. E and F, Scatterplot and regression analysis showing the correlation of log(leptin) from individual mice with WT leptin genes or heterozygous for the Lepob mutation. Male (E) and female mice (F) with or without a copy of the null Mc4r gene have lower leptin levels as a function of percent FM when heterozygous for the Lepob mutation (open circles), compared with mice homozygous for the WT Lep gene (solid circles). There is a significant effect of percent FM with leptin levels (P < 0.0001), with no effect of Lep genotype on the slope in either sex (i.e. the lines are nonoverlapping and parallel). The y-axis intercepts are significantly different in both males and females (P < 0.01).
Leptin levels as a function of percent FM are lower in obese mice heterozygous for the Lepob mutation
Obesity owing to gene mutation or diet generally increased leptin levels in both males and females (Fig. 6, C and D). Within sex, the effects of diet and genotype on serum leptin were statistically significant (diet effects P < 0.001 in males and females, genotype effects P < 0.02 in males and P < 0.001 in females). There was a significant interaction between diet and genotype in females (P < 0.001), whereas a strong tendency for an interaction was observed in males (P = 0.06).
In males, significant differences in serum leptin were only observed on a HFD, with Mc4r-HET exhibiting significantly higher leptin levels compared with WT, Lep-HET, and Dbl-HET (Table 1). Moreover, diet significantly affected serum leptin levels in WT and Mc4r-HET (P < 0.01), but not in the Lep-HET and Dbl-HET mice.
In female mice the combination of Mc4r heterozygosity and high-fat intake had a marked effect on fasting leptin (Table 2). As observed in males, significant effects of genotype on serum leptin were only observed on a HFD. However, unlike males, diet had significant effects on serum leptin in both Mc4r-HET and Dbl-HET mice (both P < 0.001), whereas there were no significant effects in WT or Lep-HET mice. The effect of diet on serum leptin levels appeared to be more severe in females compared with males. However, analysis of serum leptin data in the HFD mice by two-way ANOVA using sex and genotype as the source of variation indicated significant effects of genotype (P < 0.001) but not sex, with no significant interaction.
Mice heterozygous for the Lepob mutation had disproportionately low serum leptin as a function of percent FM. This was most obvious in male mice fed a HFD (Fig. 6C). In females the effect of the Lepob mutation on serum leptin is more subtle, with Dbl-HET mice not exhibiting a predicted increase in serum leptin, despite having an increase in percent FM (Fig. 6D). The effect of the Lepob mutation on serum leptin levels was further analyzed by regression analysis against percent FM (Fig. 6, E and F). Due to the low sample size in some groups, mice were grouped according to the presence or absence of the Lepob mutation. Serum leptin levels were lower in mice heterozygous for the Lepob allele, regardless of the state of obesity. Serum leptin levels significantly increase as a function of adiposity in males and females (P < 0.0001). The slope of the regression line for mice with WT Lep genes or heterozygous for the Lepob mutation are parallel, and not significantly different. The y-axis intercepts are also significantly different in both sexes (P < 0.01).
Attenuation of inflammation in male Dbl-HET mice
Obesity is associated with macrophage infiltration of adipose tissue, with inflammation possibly correlating with insulin resistance (41,43). Because male Dbl-HET mice appeared to exhibit improved glucose homeostasis compared with Mc4r-HET mice, we examined gene expression of macrophage markers in retroperitoneal adipose tissue. Cd68, epidermal growth factor-like module containing, mucin-like, hormone receptor-like protein (Emr1) (the F4/80 antigen) and monocyte chemoattractant protein-1 (Mcp1), which correlates with the number of macrophages in adipose tissue (41), were examined in male WT, Mc4r-HET, Lep-HET, and Dbl-HET mice on a HFD. Expression of Cd68, Emr1, and Mcp1 was significantly higher in male Mc4r-HET mice compared with WT and Lep-HET mice (Fig. 7). The expression of macrophage-specific genes in Dbl-HET mice was similar to controls.
Figure 7.
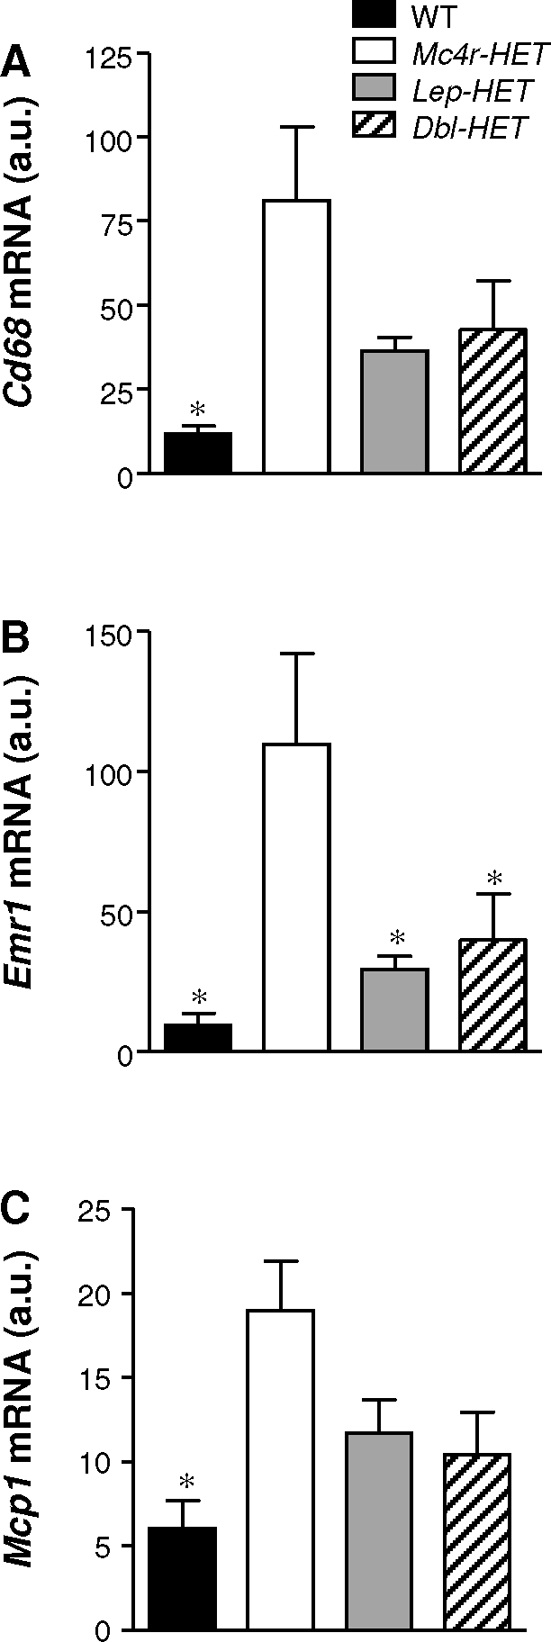
Macrophage infiltration is reduced in Mc4r-HET mice by Lep haploinsufficiency. Expression of Cd68 (A), Emr1 (B), and Mcp1 (C) mRNA in white adipose tissue from male WT, Mc4r-HET, Lep-HET, and Dbl-HET mice that were switched to a HFD for final 15 wk. *, P < 0.05 compared with Mc4r-HET mice. au, Arbitrary units per cyclophilin B.
Discussion
These experiments investigated the interaction between heterozygous null mutations in two genes (Mc4r and Lep) classically associated with energy homeostasis. Homozygous mutations in either gene have a severe impact on BW, whereas heterozygous mutants exhibit an intermediate phenotype. The central hypothesis tested in this study was that combining a reduction in leptin secretion and activity of the Mc4r, an important downstream mediator of leptin action, would have an additive effect on obesity. This outcome was observed in the early stages of obesity. However, a surprising outcome was that weight gain is associated with the development of a more complex interaction than predicted, based on current models of the regulation of energy homeostasis by this system. Indeed, whereas male Dbl-HET mice accumulate adiposity more rapidly in the initial stages, there is a negative interaction in later situations in which diet and heterozygous Mc4r mutations interact to produce severe obesity.
During early development, mice, regardless of genotype, on a LFD are relatively lean. At this stage the interaction between heterozygous null Mc4r and Lep mutations is additive. Statistical significance for an increase in percent FM was only observed in Dbl-HET mice, although significance in the Lep-HET and Mc4r-HET may have been achieved with increased sample size. A similar outcome, in which significant differences in percent FM and accumulation of FM between 4 and 10 wk of age were limited to Dbl-HET, was also observed in our previous study (27). These results are consistent with a combination of reduced leptin production, indicated by the disproportionately low leptin levels as a function of percent FM, and Mc4r activity interacting to further increase adiposity. We have not determined the mechanisms causing the obese phenotype of the Dbl-HET mice. However, leptin and Mc4r regulate ingestive behaviors, energy expenditure, and physical activity (5,21,44,45). Some or all of these components of the homeostatic mechanisms maintaining BW and adipose mass may be more severely compromised in double mutants compared with single heterozygotes.
A novel observation was the observed effect of age and DIO on the phenotype of Lep-HET and Dbl-HET mice. At 7 months Mc4r-HET mice exhibited increased BW and percent FM, regardless of sex and diet. Lep-HET mice exhibited increased percent FM only when maintained on a LFD. On a LFD the obese phenotype of Dbl-HET mice was similar to that of Mc4r-HET mice. However, on a HFD the obese phenotype of Dbl-HET mice was less severe than that of Mc4r-HET mice. Whether heterozygous Lepob mutations attenuated the obese phenotype of Mc4r heterozygotes by reducing food intake, or through affecting some other aspect of metabolic control, was not determined in these studies.
The attenuation of the effect of a HFD and heterozygous Mc4r mutation obesity in male mice was of sufficient magnitude to affect glucose tolerance and inflammation. Macrophage infiltration into white adipose tissue has been linked to the development of insulin resistance and cardiovascular disease (46). Improved glucose tolerance of Dbl-HET mice was also associated with reduced expression of inflammatory genes in adipose tissue. Together, these observations indicate a less severe metabolic disorder in Dbl-HET compared with Mc4r-HET mice. It is possible that this is due to a less severe obesity phenotype observed in male Dbl-HET mice, compared with Mc4r-HET mice. However, on a HFD female Dbl-HET mice also appeared to have a moderate improvement in glucose tolerance, compared with Mc4r-HET mice, which were glucose intolerant when compared with WT. The effect of the heterozygous Lepob mutation in females is not due to attenuated of obesity. In situations in which genes and diet exacerbate DIO, reduced leptin production may have a beneficial effect on glucose homeostasis independently of BW.
A previous study examining glucose homeostasis in male Lepob heterozygotes reported glucose intolerance (34). In the current study, HOMA-IR and fasting insulin values in male Lep-HET tended to be higher, but the differences did not achieve statistical significance. The current study also differs from previous experiments in that it used purified diets with low or high-fat content, instead of standard rodent chow diets.
Analysis of serum leptin as a function of percent FM revealed disproportionately low serum leptin levels in mice heterozygous for the Lepob mutation. Indeed, in males the presence of the Lepob mutation prevented the significant increase in serum leptin associated with a HFD and obesity. Whether excess leptin production in situations of extreme obesity driven by high-fat intake and the heterozygous Mc4r mutation has detrimental effects on energy homeostasis was not determined in these experiments. Also not determined was whether the reduction in serum leptin associated with the heterozygous Lepob mutation is associated with less severe leptin resistance. Improved leptin sensitivity is one hypothesis for explaining the less severe obesity phenotype of Dbl-HET mice compared with Mc4r-HET mice on a HFD. Mice lacking intracellular signaling proteins involved in feedback inhibition of leptin receptor signaling, such as suppressor-of-cytokine signaling-3 and protein-tyrosine phosphatase-1b, are more leptin sensitive and are protected from DIO (47,48,49).
Leptin has been proposed to act as a proinflammatory cytokine (50). Leptin replacement therapy in leptin-deficient human subjects normalizes CD4+ T-cell count, as well as their CD4+/CD8+ T-cell ratio, increased the proliferative response of lymphocytes, including increased production of cytokines such as interferon-γ (51). Therefore, severe hyperleptinemia may further worsen insulin resistance and metabolic syndrome in the obese state through stimulating inflammation. Attenuation of inflammation in male Dbl-HET mice may be due to the inability of these mice to produce enough leptin to induce such a response. The mechanism explaining the correlation between hyperleptinemia and inflammation remains to be investigated.
Serum leptin levels decrease with fasting, instigating behavioral and metabolic changes that include stimulation of appetite and conserving energy by reducing metabolic rate (52). Therefore, low leptin levels would be predicted to increase predisposition to obesity. This has been reported for Pima Indians, a population with high predisposition to obesity and diabetes (53). However, high-serum leptin levels were recently reported to predict the worsening of obesity and glucose intolerance, independently of initial body mass index (54). The results from the current study suggest that the relationship between serum leptin and weight gain and insulin resistance may be bimodal (Fig. 6, A and C). Low leptin levels are associated with increased adiposity and increased HOMA-IR during the early stages of obesity. However, once obese disproportionately low leptin levels do not appear to further increase weight gain. Indeed, with severe obesity, low leptin levels may have the opposite effect, and protect against further weight gain and deteriorating glucose homeostasis.
BW and percent FM of Lep-HET mice fed a HFD were not significantly different from controls. Thus, partial loss of Leptin gene function has no effects on BW in situations in which metabolism and homeostatic systems are altered by chronic exposure to a HFD. Male B6 mice develop hypothalamic leptin resistance on a HFD (22,55,56). Hypothalamic leptin resistance, perhaps in combination with a deterioration of other leptin-independent homeostatic circuits, may dominate any gains in adiposity associated with Lepob heterozygosity. However, Mc4r-HET mice exhibited increased BW and percent FM regardless of diet. Several peripheral homeostatic factors regulate Pomc and AgRP neurons, including insulin, glucose, ghrelin, peptide YY, and cholecystokinin (1,21). Thus, partial loss of Mc4r signaling may attenuate the coordinated response of many peripheral signals that are mediated by melanocortin signaling, resulting in a more severe obese phenotype compared with Lep-HET mice.
The first genetic investigation of the interaction of Lep and Mc4r mutations compared the obese phenotype of Lepob/Lepob and Lepob/Lepob.Ay/a mice (39). This study demonstrated an additive effect of chronic inhibition of the Mc4r through expression of agouti in the brain with loss of leptin. We have also observed that genetic ablation of Mc4r in Lepob/Lepob mice has an additive effect on obesity, and a partial resistance to the anorectic effects of leptin (27). The results of both studies were interpreted as suggesting that leptin regulates energy homeostasis independently of Mc4r activation. This conclusion is supported by observations demonstrating that melanocortin neurons are regulated by inputs emanating from the gut, from adipose tissue, and from within the central nervous system (1,21). Thus, the additive interaction observed in young Dbl-HET mice in the current study may result from reduced action in a linear sense (i.e. leptin → Pomc/AgRP → Mc4r) and from nonlinear-independent interactions. The nonlinear aspect involves reduced action of leptin pathways that are independent of Mc4r, and reduced efficacy of non-leptin inputs into melanocortin neurons. It is interesting to note that in situations of severe obesity, the effects of hyperleptinemia to promote obesity appear to be dominant. The adverse consequences of the heterozygous Mc4r mutation on energy homeostasis also appear to be more robust compared with heterozygous Lep mutation. When fed a HFD, other homeostatic systems that may involve the Mc4r appear to compensate in Lep-HET mice, resulting in DIO and insulin resistance comparable to that of controls.
Female Dbl-HET mice did not exhibit the attenuated DIO phenotype observed in males. Indeed, on a HFD female Dbl-HET mice exhibited increased BW compared with Mc4r-HET mice, regardless of age. The reasons for the effects of gender on the response of Dbl-HET mice to a HFD are not clear. Gonadal steroid hormones are known to influence the levels and action of circulating leptin. For instance, administration of estrogen can increase leptin production in rats and humans (57). There is also evidence for differential gender-specific roles of insulin and leptin in energy homeostasis, with female mice demonstrating higher sensitivity to leptin administered centrally, whereas male mice are more responsive to insulin (58). It might be informative to investigate whether gender specificity occurs in interactions between heterozygous Mc4r mutations with heterozygous null mutations of genes in the insulin receptor-signaling pathway.
Female B6 mice in this study were resistant to DIO. Since the original description of B6 mice as a model of type2 diabetes (59), the vast majority of studies using B6 mice, and indeed other congenic strains, to investigate obesity and diabetes have used males (42). There is some discrepancy in the literature on how female B6 mice respond to high-fat intake. One study reported that female B6 mice resist DIO (60), however, another study reported DIO (61). If DIO exists in female B6 mice, it may not be as robust as that observed in males.
In summary, our data show complex sex- and diet-dependent interactions between Mc4r and Lep genotypes and energy homeostasis. The results of these experiments are intriguing in suggesting that severe hyperleptinemia, in addition to being an indicator of leptin resistance, may further exacerbate the metabolic consequences of obesity. These results have implications for the interpretation of data from the analysis of knockout mice in which obesity is associated with severe hyperleptinemia.
Acknowledgments
We thank the staff of the Department of Comparative Biology, Pennington Biomedical Research Center, for assistance in maintaining animal colonies. The authors also thank Drs. Robert Koza and Christopher Morrison for assistance with preparation of the manuscript.
Footnotes
These studies were supported by the American Diabetes Association (1-04-JF09 to A.A.B.). A.A.B. is supported in part by Clinical Nutrition Research Unit Center Grant 1P30 DK072476 entitled “Nutritional Programing: Environmental and Molecular Interactions” sponsored by the National Institute of Diabetes and Digestive and Kidney Diseases, and the Pennington Biomedical Research Foundation.
Present address for J.L.T.: Amylin Pharmaceuticals, Inc., 9360 Towne Centre Drive, San Diego, California 92117.
Disclosure Statement: J.L.T., E.A.M., and J.E.G. have nothing to declare. A.A.B. is a consultant for and has received grant funding from Ipsen, Inc., and owns stock in Orexigen, Inc.
First Published Online October 11, 2007
Abbreviations: AgRP, Agouti-related peptide; AUC, area under the curve; BW, body weight; Dbl-HET, double heterozygous; DIO, diet-induced obesity; Emr1, epidermal growth factor-like module containing, mucin-like, hormone receptor-like protein; FFM, fat-free mass; FM, fat mass; HFD, high-fat diet; HOMA-IR, homeostasis model assessment of insulin resistance; Lep-HET, leptin heterozygous; LFD, low-fat diet; Mc4r, melanocortin-4 receptor; Mc4r-HET, melanocortin-4 receptor heterozygous; Mcp1, monocyte chemoattractant protein-1; Pomc, proopiomelanocortin; WT, wild type.
References
- Cone RD 2005 Anatomy and regulation of the central melanocortin system. Nat Neurosci 8:571–578 [DOI] [PubMed] [Google Scholar]
- Adan RA, Cone RD, Burbach JP, Gispen WH 1994 Differential effects of melanocortin peptides on neural melanocortin receptors. Mol Pharmacol 46:1182–1190 [PubMed] [Google Scholar]
- Graham M, Shutter JR, Sarmiento U, Sarosi I, Stark KL 1997 Overexpression of Agrt leads to obesity in transgenic mice. Nat Genet 17:273–274 [DOI] [PubMed] [Google Scholar]
- Ollmann MM, Wilson BD, Yang YK, Kerns JA, Chen Y, Gantz I, Barsh GS 1997 Antagonism of central melanocortin receptors in vitro and in vivo by agouti-related protein. Science 278:135–138 [DOI] [PubMed] [Google Scholar]
- Butler AA 2006 The melanocortin system and energy balance. Peptides 27:301–309 [DOI] [PubMed] [Google Scholar]
- Chen AS, Metzger JM, Trumbauer ME, Guan XM, Yu H, Frazier EG, Marsh DJ, Forrest MJ, Gopal-Truter S, Fisher J, Camacho RE, Strack AM, Mellin TN, MacIntyre DE, Chen HY, Van der Ploeg LH 2000 Role of the melanocortin-4 receptor in metabolic rate and food intake in mice. Transgenic Res 9:145–154 [DOI] [PubMed] [Google Scholar]
- Marsh DJ, Hollopeter G, Huszar D, Laufer R, Yagaloff KA, Fisher SL, Burn P, Palmiter RD 1999 Response of melanocortin-4 receptor-deficient mice to anorectic and orexigenic peptides. Nat Genet 21:119–122 [DOI] [PubMed] [Google Scholar]
- Balthasar N, Dalgaard LT, Lee CE, Yu J, Funahashi H, Williams T, Ferreira M, Tang V, McGovern RA, Kenny CD, Christiansen LM, Edelstein E, Choi B, Boss O, Aschkenasi C, Zhang CY, Mountjoy K, Kishi T, Elmquist JK, Lowell BB 2005 Divergence of melanocortin pathways in the control of food intake and energy expenditure. Cell 123:493–505 [DOI] [PubMed] [Google Scholar]
- Kas MJ, Tiesjema B, van Dijk G, Garner KM, Barsh GS, Brake OT, Verhaagen J, Adan RA 2004 Induction of brain region-specific forms of obesity by agouti. J Neurosci 24:10176–10181 [DOI] [PMC free article] [PubMed] [Google Scholar]
- Grill HJ, Ginsberg AB, Seeley RJ, Kaplan JM 1998 Brainstem application of melanocortin receptor ligands produces long- lasting effects on feeding and body weight. J Neurosci 18:10128–10135 [DOI] [PMC free article] [PubMed] [Google Scholar]
- Cowley MA, Pronchuk N, Fan W, Dinulescu DM, Colmers WF, Cone RD 1999 Integration of NPY, AGRP, and melanocortin signals in the hypothalamic paraventricular nucleus: evidence of a cellular basis for the adipostat. Neuron 24:155–163 [DOI] [PubMed] [Google Scholar]
- Butler AA, Marks DL, Fan W, Kuhn CM, Bartolome M, Cone RD 2001 Melanocortin-4 receptor is required for acute homeostatic responses to increased dietary fat. Nat Neurosci 4:605–611 [DOI] [PubMed] [Google Scholar]
- Weide K, Christ N, Moar KM, Arens J, Hinney A, Mercer JG, Eiden S, Schmidt I 2003 Hyperphagia, not hypometabolism, causes early onset obesity in melanocortin-4 receptor knockout mice. Physiol Genom 13:47–56 [DOI] [PubMed] [Google Scholar]
- Huszar D, Lynch CA, Fairchild-Huntress V, Dunmore JH, Fang Q, Berkemeier LR, Gu W, Kesterson RA, Boston BA, Cone RD, Smith FJ, Campfield LA, Burn P, Lee F 1997 Targeted disruption of the melanocortin-4 receptor results in obesity in mice. Cell 88:131–141 [DOI] [PubMed] [Google Scholar]
- Albarado DC, McClaine J, Stephens JM, Mynatt RL, Ye J, Bannon AW, Richards WG, Butler AA 2004 Impaired coordination of nutrient intake and substrate oxidation in melanocortin-4 receptor knockout mice. Endocrinology 145:243–252 [DOI] [PubMed] [Google Scholar]
- Sutton GM, Trevaskis JL, Hulver MW, McMillan RP, Markward NJ, Babin MJ, Meyer EA, Butler AA 2006 Diet-genotype interactions in the development of the obese, insulin-resistant phenotype of C57BL/6J mice lacking melanocortin-3 or -4 receptors. Endocrinology 147:2183–2196 [DOI] [PMC free article] [PubMed] [Google Scholar]
- Challis BG, Coll AP, Yeo GS, Pinnock SB, Dickson SL, Thresher RR, Dixon J, Zahn D, Rochford JJ, White A, Oliver RL, Millington G, Aparicio SA, Colledge WH, Russ AP, Carlton MB, O’Rahilly S 2004 Mice lacking pro-opiomelanocortin are sensitive to high-fat feeding but respond normally to the acute anorectic effects of peptide-YY(3–36). Proc Natl Acad Sci USA 101:4695–4700 [DOI] [PMC free article] [PubMed] [Google Scholar]
- Farooqi IS, Drop S, Clements A, Keogh JM, Biernacka J, Lowenbein S, Challis BG, O’Rahilly S 2006 Heterozygosity for a POMC-null mutation and increased obesity risk in humans. Diabetes 55:2549–2553 [DOI] [PubMed] [Google Scholar]
- Farooqi S, O’Rahilly S 2006 Genetics of obesity in humans. Endocr Rev 27:710–718 [DOI] [PubMed] [Google Scholar]
- Morton GJ, Cummings DE, Baskin DG, Barsh GS, Schwartz MW 2006 Central nervous system control of food intake and body weight. Nature 443:289–295 [DOI] [PubMed] [Google Scholar]
- Cone RD 2006 Studies on the physiological functions of the melanocortin system. Endocr Rev 27:736–749 [DOI] [PubMed] [Google Scholar]
- Enriori PJ, Evans AE, Sinnayah P, Jobst EE, Tonelli-Lemos L, Billes SK, Glavas MM, Grayson BE, Perello M, Nillni EA, Grove KL, Cowley MA 2007 Diet-induced obesity causes severe but reversible leptin resistance in arcuate melanocortin neurons. Cell Metab 5:181–194 [DOI] [PubMed] [Google Scholar]
- Schwartz MW, Seeley RJ, Woods SC, Weigle DS, Campfield LA, Burn P, Baskin DG 1997 Leptin increases hypothalamic pro-opiomelanocortin mRNA expression in the rostral arcuate nucleus. Diabetes 46:2119–2123 [DOI] [PubMed] [Google Scholar]
- Thornton JE, Cheung CC, Clifton DK, Steiner RA 1997 Regulation of hypothalamic proopiomelanocortin mRNA by leptin in ob/ob mice. Endocrinology 138:5063–5066 [DOI] [PubMed] [Google Scholar]
- Shutter JR, Graham M, Kinsey AC, Scully S, Luthy R, Stark KL 1997 Hypothalamic expression of ART, a novel gene related to agouti, is up- regulated in obese and diabetic mutant mice. Genes Dev 11:593–602 [DOI] [PubMed] [Google Scholar]
- Seeley RJ, Yagaloff KA, Fisher SL, Burn P, Thiele TE, van Dijk G, Baskin DG, Schwartz MW 1997 Melanocortin receptors in leptin effects. Nature 390:349 [DOI] [PubMed] [Google Scholar]
- Trevaskis JL, Butler AA 2005 Double leptin (Lepob) and melanocortin-4 receptor (Mc4r) gene mutations have an additive effect on fat mass, and are associated with reduced effects of leptin on weight loss and food intake. Endocrinology 146:4257–4265 [DOI] [PubMed] [Google Scholar]
- Grill HJ 2006 Distributed neural control of energy balance: contributions from hindbrain and hypothalamus. Obesity (Silver Spring) 14(Suppl 5):216S–221S [DOI] [PubMed] [Google Scholar]
- Montague CT, Farooqi IS, Whitehead JP, Soos MA, Rau H, Wareham NJ, Sewter CP, Digby JE, Mohammed SN, Hurst JA, Cheetham CH, Earley AR, Barnett AH, Prins JB, O’Rahilly S 1997 Congenital leptin deficiency is associated with severe early-onset obesity in humans. Nature 387:903–908 [DOI] [PubMed] [Google Scholar]
- Coleman DL 1978 Obese and diabetes: two mutant genes causing diabetes-obesity syndromes in mice. Diabetologia 14:141–148 [DOI] [PubMed] [Google Scholar]
- Zhang Y, Proenca R, Maffei M, Barone M, Leopold L, Friedman JM 1994 Positional cloning of the mouse obese gene and its human homologue. Nature 372:425–432 [DOI] [PubMed] [Google Scholar]
- Farooqi IS, Keogh JM, Kamath S, Jones S, Gibson WT, Trussell R, Jebb SA, Lip GY, O’Rahilly S 2001 Partial leptin deficiency and human adiposity. Nature 414:34–35 [DOI] [PubMed] [Google Scholar]
- Chung WK, Belfi K, Chua M, Wiley J, Mackintosh R, Nicolson M, Boozer CN, Leibel RL 1998 Heterozygosity for Lep(ob) or Lep(rdb) affects body composition and leptin homeostasis in adult mice. Am J Physiol 274(4 Pt 2):R985–R990 [DOI] [PubMed] [Google Scholar]
- Flatt PR, Bailey CJ 1981 Abnormal plasma glucose and insulin responses in heterozygous lean (ob/+) mice. Diabetologia 20:573–577 [DOI] [PubMed] [Google Scholar]
- Kopelman PG 2000 Obesity as a medical problem. Nature 404:635–643 [DOI] [PubMed] [Google Scholar]
- Rankinen T, Bouchard C 2006 Genetics of food intake and eating behavior phenotypes in humans. Annu Rev Nutr 26:413–434 [DOI] [PubMed] [Google Scholar]
- Rankinen T, Zuberi A, Chagnon YC, Weisnagel SJ, Argyropoulos G, Walts B, Perusse L, Bouchard C 2006 The human obesity gene map: the 2005 update. Obesity (Silver Spring) 14:529–644 [DOI] [PubMed] [Google Scholar]
- Koza RA, Nikonova L, Hogan J, Rim JS, Mendoza T, Faulk C, Skaf J, Kozak LP 2006 Changes in gene expression foreshadow diet-induced obesity in genetically identical mice. PLoS Genet 2:e81 [DOI] [PMC free article] [PubMed] [Google Scholar]
- Boston BA, Blaydon KM, Varnerin J, Cone RD 1997 Independent and additive effects of central POMC and leptin pathways on murine obesity. Science 278:1641–1644 [DOI] [PubMed] [Google Scholar]
- Tinsley FC, Taicher GZ, Heiman ML 2004 Evaluation of a quantitative magnetic resonance method for mouse whole body composition analysis. Obes Res 12:150–160 [DOI] [PubMed] [Google Scholar]
- Xu H, Barnes GT, Yang Q, Tan G, Yang D, Chou CJ, Sole J, Nichols A, Ross JS, Tartaglia LA, Chen H 2003 Chronic inflammation in fat plays a crucial role in the development of obesity-related insulin resistance. J Clin Invest 112:1821–1830 [DOI] [PMC free article] [PubMed] [Google Scholar]
- Collins S, Martin TL, Surwit RS, Robidoux J 2004 Genetic vulnerability to diet-induced obesity in the C57BL/6J mouse: physiological and molecular characteristics. Physiol Behav 81:243–248 [DOI] [PubMed] [Google Scholar]
- Weisberg SP, McCann D, Desai M, Rosenbaum M, Leibel RL, Ferrante Jr AW 2003 Obesity is associated with macrophage accumulation in adipose tissue. J Clin Invest 112:1796–1808 [DOI] [PMC free article] [PubMed] [Google Scholar]
- Coppari R, Ichinose M, Lee CE, Pullen AE, Kenny CD, McGovern RA, Tang V, Liu SM, Ludwig T, Chua SCJ, Lowell BB, Elmquist JK 2005 The hypothalamic arcuate nucleus: a key site for mediating leptin’s effects on glucose homeostasis and locomotor activity. Cell Metab 1:63–72 [DOI] [PubMed] [Google Scholar]
- Pelleymounter MA, Cullen MJ, Baker MB, Hecht R, Winters D, Boone T, Collins F 1995 Effects of the obese gene product on body weight regulation in ob/ob mice. Science 269:540–543 [DOI] [PubMed] [Google Scholar]
- Hotamisligil GS 2006 Inflammation and metabolic disorders. Nature 444:860–867 [DOI] [PubMed] [Google Scholar]
- Howard JK, Cave BJ, Oksanen LJ, Tzameli I, Bjorbaek C, Flier JS 2004 Enhanced leptin sensitivity and attenuation of diet-induced obesity in mice with haploinsufficiency of Socs3. Nat Med 10:734–738 [DOI] [PubMed] [Google Scholar]
- Mori H, Hanada R, Hanada T, Aki D, Mashima R, Nishinakamura H, Torisu T, Chien KR, Yasukawa H, Yoshimura A 2004 Socs3 deficiency in the brain elevates leptin sensitivity and confers resistance to diet-induced obesity. Nat Med 10:739–743 [DOI] [PubMed] [Google Scholar]
- Zabolotny JM, Bence-Hanulec KK, Stricker-Krongrad A, Haj F, Wang Y, Minokoshi Y, Kim YB, Elmquist JK, Tartaglia LA, Kahn BB, Neel BG 2002 PTP1B regulates leptin signal transduction in vivo. Dev Cell 2:489–495 [DOI] [PubMed] [Google Scholar]
- Lord GM 2006 Leptin as a proinflammatory cytokine. Contrib Nephrol 151:151–164 [DOI] [PubMed] [Google Scholar]
- Farooqi IS, Matarese G, Lord GM, Keogh JM, Lawrence E, Agwu C, Sanna V, Jebb SA, Perna F, Fontana S, Lechler RI, DePaoli AM, O’Rahilly S 2002 Beneficial effects of leptin on obesity, T cell hyporesponsiveness, and neuroendocrine/metabolic dysfunction of human congenital leptin deficiency. J Clin Invest 110:1093–1103 [DOI] [PMC free article] [PubMed] [Google Scholar]
- Ahima RS, Prabakaran D, Mantzoros C, Qu D, Lowell B, Maratos-Flier E, Flier JS 1996 Role of leptin in the neuroendocrine response to fasting. Nature 382:250–252 [DOI] [PubMed] [Google Scholar]
- Ravussin E, Pratley RE, Maffei M, Wang H, Friedman JM, Bennett PH, Bogardus C 1997 Relatively low plasma leptin concentrations precede weight gain in Pima Indians. Nat Med 3:238–240 [DOI] [PubMed] [Google Scholar]
- Franks PW, Brage S, Luan J, Ekelund U, Rahman M, Farooqi IS, Halsall I, O’Rahilly S, Wareham NJ 2005 Leptin predicts a worsening of the features of the metabolic syndrome independently of obesity. Obes Res 13:1476–1484 [DOI] [PubMed] [Google Scholar]
- Halaas JL, Boozer C, Blair-West J, Fidahusein N, Denton DA, Friedman JM 1997 Physiological response to long-term peripheral and central leptin infusion in lean and obese mice. Proc Natl Acad Sci USA 94:8878–8883 [DOI] [PMC free article] [PubMed] [Google Scholar]
- Munzberg H, Flier JS, Bjorbaek C 2004 Region-specific leptin resistance within the hypothalamus of diet-induced obese mice. Endocrinology 145:4880–4889 [DOI] [PubMed] [Google Scholar]
- Shimizu H, Shimomura Y, Nakanishi Y, Futawatari T, Ohtani K, Sato N, Mori M 1997 Estrogen increases in vivo leptin production in rats and human subjects. J Endocrinol 154:285–292 [DOI] [PubMed] [Google Scholar]
- Clegg DJ, Brown LM, Woods SC, Benoit SC 2006 Gonadal hormones determine sensitivity to central leptin and insulin. Diabetes 55:978–987 [DOI] [PubMed] [Google Scholar]
- Surwit RS, Kuhn CM, Cochrane C, McCubbin JA, Feinglos MN 1988 Diet-induced type II diabetes in C57BL/6J mice. Diabetes 37:1163–1167 [DOI] [PubMed] [Google Scholar]
- Tortoriello DV, McMinn J, Chua SC 2004 Dietary-induced obesity and hypothalamic infertility in female DBA/2J mice. Endocrinology 145:1238–1247 [DOI] [PubMed] [Google Scholar]
- Johnston SL, Souter DM, Tolkamp BJ, Gordon IJ, Illius AW, Kyriazakis I, Speakman JR 2007 Intake compensates for resting metabolic rate variation in female C57BL/6J mice fed high-fat diets. Obesity (Silver Spring) 15:600–606 [DOI] [PubMed] [Google Scholar]