

Abstract
We demonstrate a minimally invasive nuclear magnetic resonance (NMR) technique that enables determination of the surface-area-to-volume ratio (S/V) of soft porous materials from measurements of the diffusive exchange of laser-polarized 129Xe between gas in the pore space and 129Xe dissolved in the solid phase. We apply this NMR technique to porous polymer samples and find approximate agreement with destructive stereological measurements of S/V obtained with optical confocal microscopy. Potential applications of laser-polarized xenon interphase exchange NMR include measurements of in vivo lung function in humans and characterization of gas chromatography columns.
Porous media are ubiquitous in nature, e.g., granular materials, foams, ceramics, oil- or water-bearing ‘reservoir’ rocks, and animal and human lungs. Determining the structure of these materials is relevant to a wide range of scientific and technological problems, ranging from the coarsening of foams to the transport properties of subsurface fluids to cardiopulmonary physiology and medicine. In this letter we demonstrate a non-invasive technique for characterizing the surface-area-to-volume ratio (S/V) [1] of ‘soft’ porous media: i.e., materials in which there is significant gas solubility in the solid phase. Such a description applies to many different materials, including porous polymer granulates used for filtering, porous polymer bead packs used for radio-immunoassay, resin columns used for chromatographic separation, and lung and sinus tissue in humans and animals.
S/V influences numerous interactions within porous media, including fluid diffusion and transport, electric charge distribution, and chemical exchange. For example, S/V is important in determining pulmonary function since the lung is the site of O2 and CO2 exchange between the body and the external environment. There are numerous techniques for measuring S/V in porous media, including stereology [2] with traditional and confocal microscopy, light scattering [4, 5], and mercury intrusion porosimetry [5]. However, only nuclear magnetic resonance (NMR) provides a non-invasive and non-destructive technique for determining three-dimensional structure, including S/V [6].
In particular, NMR measurements of the time-dependent diffusion coefficient of a liquid filling the pore space has been used to determine S/V in a variety of porous media [7, 8] including glass beads [9], reservoir rocks [10], and biological samples [11]. Recently, we extended this technique to NMR measurements of xenon gas diffusion within porous media [12, 13], thereby probing longer length scales than with traditional liquid-infused diffusion measurements [9,10] because of fast gas diffusion and long xenon spin polarization lifetimes. Gas diffusion NMR may also be used to study porous media that are not compatible with water saturation, such as non-wetting polymers and in vivo lungs. However, for materials with pore size less than about 300 μm (such as lung alveoli), the high diffusivity of gases causes systematic errors in the determination of S/V because the rms diffusion distance during the application of RF and magnetic field gradient pulses is comparable to the mean pore size [12–14]. Reducing this effect with faster gradient pulses, buffer gases, or higher gas pressures is impractical [15].
Thus we have devised an alternative NMR method (‘xenon interphase exchange NMR’) to measure S/V in soft (i.e., xenon-soluble) porous media. In this technique we determine S/V from the rate of 129Xe polarization (not chemical) exchange between gas in the pore space and 129Xe dissolved in the solid. First, we infuse the sample with laser-polarized (i.e., highly spin-polarized or hyperpolarized) 129Xe gas. Next, we rapidly destroy (‘quench’) all dissolved-phase 129Xe polarization using a suitable sequence of randomly spaced frequency-selective RF pulses. The result is an initial condition of NMR-labelled (i.e., polarized) 129Xe in the gas phase with unpolarized 129Xe in the dissolved phase. We then measure the diffusion of 129Xe polarization into the dissolved phase by monitoring the recovery of the NMR signal at the chemically shifted frequency of dissolved-phase 129Xe. The rate of increase of the dissolved-phase 129Xe NMR signal is proportional to S/V (see the analysis below).
Fast, high-resolution NMR measurements of the nuclear spin- noble gases 3He and 129Xe are possible with optical pumping techniques using high-power lasers which increase the noble-gas spin polarization to ~1–10% [16]. Laser-polarized noble-gas NMR is a powerful technique in the physical and biomedical sciences, e.g., in lung imaging [17]. For interphase exchange measurements, 129Xe is used rather than 3He because of two factors. First, 129Xe dissolves about ten times more readily than 3He in lipophilic compounds: e.g., 129Xe has a large dissolved/gas partition coefficient of ~0.25 for lung tissue [18]. Second, the gas and dissolved-phase 129Xe NMR frequencies are typically separated (chemically shifted) by ~200 ppm, a relatively large value (the typical 3He chemical shift is <1 ppm) which makes it easy to manipulate or observe 129Xe spins selectively in either phase [19]. Experiments utilizing this chemical shift difference of xenon dissolved in blood or tissue are now common [20].
Xenon interphase exchange NMR may be particularly important for the human lung where the mean pore (alveolar) size is ~100 μm [3, 4]. A non-invasive method for measuring and imaging S/V and gas exchange in the human lung could be an important tool for probing lung physiology and pathophysiology [21]; e.g., in the diagnosis and treatment of asthma and chronic obstructive pulmonary disease (COPD), the fourth leading cause of death in the US [22]. Traditional lung function tests of gas exchange parameters are seriously limited by the inability to provoke step changes in gas composition or properties deep in the lung. Deconvolving the effects of ventilatory dilution, tissue absorption, and blood perfusion is a major challenge. By contrast, xenon interphase exchange NMR provides an almost ideal step change in 129Xe polarization between tissue and gas, and thus offers a unique window into lung structure and function. For example, subsequent to our announcement of preliminary results using xenon interphase exchange NMR [23], Ruppert et al [24] successfully applied a similar technique to studies of lung function in dogs. Xenon interphase exchange NMR may also be a powerful tool in the characterization of non-living, soft porous media. For example, knowledge and control of S/V in packed columns of polymeric beads—commonly used in molecular fractionation applications—is critical to achieving adequate molecular separation.
In the study reported here, we monitored the exchange of 129Xe polarization from the gas phase into the dissolved phase in a xenon-soluble porous polymer granulate (POREX Corp., Atlanta, GA), chosen as a model (with respect to mean pore size) for lung tissue. We investigated four different samples, which the manufacturer stated as having median pore sizes of 20, 70, 120, and 250 μm (obtained with mercury intrusion porosimetry on random production samples) and similar porosities of ~30%. The interphase exchange experimental protocol was as follows. First, we filled a glass container completely with a porous polymer sample, excluding free gas outside the cylindrical polymer core. Next, we placed the sample in an NMR magnet, pumped out the air from the sample’s pore space, and allowed laser-polarized xenon gas to fill the space. (NMR imaging showed that the xenon gas uniformly filled the pore space within a few seconds.) We then used a frequency-selective RF pulse to quench the dissolved-phase 129Xe polarization, and observed the recovery of the dissolved-phase 129Xe NMR signal due to interphase exchange for times from 10 to 1000 ms. The NMR pulse sequence for the interphase exchange measurement is shown schematically in figure 1. Note that we made an initial measurement of the gas-phase 129Xe NMR signal using an RF pulse with a small flip angle, α ~ 3°–5°. Also, the selective RF pulse at the dissolved-phase 129Xe NMR frequency was not perfect and hence generated a small NMR signal from 129Xe gas in the pores. We exploited these gas-phase signals to correct the data for slowly decreasing 129Xe polarization due to both RF depletion and T1-relaxation in the pores. We performed xenon interphase exchange experiments on two NMR spectrometers at different magnetic field strengths: a horizontal-bore GE Omega/CSI spectrometer operating at 4.7 T (55.3 MHz 129Xe NMR frequency); and a modified SMIS spectrometer interfaced to a prototype IBM horizontal-bore magnet operating at 1.5 T (17.6 MHz 129Xe NMR frequency). For each experimental run, we used the spin-exchange optical pumping technique [16] in the fringe field of the NMR magnet and achieved ~0.5% 129Xe spin polarization for ~2 bar l (l standing for litres) of xenon gas (natural isotopic abundance). An example of the observed interphase exchange spectra is shown in figure 2.
Figure 1.
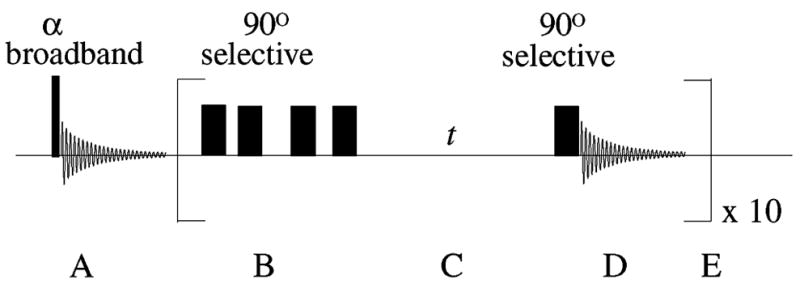
The xenon interphase exchange NMR pulse sequence. The sequence can be divided into the following segments. A: interrogation of the gas-phase NMR signal (sgas) with a small-flip-angle broadband RF pulse; sgas is proportional to the 129Xe polarization. B: a semi-selective saturation train of RF pulses to destroy the dissolved-phase 129Xe polarization. C: the interphase exchange time, t. D: a semi-selective 90° RF pulse to observe the recovery of the dissolved-phase 129Xe signal (sdiss (t)); this RF pulse also excites a small gas-phase signal, allowing correction for incremental loss of gas-phase magnetization. E: interphase exchange measurement, typically repeated ten times for each exchange time, t. Typical sequence parameters for the 4.7 T instrument: broadband ~5° pulse width/power of 2.2 μs/75 W; semi-selective 90° pulse width/power of 610 μs/10 W; random delays between saturation pulses ~3–60 ms; t ~ 10–1000 ms; acquisition time of 20.5 ms.
Figure 2.

Dissolved-phase xenon NMR spectra as a function of interphase exchange time for the nominally 20 μm pore-size sample. The peaks at 0 ppm arise from the weak, far-off-resonance excitation of gas-phase polarized 129Xe when dissolved-phase 129Xe is pulsed semi-selectively. Following saturation, the dissolved-phase 129Xe peaks at 200 ppm show recovery as a function of exchange time. The observed spectra are scaled to normalize the integrals of each gas peak to the gas peak in the first exchange spectrum; this normalization accounts for the slow loss of gas-phase magnetization due to exchange, RF depletion, and T1 relaxation.
Calculation of absolute values for S/V required prior characterization of the samples. We used thermally polarized xenon NMR for both spectrometers to determine the porosity φ and 129Xe partition coefficient b for the four porous polymer samples. We placed all four sample cells on a manifold along with an empty cell of equal volume, admitted ~3 bar of xenon gas (natural isotopic abundance) and ~2 bar of oxygen, and allowed the system to equilibrate over 2–3 days to achieve full penetration of xenon into the polymer samples. We then measured the 129Xe NMR gas signal in the empty cell (sg0) as well as the equilibrium gas and dissolved-phase 129Xe NMR signals (sgas, sdiss) in the four polymer samples. For each sample, φ = sgas/sg0 and b = (sdiss/sgas)φ/(1 − φ). We obtained similar results for φ and b at 4.7 and 1.5 T. Measurement of the dissolved-phase 129Xe diffusion coefficient Ddiss required large magnetic field gradients, which was only possible across small sample dimensions. Hence we cut additional pieces of each polymer sample to fit in standard 5 mm diameter NMR spectroscopy tubes and filled the tubes with ~10 bar xenon gas (isotopically enriched to 90% 129Xe). We then measured Ddiss using a 9.4 T Bruker AMX2 spectrometer with 50 G cm−1 field gradients, employing a modified pulsed-gradient technique previously applied to gas-phase diffusion measurements on rocks and glass beads [12]. Table 1 lists the measured values of φ, b, and Ddiss, along with the 129Xe longitudinal spin relaxation times (T1) for each porous polymer sample.
Table 1.
For each porous polymer sample, measured values are listed for the porosity φ, the 129Xe gas/polymer partition coefficient b, and the dissolved-phase 129Xe diffusion coefficient Ddiss. Also listed are the 129Xe longitudinal spin relaxation time (polarization lifetime) in the dissolved phase (T1diss) and the pore gas phase (T1gas). The nominal pore size is that provided by the polymer manufacturer from mercury intrusion porosimetry measurements on random production samples. Note: T1diss was the same at 4.7 and 1.5 T; also, Ddiss was not measured for the nominally 120 μm sample because the dissolved-phase 129Xe NMR signal from this sample was too low to allow the experiment to be completed in a reasonable time. Listed measurement uncertainties do not include estimates of systematic errors.
| Nominal pore size (μm) | 20 | 70 | 120 | 250 |
|---|---|---|---|---|
| Porosity, φ | 0.45 ± 0.02 | 0.45 ± 0.03 | 0.46 ± 0.01 | 0.43 ± 0.02 |
| Xe partition coefficient, b | 0.64 ± 0.02 | 0.52 ± 0.04 | 0.56 ± 0.03 | 0.63 ± 0.03 |
| Xe Ddiss (10−12 m2 s−1) | 5.6 ± 0.5 | 7.0 ± 0.7 | n/a | 7.2 ± 0.7 |
| Xe T1diss (s) at 4.7 T | 8.1 ± 0.4 | 7.7 ± 0.3 | 7.6 ± 0.3 | 8.0 ± 0.3 |
| Xe T1gas (s) at 1.5 T | 21.8 ± 0.5 | 34.1 ± 0.5 | 35.4 ± 0.4 | 19.9 ± 0.2 |
| Xe T1gas (s) at 4.7 T | 41.6 ± 0.6 | 68.1 ± 1.4 | 70.0 ± 1.6 | 42.8 ± 0.6 |
To determine S/V from the xenon interphase exchange NMR measurements, we employed an one-dimensional diffusion model, asymptotically valid for short times. We assumed that the density of dissolved-phase 129Xe polarization, ρdiss(x, t), satisfies the diffusion equation on a half-space, x > 0, where the non-trivial spatial coordinate x is normal to the gas/solid interface. The quench of the dissolved-phase 129Xe polarization created the initial condition ρdiss(x, 0) = 0, x > 0. Given the much greater gas-phase 129Xe density, we also assumed a fixed boundary condition ρdiss(0, t) = bρgas. Here, ρgas is the density of gas-phase 129Xe polarization, which we found to be constant during an individual interphase exchange measurement except for the small effects of RF depletion and slow T1-relaxation mentioned above. The solution of the diffusion equation for ρdiss(x, t) is given by the well known error function [25]. The number of dissolved-phase polarized 129Xe atoms Ndiss(t) can then be obtained by direct integration of the density or by solving the ordinary differential equation obtained by integrating the diffusion equation. The result is:
| (1) |
where S is the total pore-space surface area of the sample, and the Euclidean volume V of the sample has been introduced as a common divisor on both sides of the equation. Noting that
| (2) |
where Ngas is the number of gas-phase polarized 129Xe atoms (assumed constant except for RF depletion and T1-relaxation), equation (1) can be rewritten as
| (3) |
Ndiss(t) and Ngas are proportional to the frequency integrals over the observed 129Xe NMR spectral peaks, sdiss(t, ω) and sgas(ω), for the dissolved and gas phases respectively. Thus we have
| (4) |
We determined S/V by fitting the ratio of dissolved and gas-phase 129Xe NMR signals to and using measured values for b, φ, and Ddiss.
Concurrent with the NMR studies, we also characterized the four samples of polymer granulate using confocal microscopy in order to give independent measurements of S/V. We carefully sliced sections of each of the four polymer rods with different pore sizes, creating glass-smooth surfaces of both the longitudinal and cross-sectional faces of the rods. We oriented these sectional samples on a Leica TCS NT confocal microscope configured for 488 nm excitation and reflected light imaging [26]. The resulting microscope images showed the polymer granulates as solids, and the pore spaces as black voids. Computer-based image analysis (ImageSpace, Molecular Dynamics, Sunnyvale, CA) superimposed multiple, equally spaced lines across the images, and interface boundaries on each line of the images were counted. Thus for each sample we determined the mean linear intercept, Lm, which is defined as the average distance between phase boundaries in an image. While Lm is but one of several possible measures of pore size, it has the unique and powerful advantage of being stereologically related to the surface-to-volume ratio. In particular, Lm is an unbiased estimator of S/V in the image plane: Lm = 2(S/V)−1 [27]. See table 2 for the optically determined values of Lm and S/V.
Table 2.
The surface-area-to-volume ratios (S/V) derived from the optical and NMR measurements are listed for each of the four polymer samples. Also listed is the mean linear intercept, Lm = 2(S/V)− 1, determined from the optical microscopy measurements. Listed measurement uncertainties do not include estimates of systematic errors.
| Nominal pore size (μm) | 20 | 70 | 120 | 250 |
|---|---|---|---|---|
| S/V from xenon NMR (μm−1) | 0.030 ± 0.006 | 0.016 ± 0.005 | 0.016 ± 0.003 | 0.018 ± 0.003 |
| S/V from microscopy (μm−1) | 0.0229 ± 0.0004 | 0.0135 ± 0.0003 | 0.0122 ± 0.0003 | 0.0127 ± 0.0003 |
| Lm from microscopy (μm) | 87.3 ± 1.7 | 147.8 ± 3.9 | 164.3 ± 4.5 | 158.0 ± 4.3 |
We acquired three xenon interphase exchange data sets for each of the four polymer samples with different pore sizes: two data sets at 4.7 T and one at 1.5 T. As an example, figure 3 shows the two interphase exchange data sets taken on the 4.7 T instrument, plotted as a function of to clearly illustrate the short-time data, where the theory predicts that the signal should be linear with , and the slope ~S/V. Each of the points plotted in figure 3 consists of the normalized average of three or four separate series of exchange spectra, acquired consecutively on a single day, of the type shown in figure 2. The normalized xenon integral displayed on the ordinate of figure 3 is given by 〈I (t)〉 φ sin α/b (see equation (4)), where α is the small flip angle of the RF pulse used in the initial gas-phase interrogation. All xenon interphase exchange NMR data followed the expected trend over nearly the entire observed range of exchange times (out to ~1 s).
Figure 3.

Two sets of xenon interphase exchange NMR data, acquired at 4.7 T on different days, for each of the four porous polymer samples. (a) Day 1. (b) Day 2. (The polymer samples are indicated in the figure by the manufacturer’s claimed pore size.) Each datum point represents the weighted mean of 3–4 normalized spectra of the type illustrated in figure 2, acquired in repeated runs of the experiment on the same day. The normalized xenon integral plotted on the ordinate is thus given by 〈I (t)〉 φ sin α/b (see equation (4)). Uncertainties for each interphase exchange spectrum were determined from the measured rms noise within the spectral bandwidth, normalized for variations in gas-phase magnetization; one-standard-deviation error bars were then calculated for the normalized xenon integrals. The error bars are larger for longer exchange times because these data were acquired later in each experimental run and hence had lower gas-phase magnetization, which correspondingly increased the normalized noise of the dissolved-phase xenon spectra. The straight lines indicate the fits to at short times, from which S/V was calculated.
Figure 4 compares S/V values derived from the optical and NMR techniques for each of the four polymer samples: one optical and three NMR data sets (see also table 2). The solid line in figure 4 is the line of identity for the optical and NMR values of S/V ; the dashed line is a line of regression constrained to go through the origin. The slope of the regression line is 1.27 ± 0.18, indicating approximate agreement between the optical and NMR measures of S/V. Sources of systematic error in the interphase exchange NMR measurement include: miscalibration of the flip angle α of the gas-phase interrogation RF pulse; inaccuracy in the dissolved-phase xenon diffusion coefficient measurements; and deviations from the simple, one-dimensional diffusion model used to derive S/V. For example, the very low dissolved-phase xenon NMR signal from the nominally 120 μm POREX sample prevented us from measuring Ddiss for this sample. Instead, we used the average of the measured Ddiss-values for the nominally 70 and 250 μm samples to calculate S/V from the interphase exchange measurements for the 120 μm sample.
Figure 4.

Comparison of polymer pore-space S/V values obtained with optical microscopy and NMR. For each of the four polymer samples, three NMR experimental runs are plotted versus one optical measurement. The solid line is a line of unity for the S/V values provided by the two measurement techniques. The dashed line indicates a regression between the NMR and optical S/V values, constrained to pass through the origin; this regression line has a slope of 1.27 ± 0.18. The symbols denote data acquired at 1.5 T (circles), 4.7 T day 1 (figure 3(a)—triangles) and 4.7 T day 2 (figure 3(b)—squares).
We note that the manufacturer’s quoted pore sizes for the four porous polymer samples do not agree with our pooled optical and NMR measurements of S/V (and hence Lm); even the rank order does not agree. This discrepancy may not be surprising, since the pore sizes given by the manufacturer were determined by mercury intrusion porosimetry [5, 28], which is primarily a probe of minimum pore-throat size and thus not necessarily a good measure of Lm or S/V [27]. We emphasize that there are different choices of the definition of pore size; which choice is most appropriate will depend on the particular application.
In conclusion, we have demonstrated a new technique, xenon interphase exchange NMR, that provides a minimally invasive and non-destructive probe of the surface-area-to-volume ratio (S/V) of xenon-soluble porous materials. We have applied this technique to porous polymer samples and found approximate agreement with destructive stereological measurements of S/V made with optical confocal microscopy.
Acknowledgments
We thank Professor David Cory for access to the 9.4 T NMR instrument, and Dr Werner Maas for the loan of a gradient-equipped x-nucleus probe. We also acknowledge Ben Hirokawa at POREX Corp. who provided us with porous polymer granulate samples. This work was funded by NASA grant NAG9-1166, NIH grants R21-RR/CA14297 and R01 HL-55569, and the Smithsonian Institution Scholarly Studies Program.
References
- 1.Mitra PP, Sen PN, Schwartz LM. Phys Rev. 1993 ;B 47:8565. doi: 10.1103/physrevb.47.8565. [DOI] [PubMed] [Google Scholar]
- 2.Weibel ER. Stereological Methods. New York: Academic; 1980. [Google Scholar]
- 3.Butler JP, Suzuki S, Oldmixon E, Hoppin FG., Jr J Appl Physiol. 1985 ;58:89. doi: 10.1152/jappl.1985.58.1.89. [DOI] [PubMed] [Google Scholar]
- 4.Suzuki S, Butler JP, Oldmixon E, Hoppin FG., Jr J Appl Physiol. 1985 ;58:97. doi: 10.1152/jappl.1985.58.1.97. [DOI] [PubMed] [Google Scholar]
- 5.Wong PZ. Methods in the Physics of Porous Media. London: Academic; 1999. [Google Scholar]
- 6.Callaghan PT. Principles of Nuclear Magnetic Resonance Microscopy. London: Oxford University Press; 1991 . [Google Scholar]
- 7.Stejskal EO, Tanner JE. J Chem Phys. 1965;42:288. [Google Scholar]; Tanner JE, Stejskal EO. J Chem Phys. 1968;49:1768. [Google Scholar]
- 8.Latour LL, Li L, Sotak CH. J Magn Reson. 1993 ;B 101:72. [Google Scholar]
- 9.Latour LL, Mitra P, Kleinberg RL, Sotak CH. J Magn Reson. 1993;A 101:342. [Google Scholar]
- 10.Hürlimann MD, Helmer KG, Latour LL, Sotak CH. J Magn Reson. 1994;A 111:169. doi: 10.1016/0730-725x(94)91548-2. [DOI] [PubMed] [Google Scholar]
- 11.Helmer KG, Dardzinski BJ, Sotak CH. NMR Biomed. 1995;8:297. doi: 10.1002/nbm.1940080705. [DOI] [PubMed] [Google Scholar]
- 12.Mair RW, Cory DG, Peled S, Tseng C-H, Patz S, Walsworth RL. J Magn Reson. 1998 ;135:478. doi: 10.1006/jmre.1998.1588. [DOI] [PubMed] [Google Scholar]
- 13.Mair RW, Wong GP, Hoffmann D, Hürlimann MD, Patz S, Schwartz LM, Walsworth RL. Phys Rev Lett. 1999 ;83:3324. doi: 10.1103/PhysRevLett.83.3324. [DOI] [PubMed] [Google Scholar]
- 14.Mair RW, Hürlimann MD, Sen PN, Schwartz LM, Patz S, Walsworth RL. Magn Reson Imaging. 2001 ;19:345. doi: 10.1016/s0730-725x(01)00247-8. [DOI] [PubMed] [Google Scholar]
- 15.Mair RW, Hoffmann D, Sheth S, Wong GP, Butler JP, Patz S, Topulos GP, Walsworth RL. NMR Biomed. 2000 ;13:229. doi: 10.1002/1099-1492(200006)13:4<229::aid-nbm637>3.0.co;2-s. [DOI] [PubMed] [Google Scholar]
- 16.Walker TG, Happer W. Rev Mod Phys. 1997 ;69:629. [Google Scholar]
- 17.Kauczor H-U, Surkau R, Roberts T. Eur Radiol. 1998 ;8:820. doi: 10.1007/s003300050479. [DOI] [PubMed] [Google Scholar]
- 18.Eger EI, Larson CP. Br J Anaesthesiol. 1964 ;36:140. doi: 10.1093/bja/36.3.140. [DOI] [PubMed] [Google Scholar]
- 19.Tseng C-H, Mair RW, Wong GP, Williamson D, Cory DG, Walsworth RL. Phys Rev. 1999;E 59:1785. [Google Scholar]
- 20.Goodson BM. Concepts Magn Reson. 1999;11:203. [Google Scholar]
- 21.Suzuki S, Akahori T, Miyazawa N, Numata M, Okubo T, Butler JP. J Appl Physiol. 1996 ;80:742. doi: 10.1152/jappl.1996.80.3.742. [DOI] [PubMed] [Google Scholar]
- 22.Petty TL, Weinmann GG. J Am Med Assoc. 1997 ;277:246. doi: 10.1001/jama.277.3.246. [DOI] [PubMed] [Google Scholar]
- 23.Butler JP, Patz S, Hoffmann D, Mair RW, Topulos GP, Walsworth RL. Proc. 7th ISMRM Meeting (Philadelphia); Berkeley, CA: Society for Magnetic Resonance in Medicine; 1999 . p. 317. [Google Scholar]
- 24.Ruppert K, Brookeman JR, Hagspiel KD, Mugler JP., III Magn Reson Med. 2000 ;44:349. doi: 10.1002/1522-2594(200009)44:3<349::aid-mrm2>3.0.co;2-j. [DOI] [PubMed] [Google Scholar]
- 25.Jost W. Diffusion in Solids, Liquids, Gases. New York: Academic; 1960. [Google Scholar]
- 26.Rogers RA, Antonini JM, Brismar H, Lai J, Hesterberg TW, Oldmixon EH, Thevenaz P, Brain JD. Environ Health Perspect. 1999 ;107:367. doi: 10.1289/ehp.99107367. [DOI] [PMC free article] [PubMed] [Google Scholar]
- 27.Weibel ER. Theoretical Foundations (Stereological Methods) ch 3 Vol. 2. New York: Academic; 1980. Estimation of basic stereological parameters. [Google Scholar]
- 28.Hirokawa B. private communication. POREX Corp.; Atlanta, GA: 1999. [Google Scholar]