

Abstract
The Cre/loxP system is used routinely to manipulate gene expression in the mouse nervous system. In order to delete genes specifically from the telencephalon, the Foxg1-cre line was created previously by replacing the intron-less Foxg1 coding region with cre, resulting in a Foxg1 heterozygous mouse. As the telencephalon of heterozygous Foxg1 mice was reported to be normal, this genotype often has been used as the control in subsequent analyses. Here we describe substantial disruption of forebrain development of heterozygous mice in the Foxg1-cre line, maintained on the C57BL/6J background. High resolution magnetic resonance microscopy reveals a significant reduction in the volume of the neocortex, hippocampus and striatum. The alteration in the neocortex results, in part, from a decrease in its tangential dimension, although gross patterning of the cortical sheet appears normal. This decrease is observed in three different Foxg1 heterozygous mouse lines, independent of the method of achieving deletion of the Foxg1 gene. Although Foxg1 is not expressed in the diencephalon, three-dimensional magnetic resonance microscopy revealed that thalamic volume in the adult is reduced. In contrast, at postnatal day 4, thalamic volume is normal, suggesting that interactions between cortex and dorsal thalamus postnatally produce the final adult thalamic phenotype. In the Foxg1-cre line maintained on the C57BL/6J background, the radial domain of the cerebral cortex also is disrupted substantially, particularly in supragranular layers. However, neither Foxg1 heterozygous mice of the Foxg1-tet line, nor those of the Foxg1-lacZ and Foxg1-cre lines maintained on a mixed background, displayed a reduced cortical thickness. Thus Cre recombinase contributes to the radial phenotype, although only in the context of the congenic C57BL/6J background. These observations highlight an important role for Foxg1 in cortical development, reveal noteworthy complexity in the invocation of specific mechanisms underlying phenotypes expressed following genetic manipulations and stress the importance of including appropriate controls of all genotypes.
Keywords: cortical development, supragranular layers, magnetic resonance microscopy, thalamus, patterning, telencephalon
Development of the cerebral cortex relies on extracellular cues and intrinsic signals that instruct the proliferation, differentiation and migration of neuronal precursors. The duration and location of these cues are critical to producing the final cortical architecture (Fukuchi-Shimogori and Grove, 2001, Parnavelas et al., 2002, Rakic, 2002, Shimogori et al., 2004, Rash and Grove, 2006, Storm et al., 2006). The advent of methods that allow for spatially- and temporally-restricted inactivation of genes, including the Cre/loxP system, has allowed significant advances in identifying the roles of many of these cues in specific events during cortical development [for example (Gorski et al., 2003, Machon et al., 2003, Fuccillo et al., 2004, Hanashima et al., 2004, Mizutani and Saito, 2005, Britz et al., 2006, Kessaris et al., 2006)]. These techniques, however, introduce potential confounds that need to be considered during the design of experiments and interpretation of data. For example, several in vitro studies have described effects of Cre recombinase, including growth inhibition and death, in mammalian cells lacking exogenous loxP sites (Loonstra et al., 2001, Pfeifer et al., 2001, Silver and Livingston, 2001). A recent study extended these observations to the mouse central nervous system, where it was reported that high levels of Cre recombinase in the nucleus of neural progenitors lead to impaired proliferation and increased cell death, resulting in hydrocephaly (Forni et al., 2006). Similar effects of Cre recombinase at low doses, however, have not been reported in vivo, although it is unclear whether subtle phenotypes have gone unnoticed.
The Foxg1-cre line, generated by replacing the intron-less Foxg1 coding region with cre, was designed to permit the deletion of genes specifically from the telencephalon (Hebert and McConnell, 2000). The resulting Foxg1-cre/+ mouse, which is heterozygous for Foxg1, usually has been considered the appropriate control when examining the biological effects of conditionally deleting the gene of interest. This is because several studies have indicated that mice with a single allele of Foxg1, including the Foxg1-cre line, have an ostensibly normal cortex (Xuan et al., 1995, Dou et al., 1999, Hebert and McConnell, 2000, Hanashima et al., 2002, Hanashima et al., 2004), although recently, microcephaly and impaired neurogenesis in the hippocampus have been reported in a Foxg1 heterozygous mouse (Shen et al., 2006b). The present study describes the disruption of forebrain development in the Foxg1-cre/+ mouse in the context of a congenic C57BL/6J strain.
Methods
Animals
C57BL/6J mice were purchased from the Jackson Laboratory (Bar Harbor, ME). Foxg1-cre/+ mice were a generous gift from Dr J. Hebert, Albert Einstein College of Medicine. Animals were provided free access to food and water and housed in a 12 hour light:dark cycle. All research procedures using mice were approved by the Institutional Animal Care and Use Committee at Vanderbilt University and conformed to NIH guidelines.
All mice used in this study were generated by heterozygous × wild type matings of the original Foxg1-cre mixed background line that we had backcrossed on the C57BL/6J strain for 8 to 9 generations, the point at which the Jackson Laboratory considers a strain to have reached incipient congenic status (Silver, 1995). Noon on the day a plug was detected was considered embryonic day (E) 0.5 and the day of birth was designated postnatal day (P) 0. The stage of the embryos was confirmed using crown rump length and external physical features (Kaufmann, 1992). Mice were genotyped from trunk (embryonic) or tail (postnatal) DNA via PCR with primers to cre: 5′CACCCTGTTACGTATAGCCG 3′ and 5′GAGTCATCCTTAGCGCCGTA 3′. The PCR protocol used was the following: after an initial denaturation step of 5 min at 94°C, samples were submitted to 35 cycles of denaturation (94°C, 45 sec) / annealing (55°C, 30 sec) / elongation (72°C, 1min), followed by a final elongation step of 7 min at 72°C. The presence of a PCR product of 320bp indicates that the mouse is Foxg1-cre/+.
In addition, fixed brains or Nissl-stained sections of both wild type and Foxg1 heterozygous mice from three additional Foxg1 knock-in lines were kindly provided: adult Foxg1-tet, C57BL/6 background (Dr S. Anderson, Weill Medical College of Cornell, Nissl-stained sections), P8 Foxg1-lacZ, CBA × C57BL/6 mixed background (Dr D. Price, University of Edinburgh, fixed brains) and P8 Foxg1-cre, CBA × C57BL/6 mixed background (Dr D. Price, fixed brains).
Northern hybridization
Total RNA was isolated from the cerebral cortex of P4 mice using the Trizol method according to the manufacturer's protocol (Invitrogen, Carlsbad, CA). Two litters were used, with the RNA from an individual animal considered a single sample. Following the initial extraction, RNA aliquots were further purified using RNeasy Mini spin columns (Qiagen, Valencia, CA). Ten μg total RNA was run on a 1.5% agarose/formaldehyde gel, with the samples from a single litter run on the same gel. The electrophoresed RNA was transferred to Nytran membrane (Schleicher & Schuell, Keene, NH) via overnight capillary transfer. Northern hybridization was performed as previously described (Pimenta et al., 1996), with the blot first probed with a 1.4kb cDNA that recognizes the 3′UTR of mouse Foxg1 (kind gift from Dr S. Anderson), then stripped and probed with a mouse cDNA for the coding sequence of cyclophilin. At each probing, the blot was exposed to autoradiographic film (Eastman Kodak Corp., Rochester, NY) to detect signal. The film was scanned using ScanWizard5 (Version 5.0, Microtek International, Inc) and analyzed using the public domain program ImageJ, version 1.33. Loading errors were corrected by normalizing the values for Foxg1 to those for cyclophilin.
Imaging
Adult (3 heterozygous and 3 wild type) and P4 (4 heterozygous and 4 wild type) male mice were deeply anesthetized with sodium pentobarbital (60 mg/kg i.p.) and perfused transcardially with 4% paraformaldehyde in phosphate buffered saline (PBS, pH 7.2). The brains were dissected and postfixed overnight at 4°C.
Adult
Adult brains were subjected to magnetic resonance microscopy (MRM) at the Center for Small Animal Imaging at Vanderbilt University. Whole brains were immersed in > 20 ml of PBS doped with Magnevist (Berlex Inc, Montville, NJ) at a ratio of 33:1. Brains were immersed for no less than 1 week prior to imaging and stored at 4 °C during that time. All magnetic resonance images were acquired at 400 MHz using a 9.4T/21 cm horizontal bore magnet equipped with imaging gradients capable of 40 G/cm and operated by a VNMRJ console (Varian Inc, Palo Alto, CA). Mouse brains were loaded into a 10 mm glass NMR tube with a sufficient volume of doped PBS to cover the brain to prevent drying during the image acquisition. The NMR tube was then placed in a home-built, 15-mm diameter loop-gap resonator and loaded into the center of the magnet for image acquisition.
Image data were acquired using a 3D spin-echo pulse sequence with the following parameters: TE/TR = 7.5 ms/50 ms, 24 averaged excitations, 100 kHz acquisition bandwidth, and 256 × 160 × 160 sampled values over a 19.2 × 12.8 × 12.8 mm3 volume. Total acquisition time was approximately 8.5 hours. Data were zero-padded to a size of 480 × 320 × 320 and Fourier transformed to create 3D image volume with an isotropic resolution of 40 μm. Each volume was then visually rotated about each dimension using a bilinear interpolation algorithm in order to approximately match the orientation of the image data to a standard mouse brain atlas (Paxinos and Franklin, 2001). Finally, for each orientation a 2D image was generated for each slice and contrast-enhanced using an adaptive histogram equalization algorithm in MATLAB (The Mathworks; Natick, MA).
P4
P4 brains were imaged at the Pittsburgh NMR Center for Biomedical Research at Carnegie Mellon University. Each brain was immersed in PBS, sealed in a 10-mm diameter plastic syringe, and stored at 4 °C. For imaging, each sample was aligned in a 10-mm diameter birdcage RF resonator then inserted into an 11.7 T, 89-mm vertical-bore, Bruker AVANCE micro-imaging system equipped with imaging gradients capable of 100 G/cm operated by a ParaVision 3.1 console (Bruker BioSpin, Billerica, MA). A diffusion-weighted 3D-Fourier transform spin echo pulse sequence was used with settings TR/TE = 19/1000 ms, and a spectral width of 50 kHz. During each scan sample temperature was regulated at 14 °C. Diffusion gradients were applied along the anterior – posterior direction with δ = 5 ms, Δ = 15 ms, and a gradient strength of 30 G/cm. This diffusion-weighted imaging sequence provides imporved gray/white matter contrast in these early-aged premyelinated brains compared to standard T2- or T2*-weighted imaging methods (Wimberger et al., 1995). MRM data sets were acquired with a 256 × 128 × 128 matrix size and zero-filled yielding a final resolution of 33 μm × 66 μm × 66 μm. The total imaging time per brain was approximately 19 hours using four signal averages.
3D MRM data sets were imported into the software package Amira (Mercury Computer Systems, Chelmsford, MA). Data were then rotated along axial, sagittal, and coronal axes to perfect symmetry. Image stacks cutting through the newly symmetrical axial and sagittal planes were exported for volume analysis. To calculate the new slice thickness and voxel size that resulted from axis rotation and subsequent image exportation, voxel dimensions were recalibrated using Amira's internal measurement tools. Images were then exported in lossless TIFF format for region-of-interest analysis.
In situ hybridization
Two probes were used in the present study: Brn2 (probe template generated by PCR amplification of a 277bp fragment corresponding to nucleotides 857-1134 of the mouse brn-2 cDNA [GenBank NM_008899]) and Tbr1 (264 bp template generously provided by J. Rubenstein, UCSF, (Puelles et al., 2000)). Mice were analyzed at E16.5, with 3 wild type and 3 heterozygous mice examined for each probe. The tissue processing, probe synthesis and hybridization protocols were as described previously (Bonnin et al., 2006). Briefly, the brains were immersion fixed overnight in 4% paraformaldehyde in PBS, then equilibrated in sequential, 12-hour changes of 10, 20 and 30% sucrose in PBS. The entire telencephalon was cut on a cryostat, in the sagittal plane, in five series of 25 μm thick sections that were collected on Superfrost Plus glass slides (Fisher, Pittsburgh, PA). In each hybridization run, an entire series from a wild type and mutant brain were processed simultaneously. Digoxygenin (DIG)-UTP labeled riboprobes were transcribed with T7 or T3 polymerase from the partial cDNA clone of Brn2 and Tbr1, according to the manufacturers recommendations (Digoxigenin Labeling Kit, Roche). All sections were dehydrated through an ethanol series, cleared with xylene and mounted with DPX (Fisher).
Immunocytochemistry and histochemistry
Six antibodies were used in the present study: rabbit anti-serotonin transporter (SERT, 1:1000, Calbiochem/EMD Biosciences, La Jolla, CA), mouse anti-GAD-67 (1:1000, Chemicon, Temecula, CA), goat anti-Brn1 (1:200, Santa Cruz Biotechnology, Santa Cruz, CA), rabbit anti-FoxP2 (1:1000, Abcam Inc, Cambridge, MA), rabbit anti-Tbr1 (1:500, Abcam Inc) and rabbit anti-Cux1 (1:1000, Santa Cruz Biotechnology). In addition, some sections were processed for cytochrome oxidase (CO) histochemistry or cresyl violet (CV). In each staining run, sections from heterozygous mutants and wild type controls were processed together.
Male mice were analyzed at P4 (Brn1, FoxP2, Tbr1 and Cux1), P8 (SERT) and >P60 (adult; GAD-67, CO and cresyl violet), with at least 3 heterozygous and 3 wild type animals analyzed at each age for each antibody/stain. Mice were perfused as described for imaging. One set of brains was postfixed overnight at 4°C, then equilibrated in sequential, 12-hour changes of 10, 20 and 30% sucrose in PBS. Coronal sections through the telencephalon were cut in five series with a sliding microtome at 40 μm and collected in tissue freezing medium (P8 and adult), or cut in five series on a cryostat at 25 μm and collected on Superfrost glass slides (P4). In a second set of brains, the cerebral hemispheres were separated from the rest of the brain, flattened overnight in 30% sucrose between two glass slides, sectioned tangentially on a sliding microtome at 50μm and collected as a single series in tissue freezing medium.
The fixed P8 Foxg1-lacZ and Foxg1-cre (CBA × C57BL/6 mixed background) wild type and heterozygous mutant brains were cut in the coronal plane as described above and wild type and mutant sections were processed together for CV.
Immunocytochemistry
Sections were processed as described previously (Eagleson et al., 2005). Briefly, free floating sections were incubated in primary antibody (anti-GAD67 or -SERT) for 72 hours at 4°C, followed by biotin-SP-conjugated donkey anti-rabbit or anti-mouse IgG (1:1000, Jackson ImmunoResearch, West Grove, PA) for one hour at room temperature and processed by the ABC histochemical method (Vector, Burlingame, CA). The antibody labeling was visualized by treating the sections for 4 minutes at room temperature in 0.5% 3′3′-diaminobenzidine (DAB) with 0.05% H2O2. The sections were washed, mounted onto gelatin-subbed slides, dehydrated with alcohols, cleared with CitriSolve (Fisher) and coverslipped in DPX. Cryostat sections were incubated in primary antibody (anti-Brn1, -FoxP2, -Tbr1 or –Cux1) overnight at room temperature, followed by biotin-SP-conjugated anti-goat or anti-rabbit IgG (1:1000, Jackson ImmunoResearch) for 1 hour at room temperature and avidin-Cy3 (1:1000, Jackson ImmunoResearch) for 1 hour at room temperature. Sections were coverslipped in propyl-gallate.
CO histochemistry
Adult tangential and coronal sections were reacted for CO. Sections were first rinsed with PBS, then incubated in the dark at 37°C in 0.1M phosphate buffer containing 10% sucrose, 0.05% cytochrome C, 0.037% catalase and 0.025% DAB. The reaction was stopped when the barrels in somatosensory cortex were clearly visible (approximately 1-2 hours). After rinsing in PBS, sections were mounted onto gelatin-subbed slides, dehydrated with alcohols, cleared with CitriSolve and coverslipped in DPX.
Morphometric Analyses
Grayscale images of histological sections were acquired with a Zeiss AxioCam HRc camera (Zeiss, Jena, Germany) that was mounted onto a Zeiss axioplan 2 microscope, Zeiss Axiovision 4.1 software was used. Macroscopic images of the whole brain were acquired with a Zeiss AxioCam MRc camera that was mounted onto a Leica MZ FLIII stereoscope (Leica Microsystems, Wetzlar, Germany) running MRGrab 1.0 software (Zeiss). Both the optical micrographs and the MRM images were imported into the public domain program ImageJ, version 1.33, for morphometric analysis. Figures were prepared using these images in Adobe Photoshop 7.0 (Adobe Systems Incorporated, San Jose, CA). All images received only minor, required adjustments of contrast and brightness.
The dimensions of the dorsal surface of the cerebral hemispheres were determined from macroscopic images of fixed whole brains from male mice at P4 and P60. In the anterior-posterior domain, two measurements were made: medially along the longitudinal fissure, and more laterally from the frontal to the occipital pole. In the medial-lateral domain, the hemisphere was measured at its widest extent from the most lateral point on the right side to that on the left side.
The volume of selected structures in the forebrain was determined from MRM images from male mice at P4 and P60. Each region of interest was outlined in serial sections through the prosencephalon, in either the coronal (neocortex, hippocampus and striatum) or sagittal (thalamus) plane. Digital segmentation was performed manually, relying on contrast provided by the diffusion weighting in the scans to delineate structure boundaries. The volume in each slice was determined by multiplying the area of the structure by the slice thickness, with the sum of all volumes representing the total volume of the structure.
Neocortical areas were measured in tangentially sectioned hemispheres of P8 SERT-reacted and adult CO-reacted cortices. Only those sections in which the entire posteromedial barrel subfield (PMBSF) was present were analyzed. In addition, the area of the PMBSF and of primary visual cortex (V1) was measured at P8; representative sections with the clearest outline of these cortical areas were chosen for analysis from each hemisphere.
The thickness of the supragranular, infragranular and granular layers, as well as total cortical thickness, were measured in coronal sections at P8 and in the adult. Because the mutant brains were smaller in both the anterior-posterior and medial-lateral planes, the same stereotaxic location (cross-referenced from bregma) does not represent the same cortical area in the two genotypes. Thus, we took advantage of the ability to identify primary sensory areas using SERT immunoreactivity (P8) and CO histochemistry (adult). Measures were then taken along a line perpendicular to the pial surface at the level corresponding to the center of the PMBSF.
Cell Counts
Cells were counted in the adult S1 cortex and the ventrobasal complex of the thalamus from images acquired under brightfield illumination with a Zeiss AxoCam HRc camera in Axiovision 4.1 software. In the barrel fields of parietal cortex, profiles of GAD-67 immunoreactive cells, or cell nuclei in CV-stained sections, were counted at three levels, spaced at 500 μm intervals. At each level, two 440 μm strips of cortex were counted. The first strip extended from the marginal zone/layer II boundary to a line drawn through the center of the barrels (superficial) and the second from that line to the gray/white matter interface (deep). Within the thalamus, the number of cell nuclei in CV-stained sections contained within the anatomical boundaries of the ventrobasal complex was counted at two levels, spaced 500 μm apart. For both regions, only profiles that were completely in focus were counted. In addition, only those nuclei in which a dark nucleolus on a lightly stained nucleus could be visualized were counted. The average number of cells at each level was obtained from bilateral counts in a single section and the estimated number of cells calculated according to Abercrombie's formula (Abercrombie, 1946). To determine the average profile size, the diameter of the immunoreactive soma (GAD-67) or cell nuclei (CV) was measured using Image J. For the cortical counts, the number of cells at each level was summed to give a single value for each animal.
Statistical Analyses
For all analyses, data are provided as means ± SEM. A two-tailed t-test was used to determine significance, with the alpha level set at 0.05. For the analyses of cortical and laminar thickness, and of the dimensions of the cerebral hemispheres, a Bonferroni correction for multiple comparisons was applied. All analyses were implemented in Statview, Version 5.0.1 (SAS Institute, Inc., Cary, NC).
Results
The Foxg1-cre line was created by replacing the intron-less Foxg1 coding region with cre (Hebert and McConnell, 2000). This insertion produces Foxg1 haploinsufficiency, with a 54.0 ± 6.0% decrease in Foxg1 expression in the cerebral cortex at P4, as assessed by Northern blot (Figure 1; n=6 Foxg1-cre/+ and n=4 wild type mice from 2 litters). This is consistent with a previous report that the level of Foxg1 protein is reduced in heterozygous Foxg1 mice as early as E12.5 (Hanashima et al., 2002).
Figure 1.
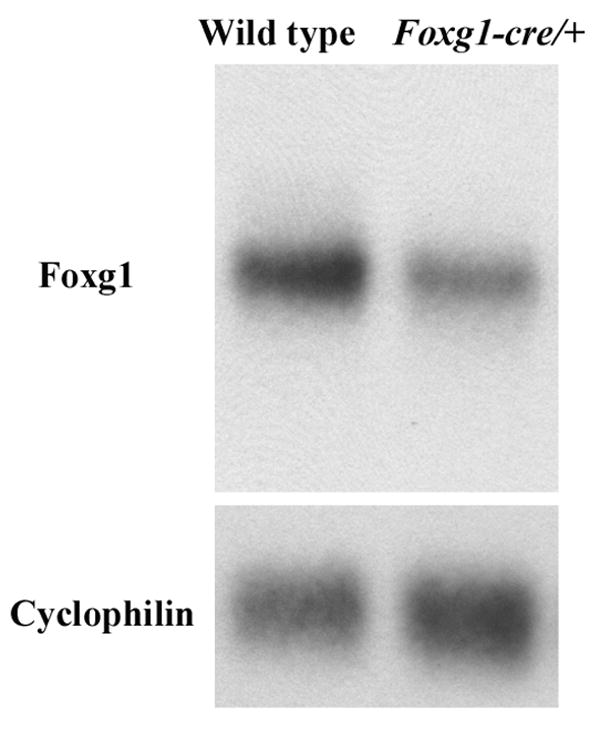
Foxg1 expression is reduced in the Foxg1-cre/+ cortex. Northern blot analysis of Foxg1 mRNA expression in P4 cerebral cortex of wild type and Foxg1-cre/+ mice. Cyclophilin probe was used as a control for mRNA integrity and loading.
The cerebral hemispheres of Foxg1-cre/+ mice are smaller
Compared to wild type littermates, adult male Foxg1-cre/+ mice exhibit a significant reduction in the length of the medio-lateral (-19.5%; Figure 2E, p = 0.0002) and midline anterior-posterior (-25.7%; Figure 2E, p = 0.0142) axes of the cerebral hemispheres, thus exposing the superior colliculi when viewed dorsally (Figure 2A, B). However, more laterally, the difference in the anterior-posterior axis between the two genotypes is less than at the midline (-9.2%; Figure 2E, p = 0.0090), creating a distortion in the shape of the cerebral hemisphere in Foxg1-cre/+ mice. The reduction in the dimensions of the cerebral hemispheres is already apparent at P4 (Figure 2C, D, F). This phenotype also was observed consistently in three other mouse lines: heterozygous mice in the Foxg1-cre and Foxg1-lacZ lines, maintained on a mixed CBA × C57BL/6 background (Table 1), and adult Foxg1 haploinsufficient mice of the Foxg1-tetracycline transactivator (Foxg1-tet) line maintained on a C57BL/6J background (Shen et al., 2006b). Together, these data indicate that, independent of the method of achieving deletion of the Foxg1 gene, reduced levels of Foxg1 underlie the reduction in the tangential extent of the cerebral hemispheres (Table 2).
Figure 2.

The cerebral hemispheres are reduced in the Foxg1-cre/+ mouse. Photomicrographs of the dorsal view of wild type and mutant brains at P60 (A,B) and P4 (C,D). The Foxg1-cre/+ cerebral hemispheres are visibly reduced in size compared with wild type littermates at both ages while the cerebellum and brainstem appear unaffected. (E, F) Quantitative analysis reveals that both the anterior-posterior (A-P) and medial-lateral (M-L) dimensions of the cerebral hemispheres are affected. Black histograms: wild type, grey histograms: Foxg1-cre/+. CH: cerebral hemispheres, IC: inferior colliculus, SC: superior colliculus, lat: lateral, med: medial. Asterisks – significantly different from wild type, p <0.05. Scale bar in D = 5 mm for all micrographs.
Table 1. Dimensions of the cerebral hemispheres (mm) in P8 Foxg1 heterozygous mice maintained on a mixed CBA × C57BL/6 background.
| Line | Dimension | Wild type
Mean ± SEM |
Foxg1/+
Mean ± SEM |
Difference
(%) |
p |
|---|---|---|---|---|---|
| Foxg1-lacZ | Midline anterior-posterior | 5.88 ± 0.08 | 4.55 ± 0.10 | -22.7 | <0.0001 |
| Lateral anterior-posterior | 8.76 ± 0.07 | 7.60 ± 0.12 | -13.3 | 0.0002 | |
| Medial-lateral | 11.05 ± 0.02 | 10.28 ± 0.09 | -6.9 | 0.0013 | |
| Foxg1-cre | Midline anterior-posterior | 6.06 ± 0.08 | 4.31 ± 0.14 | -28.9 | <0.0001 |
| Lateral anterior-posterior | 8.25 ± 0.13 | 7.46 ± 0.04 | -9.3 | 0.0006 | |
| Medial-lateral | 11.01 ± 0.15 | 10.15 ± 0.15 | -7.8 | 0.0032 |
Table 2. Forebrain phenotypes of Foxg1 heterozygous and Emx1-cre mouse lines.
| Line | Background | Tangential | Radial | Other |
|---|---|---|---|---|
| Foxg1-cre | C57Bl6 | Reduced with anterior regions more affecteda | Reduced, upper layers preferentially affecteda | Thalamic volume reduced in adult with decreased neuron numbera |
| Foxg1-cre | CBA/C57Bl6 | Reduceda | Normala | |
| Foxg1-tet | C57Bl6 | Reducedb | Normalb | Postnatal neurogenesis in hippocampus impairedb |
| Foxg1-lacZ | CBA/C57Bl6 | Reduceda | Normala | |
| Emx1-cre | C57Bl6 | Normalc | Normalc |
To assess whether the alteration in Foxg1 function disrupts the species-specific patterning of the cortical sheet, we examined SERT- and CO-stained tangential sections through flattened cerebral hemispheres at P8 and in the adult, respectively (Figure 3). As predicted from our previous observations, the area of the cortical sheet is significantly reduced at both P8 (Table 3) and in the adult (39.74 ± 0.57 mm2 wt; 29.75 ± 1.67 mm2Foxg1-cre/+, p = 0.0013). The barrel fields, in particular the PMBSF that represents the large whiskers on the face, can be observed clearly and appear normally organized in both SERT- and CO-labeled Foxg1-cre/+ mutant cortices (Figure 3), although some barrels, such as those in row A of the PMBSF, are fused. However, it is readily apparent that the size of the barrel field representation, as well as individual barrels, is smaller in mutants than in wild type mice. Although other primary sensory areas, in particular V1, can be observed in CO material, they are more easily identified using SERT immunoreactivity and thus we quantified the area of V1 and PMBSF at P8. The area of both V1 and PMBSF are decreased in the mutant cortex, although not to the same extent (Table 3). Thus, when corrected for the reduced size of the flattened hemisphere, there is a more pronounced effect rostrally in the PMBSF, which occupies a smaller proportion of the mutant cortical sheet, than in V1, which occupies a larger proportion (Table 3).
Figure 3.

A-D: Low power photomicrographs of tangential sections through cortical layer IV stained at P8 for serotonin transporter (SERT; A, B) or in the adult for cytochrome oxidase (CO; C, D). (E-H) Higher magnification photomicrographs of S1, including the postero-medial barrel subfield (PMSBF). Note that the cortical sheet is smaller in Foxg1-cre/+ (B, D) compared to wild type (A, C) mice at both ages. SERT- and CO-immunoreactivity show that primary sensory cortices (V1, A1 and S1, including the PMSBF), although smaller, are located in their normal position in the cortical sheet. Scale bar, 1.6mm (A-D) and 500μm (E-H).
Table 3. Cortical area (mm2) and ratio comparisons between P8 male wild type and Foxg1-cre/+ mice.
| Region | Wild type
Mean ± SEM |
Foxg1/+
Mean ± SEM |
Difference
(%) |
p | |
|---|---|---|---|---|---|
| Area | Total cortex | 28.78 ± 0.39 | 20.96 ± 0.47 | -27.2 | <0.0001 |
| PMSBF | 1.36 ± 0.01 | 0.81 ± 0.01 | -40.4 | <0.0001 | |
| V1 | 2.31 ± 0.05 | 1.82 ± 0.01 | -21.2 | 0.0006 | |
| Ratio | PMBSF/total | 4.71 ± 0.09 | 3.90 ± 0.10 | -17.1 | 0.0016 |
| (×100) | V1/total | 8.04 ± 0.16 | 8.67 ± 0.16 | +7.8 | 0.0423 |
Other Forebrain Defects
To probe for potentially broader alterations in the prosencephalon of Foxg1-cre/+ mice, high resolution MRM images were obtained in intact adult male brains of both genotypes (Figure 4A-D) and the volume of select telencephalic structures that express Foxg1 determined (Table 4). The volume of the Foxg1-cre/+ prosencephalon is significantly reduced (-28.3%; Table 4, Figure 4E), reflecting alterations in the volume of several telencephalic structures, including the cerebral cortex (-40.7%; Table 4, Figure 4F), hippocampus (-18.6%; Table 4, Figure 4G) and striatum (-29.7%; Table 4, Figure 4H). Interestingly, each structure within the telencephalon is affected to a different extent, demonstrating that there is not a proportional scaling down of the telencephalon in the Foxg1-cre/+ mouse.
Figure 4.

Upper panels: representative coronal slices from MRM data sets at two rostral-caudal levels in wild type (A,C) and Foxg1-cre/+ (B,D) P60 male mice. The boundaries of the structures analyzed are outlined: neocortex (green), striatum (blue) and hippocampus (red). Scale bar = 2 mm. Lower panels: distribution plots of prosencephalon (E), neocortex (F), hippocampus (G) and striatum (H) volumes across the rostral-caudal axis in wild type (solid line) and Foxg1-cre/+ (dashed line) P60 male mice. Zero represents the first, most rostral, coronal slice in which the structure can be visualized. Note that the total prosencephalon volume, as well as the volume of each individual structure, is smaller in the heterozygous mouse.
Table 4. Volume (mm3) comparisons between P60 male wild type and Foxg1-cre/+ mice.
| Structure | Wild type
Mean ± SEM |
Foxg1/+
Mean ± SEM |
p |
|---|---|---|---|
| Prosencephalon | 313.25 ± 9.15 | 224.46 ± 3.01 | 0.0008 |
| Neocortex | 86.19 ± 1.41 | 51.13 ± 2.69 | 0.0003 |
| Hippocampus | 18.37 ± 0.17 | 15.09 ± 0.23 | 0.0003 |
| Striatum | 18.53 ± 0.02 | 13.03 ± 0.27 | <0.0001 |
| Thalamus | 15.78 ± 0.07 | 12.37 ± 0.13 | <0.0001 |
Foxg1 is not expressed in the thalamus at any stage of development. Nonetheless, it we hypothesized that there may be a thalamic phenotype because 1) cre-mediated recombination has been observed in reporter mouse lines crossed to Foxg1-cre mice maintained on a C57BL/6 background (Hebert and McConnell, 2000), and 2) alterations in the cortex could result in adaptive changes in the thalamus because of the important developmental interactions between these structures. We therefore determined the volume of the thalamus in adult male mice from sagittal MRM images (Figure 5A-D). The volume of the Foxg1-cre/+ thalamus is significantly reduced (-21.6%, Table 4 and Figure 5E). Cell counts in Nissl-stained sections through the ventrobasal complex (VB) of the thalamus revealed a significant reduction in the total number of cells in this structure (Figure 5F; -20.8%, p = 0.0396, level 1; -28.3%, p = 0.0428, level 2). Consistent with the decreased thalamic volume observed in MRM images, there was a reduction in the area of the VB at both levels (Figure 5G; -19.4%, p = 0.0136, level 1; -27.6%, p = 0.0151, level 2), such that the density of cells was comparable in wild type and Foxg1-cre/+ mice (Figure 5H; -3.9%, p = 0.7271, level 1; 0.01%, p = 0.9978, level 2). Interestingly, in contrast to the adult, the thalamic volume is not significantly different between the two genotypes in P4 male mice (Figures 5I-L; 7.35 ± 0.13 mm3 wt; 7.56 ± 0.16 mm3Foxg1-cre/+; p = 0.3335; Figure 5H). However, even at this early stage, there is already a significant difference in the volume of the neocortex (26.83 ± 1.13 mm3 wt; 20.89 ± 0.67 mm3Foxg1-cre/+; p = 0.004; Figure 5I).
Figure 5.

Upper panels: sagittal slices from MRM data sets at two medial-lateral levels in wild type (A,B) and Foxg1-cre/+ (C,D) P60 male mice. The boundaries of the structures analyzed are outlined: thalamus (red), corpus callosum (green) and anterior commissure (blue). Scale bar = 2.5mm. (E) Distribution plot of thalamic volume across the medial-lateral axis in wild type (solid line) and Foxg1-cre/+ (dashed line) P60 male mice. Zero represents the midsagittal section. Middle panels: Quantification of (F) total number of cells in the ventrobasal complex (VB) of the thalamus at two rostro-caudal levels spaced 500μm apart, (G) the area of the VB at the same two levels and (H) the density of cells in the VB in wild type (black histograms) and Foxg1-cre/+ (grey histograms) P60 male mice. Asterisks – significantly different from wild type, p <0.05. Note that there is a reduction in the number of cells and the area of VB, but the density of cells is the same, in the mutant mouse. Lower panels: sagittal slices from MRM data sets in wild type (I) and Foxg1-cre/+ (J) P4 male mice. The boundary of the thalamus (red) is outlined. Scale bar = 2 mm. Distribution plot of thalamic volume (K) across the medial-lateral axis and neocortical volume (L) across the rostral-caudal axis in wild type (solid line) and Foxg1-cre/+ (dashed line) P4 male mice. Zero represents the midsagittal (K) or most rostral (L) section. Note that the thalamus is smaller in the adult heterozygous mouse, but is the same as wild type at P4, even though the neocortex is already reduced in volume at the earlier age.
Laminar defects in Foxg1-cre/+ cerebral cortices
We noted in our MRM images that there appeared to be a marked diminution in cortical thickness throughout the rostro-caudal axis (Figure 4). However, as noted in the methods, because the mutant brains are smaller in both the anterior-posterior and medial-lateral axes, it can not be assumed that the same stereotaxic location would represent the same cortical area in the two genotypes. Thus, we took advantage of the ability to identify primary sensory areas using CO-stained tissue in the adult to measure cortical thickness in the somatosensory area containing the barrel fields (Figure 6A, B). Total cortical thickness is reduced significantly in the mutant compared to the wild type (-20.1%; Figure 6C, p = 0.0109). We next compared separately the supragranular (I-III), granular (IV) and infragranular (V-VI) layers, with intense CO staining defining layer IV. The thickness of the supragranular layers is significantly reduced (-41.4%; Figure 6C, p = 0.0028), whereas that of the granular and infragranular layers is not significantly altered, in the mutant compared to wild type (Figure 6C). Adjacent CV-stained sections from adult brains confirmed that the appearance of superficial layers is most altered. In particular, large and medium sized pyramidal cells normally present in layers II and III are reduced (Figure 6D, E). Cell counts confirmed this observation, revealing a significant reduction in the total number of cells (-29.1%; Figure 6E, p = 0.0114), accounted for by a significant reduction of those in superficial (-44.4%; Figure 6E, p − 0.0042), but not deep (-13.3%; Figure 6E, p = 0.0856), layers. This phenotype contrasts with that observed in the Foxg1-tet haploinsufficient mouse, also maintained on the C57BL/6 background, in which there is no change in the thickness of the cortex (Shen et al., 2006b). We further examined histological material from these mice, and found that the thickness of superficial layers appears normal (data not shown). This indicates that the expression of cre on the congenic C57BL/6 background contributes to the alteration in the radial domain. In addition, the significant reduction of cells in the superficial, but not deep, layers suggests that Cre recombinase has a bigger impact on later generated neurons.
Figure 6.

The superficial layers of cortex are preferentially affected in the adult Foxg1-cre/+ mouse. Left panels: photomicrographs of coronal sections through the barrel fields of somatosensory of adult male wild type (A, D, G) and Foxg1-cre/+ (B,E,H) mice, illustrating CO (A,B), Nissl (D,E) and GAD-67 (G, H) staining. Scale bar = 200μm. Right panels: Quantification of (C) total cortical thickness, as well as that of the supragranular (SG), granular (G) and infragranular (IG) layers, (F) total number of cells in superficial (super) and deep layers, and (I) number of GABAergic interneurons in the marginal zone (MZ), superficial and deep layers, in somatosensory cortex in wild type (black histograms) and Foxg1-cre/+ (grey histograms) mice. Asterisks – significantly different from wild type, p <0.05. Note that the total cortical thickness is reduced and can be attributed to a significant attenuation of the supragranular layers. Similarly, the number of total cells and of GAD-67 positive cells is preferentially loss in the superficial layers.
Foxg1, and thus cre, is also expressed subcortically within the telencephalon, including the medial and caudal ganglionic eminences that give rise to cortical interneurons. Cortical interneurons are generated in a similar inside-outside pattern as projection neurons, and cells from both populations born on the same day typically are located in the same layer (Anderson et al., 2002, Valcanis and Tan, 2003). To determine if there is a similar differential impact on later generated interneurons in the Foxg1-cre/+ line, we counted the number of GAD-67 immunoreactive cells in sections adjacent to the CV stained sections analyzed above. There was a significant reduction in the total number of GAD-67-positive cells in the mutant cortex (-20.8%; Figure 6I, p = 0.0043), including a significant reduction in those present in the superficial layers (excluding the marginal zone, -41.4%; Figure 6I, p = 0.0043). However, there was no difference in the number of earlier-generated interneurons located in the marginal zone (-4.4%; Figure 6I, p = 0.2962) or deep cortical layers (-12.9%; Figure 6I, p = 0.1576).
In vivo and in vitro studies indicate that the adverse effects of Cre recombinase in the absence of exogenous loxP sites occurs predominantly in proliferating, rather than postmitotic, cells (Loonstra et al., 2001, Forni et al., 2006), suggesting that the disruption in the radial domain that we observe in the adult occurred earlier in development. We therefore performed in situ hybridization (E16.5) or immunocytochemistry (P4), using markers that identified specific layers in the developing cortex, to examine potential laminar defects of Foxg1-Cre/+ mice during late corticogenesis and early postnatal development. Tbr1 is highly expressed in preplate and layer VI neurons soon after they differentiate (Bulfone et al., 1995, Hevner et al., 2001). There is a thickening of a zone of Tbr1 staining at E16.5 in Foxg1-Cre/+ mice (Figure 7A, B), suggesting an abnormal representation of subplate and layer VI neurons in the cortex of heterozygous mice at this time. Brn-2 marks layer II-III neurons (Sugitani et al., 2002). In situ hybridization demonstrated that the superficial layer of Brn-2 staining in wild type mice is considerably narrowed at E16.5 in Foxg1-Cre/+ mice (Figure 7C, D). In addition, in contrast to the Tbr1 staining, there is a shortening of the anterior-posterior extent of the Brn-2 staining at this age, perhaps reflecting a more pronounced effect on later-generated neurons. By P4, Tbr1 and FoxP2 immunoreactivity at P4 reveal no significant difference in deep layer neurons (Figure 7E, F, I, J), whereas Brn1 and Cux1 immunoreactivity indicate a significant reduction in supragranular neurons (Figure 7G, H, K, L). Consistent with this, measurements of cortical thickness at P8, using SERT-immunoreactivity to identify the barrel fields (Figure 7M, N,O), demonstrate a reduced cortical thickness (-10.5%, p = 0.0141) with preferential attenuation of the supragranular layers (-31.6%, p = 0.0009). In contrast, there is no alteration in the thickness of the P8 cerebral cortex in Foxg1 haploinsufficient mice in the Foxg1-lacZ (1082 ± 26 μm wt; 1075 ± 46 μm Foxg1-cre/+, p = 0.8744) and Foxg1-cre (952 ± 66 μm wt; 939 ± 14 μm Foxg1-cre/+, p = 0.4862) lines maintained on a CBA × C57BL/6 mixed background. This suggests that the radial phenotype is only observed in the Foxg1-cre line in the context of the congenic C57BL/6 strain, but not when the CBA strain is a component of the background (Table 2).
Figure 7.

The attenuation of the superficial layers of cortex is observed throughout development in the Foxg1-cre/+ mouse. Photomicrographs illustrating sagittal (A-D) and coronal (E-N) sections through wild type (A,C,E,G,I,K,M) and Foxg1-cre/+ (B,D,F,H.J.L.N) brains at three stages of development. At E16.5 (A-D), in situ hybridization reveals an increase in Tbr1 (deep layer marker) and a reduction in Brn2 (upper layer marker) in the mutant cortex during late corticogenesis. This results in fewer Brn1- (G,H) and Cux1- (K,L) immunoreactive neurons in the superficial layers, but comparable numbers of Tbr1- (E,F) and FoxP2 (I,J) neurons in deep layers, of the Foxg1-cre/+ cortex at P4. At P8, SERT immunoreactivity (M,N) permits the ready identification of the thalamic recipient granular (G) layer. (O) Quantification of cortical thickness confirms the attenuation in the thickness of supragranular layers (SG), but relatively normal infragranular layers (IG), in somatosensory cortex in wild type (black histograms) and Foxg1-cre/+ (grey histograms) mice. Asterisks – significantly different from wild type, p <0.05.
Supragranular layers of the cortex project primarily to other cortical areas, including the homologous region in the contralateral hemisphere. Thus, a reduction in commissural projections would be expected in the Foxg1-cre/+ telencephalon. We therefore measured the cross-sectional area of the corpus callosum in midsagittal MRM images from adult male mice (Figure 5 A,C). There is a 44.9% reduction in the area of this structure (1.07 ± 0.02 mm2 wt; 0.59 ± 0.04 mm2Foxg1-cre/+, p < 0.0001), indicating that interhemispheric connections are disrupted in the Foxg1-cre/+ mouse. In contrast, there is no significant difference in the cross-sectional area of the anterior commissure in the midsagittal plane (0.12 ± 0.01 mm2 wt; 0.11 ± 0.01 mm2Foxg1-cre/+; Figure 5A,C).
Discussion
Over the past two decades, there have been rapid advances in techniques that manipulate the spatial and temporal activation/inactivation of specific genes in the mouse [reviewed in (Mallo, 2006, Miyoshi and Fishell, 2006)]. Each technique, however, introduces one or more variables that are not always considered carefully when analyzing the phenotypic outcomes of such genetic manipulations. The phenotype of the Foxg1-cre/+ mouse that we describe here highlights several of these confounds, namely the effects of halopinsufficiency, Cre recombinase activity in the absence of exogenous loxP sites and background strain, all of which may influence the interpretation of the specific mechanisms that contribute to the final mature neuroanatomical and functional phenotype.
Foxg1 haploinsufficiency and cortical development
Previous studies have reported that cortical development is normal in Foxg1 heterozygous mice (Xuan et al., 1995, Dou et al., 1999, Hebert and McConnell, 2000, Hanashima et al., 2002, Shen et al., 2006b). Two recent studies, however, have ascribed disruption in telencephalic development to Foxg1 haploinsufficiency. The first reported telencephalic hypoplasia in hypomorphic and null fgf8 mice, which likely is due, in part, to alterations in Foxg1 expression (Storm et al., 2006). In the second, cerebral microcephaly and impaired postnatal hippocampal neurogenesis were demonstrated in adult Foxg1 haploinsufficient mice (Shen et al., 2006b). The results we describe here are consistent with these latter studies: namely, a reduction in Foxg1 levels in vivo results in a smaller dorsal pallium, which is scaled down in the tangential dimension (Table 2). Our analyses additionally reveal that all primary sensory areas are present, but suggest that the regulation of specific levels of Foxg1 expression may be a key modulator of the relative size of functional areas in the cerebral cortex in the tangential domain. A similar dependence has been reported for Emx2, where the size of primary sensory and motor areas was influenced by altered levels of the transcription factor (Hamasaki et al., 2004). The suggestion that Foxg1 may reduce Emx2 expression levels (Muzio and Mallamaci, 2005) is consistent with our finding in the Foxg1 haploinsufficent mouse of a disproportionate increase in V1 and decrease in PMSBF, similar to the phenotype observed when Emx2 is overexpressed in cortical progenitors. However, in contrast to Emx2-overexpressing mice, the cortical sheet is smaller in mice with reduced levels of Foxg1. Thus, the dysmorphologies we observed may be due to regional differences in the effects of Foxg1 on early proliferative behavior and hence expansion rates of the number of radial units that comprise the cortex in the tangential domain. Regardless of the specific mechanism underlying the effect of reduced levels of Foxg1 on cortical development, these observations, together with those from the Foxg1-lacZ and Foxg1-tet lines (Shen et al., 2006a), demonstrate that heterozygosity at the Foxg1 locus contributes to the tangential phenotype (Table 2).
Effects of Cre recombinase
The Cre/loxP system has been used in vivo and in vitro to activate and inactivate genes in mammalian cells. The efficiency of recombination at the loxP sites in the targeted cells is a key consideration when determining the utility of this system. The strategies used to enhance efficiency have included increasing the copy number of cre, for example, using transgenic mice, in which multiple copies of the cre transgene were inserted into the genome, or including a nuclear localization signal (NLS) to promote the accumulation Cre recombinase in the nucleus. However, as originally described in bacteria and yeast (Sauer, 1992, Sauer, 1996), there are pseudo loxP sites present in the mammalian genome that are able to serve as substrates for Cre recombinase (Thyagarajan et al., 2000), resulting in unwanted chromosome rearrangements and occasionally genomic instability, particularly when high levels of the recombinase are present.
The undesired effects of Cre recombinase in mammalian cells were first noted in vitro. In primary cultures of mouse embryonic fibroblasts, in the absence of exogenous loxP sites, the introduction of the cre gene via a viral vector resulted in recombination events, growth arrest and, often, increased cell death (Loonstra et al., 2001). Similar effects have been noted in a variety of mammalian cell lines (Pfeifer et al., 2001, Silver and Livingston, 2001, Baba et al., 2005). More detailed analysis indicated that proliferating, rather than postmitotic, cells were vulnerable to the effects of Cre recombinase, as cryptic recombination events were only observed in mitotically-active cells (Loonstra et al., 2001). There have been two reports of overt pathology in cre-expressing transgenic mice, where high levels of Cre resulted in male infertility when expressed in postmeiotic spermatids (Schmidt et al., 2000) and hydrocephaly when expressed in neuronal progenitors (Forni et al., 2006). In the latter study, the genotoxic effects required the levels of Cre recombinase to reach a critical, high threshold in the cell nucleus, as had been reported previously in vitro (Baba et al., 2005). Thus, hydrocephalus was observed in homozygous, but not hemizygous, mice in a transgenic line, in which multiple copies of the cre transgene had been inserted into unknown locations in the genome (Forni et al., 2006). In contrast, the present study utilized a Foxg1-cre line that has only a single copy of the cre gene and effects of Cre recombinase at low doses in vivo have not been reported previously. This may reflect the importance of genetic modifiers in the expression of a Cre recombinase phenotype (see below) or the expression of subtle phenotypes that may have gone unnoticed in other cre lines.
It should be noted here that the Emx1-cre line, which also has a single copy of the cre gene, exhibits no overt cerebral cortical phenotype [(Gorski et al., 2002) and Judson, Eagleson and Levitt, unpublished observations], even though it is maintained on the identical C57BL/6 background as the one used here (Table 2). An important difference between the two lines is the presence of a nuclear localization signal in the Foxg1-cre line (Hebert and McConnell, 2000), which is absent in the Emx1-cre line (Gorski et al., 2002), likely resulting in higher levels of Cre recombinase in the nucleus. As noted above, there is evidence in vivo and in vitro that the accumulation of Cre recombinase specifically in the nucleus, rather than the absolute levels in the cell, underlies the DNA damage and growth inhibition observed in the absence of exogenous loxP sites (Baba et al., 2005, Forni et al., 2006). Thus, because of the time required to achieve threshold levels of nuclear Cre recombinase, overt abnormalities may not be apparent until several days after cre is first expressed. This may underlie the more potent effect, in the Foxg1-cre/+ mouse, of cre expression on progenitor cells later in development when supragranular neurons are produced. The results of the present study highlight that, in those cases where cre-expressing mice with no exogenous loxP sites have a phenotype different from that of wild type, any additional phenotype that results from the Cre-mediated mutation is a product of an interaction between two distinct mutations.
The influence of genetic background on the expression of phenotypes
Our observation that the radial phenotype was expressed on the congenic C57BL/6J, but not the mixed CBA × C57BL/6J, background (Table 2), suggests that genetic modifiers may modulate the extent of phenotypic disruption due to Cre recombinase in the absence of exogenous loxP sites. This possibility was proposed by Hebert and McConnell (2000) to explain the differences in the pattern of recombination noted on different background strains when Foxg1-cre mice were crossed with reporter lines. They suggested that modifier loci could influence the expression of the Foxg1-cre allele or modulate the activity of the Cre recombinase itself (Hebert and McConnell, 2000). Genetic background has long been known to influence the behavioral phenotype of mutant mice (Shanks and Anisman, 1988, Gerlai, 1996, Logue et al., 1997, Bouwknecht and Paylor, 2002, Schauwecker, 2002, McKhann et al., 2003, Sik et al., 2003, Waddell et al., 2004), but fewer studies have focused on the brain-based mechanisms for such strain dependence. Brain (Bilovocky et al., 2003) and limb (Murcia et al., 2004) phenotypes caused by mutation of the Engrailed-1 (en-1) gene are highly dependent upon genetic background, as are the neural phenotypes produced by mutations of p75NGF (Greferath et al., 2000), Unc5c (Burgess et al., 2006), fmr-1 (Paradee et al., 1999, Dobkin et al., 2000, Ivanco and Greenough, 2002, Mineur et al., 2002, Errijgers and Kooy, 2004) and Pax2 (Schwarz et al., 1997). Herrup and colleagues have identified one significant modifier and several other possible loci that may be responsible for trait differences in limb and cerebellum specification in the en-1 knockout (Murcia et al., 2004, Murcia et al., 2006), and a recent report identified a major modifier locus that influences phrenic motor axon guidance in the absence of Unc5c (Burgess et al., 2006). Similar modifier mechanisms for other genes remain to be determined. It is important to note the data presented here show the Foxg1-cre mouse has a robust altered phenotype in the radial dimension of the cerebral cortex on the congenic C57BL/6J background, but no differences are observed when the CBA background is a component of the mouse strain (Table 2). In contrast, the reduction in the tangential domain, which is not modulated by the presence of Cre recombinase, is observed independent of whether the CBA background is present (Table 2).
Alterations in structures that do not express Foxg1
A particularly interesting observation in the present study was the reduction in thalamic volume in the adult, although Foxg1 is not expressed in this structure. This may be due to the expression of Cre recombinase in the thalamus of Foxg1-cre mice maintained on the C57BL/6 background (Hebert and McConnell, 2000), or to secondary interactions that may regulate adaptive responses of the thalamus and cortex when one structure is perturbed developmentally. We favor the second possibility as, in contrast to the cortex, the thalamic phenotype is not apparent during the early postnatal period. In vivo and in vitro studies indicate that, in rodents, embryonic dorsal thalamic neurons do not require trophic support from the cortex (Lotto et al., 2001). In contrast, based on lesion studies, early postnatal neurons exhibit an exquisite dependence on their cortical target (Haun and Cunningham, 1987, Eagleson et al., 1990). Moreover, in Pax6 null mice, in which thalamocortical axons fail to reach the cortex, there is an increase in cell death in the dorsal thalamus starting at birth (Lotto et al., 2001). Thus, although their axons reach the cortex during embryonic development, it appears that dorsal thalamic neurons become dependent on target-derived factors postnatally. Given the early development of normal patterns of primary sensory areas, demarked by CO and SERT staining, it appears that in the Foxg1-cre/+ mouse, an initially normal-sized thalamus projects to the correct cortical fields. This occurs, however, even though the target field is smaller at the earliest time we measured (P4). The subsequent reduction in thalamic volume, due at least in part to an increase in cell death of thalamic neurons, may reflect an important mechanism for size matching of these forebrain structures that initially develop independently (Miyashita-Lin et al., 1999, Nakagawa et al., 1999).
The present study reveals the complexity of the mechanisms that underlie the expression of the adult forebrain phenotype of the Foxg1-cre/+ mouse maintained on the C57BL/6J background. Cre recombinase, Foxg1 haploinsufficiency, and background strain contribute to the final phenotype, with Cre recombinase and background strain modulating the radial phenotype, and Foxg1 haploinsufficiency influencing the tangential phenotype (Table 2). These data clearly indicate the need for very careful evaluation of any new or modified conditional genetic system for perturbing gene expression.
Acknowledgments
We are grateful to Dr David Price and Martine Manuel for supplying fixed brains from the Foxg1-lacZ and Foxg1-cre lines on the mixed background, and Drs Stewart Anderson and Lijian Shen for supplying Nissl-stained material from the Foxg1-tet line. We thank Dr Ken Catania for advice and assistance with the flattened cortical preparation and analysis, and Paula Woods, Donte Smith and Frank Liu for assistance in maintaining the mouse colony and genotyping. We also thank Drs Elizabeth Hammock, Philip Ebert and Gregg Stanwood for their helpful comments on the manuscript. This study was supported by NIMH grant 67842 (PL), NICHD P30 grant 15052 and NCRR 1S10 RR17799. One of us (ETA) acknowledges support from NIH grants R01-EB4155, P41-EB001977, and P50-ES012359.
Abbreviations
- CO
cytochrome oxidase
- CV
cresyl violet
- E
embryonic day
- GAD-67
glutamic acid decarboxylase-67
- MRM
magnetic resonance microscopy
- P
postnatal day
- PMBSF
posteromedial barrel subfield
- SERT
serotonin transporter
- tet
tetracycline transactivator
- V1
primary visual cortex
Footnotes
Publisher's Disclaimer: This is a PDF file of an unedited manuscript that has been accepted for publication. As a service to our customers we are providing this early version of the manuscript. The manuscript will undergo copyediting, typesetting, and review of the resulting proof before it is published in its final citable form. Please note that during the production process errors may be discovered which could affect the content, and all legal disclaimers that apply to the journal pertain.
References
- Abercrombie M. Estimation of nuclear population from microtome sections. Anat Rec. 1946;94:239–247. doi: 10.1002/ar.1090940210. [DOI] [PubMed] [Google Scholar]
- Anderson SA, Kaznowski CE, Horn C, Rubenstein JL, McConnell SK. Distinct origins of neocortical projection neurons and interneurons in vivo. Cereb Cortex. 2002;12:702–709. doi: 10.1093/cercor/12.7.702. [DOI] [PubMed] [Google Scholar]
- Baba Y, Nakano M, Yamada Y, Saito I, Kanegae Y. Practical range of effective dose for Cre recombinase-expressing recombinant adenovirus without cell toxicity in mammalian cells. Microbiol Immunol. 2005;49:559–570. doi: 10.1111/j.1348-0421.2005.tb03753.x. [DOI] [PubMed] [Google Scholar]
- Bilovocky NA, Romito-DiGiacomo RR, Murcia CL, Maricich SM, Herrup K. Factors in the genetic background suppress the engrailed-1 cerebellar phenotype. J Neurosci. 2003;23:5105–5112. doi: 10.1523/JNEUROSCI.23-12-05105.2003. [DOI] [PMC free article] [PubMed] [Google Scholar]
- Bonnin A, Peng W, Hewlett W, Levitt P. Expression mapping of 5-HT1 serotonin receptor subtypes during fetal and early postnatal mouse forebrain development. Neuroscience. 2006;141:781–794. doi: 10.1016/j.neuroscience.2006.04.036. [DOI] [PubMed] [Google Scholar]
- Bouwknecht JA, Paylor R. Behavioral and physiological mouse assays for anxiety: a survey in nine mouse strains. Behav Brain Res. 2002;136:489–501. doi: 10.1016/s0166-4328(02)00200-0. [DOI] [PubMed] [Google Scholar]
- Britz O, Mattar P, Nguyen L, Langevin LM, Zimmer C, Alam S, Guillemot F, Schuurmans C. A role for proneural genes in the maturation of cortical progenitor cells. Cereb Cortex. 2006;16 1:i138–151. doi: 10.1093/cercor/bhj168. [DOI] [PubMed] [Google Scholar]
- Bulfone A, Smiga SM, Shimamura K, Peterson A, Puelles L, Rubenstein JL. T-brain-1: a homolog of Brachyury whose expression defines molecularly distinct domains within the cerebral cortex. Neuron. 1995;15:63–78. doi: 10.1016/0896-6273(95)90065-9. [DOI] [PubMed] [Google Scholar]
- Burgess RW, Jucius TJ, Ackerman SL. Motor axon guidance of the mammalian trochlear and phrenic nerves: dependence on the netrin receptor Unc5c and modifier loci. J Neurosci. 2006;26:5756–5766. doi: 10.1523/JNEUROSCI.0736-06.2006. [DOI] [PMC free article] [PubMed] [Google Scholar]
- Dobkin C, Rabe A, Dumas R, El Idrissi A, Haubenstock H, Brown WT. Fmr1 knockout mouse has a distinctive strain-specific learning impairment. Neuroscience. 2000;100:423–429. doi: 10.1016/s0306-4522(00)00292-x. [DOI] [PubMed] [Google Scholar]
- Dou CL, Li S, Lai E. Dual role of brain factor-1 in regulating growth and patterning of the cerebral hemispheres. Cereb Cortex. 1999;9:543–550. doi: 10.1093/cercor/9.6.543. [DOI] [PubMed] [Google Scholar]
- Eagleson KL, Bonnin A, Levitt P. Region- and age-specific deficits in gamma-aminobutyric acidergic neuron development in the telencephalon of the uPAR(-/-) mouse. J Comp Neurol. 2005;489:449–466. doi: 10.1002/cne.20647. [DOI] [PubMed] [Google Scholar]
- Eagleson KL, Haun F, Cunningham TJ. Different populations of dorsal lateral geniculate nucleus neurons have concentration-specific requirements for a cortically derived neuron survival factor. Exp Neurol. 1990;110:284–290. doi: 10.1016/0014-4886(90)90040-y. [DOI] [PubMed] [Google Scholar]
- Errijgers V, Kooy RF. Genetic modifiers in mice: the example of the fragile X mouse model. Cytogenet Genome Res. 2004;105:448–454. doi: 10.1159/000078218. [DOI] [PubMed] [Google Scholar]
- Forni PE, Scuoppo C, Imayoshi I, Taulli R, Dastru W, Sala V, Betz UA, Muzzi P, Martinuzzi D, Vercelli AE, Kageyama R, Ponzetto C. High levels of Cre expression in neuronal progenitors cause defects in brain development leading to microencephaly and hydrocephaly. J Neurosci. 2006;26:9593–9602. doi: 10.1523/JNEUROSCI.2815-06.2006. [DOI] [PMC free article] [PubMed] [Google Scholar]
- Fuccillo M, Rallu M, McMahon AP, Fishell G. Temporal requirement for hedgehog signaling in ventral telencephalic patterning. Development. 2004;131:5031–5040. doi: 10.1242/dev.01349. [DOI] [PubMed] [Google Scholar]
- Fukuchi-Shimogori T, Grove EA. Neocortex patterning by the secreted signaling molecule FGF8. Science. 2001;294:1071–1074. doi: 10.1126/science.1064252. [DOI] [PubMed] [Google Scholar]
- Gerlai R. Gene-targeting studies of mammalian behavior: is it the mutation or the background genotype? Trends Neurosci. 1996;19:177–181. doi: 10.1016/s0166-2236(96)20020-7. [DOI] [PubMed] [Google Scholar]
- Gorski JA, Talley T, Qiu M, Puelles L, Rubenstein JL, Jones KR. Cortical excitatory neurons and glia, but not GABAergic neurons, are produced in the Emx1-expressing lineage. J Neurosci. 2002;22:6309–6314. doi: 10.1523/JNEUROSCI.22-15-06309.2002. [DOI] [PMC free article] [PubMed] [Google Scholar]
- Gorski JA, Zeiler SR, Tamowski S, Jones KR. Brain-derived neurotrophic factor is required for the maintenance of cortical dendrites. J Neurosci. 2003;23:6856–6865. doi: 10.1523/JNEUROSCI.23-17-06856.2003. [DOI] [PMC free article] [PubMed] [Google Scholar]
- Greferath U, Bennie A, Kourakis A, Bartlett PF, Murphy M, Barrett GL. Enlarged cholinergic forebrain neurons and improved spatial learning in p75 knockout mice. Eur J Neurosci. 2000;12:885–893. doi: 10.1046/j.1460-9568.2000.00976.x. [DOI] [PubMed] [Google Scholar]
- Hamasaki T, Leingartner A, Ringstedt T, O'Leary DD. EMX2 regulates sizes and positioning of the primary sensory and motor areas in neocortex by direct specification of cortical progenitors. Neuron. 2004;43:359–372. doi: 10.1016/j.neuron.2004.07.016. [DOI] [PubMed] [Google Scholar]
- Hanashima C, Li SC, Shen L, Lai E, Fishell G. Foxg1 suppresses early cortical cell fate. Science. 2004;303:56–59. doi: 10.1126/science.1090674. [DOI] [PubMed] [Google Scholar]
- Hanashima C, Shen L, Li SC, Lai E. Brain factor-1 controls the proliferation and differentiation of neocortical progenitor cells through independent mechanisms. J Neurosci. 2002;22:6526–6536. doi: 10.1523/JNEUROSCI.22-15-06526.2002. [DOI] [PMC free article] [PubMed] [Google Scholar]
- Haun F, Cunningham TJ. Specific neurotrophic interactions between cortical and subcortical visual structures in developing rat: in vivo studies. J Comp Neurol. 1987;256:561–569. doi: 10.1002/cne.902560408. [DOI] [PubMed] [Google Scholar]
- Hebert JM, McConnell SK. Targeting of cre to the Foxg1 (BF-1) locus mediates loxP recombination in the telencephalon and other developing head structures. Dev Biol. 2000;222:296–306. doi: 10.1006/dbio.2000.9732. [DOI] [PubMed] [Google Scholar]
- Hevner RF, Shi L, Justice N, Hsueh Y, Sheng M, Smiga S, Bulfone A, Goffinet AM, Campagnoni AT, Rubenstein JL. Tbr1 regulates differentiation of the preplate and layer 6. Neuron. 2001;29:353–366. doi: 10.1016/s0896-6273(01)00211-2. [DOI] [PubMed] [Google Scholar]
- Ivanco TL, Greenough WT. Altered mossy fiber distributions in adult Fmr1 (FVB) knockout mice. Hippocampus. 2002;12:47–54. doi: 10.1002/hipo.10004. [DOI] [PubMed] [Google Scholar]
- Kaufmann M. The Atlas of Mouse Development. Academic Press; San Diego: 1992. [Google Scholar]
- Kessaris N, Fogarty M, Iannarelli P, Grist M, Wegner M, Richardson WD. Competing waves of oligodendrocytes in the forebrain and postnatal elimination of an embryonic lineage. Nat Neurosci. 2006;9:173–179. doi: 10.1038/nn1620. [DOI] [PMC free article] [PubMed] [Google Scholar]
- Logue SF, Owen EH, Rasmussen DL, Wehner JM. Assessment of locomotor activity, acoustic and tactile startle, and prepulse inhibition of startle in inbred mouse strains and F1 hybrids: implications of genetic background for single gene and quantitative trait loci analyses. Neuroscience. 1997;80:1075–1086. doi: 10.1016/s0306-4522(97)00164-4. [DOI] [PubMed] [Google Scholar]
- Loonstra A, Vooijs M, Beverloo HB, Allak BA, van Drunen E, Kanaar R, Berns A, Jonkers J. Growth inhibition and DNA damage induced by Cre recombinase in mammalian cells. Proc Natl Acad Sci U S A. 2001;98:9209–9214. doi: 10.1073/pnas.161269798. [DOI] [PMC free article] [PubMed] [Google Scholar]
- Lotto RB, Asavaritikrai P, Vali L, Price DJ. Target-derived neurotrophic factors regulate the death of developing forebrain neurons after a change in their trophic requirements. J Neurosci. 2001;21:3904–3910. doi: 10.1523/JNEUROSCI.21-11-03904.2001. [DOI] [PMC free article] [PubMed] [Google Scholar]
- Machon O, van den Bout CJ, Backman M, Kemler R, Krauss S. Role of beta-catenin in the developing cortical and hippocampal neuroepithelium. Neuroscience. 2003;122:129–143. doi: 10.1016/s0306-4522(03)00519-0. [DOI] [PubMed] [Google Scholar]
- Mallo M. Controlled gene activation and inactivation in the mouse. Front Biosci. 2006;11:313–327. doi: 10.2741/1799. [DOI] [PubMed] [Google Scholar]
- McKhann GM, 2nd, Wenzel HJ, Robbins CA, Sosunov AA, Schwartzkroin PA. Mouse strain differences in kainic acid sensitivity, seizure behavior, mortality, and hippocampal pathology. Neuroscience. 2003;122:551–561. doi: 10.1016/s0306-4522(03)00562-1. [DOI] [PubMed] [Google Scholar]
- Mineur YS, Sluyter F, de Wit S, Oostra BA, Crusio WE. Behavioral and neuroanatomical characterization of the Fmr1 knockout mouse. Hippocampus. 2002;12:39–46. doi: 10.1002/hipo.10005. [DOI] [PubMed] [Google Scholar]
- Miyashita-Lin EM, Hevner R, Wassarman KM, Martinez S, Rubenstein JL. Early neocortical regionalization in the absence of thalamic innervation. Science. 1999;285:906–909. doi: 10.1126/science.285.5429.906. [DOI] [PubMed] [Google Scholar]
- Miyoshi G, Fishell G. Directing neuron-specific transgene expression in the mouse CNS. Curr Opin Neurobiol. 2006;16:577–584. doi: 10.1016/j.conb.2006.08.013. [DOI] [PubMed] [Google Scholar]
- Mizutani K, Saito T. Progenitors resume generating neurons after temporary inhibition of neurogenesis by Notch activation in the mammalian cerebral cortex. Development. 2005;132:1295–1304. doi: 10.1242/dev.01693. [DOI] [PubMed] [Google Scholar]
- Murcia CL, Bilovocky NA, Herrup K. Dissecting complex genetic interactions that influence the Engrailed-1 limb phenotype. Mamm Genome. 2004;15:352–360. doi: 10.1007/s00335-004-2335-y. [DOI] [PubMed] [Google Scholar]
- Murcia CL, Gulden FO, Cherosky NA, Herrup K. A genetic study of the suppressors of the Engrailed-1 cerebellar phenotype. Brain Res. 2006 doi: 10.1016/j.brainres.2006.06.076. [DOI] [PubMed] [Google Scholar]
- Muzio L, Mallamaci A. Foxg1 confines Cajal-Retzius neuronogenesis and hippocampal morphogenesis to the dorsomedial pallium. J Neurosci. 2005;25:4435–4441. doi: 10.1523/JNEUROSCI.4804-04.2005. [DOI] [PMC free article] [PubMed] [Google Scholar]
- Nakagawa Y, Johnson JE, O'Leary DD. Graded and areal expression patterns of regulatory genes and cadherins in embryonic neocortex independent of thalamocortical input. J Neurosci. 1999;19:10877–10885. doi: 10.1523/JNEUROSCI.19-24-10877.1999. [DOI] [PMC free article] [PubMed] [Google Scholar]
- Paradee W, Melikian HE, Rasmussen DL, Kenneson A, Conn PJ, Warren ST. Fragile X mouse: strain effects of knockout phenotype and evidence suggesting deficient amygdala function. Neuroscience. 1999;94:185–192. doi: 10.1016/s0306-4522(99)00285-7. [DOI] [PubMed] [Google Scholar]
- Parnavelas JG, Alifragis P, Nadarajah B. The origin and migration of cortical neurons. Prog Brain Res. 2002;136:73–80. doi: 10.1016/s0079-6123(02)36008-4. [DOI] [PubMed] [Google Scholar]
- Paxinos G, Franklin KBJ. The Mouse Brain in Stereotaxic Coordinates. Academic Press; San Diego: 2001. [Google Scholar]
- Pfeifer A, Brandon EP, Kootstra N, Gage FH, Verma IM. Delivery of the Cre recombinase by a self-deleting lentiviral vector: efficient gene targeting in vivo. Proc Natl Acad Sci U S A. 2001;98:11450–11455. doi: 10.1073/pnas.201415498. [DOI] [PMC free article] [PubMed] [Google Scholar]
- Pimenta AF, Fischer I, Levitt P. cDNA cloning and structural analysis of the human limbic-system-associated membrane protein (LAMP) Gene. 1996;170:189–195. doi: 10.1016/0378-1119(96)84698-1. [DOI] [PubMed] [Google Scholar]
- Puelles L, Kuwana E, Puelles E, Bulfone A, Shimamura K, Keleher J, Smiga S, Rubenstein JL. Pallial and subpallial derivatives in the embryonic chick and mouse telencephalon, traced by the expression of the genes Dlx-2, Emx-1, Nkx-2.1, Pax-6, and Tbr-1. J Comp Neurol. 2000;424:409–438. doi: 10.1002/1096-9861(20000828)424:3<409::aid-cne3>3.0.co;2-7. [DOI] [PubMed] [Google Scholar]
- Rakic P. Evolving concepts of cortical radial and areal specification. Prog Brain Res. 2002;136:265–280. doi: 10.1016/s0079-6123(02)36023-0. [DOI] [PubMed] [Google Scholar]
- Rash BG, Grove EA. Area and layer patterning in the developing cerebral cortex. Curr Opin Neurobiol. 2006;16:25–34. doi: 10.1016/j.conb.2006.01.004. [DOI] [PubMed] [Google Scholar]
- Sauer B. Identification of cryptic lox sites in the yeast genome by selection for Cre-mediated chromosome translocations that confer multiple drug resistance. J Mol Biol. 1992;223:911–928. doi: 10.1016/0022-2836(92)90252-f. [DOI] [PubMed] [Google Scholar]
- Sauer B. Multiplex Cre/lox recombination permits selective site-specific DNA targeting to both a natural and an engineered site in the yeast genome. Nucleic Acids Res. 1996;24:4608–4613. doi: 10.1093/nar/24.23.4608. [DOI] [PMC free article] [PubMed] [Google Scholar]
- Schauwecker PE. Modulation of cell death by mouse genotype: differential vulnerability to excitatory amino acid-induced lesions. Exp Neurol. 2002;178:219–235. doi: 10.1006/exnr.2002.8038. [DOI] [PubMed] [Google Scholar]
- Schmidt EE, Taylor DS, Prigge JR, Barnett S, Capecchi MR. Illegitimate Cre-dependent chromosome rearrangements in transgenic mouse spermatids. Proc Natl Acad Sci U S A. 2000;97:13702–13707. doi: 10.1073/pnas.240471297. [DOI] [PMC free article] [PubMed] [Google Scholar]
- Schwarz M, Alvarez-Bolado G, Urbanek P, Busslinger M, Gruss P. Conserved biological function between Pax-2 and Pax-5 in midbrain and cerebellum development: evidence from targeted mutations. Proc Natl Acad Sci U S A. 1997;94:14518–14523. doi: 10.1073/pnas.94.26.14518. [DOI] [PMC free article] [PubMed] [Google Scholar]
- Shanks N, Anisman H. Stressor-provoked behavioral changes in six strains of mice. Behav Neurosci. 1988;102:894–905. doi: 10.1037//0735-7044.102.6.894. [DOI] [PubMed] [Google Scholar]
- Shen L, Nam HS, Song P, Moore H, Anderson SA. FoxG1 haploinsufficiency results in impaired neurogenesis in the postnatal hippocampus and contextual memory deficits. Hippocampus. 2006a doi: 10.1002/hipo.20218. [DOI] [PubMed] [Google Scholar]
- Shen L, Nam HS, Song S, Moore H, Anderson SA. FoxG1 haploinsufficiency results in impaired neurogenesis in the postnatal hippocampus and contextual memory deficits. Hippocampus. 2006b;16:875–890. doi: 10.1002/hipo.20218. [DOI] [PubMed] [Google Scholar]
- Shimogori T, Banuchi V, Ng HY, Strauss JB, Grove EA. Embryonic signaling centers expressing BMP, WNT and FGF proteins interact to pattern the cerebral cortex. Development. 2004;131:5639–5647. doi: 10.1242/dev.01428. [DOI] [PubMed] [Google Scholar]
- Sik A, van Nieuwehuyzen P, Prickaerts J, Blokland A. Performance of different mouse strains in an object recognition task. Behav Brain Res. 2003;147:49–54. doi: 10.1016/s0166-4328(03)00117-7. [DOI] [PubMed] [Google Scholar]
- Silver DP, Livingston DM. Self-excising retroviral vectors encoding the Cre recombinase overcome Cre-mediated cellular toxicity. Mol Cell. 2001;8:233–243. doi: 10.1016/s1097-2765(01)00295-7. [DOI] [PubMed] [Google Scholar]
- Silver LM. Concepts and Applications. Oxford University Press; Oxford: 1995. Mouse Genetics. [Google Scholar]
- Storm EE, Garel S, Borello U, Hebert JM, Martinez S, McConnell SK, Martin GR, Rubenstein JL. Dose-dependent functions of Fgf8 in regulating telencephalic patterning centers. Development. 2006;133:1831–1844. doi: 10.1242/dev.02324. [DOI] [PubMed] [Google Scholar]
- Sugitani Y, Nakai S, Minowa O, Nishi M, Jishage K, Kawano H, Mori K, Ogawa M, Noda T. Brn-1 and Brn-2 share crucial roles in the production and positioning of mouse neocortical neurons. Genes Dev. 2002;16:1760–1765. doi: 10.1101/gad.978002. [DOI] [PMC free article] [PubMed] [Google Scholar]
- Thyagarajan B, Guimaraes MJ, Groth AC, Calos MP. Mammalian genomes contain active recombinase recognition sites. Gene. 2000;244:47–54. doi: 10.1016/s0378-1119(00)00008-1. [DOI] [PubMed] [Google Scholar]
- Valcanis H, Tan SS. Layer specification of transplanted interneurons in developing mouse neocortex. J Neurosci. 2003;23:5113–5122. doi: 10.1523/JNEUROSCI.23-12-05113.2003. [DOI] [PMC free article] [PubMed] [Google Scholar]
- Waddell J, Dunnett C, Falls WA. C57BL/6J and DBA/2J mice differ in extinction and renewal of extinguished conditioned fear. Behav Brain Res. 2004;154:567–576. doi: 10.1016/j.bbr.2004.03.025. [DOI] [PubMed] [Google Scholar]
- Wimberger DM, Roberts TP, Barkovich AJ, Prayer LM, Moseley ME, Kucharczyk J. Identification of “premyelination” by diffusion-weighted MRI. J Comput Assist Tomogr. 1995;19:28–33. doi: 10.1097/00004728-199501000-00005. [DOI] [PubMed] [Google Scholar]
- Xuan S, Baptista CA, Balas G, Tao W, Soares VC, Lai E. Winged helix transcription factor BF-1 is essential for the development of the cerebral hemispheres. Neuron. 1995;14:1141–1152. doi: 10.1016/0896-6273(95)90262-7. [DOI] [PubMed] [Google Scholar]