

Abstract
Recombinant-activating gene 2 (RAG-2−/−) T cell receptor–transgenic mice repeatedly injected with the superantigen staphylococcal enterotoxin A entered a tolerant state in which splenic CD4+ T cells produced little interleukin (IL)-2, interferon γ, or IL-4. This state resulted from a combination of both clonal anergy and cytokine-mediated immunosuppression. The anergy persisted for at least 3 wk and could be distinguished from the suppression by a decrease in IL-2 production per cell, a block in the activation of early response kinases, and a failure to be reversed with anti–transforming growth factor (TGF)-β. Full suppression lasted for only 1 wk and involved both IL-10 and TGF-β, but required additional unknown molecules for optimal effect. These experiments show that complex in vivo interactions of multiple peripheral tolerance mechanisms can now be dissected at both the cellular and molecular levels.
Keywords: CD4+ T cell receptor transgenic cells, early response kinase activation, interleukin 2, interleukin 10, transforming growth factor β
The task of eliminating autoreactive T cells is mediated in part by central deletion in the thymus. For antigens that are not present in the thymus, or not present in high enough concentrations to effectively delete reactive T cells there, several peripheral mechanisms exist to control unwanted T cell activation 1. One mechanism, mimicked by the introduction of high doses of antigen into mice, results in the apparent deletion or clonal exhaustion of the T cells 2. Another mechanism renders the T cells functionally unresponsive to further antigenic stimulation. Unresponsive states of this type have been achieved in animal model systems by injection of a superantigen 3 4 5 6, in transgenic systems in which antigen is expressed only on peripheral cells 7 8, by transfer of transgenic T cells into nude 9 or normal mice 10 expressing the antigen, and by transfer of transgenic T cells to normal animals with initiation of a tolerizing immunization protocol of intravenous antigen in saline 11. In addition to antigen, B7–CTLA-4 interactions may contribute to the generation of an unresponsive state in vivo 12. The unresponsive state generated in many of these systems resembles T cell clonal anergy, originally discovered using CD4+ T cell clones 13, in which an initial signal through the TCR in the absence of costimulation results in the inability to produce IL-2 and subsequently to proliferate. However, in other systems there appears to be an initial activation stage before T cells become unresponsive, as they have been shown to express activation markers and undergo expansion 10 14 15. Therefore, the nature of all of the processes that lead to the induction of T cell functional unresponsiveness in vivo are not yet clear and may involve several simultaneous but distinct molecular mechanisms.
Recent experiments have also suggested a possible role for regulatory cytokines in the induction of peripheral T cell unresponsiveness. Injection of superantigen into AND TCR transgenic mice results in IFN-γ production by CD4−CD8− cells with subsequent deletion of CD4+ T cells 16. Production of IL-10 by unresponsive CD4+ and CD8+ cells has been shown in other model systems 10 14. Superantigen stimulation of Vβ transgenic mice can result in high levels of IL-10 in the serum, and the amount of IL-10 produced by CD4+ T cells is inversely correlated with the amount of IL-2 that they are able to make upon restimulation 6. IL-10 has been shown to have both a direct effect on IL-2 production by human T cells 17 and an indirect effect by diminishing MHC class II and costimulatory molecule expression on the surface of APCs 18 19 20. However, in one system, pretreatment of mice with neutralizing antibody before superantigen injection failed to restore IL-2 production, indicating a correlative but not a causative role for IL-10 in the induction/maintenance of T cell proliferative unresponsiveness in vivo 6. In addition to IL-10, TGF-β has been implicated as a regulatory cytokine produced by T cells found at sites of chronic antigenic stimulation 21, and is thought to contribute to the induction of oral tolerance 22 and the immune deviation observed when antigen is injected into the anterior chamber of the eye 23. TGF-β is known to block cell cycle progression 24 and may have a direct effect on expression of the IL-2 gene 25.
Long-term culture of spleen cells from DO11.10 TCR transgenic mice in the presence of antigen and IL-10 can produce an unresponsive state 26. The resulting CD4+ T cells were initially considered to be anergic, because similar cells isolated from human PBLs did not proliferate or produce IL-2 upon restimulation with antigen 27. In addition, the upregulation of the IL-2Rα chain was blocked, indicating a more profound state of unresponsiveness, similar to that which has been described in vivo for superantigen-induced murine anergy 28. However, the human and mouse cell lines were subsequently found to be suppressive for proliferation of naive T cells by secreting IL-10 and TGF-β. Therefore, they were given a new name, Tr1 cells, which denotes their suppressive capacity. Nonetheless, in this system, as in most previously described systems, the molecular mechanisms underlying the induced tolerant state were not clearly delineated and the distinction between anergy and cytokine-mediated suppression was not fully defined. For example, was the effect of the suppression on the proliferation of naive T cells the same mechanism as that which prevented the Tr1 cells from making IL-2?
In this paper, we establish an in vivo murine tolerance model designed to address some of these issues using a CD4+ TCR transgenic mouse on a RAG-2−/− background. In this system, peripheral T cells lose the ability to produce IL-2, IL-4, and IFN-γ upon antigenic rechallenge after repeated immunization with the superantigen staphylococcal enterotoxin A (SEA).1 The IL-2 production defect resulted from two distinct mechanisms: cytokine-mediated suppression and clonal anergy. The suppressive mechanism, found in the supernatant of antigen-stimulated SEA-treated spleen cells, involved IL-10 and TGF-β, but clearly required an additional factor(s) for maximum effect. The suppression could be distinguished from an underlying anergic mechanism at both the cellular and molecular levels. The suppressive effect started to wane by day 6 after the last injection with SEA, whereas the production of IL-2 on a per cell basis remained consistently low until at least day 20. The decrease in IL-2 production per cell was correlated with a diminished activation of the early response kinases (ERKs) in response to TCR stimulation, similar to what has been observed in T cell clones rendered anergic 29 30. Suppressive supernatants did not cause a block in ERK activation, and anti–TGF-β could not fully reverse the block in IL-2 production, even at day 4, allowing us to identify the existence of clonal anergy in the presence of cytokine-mediated suppression. Thus, this model system appears to be well suited for understanding the onset and interaction of multiple molecular mechanisms of peripheral tolerance in vivo.
Materials and Methods
Mice and Immunization.
C57BL/6 TCR–Cyt 5C.C7-1 transgenic mice 37 were backcrossed multiple times to B10.A mice in the NIAID contract facility at Taconic Farms, Inc. They were then bred to B10.D2 RAG-2−/− mice to introduce the Rag-2−/− mutation and made homozygous for B10.A, RAG-2−/−, and the TCR transgene. This strain is referred to as B10.A/SgSnAi TCR–Cyt 5C.C7-1 RAG-2−/− and can be purchased from the NIAID/Taconic Farms, Inc. exchange. The spleens of these animals are comprised of 40–50% CD4+ T cells and 1–2% CD8+ T cells, all bearing the Vα11/Vβ3 transgenic receptor. The remainder of the spleen is composed of NK1.1+ cells (20%, all of which are TCR negative), macrophages (10%), and other hematopoietic (CD45+) cells (15–20%). 6–12-wk-old mice were given three intraperitoneal injections of 1 μg of SEA (Toxin Technologies) in PBS, or 100 μl of PBS alone at 4-d intervals and assayed at various time points after the third injection. No LPS contamination (<0.01 U/ml) was detected in the SEA preparations used, as measured with the E-toxate kit (Sigma Chemical Co.).
T Cell Proliferation Assay.
Spleen cells (105) were cultured with 5 × 10⁵ irradiated (3,000 rads) T-depleted B10.A spleen cells as APCs 38 and 1 μM pigeon cytochrome c (PCC) peptide (amino acids 81–104, synthesized in the peptide synthesis facility, NIAID, National Institutes of Health) in E/R medium (50% Eagle's Hank's amino acids plus 50% RPMI 1640 medium [Biofluids, Inc.]) supplemented with 10% FCS (Biofluids), 4 mM glutamine, penicillin (200 μg/ml), streptomycin (200 μg/ml), gentamycin (25 μg/ml), and 50 μM β-ME, in flat-bottomed 96-well plates at 37°C, 5% CO2 (final vol 0.2 ml). After 48 h in culture, 100 μl of supernatant was removed for cytokine assays. The wells were then pulsed with 1 μCi [3H]thymidine (6.7 Ci/mmol; ICN) and harvested 16 h later onto glass fiber filters using a 96-well cell harvester (Brandel). Incorporated [3H]thymidine was measured by scintillation counting in a Betaplate 1205 detector (Wallac). In experiments that examined the effect of supernatants on T cell proliferation, the supernatant (50 μl) was added at a 1:3 vol ratio with the final vol kept at 0.2 ml.
Limiting Dilution Analysis.
Total spleen cells were cultured at various numbers with 4,000 PCC peptide–pulsed dendritic cells. Dendritic cell-enriched populations were isolated as previously described 39 40. In brief, B10.A spleen cells were allowed to adhere to plastic petri dishes (Falcon 3025, Becton Dickinson) for 2 h, washed, and cultured overnight at 37°C, 5% CO2 in the presence of 1 ng/ml GM-CSF (PharMingen) with or without 1 μM PCC peptide. The next day, nonadherent cells were collected, spun through a 70% Percoll gradient, washed twice with E/R medium, and put into culture with the responding spleen cells in 96-well U-bottomed plates (final vol 0.1 ml). After 48 h the plates were frozen, thawed, and 1,000 CTL-L (obtained from American Type Culture Collection) cells were added per well. The plates were then incubated at 37°C, 5% CO2 for 16 h. Finally, the plates were pulsed with 1 μCi [3H]thymidine and harvested 6 h later, as described above.
Cytokine ELISA and Bioassay.
The IL-2–dependent indicator cell line CTL-L was used to quantitate the IL-2 content of culture supernatants. CTL-L cells were cultured at 1,000/well with various dilutions of culture supernatants or with rIL-2 (PharMingen) for a standard curve. IL-2 concentration in units per milliliter was determined using an algorithm to fit the data to a logistic equation as previously described 41. The CTL-L cells did not show any decreased response to 10 U/ml of IL-2 in the presence of IL-10–, TGF-β–, or SEA-treated cell culture supernatants. IL-10 and IFN-γ concentrations in culture supernatants were determined by sandwich ELISA (Endogen). Total and acid-activated TGF-β1 and 2 concentrations were measured by the Emax ELISA system, according to the manufacturer's instructions (Promega).
Antibody Blocking Experiments.
Monoclonal mouse anti–TGF-β antibody (specific for murine TGF-β1, 2, and 3) was purchased from Genzyme Corp. Rat anti–mouse IL-10 (clone JE55-16E3), rat anti–mouse IL-4 (clone 11B11), rat anti–mouse IFN-γ (clone XMG 1.2), and purified polyclonal mouse IgG (12297D) were purchased from PharMingen. Rabbit anti–mouse prostaglandin (PG)E2 and PGF2α antibodies (the latter was used as an isotype and specificity control) were purchased from PerSeptive Diagnostics. The ability of the antibodies to block the effects of the cytokine in proliferation assays was tested by adding the cytokine to indicator cell lines with or without antibody and assaying for activity. For anti–TGF-β antibody, the ability to block the decrease in proliferation of mink lung cells (a gift from Martijn Lolkema, LCMI, NIAID, Bethesda, MD) in response to recombinant human TGF-β (Genzyme Corp.) was used. Anti–IL-10 antibody was assayed for the ability to block the increase in proliferation of the IL-3–dependent cell line MC/9 (a gift from Dr. Yugata Takata, Metabolism Branch, National Cancer Institute, Frederick, MD) in response to rIL-10 (PharMingen). Anti–IL-4 antibody was assayed for its ability to block the growth of the IL-4 dependent cell line CT4.S (obtained from Cyndy Watson, Laboratory of Immunology, NIH, Bethesda, MD) in rIL-4 (PharMingen). Anti-PGE2 antibody was assayed for the ability to block the decrease in proliferation of antigen-stimulated spleen cells from B10.A TCR–Cyt 5C.C7-1 Rag-2−/− mice that is caused by PGE2 (Alexis Corp.). Anti–IFN-γ and anti–TNF-α antibodies were used at 10 μg/ml, a concentration previously shown to block the effects of IFN-γ 16 in spleen cell cultures. Recombinant mouse IL-10 was purchased from PharMingen and recombinant human TGF-β1 and 2 were gifts from Drs. Anita Roberts and Nan Roche (Laboratory of Chemoprevention, NCI, NIH, Bethesda, MD).
Quantitative PCR.
105 spleen cells from PBS- or SEA-treated mice were cultured in E/R medium in the presence of 5 × 10⁵ T-depleted, irradiated spleen cells in 6-well plates for 24 h at 37°C in the presence of 3 μg/ml of anti-CD3 (2C11; reference 42) and a 1:1,000 dilution of anti-CD28 ascites 43. The cells were then scraped from the wells and total RNA was extracted using the RNeasy kit (Qiagen). Reverse transcriptase (RT)-PCR reactions were coupled and performed in the same tube using 10–100 ng of total RNA in 1× TaqMan EZ buffer, 2.5 mM manganese acetate, 300 μM of each dNTP, and 100 U/ml of rTth DNA polymerase in a total vol of 25 μl (PE Applied Biosystems). The RT step was primed with the IL-2–specific back primer 5′-TTTCAATTCTGTGGCCTGCTT –3′ and was carried out at 58°C for 30 min, preceded by a 75°C for 10 min denaturation step. Amplification of the product was accomplished through the use of the IL-2–specific forward primer 5′-GCACCTGGAGCAGCTGTTG-3′ and the same IL-2–specific back primer as used in the RT step. The back primer spans an exon/intron junction and will not amplify genomic DNA or unspliced RNA. The PCR step consisted of 40 cycles of 94°C for 15 s → 58°C for 60 s preceded by an initial 95°C for 1 min denaturation step. Detection of the amplicon was achieved by dequenching of a 6-carboxyfluorescein (6-FAM)–labeled IL-2–specific probe (5′-ACCTACAGGAGCTCCTGAGCAGGATG-3′) during amplification and measurement of the released fluorescence with an ABI-7700 Sequence Detection System (PE Applied Biosystems) 44. H-2K mRNA was used as an internal reference. The RT step was primed with the H-2K–specific back primer 5′-GGGCTCAGGCAGCC-3′. PCR was carried out with the H-2K–specific forward primer 5′-AGAAGTGGGCATCTGTGG-3′ and the same H-2K–specific back primer as used in the RT step. Detection of the amplicon was achieved by dequenching of a 6-FAM–labeled H-2K–specific probe (5′-TTGGGAAGGAGCAGTATTACACATGC-3′), which only amplified cytoplasmic mRNA. RT-PCR reaction conditions were exactly the same as those described above. Standard curves were generated for H-2K and IL-2 mRNAs with total RNA from A.E7 T cells stimulated with anti-TCR (H57; reference 45) and costimulated with anti-CD28 for 4 h. The log of the total RNA (nanograms) plotted versus the threshold cycle number (CT) is a linear function; where the CT is defined as the amplification cycle number at which the fluorescence emitted is >10 SD above the average baseline fluorescence (usually the amount of fluorescence measured between cycles 3 and 15). The relative amount of mRNA in the unknown samples was determined from the standard curves. All samples were assayed in triplicate and CT standard deviations were <20%.
FACS® Analysis.
To induce IL-2Rα expression, total spleen cells from PBS- or SEA-treated mice were put into 6-well plates previously coated with 3 μg/ml of anti-CD3 antibody for 4 h at 4°C. A 1:1,000 dilution of anti-CD28 ascites was added and the cells were cultured for 24 h at 37°C with 5% CO2. Control wells were coated with PBS. The cells were then scraped from the plates and 106 cells were incubated for 30 min in FACS buffer (PBS plus 1% BSA plus 0.01% sodium azide) with 5 μg/ml of anti-CD4–FITC (Caltag) and 5 μg/ml of anti-CD25–PE (PharMingen). Cells were gated on CD4 and analyzed for the expression of CD25. Before labeling with specific antibodies, FcRs were blocked with 10 μg/ml of 2.4G2 antibody (PharMingen). After two washes, the cells were analyzed on a FACScalibur® (Becton Dickinson). Mean fluorescence intensities were compared between stimulated and unstimulated cells.
ERK Activation Assay and Immunoblotting.
Total spleen cells (7 × 10⁶/well) were washed, resuspended in 50 μl of E/R medium (serum-free), and incubated in the presence of medium alone or anti-CD3 antibody–coated 24-well plates (10 μg/ml) at 37°C for various time points. In some experiments, CD8+ cells were first depleted using rat anti–mouse CD8 antibody (clone 53-6.7; PharMingen) and anti–rat IgG coupled to dynabeads (Dynal, Inc.). The cells were lysed in the wells with 50 μl of 2× Tris-Glycine SDS sample buffer (Novel Experimental Technologies) plus 1 mM dithiothreitol, and the cellular DNA was sheared by passage through a 25-gauge needle fitted to a 1 cm3 tuberculin syringe. Protein concentrations were determined with the BCA Protein Assay (Pierce), and 30 μg of total protein was analyzed from each sample using SDS 14% PAGE gels.The proteins were transferred to nitrocellulose and blots were probed with 1.4 μg/ml of antiphospho-ERK antibody (E-4, Santa Cruz Biotechnology), followed by anti–mouse IgG–alkaline phosphatase 100 ng/ml (Santa Cruz Biotechnology) and visualized with ECF substrate (Amersham). For total ERK 1+2 determination, blots were stripped in buffer (100 mM 2-ME, 2% SDS, 62.5 mM Tris-HCl, pH 6.7) at 50°C for 30 min, washed, and reblotted with anti-ERK 1/2 antiserum (Upstate Biotechnology, Inc.) at 1 μg/ml followed by anti–rabbit IgG–alkaline phosphatase. For supernatant experiments, supernatants obtained from stimulated spleen cell cultures of SEA-treated animals from day 4 after the third injection were incubated with naive spleen cells for various times at a 1:4 dilution in serum-free E/R medium at 37°C. The cells and supernatant were then transferred to anti-CD3–coated plates and stimulated as above.
Results
Repeated Immunization with SEA Results in Decreased Spleen Cell Proliferation and IL-2 Production upon Restimulation with Peptide.
Spleen cells from B10.A TCR–Cyt 5C.C7-1 RAG−/− mice injected intraperitoneally three times with 1 μg of SEA at 4-d intervals exhibit a profound decrease in proliferation when restimulated in culture for 48 h with the 81–104 peptide of PCC and APCs. The proliferative response is decreased fivefold by day 4 after immunization, and begins to increase slightly thereafter, reaching 60% of normal by day 20 (Fig. 1 A). Proliferation was greatest at 1 μM peptide, and concentrations of up to 1 mM peptide did not increase the response (data not shown). The decrease in proliferation at day 4 was paralleled by a decrease in IL-2 production. It was 100-fold less than the IL-2 production by control spleen cells and only returned to 8% of normal by day 20 (Fig. 1 A). Addition of 10 U/ml of IL-2 during the culture period did not augment the proliferative response, suggesting that responsiveness to IL-2 was also impaired.
Figure 1.

Spleen cells from SEA-treated B10.A TCR–Cyt 5C.C7-1 RAG-2−/− mice exhibit profound blocks in proliferation, IL-2 production, and responsiveness to IL-2. (A) 105 spleen cells isolated from SEA- and PBS-injected mice were stimulated with 1 μM PCC peptide in the presence of 5 × 10⁵ T-depleted, irradiated B10.A spleen cells for 48 h. In some groups, IL-2 (10 U/ml) was added in the beginning to assess responsiveness to this cytokine. Culture supernatants were harvested, the cultures were assayed for proliferation by [3H]thymidine incorporation, and the amount of IL-2 in the supernatant was measured by a CTL-L assay in the groups without added IL-2. Data represent the mean ± SD of 11 separate experiments and are expressed as a percentage of the PBS control. (B) Total mRNA was isolated from 106 spleen cells from SEA-treated or control PBS-treated animals after stimulation with a combination of anti-CD3/anti-CD28 (day 4), antigen plus APCs (day 20), or no stimulation (day 4 and day 20). The amount of IL-2 message was determined by quantitative PCR analysis using specific primers (see Materials and Methods). H-2K mRNA was amplified as a control for the amount of RNA present in the reaction mixture. (C) Spleen cells were stimulated for 24 h with plate-bound anti-CD3 (3 μg) plus anti-CD28 (1:1,000 dilution ascites) antibodies, and then analyzed by FACS®. Cells were gated on the CD4+ population and analyzed for IL-2Rα (CD25) expression. Data shown is representative of four separate experiments.
Although it was clear that less IL-2 was detected in the supernatants of SEA-treated spleen cells, the remote possibility remained that IL-2 was being produced but consumed at a high rate, and that proliferation was blocked by another mechanism. To determine if the production of IL-2 was also inhibited at the mRNA level, the amount of IL-2 message was measured by quantitative RT-PCR. The total amounts of H-2K mRNA detected were comparable between stimulated and unstimulated SEA-treated and PBS-treated control cells; however, when IL-2 message-specific primers were used, there was 10,000-fold more IL-2 mRNA amplified at 24 h from the PBS-immunized spleen cells stimulated with the potent combination of anti-CD3 and anti-CD28 than there was from the day 4 SEA-treated spleen cells (Fig. 1 B). Only a small amount of product was amplified from unstimulated cells obtained from either SEA-treated or PBS-treated animals. At day 20, the difference was less dramatic, but there was still nearly 100-fold more IL-2 mRNA induced in the PBS-treated cells compared with the SEA-treated cells upon stimulation with antigen plus APCs (Fig. 1 B). One experiment at day 4 with antigen plus APCs as the stimulus also showed little IL-2 mRNA in the SEA-treated cells (data not shown). Thus, the profound decrease in IL-2 measured in the culture supernatants of SEA-treated spleen cells is a consequence of decreased IL-2 production.
Because decreased responsiveness to IL-2 was observed both at day 4 and at day 20 after the last injection, the level of IL-2Rα was determined on the surface of anti-CD3– and anti-CD28–stimulated CD4+ cells from SEA- and PBS-treated mice. At day 4, IL-2Rα chain upregulation was diminished on the SEA-treated spleen cells. Only 10% of the SEA-treated cells expressed IL-2Rα, and the mean fluorescent intensity of the positive cells was 75% of the control (Fig. 1 C). By day 20, however, the upregulation of IL-2Rα had returned to near normal, even though the responsiveness to IL-2 was still impaired, suggesting that signal transduction through the IL-2R might also be affected.
Limiting Dilution Analysis with Spleen Cells from SEA-treated Mice Reveals a Prolonged Decrease in IL-2 Production at the Single Cell Level.
Spleen cells from SEA-treated animals were plated at decreasing cell numbers (from 25 cells/well to 0.25 cell/well in twofold dilutions) and stimulated with peptide-pulsed purified dendritic cells (4,000/well). The amount of IL-2 produced per positive well was calculated at limiting dilution, where it was estimated that ≤1 cell per well had been plated. Cells from PBS-treated animals produced statistically significantly more IL-2 per cell than did cells from SEA-treated mice (Fig. 2A and Fig. c). The geometric mean of the ratio of SEA- to PBS-treated cell responses was 0.40 ×/÷ (1.15), i.e., the average responsive SEA-treated cell produced 2.5-fold lower amounts of IL-2 upon stimulation. Because of this difference in the amount of IL-2 produced per cell, the frequency of responsive cells in the SEA-treated group could not be directly compared with the PBS-treated group (found to be one out of six, data not shown). However, the different SEA-treated groups could be compared among themselves, as almost all produced the same low amount of IL-2 per cell. Using the data from experiment 1, the measured frequency of IL-2 producers was lowest at day 4 (1 out of 34), increased twofold by day 5, and then rose to 1 in 10 cells by day 20 (Fig. 2 B). The percentages of CD4+ cells in the spleen were similar from day 4 to 6 (18–23%). However, by day 20 the percentage had returned to normal (40%). Thus, the decreased frequency of responding cells slowly reverses with time, but the IL-2 response of these cells remains low.
Figure 2.


The frequency of IL-2–producing cells in the spleens of SEA-treated mice increases over time after injection of SEA, whereas the amount of IL-2 produced per cell remains low. (A) Spleen cells from SEA-treated mice were plated at decreasing cell numbers with 4,000 purified dendritic cells and 1 μM PCC peptide in 96-well plates. After 48 h in culture, the plates were frozen, then thawed, and 1,000 CTL-L cells were added to the wells. The wells were pulsed with [3H]thymidine and assayed for IL-2 production (thymidine incorporation) 6 h later. The amount of IL-2 on a per cell basis per time point was assayed by using the dilution of cells at which 37% (or more) of the wells were negative (plating efficiency of 1 cell per well) and plotting the cpm per well. Results from two separate experiments are shown. (B) The frequency of IL-2–producing cells per well is shown by plotting the number of cells per well against the logarithm of the fraction of nonresponding wells. This analysis was done on the data in experiment 1 shown in A. (C) Values represent mean ± SEM from the limiting dilution analysis in A, at a point where one cell or less per well was plated (see Materials and Methods). The asterisk denotes a statistically significant difference from PBS controls (P < 0.05) by analysis of variance.
Spleen Cells from SEA-treated Mice Can Suppress IL-2 Production from Naive Spleen Cells Stimulated with Peptide plus APCs.
105 or 5 × 10⁴ spleen cells from SEA-treated mice were mixed at a 1:1 ratio with PBS-treated control spleen cells in culture with peptide plus APCs to determine if a suppressive effect on IL-2 production was operative in the culture system. SEA-treated spleen cells almost completely abrogated IL-2 production by peptide-stimulated PBS control spleen cells (Fig. 3 A) or naive spleen cells (data not shown). In the experiment with 105 cells, the suppression was measured as a >500–1,000-fold decrease in IL-2 production from day 4 to 6, but then waned to only 3–10-fold by day 20 after immunization (Fig. 3 A). The effect was also seen at decreasing cell numbers: as few as 6,000 SEA-treated spleen cells per well still gave significant suppression (data not shown).
Figure 3.
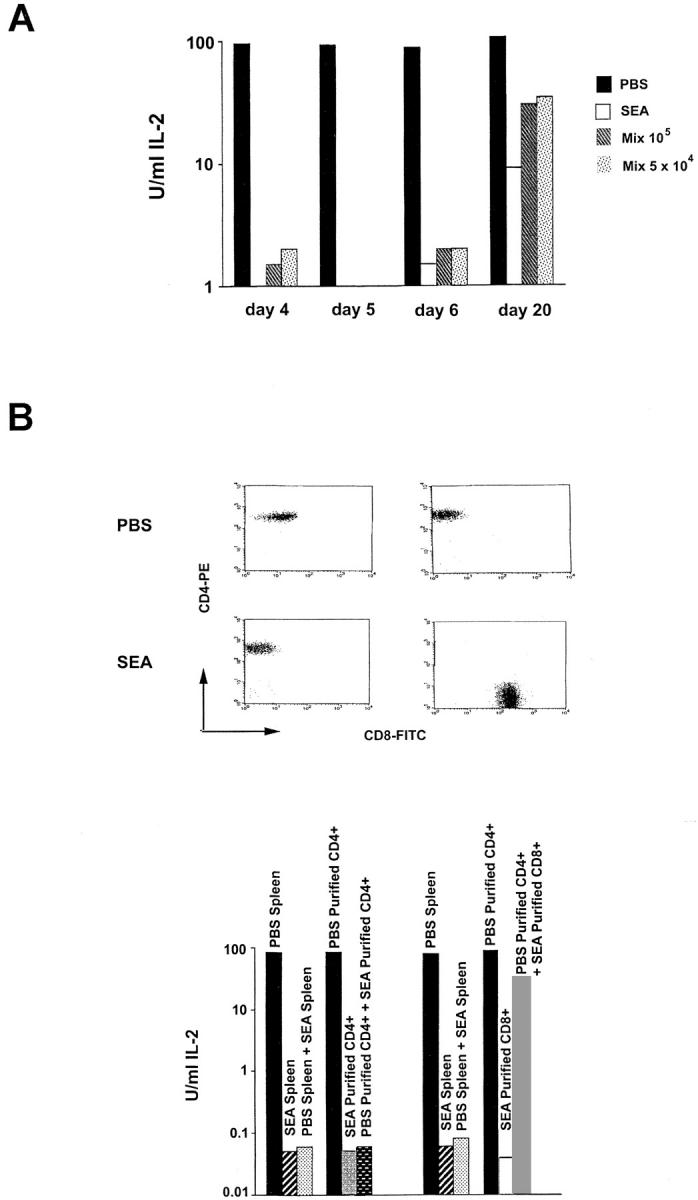
CD4+ spleen cells from SEA-treated animals can suppress IL-2 production from stimulated naive spleen cells, and the effect diminishes with time. (A) 105 spleen cells alone from SEA-treated, PBS-treated, or mixtures of 105 or 5 × 10⁴ PBS-treated plus SEA-treated spleen cells, were cultured with 1 μM PCC peptide in the presence of 5 × 10⁵ T-depleted irradiated B10.A spleen cells for 48 h. Culture supernatants were harvested and IL-2 production was measured by a CTL-L assay. The experiment from day 4 was repeated 10 times, and those from days 5, 6, and 20 were repeated four times with similar results. (B) Spleen cells from SEA- or PBS-treated mice were stained with anti-CD4 or anti-CD8 antibodies and were FACS® sorted. Purified CD4+ or CD8+ T cells (105) from SEA-treated mice were cultured with 105 purified CD4+ T cells from PBS-treated mice in the presence of 1 μM PCC peptide and 5 × 10⁵ T-depleted, irradiated spleen cells for 48 h (purity shown at top). Supernatants were then harvested and assayed for IL-2 production by CTL-L assay. Results from mixtures using unfractionated cells are shown for comparison. The CD4+ and CD8+ sorts are from separate experiments. Each experiment was performed three times.
Purified CD4+ Cells from SEA-treated Mice Mediate the Suppressive Effect of Stimulated Naive Spleen Cells on IL-2 Production.
Several different cell populations that could contribute to the observed block in IL-2 production and proliferation are present in the spleens of SEA-treated mice. To determine whether the CD4+ subpopulation alone could effect suppression of IL-2 production in stimulated naive spleen cells, spleen cells from SEA-treated mice were stained with anti-CD4 antibody and were FACS® sorted to >99% purity (Fig. 3 B). Purified CD4+ cells from SEA-treated animals proliferated poorly to the 81–104 PCC peptide (data not shown) and made little IL-2 (Fig. 3 B). When the purified CD4+ cells were mixed in culture with either total spleen cells (data not shown) or purified CD4+ T cells from PBS-immunized control animals (Fig. 3 B), IL-2 production was suppressed to the same level as seen with total SEA-treated spleen cells.
A small (∼2%) population of CD4+Vα11− cells is present in the spleens of SEA-treated animals. To determine if it was only this population of cells that was mediating the suppressive effect, spleen cells from SEA-treated mice were double-stained for Vα11 and CD4 and were FACS® sorted to >99% purity. The CD4+Vα11+ T cells were able to suppress IL-2 production from stimulated total or CD4+ FACS®-purified spleen cell populations (data not shown). CD8+ T cells were also purified by FACS® sorting from SEA-treated animals (Fig. 3 B). In SEA-treated B10.A TCR–Cyt 5C.C7-1 RAG-2−/− mice, the initially very small CD8+ population can increase to 30% of total spleen cells by day 4 after the third injection of SEA (data not shown). Purified CD8+ cells at this time point do not proliferate in response to stimulation with SEA or 81–104 peptide plus APCs, but show a small proliferative response in the presence of 10 U/ml IL-2 (data not shown). These cells also fail to make IL-2 when stimulated with antigen plus APCs (Fig. 3 B). Nonetheless, coculturing them with purified CD4+ spleen cells from PBS-treated mice did not result in significant suppression of IL-2 production (Fig. 3 B). Although a role for CD8+ T cells in the induction of the unresponsiveness in the CD4+ T cells after the first or second injection in vivo has not been be ruled out, it appears that the CD8+ population is not contributing in vitro to the suppressive effect on IL-2 production from stimulated naive spleen cells seen after three injections of superantigen.
Supernatants from Cultures of Stimulated SEA-treated Spleen Cells Are Able to Suppress IL-2 Production from Stimulated Naive Spleen Cells, and this Effect Can Be Blocked with Antibodies against TGF-β and IL-10.
To determine whether secreted factors were responsible for the suppressive effect on IL-2 production, supernatants from stimulated cultures of SEA-treated spleen cells were added at a 1:4 dilution to cultures of naive spleen cells stimulated with 81–104 peptide plus APCs. At day 4 after the last immunization with SEA, the supernatants diminished IL-2 production from stimulated naive spleen cells by 1,000-fold. The potency was similar at day 5 and then began to decrease at day 6 (10-fold), and was not detected at all at day 20 (Fig. 4 A). In other experiments the suppression at the day 4 time point was only 10–30-fold. The magnitude of the suppression correlated with how long the supernatant was stored, even though frozen.
Figure 4.

The suppression mediated by the supernatants can be blocked with antibodies to IL-10 and TGF-β; however, only anti–TGF-β antibody can partially restore IL-2 production in cultures of SEA-treated spleen cells. (A) 105 naive spleen cells were cultured with 1 μM PCC peptide and 5 × 10⁵ T-depleted, irradiated B10.A spleen cells for 48 h in the presence of supernatant from stimulated cultures of SEA-treated mice (1:3, vol/vol), and in the presence or absence of the indicated antibodies at 10 μg/ml. The experiment is representative of three performed. (B) Spleen cells (105) from SEA-treated mice were cultured with 1 μM PCC peptide and 5 × 10⁵ irradiated, T-depleted B10.A spleen cells for 48 h alone or with the indicated antibodies at 10 μg/ml. Supernatants were then harvested and IL-2 production was measured with a CTL-L assay. The experiment was performed three times with similar results.
To determine which molecules might be causing the suppression and which cell populations were responsible for their production, cell culture supernatants from stimulated, purified CD4+ and CD8+ cell populations were tested for IL-10, TGF-β, IL-4, and IFN-γ production by ELISA assay. Purified CD4+ T cells from SEA-treated mice produced large amounts (1,500 pg/ml) of IL-10, whereas purified CD8+ cells and both subsets from PBS-treated animals produced only small amounts (Table ). TGF-β is secreted in both biologically active and inactive precursor forms. Biologically active TGF-β, as recognized by the detecting antibody, was barely seen above the limits of the sensitivity of the ELISA assay (30 pg/ml) in the supernatants of stimulated, purified, SEA-treated CD4+ cells. After acid activation of the supernatants to convert any precursor TGF-β to the form recognized by the detecting antibody, 400 pg/ml of total TGF-β was detected in the supernatants of stimulated, purified CD4+ cells from the SEA-treated mice. Nothing was detected from either the CD8+ cells or both subsets from PBS-treated animals. The presence of IL-4 could not be detected in the supernatants of stimulated SEA-treated spleen cell cultures at any time point or in any of the purified subpopulations, although it could be detected if the mice had been immunized with PCC (data not shown). In mice not carrying the RAG-2−/− gene–targeted mutation, IL-4 production was detected in a limiting dilution assay with spleen cells from PBS-treated animals and this production disappeared in spleen cells from SEA-treated mice (data not shown). Similarly, in RAG-2−/− B10.A TCR–Cyt 5C.C7-1 mice, IFN-γ was produced at lower levels in purified CD4+ and CD8+ cells from SEA-treated mice than in spleen cells from PBS-injected control mice (Table ).
Table 1.
Cytokine Secretion by Purified T Cell Populations from SEA-treated versus PBS-treated B10.A TCR–Cyt 5C.C7-1 Rag-2−/− Mice
| CD4+ T cells | CD8+ T cells | |||
|---|---|---|---|---|
| PBS-treated | SEA-treated | PBS-treated | SEA-treated | |
| IL-10 (pg/ml) | 50 | 1,500 | 25 | 100 |
| TGF-β (pg/ml) | n.d. | 30 | n.d. | n.d. |
| TGF-β (acid-activated, pg/ml) | n.d. | 400 | n.d. | n.d. |
| IL-4 (pg/ml) | n.d. | n.d. | n.d. | n.d. |
| IL-2 (U/ml) | 94 | 0.06 | 72 | 0.05 |
| IFN-γ (U/ml) | >10 | 1.25 | >10 | 1.25 |
FACS®-sorted CD4+ or CD8+ T cells were stimulated for 48 h in the presence of PCC 81–104 peptide plus APCs. The supernatants were then removed and measured for cytokine production by bioassay (for determination of units/milliliter IL-2) or ELISA. Data are representative of three separate experiments. n.d., not detectable.
Thus, the CD4+ population in the spleens of SEA-treated animals produces significant amounts of at least one cytokine, IL-10, that could contribute to the observed decrease in proliferation and IL-2 production. The small amount of TGF-β also turned out to be significant. The suppressive effect of the supernatant could be partially blocked with an antibody against IL-10, and completely blocked with an anti–TGF-β antibody (Fig. 4 A). Antibodies against TNF-α (data not shown), IFN-γ, PGE2, an isotype control antibody (anti-PGF2α), or mouse IgG1 did not block the decrease in IL-2 production observed in stimulated naive spleen cells cultured with the supernatants.
However, the suppressive effect of the supernatants could only partially be mimicked by the addition of recombinant IL-10 and TGF-β (Table ). A significant suppressive effect was seen only when both cytokines were added together. TGF-β2 was always slightly more potent than TGF-β1. The lowest dose of each cytokine that consistently created a synergistic suppressive effect on IL-2 production was 1 ng of IL-10 and 30–100 pg of TGF-β. Thus, it appears that the concentrations of IL-10 and TGF-β measured in the supernatants of stimulated, purified CD4+ T cells from SEA-treated mice could account for part of the observed decrease in IL-2 production. On the other hand, the most striking aspect of the data is that the combined effect of these two cytokines was never able to mimic the enormous suppression seen with the supernatants (Table ). In control experiments, addition of the supernatants had no effect on viability or recovery of the stimulated naive spleen cells. Thus, there appears to be one or more unknown components in the supernatants that are also required for complete suppression.
Table 2.
Effect of IL-10 and TGF-β on IL-2 Production by Stimulated Naive Spleen Cells
| Cytokines added | Experiment 1 | Experiment 2 |
|---|---|---|
| U/ml | ||
| None | 45 | 150 |
| 30 pg/ml TGF-β1 | 30 | 97 |
| 30 pg/ml TGF-β2 | 25 | 108 |
| 1 ng/ml IL-10 | 30 | 114 |
| 1 ng/ml IL-10 + 30 pg/ml TGF-β1 | 15 | 31 |
| 1 ng/ml IL-10 + 30 pg/ml TGF-β2 | 5 | 17 |
| Day 4 supernatant | 0.1 | 0.4 |
All cultures contained 105 naive spleen cells plus 5 × 10⁵ T-depleted spleen cells (APCs), stimulated with 1 μM PCC peptide for 48 h at 37°C. IL-2 was measured by bioassay (CTL-L). Data shown are from two out of three separate experiments.
Only Anti-TGF-β Antibody Can Partially Reverse the Block in IL-2 Production by Spleen Cells from SEA-treated Animals upon Restimulation with Peptide plus APCs.
Antibodies to IL-10 and TGF-β were added to SEA-treated spleen cells cultured alone to determine if these secreted factors were also responsible for the block in IL-2 production by these cells. Surprisingly, addition of anti–IL-10 did not significantly affect the amount of IL-2 produced upon stimulation with 81–104 PCC peptide plus APCs (Fig. 4 B). Anti–IFN-γ antibody, previously shown to block unresponsiveness by interfering with SEA-induced apoptosis after one injection of superantigen, 16 also had no effect. In contrast, anti–TGF-β antibody increased IL-2 production 10-fold. Nonetheless, the amount of IL-2 produced was still 30-fold less than that produced by the PBS control cells (Fig. 4 B). Therefore, although the suppressive effect of the supernatants on naive cells can be partially or completely blocked by anti–IL-10 and anti–TGF-β, respectively, it appears that the SEA-treated spleen cells themselves are in a state of unresponsiveness that cannot be completely reversed by the addition of these antibodies to the cultures.
On day 20 the SEA-treated spleen cells produce a small amount of IL-2 on stimulation, but still significantly less than do the PBS-treated control spleen cells, as measured by quantitative RT-PCR for the mRNA (Fig. 1 B) as well as the functional assay (Fig. 1 A). At this time point, no anticytokine antibodies, including anti–TGF-β, had any augmenting effect (Fig. 4 B). The level of IL-2 produced at day 20 is comparable to the amount produced at day 4 or 5 in the presence of anti–TGF-β, and supernatants at day 20 no longer suppress IL-2 production of naive spleen cells (Fig. 4 A). These results all suggest that the negative effect of the supernatants has dissipated by day 20 because the cells are no longer making TGF-β and not much IL-10 (data not shown). Thus, it is possible that another mechanism is responsible for the decreased IL-2 production seen at this time point. The diminished IL-2 production per cell at limiting dilution (Fig. 2 A) and the failure to respond fully to IL-2 despite normal upregulation of IL-2Rα (Fig. 1 C) suggest an intrinsic functional inactivation of the T cell possibly akin to an anergic state.
SEA-treated Spleen Cells Show a Biochemical Block in ERK Activation.
To more directly examine the possibility that an anergic mechanism was operating in this system, we looked at the activation of the mitogen-activated protein (MAP) kinase pathway after TCR stimulation. Several previous reports have demonstrated a block in ERK activity 29 and phospho-ERK generation in anergic T cells 30. As shown in Fig. 5 A, spleen cells from PBS-treated mice showed an increase in the level of phosphorylation of ERK 1 and 2 that peaked at 15–30 min after anti-CD3 stimulation. No differences were found in the total amounts of the ERK proteins after stimulation, demonstrating that only the activation state of the proteins is altered. In contrast, spleen cells from SEA-treated mice 20 d after the last in vivo injection showed a significant impairment of ERK activation by anti-CD3 stimulation (Fig. 5 B). The percentage of CD4+ cells at this time was comparable to that found in the PBS controls, and the percentage of CD8+ cells was <6%. The decrease in ERK activation did not represent a shift in kinetics, as shown in Fig. 5 D. Of the five experiments performed, four showed a 15-fold decrease in relative ERK activation as quantitated on a PhosphorImager (Molecular Dynamics), and one experiment showed only a threefold decrease. These observations support the conclusion that an anergic state is at least partially responsible for the decrease in IL-2 production seen at day 20.
Figure 5.


ERK activation is diminished in spleen cells from SEA-treated mice. (A) Time course of activation for B10.A TCR–Cyt 5C.C7-1 RAG−/− spleen cells. 7 × 10⁶ cells were incubated on anti-CD3 (2C11)-coated plates for the indicated times (top). Total ERK protein levels are shown underneath. (B) ERK activation in PBS- versus SEA-treated spleen cells. 7 × 10⁶ cells were left unstimulated (U) or stimulated on anti-CD3–coated plates for 15 min (S). Total ERK protein levels are shown underneath. (C) Time course of ERK activation in SEA-treated spleen cells at day 4 after a third injection with SEA. CD8+ T cells were depleted from both populations giving 55% CD4+ cells in the control and 70% CD4+ cells in the SEA-treated spleen. 7 × 10⁶ cells were incubated on anti-CD3–coated plates for the indicated times (top). Total ERK protein levels are shown underneath. (D) Time course of ERK activation in SEA-treated spleen cells at day 20 after a third injection with SEA. 7 × 10⁶ cells were incubated on anti-CD3–coated plates for the indicated times (top). Total ERK protein levels are shown underneath. (E) Supernatants from stimulated SEA-treated spleen cells do not diminish ERK activation in stimulated naive spleen cells. Naive B10.A-TCR–Cyt 5C.C7-1 RAG-2−/− spleen cells were incubated for the indicated times in the presence of supernatant from stimulated SEA-treated spleen cells at day 4 after a third injection with SEA. The spleen cells were then stimulated on anti-CD3–coated plates for 15 min in the continued presence of the supernatant. Total ERK protein levels are shown underneath.
An examination of ERK phosphorylation at day 4 also showed a block in the MAP kinase pathway that was not due to a shift in kinetics (Fig. 5B and Fig. C). The magnitude of the inhibition was less than that observed at day 20. For six experiments, the geometric mean decrease in ERK phosphorylation was approximately sixfold. In two experiments, the spleen cells were depleted of CD8+ cells and enriched for CD4+ cells to a level greater than that of the PBS controls; similar results were obtained (Fig. 5 C). This block was not due to the effect of suppression, which was going on simultaneously in these cultures, because supernatants from stimulated, SEA-treated spleen cells did not affect ERK activation in naive spleen cells when added up to 15 min before stimulation with anti-CD3 antibody (Fig. 5 E). Thus, the results suggest that on day 4 there are two distinct mechanisms operating to prevent IL-2 production, anergy and suppression.
Discussion
Several groups have previously developed model systems for peripheral tolerance in which T cells are chronically stimulated with antigen. In some experiments, transgenic T cells were transferred into irradiated mice containing the antigen expressed on other peripheral cells 10 14. In other experiments, transgenic T cells were transferred into normal mice and given a tolerogenic immunization protocol 11 12. Transferred T cells in these systems express activation markers, expand, and then become unresponsive in that they no longer proliferate upon restimulation with antigen. The properties of these cells have not been well characterized due to the difficulty of recovering adequate numbers of tolerized cells from these systems. In one case 28, Vβ TCR transgenic mice given an injection of Mls-incompatible spleen cells showed several biochemical changes in the host's T cells that suggested that clonal anergy was playing a role in the tolerance process. However, other investigators, using a similar Mls incompatibility in a nontransgenic model, concluded that anergy induction does not play a role in this system, but rather that the T cells were not activatable because of the nature of their TCR α chains 4.
Many studies have indicated that regulatory cytokines may contribute to the overall tolerant state in vivo. A role for TGF-β in the maintenance of tolerant states has been shown in a number of animal models. Mice rendered tolerant by oral ingestion of antigen develop CD8+ regulatory T cells that express varying amounts of TGF-β1, IL-10, and IL-4 32. T cell clones making TGF-β obtained from these animals can suppress the induction of experimental autoimmune encephalomyelitis, and administration of anti–TGF-β1 blocks the effect 22. In another system, injection of a variety of antigens into the anterior chamber of the eye induces a systemic alteration in the immune response 23. This immune deviation can be induced in naive T cells by adding TGF-β to an in vitro culture system, and can be blocked on transfer into naive hosts by anti–TGF-β antibody 32. In yet another model, the induction of colitis by the transfer of a population of CD45RBhiCD4+ T cells to C.B-17 scid mice was prevented by cotransfer with CD45RBloCD4+ T cells that produce TGF-β 21. Finally, TGF-β1–deficient mice develop a severe inflammatory disease in multiple organs that is characterized by cellular infiltrates and is associated with an increase in IFN-γ and TNF-α production 33 34. These studies indicate a role for TGF-β in the negative regulation of the immune response, possibly by actively suppressing or immune deviating autoreactive T cells.
In recent studies, CD4+ 10 and CD8+ 14 T cells rendered tolerant in vivo by chronic antigenic stimulation were shown to express the cytokine IL-10 after restimulation in vitro. The involvement of IL-10 in tolerance has also been demonstrated in a superantigen model involving multiple injections of SEA into a Vβ transgenic mouse 6. IL-10 production began after the second injection of SEA in vivo and dominated the response after the third injection. Coinjection of anti–IL-10 antibody during the tolerance induction phase prevented the suppression of the IFN-γ, TNF, and IL-4 responses seen in vivo; however, the inhibition of the IL-2 response was not affected, even though there was an inverse correlation between the amounts of IL-2 and IL-10 elicited. Sunstedt and coworkers suggested that anergy might be responsible for the lack of IL-2 production, based on gel mobility shift assays in which transcription factors required for IL-2 gene activation were no longer induced 35. However, the possibility that other mechanisms were responsible for these observations was not ruled out. Another blend of anergy and IL-10 was described for human PBLs induced into an anergic state with anti-CD3 antibody in the presence of IL-10 27. In this case, both IL-2 production and the response to IL-2 were inhibited 10 d after exposure to the stimulus. However, in subsequent experiments cell lines of both mouse and human CD4+ T cells were generated by repeated stimulation with peptide antigens in the presence of IL-10. This protocol resulted in the production of regulatory cells (Tr1) that could suppress proliferation of naive cells and prevent colitis in IL-10 gene-deficient mice 26. These results raised an intriguing question as to the nature of the relationship between the suppression and the anergy: were they in fact separate components of the tolerance?
A similar conundrum arose in our experiments. In our tolerance model, using a TCR transgenic mouse crossed onto a RAG-2−/− background and injected three times at 4-d intervals with the superantigen SEA, splenic CD4+ T cells also produced large amounts of IL-10 and significant amounts of TGF-β when restimulated in culture with antigen and APCs, although they failed to produce much IL-2, IL-4, or IFN-γ (Table ). Supernatants from these stimulated cells could suppress proliferation and IL-2 production by naive antigen–specific T cells and this suppression could be completely blocked by anti–TGF-β and partially blocked by anti–IL-10. Interestingly, the suppression could not be fully mimicked with a combination of recombinant IL-10 and TGF-β1 or 2 at any concentrations tested. This observation suggests that there is a third component required to give maximum suppression of IL-2 production. IL-10 and TGF-β alone gave only a 10-fold inhibition, whereas fresh supernatant inhibited ∼300–1,000-fold. The antibody blocking experiments also suggest that the third component requires IL-10 and TGF-β for the full suppressive effect of the supernatant to manifest. Future studies will attempt to characterize this new suppressive component and its site of action.
We observed that the suppressive effect wanes with time after the last injection with SEA in vivo. By day 20, supernatants from antigen and APC–stimulated spleen cells were no longer suppressive, although in direct mixing experiments the IL-2 production by naive spleen cells could still be inhibited threefold (Fig. 3 A). Stimulated SEA-treated CD4+ spleen cells at day 20 did not produce much IL-10 and no detectable TGF-β (data not shown). Yet such stimulation yielded only 8% of the IL-2 production seen with PBS-treated controls (Fig. 1 A) and IL-2 mRNA levels 24 h after stimulation were decreased 100-fold (Fig. 1 B). This was accompanied by a decrease in the amount of IL-2 produced per cell, even though the decreased frequency of IL-2–producing cells observed at day 4 had returned to normal by day 20 (Fig. 2). Finally, antibodies against a variety of cytokines, including TGF-β or IL-10, had no augmenting effect. These results suggest that the inhibition of IL-2 production on day 20 is not due to these two immunosuppressive cytokines, although a small contribution by the unknown third component has not been ruled out definitively.
Instead, we think that the unresponsiveness at day 20 is due to a state of clonal anergy. Several pieces of data argue in favor of this idea. One is the decreased amount of IL-2 produced per cell, which at day 20 is ∼60% of control levels. The second is the decrease in ERK activation after stimulation with anti-CD3 antibody. This demonstrates that the Ras/MAP kinase pathway is blocked in these cells. Third, the proliferative response of these cells is suboptimal and could not be augmented by the addition of exogenous IL-2. The upregulation of IL-2Rα chain was normal, but signaling through the receptor was somehow blocked. Although classical murine clonal anergy does not involve a loss of IL-2 responsiveness, because the long-term T cell clones abnormally constitutively express high affinity IL-2 receptors, anergy induction of naive T cells in vivo 28 or in vitro 29 have shown that this can occur. Thus, the individual T cells appear to be functionally impaired in a number of ways at day 20. In a few experiments, the degree of impairment was noticeably less than in all the others, e.g., experiment 2 in Fig. 2A and Fig. c, and in one ERK activation assay. This occasional discrepancy could be due to the emergence of new naive cells from the thymus that are diluting out the anergic population of cells. Experiments with thymectomized mice are planned to explore this possibility.
The question of whether anergic cells are also present at day 4 was more difficult to ascertain. The original experiments of Sundstedt et al. used electrophoretic mobility shift assays to look at activation of transcription factors 35. Although they found that SEA-treated cells showed decreased binding of the AP-1 transcription factor, as described for anergic T cell clones 36, they also found complete inhibition of binding of both the nuclear factor of activated T cells and the p65/p55 form of the nuclear factor κB transcription factors to IL-2 enhancer sites. This could represent a more profound form of anergy. However, because we know from our work that there is also a suppressive component contributing to the unresponsiveness at that point in time, it is not clear whether the observed effects on IL-2 production were all due to anergy. To circumvent this problem, we carried out three assays that we thought might be independent of the suppressive component. One was the limiting dilution analysis that showed that the IL-2 production per cell was decreased to 40% of normal. This demonstrates that at least a component of the unresponsiveness at day 4 is an intrinsic property of the CD4+ T cell. However, if this cell is also making the suppressive molecules, then it might be suppressing itself in an autocrine fashion. A more definitive experiment was the assay for activation of the ERK kinases after TCR stimulation. We showed that the suppressive components in the supernatant could not block this activation pathway and yet day 4, SEA-treated spleen cells showed a sixfold reduction in ERK activation. In addition, anti–TGF-β treatment of activated day 4, SEA-treated spleen cells improved the IL-2 production of these cells by only 10-fold, leaving a 30-fold deficit due to something else. These results strongly suggest that, even at day 4, there is an underlying anergic component contributing to the defect in IL-2 production and that the profoundness of the deficit seen at that time is due to a combination of an anergic effect and the suppression mediated by IL-10, TGF-β, and an unknown factor(s). It will be interesting in future experiments to determine whether the unusual pattern of transcription factor blockade seen by Sundstedt et al. is mediated by this unique combination of the two tolerance mechanisms.
An important question, which we have not addressed in this paper, is whether these two mechanisms for preventing IL-2 production, anergy, and suppression, are functionally independent. Murine anergic T cell clones do not make much IL-10 upon stimulation, nor do the unresponsive cells found at day 20 after SEA treatment in vivo (data not shown). Nonetheless, Groux et al. have shown that stimulation of human naive T cells in the presence of IL-10 can facilitate the induction of an anergic-like state. Thus, the possibility remains that production of IL-10, TGF-β, and other suppressive molecules contribute to the induction of the anergic state seen following three rounds of in vivo treatment with superantigen. The model system we have described in this paper should allow us to address this issue directly by following the biochemical events as they occur both in vivo and in vitro.
Acknowledgments
We are grateful to Drs. Ronald Germain and Helen Quill for critical reading of the manuscript and helpful discussions; William McAuliffe for help with the ERK assays; and Tamdan Vo for technical assistance.
Footnotes
1used in this paper: AP, alkaline phosphatase; CT, threshold cycle number; ERK, early response kinase; E/R, 50% EHAA plus 50% RPMI 1640; 6-FAM, 6-carboxyfluorescein; MAP, mitogen-activated protein; PCC, pigeon cytochrome c; RAG-2−/−, recombinant activating gene 2 knockout; RT, reverse transcriptase; SEA, staphylococcal enterotoxin A
References
- Ramsdell F., Fowlkes B.J. Clonal deletion versus clonal anergythe role of the thymus in inducing self tolerance. Science. 1990;248:1342–1348. doi: 10.1126/science.1972593. [DOI] [PubMed] [Google Scholar]
- Moskophidis D., Lechner F., Pircher H., Zinkernagel R.M. Virus persistence in acutely infected immunocompetent mice by exhaustion of antiviral cytotoxic effector T cells. Nature. 1993;362:758–761. doi: 10.1038/362758a0. [DOI] [PubMed] [Google Scholar]
- Rammensee H.G., Kroschewski R., Frangoulis B. Clonal anergy induced in mature V beta 6+ T lymphocytes on immunizing Mls-1 b mice with Mls-1 a expressing cells. Nature. 1989;339:541–544. doi: 10.1038/339541a0. [DOI] [PubMed] [Google Scholar]
- Webb S.R., Hutchinson J., Hayden K., Sprent J. Expansion/deletion of mature T cells exposed to endogenous superantigen in vivo. J. Immunol. 1994;152:586–596. [PubMed] [Google Scholar]
- McCormack J.E., Callahan J.E., Kappler J., Marrack P.C. Profound deletion of mature T cells in vivo by chronic exposure to endogenous superantigen. J. Immunol. 1993;150:3785–3792. [PubMed] [Google Scholar]
- Sundstedt A., Hoiden I., Rosendahl A., Kalland T., van Rooijen N., Dohlsten M. Immunoregulatory role of IL-10 during superantigen-induced-hyporesponsiveness in vivo. J. Immunol. 1997;158:180–186. [PubMed] [Google Scholar]
- Burkley L.C., Lo D., Kanagawa O., Brinster R.L., Flavell R.A. T cell tolerance by clonal anergy in transgenic mice with nonlymphoid expression of MHC class II I-E. Nature. 1989;342:564–566. doi: 10.1038/342564a0. [DOI] [PubMed] [Google Scholar]
- Ferber I., Schronich G., Schenkel J., Mellon A.L., Hammerling G.J., Arnold B. Levels of peripheral T cell tolerance induced by different levels of tolerogen. Science. 1994;263:674–676. doi: 10.1126/science.8303275. [DOI] [PubMed] [Google Scholar]
- Rocha B., Grandien A., Freitas A.A. Anergy and exhaustion are independent mechanisms of peripheral T cell tolerance. J. Exp. Med. 1995;181:993–1003. doi: 10.1084/jem.181.3.993. [DOI] [PMC free article] [PubMed] [Google Scholar]
- Buer J., Lanoue A., Franzke A., Garcia C., von Boehmer H., Sarukhan A. Interleukin 10 secretion and impaired effector function of major histocompatibility complex class II–restricted T cells anergized in vivo. J. Exp. Med. 1998;187:177–183. doi: 10.1084/jem.187.2.177. [DOI] [PMC free article] [PubMed] [Google Scholar]
- Kearney E.R., Pape K.A., Loh D.Y., Jenkins M.K. Visualization of peptide-specific T cell immunity and peripheral tolerance induction in vivo. Immunity. 1994;1:327–339. doi: 10.1016/1074-7613(94)90084-1. [DOI] [PubMed] [Google Scholar]
- Perez V.A., van Parijis L., Biukians A., Zheng X.X., Strom T.B., Abbas A.K. Induction of peripheral T cell tolerance in vivo requires CTLA-4 engagement. Immunity. 1997;6:411–417. doi: 10.1016/s1074-7613(00)80284-8. [DOI] [PubMed] [Google Scholar]
- Schwartz R.H., Mueller D.L., Jenkins M.K., Quill H. T-cell clonal anergy. Cold Spring Harbor Symp. Quant. Biol. 1989;54:605–610. doi: 10.1101/sqb.1989.054.01.072. [DOI] [PubMed] [Google Scholar]
- Tanchot C., Guillaume S., Delon J., Bourgeois C., Franzke A., Sarukhan A., Trautman A., Rocha B. Modifications of CD8+ T cell function during in vivo memory or tolerance induction. Immunity. 1998;8:581–590. doi: 10.1016/s1074-7613(00)80563-4. [DOI] [PubMed] [Google Scholar]
- Adler A.J., Marsh D.W., Yochum G.S., Guzzo J.L., Nigam A., Nelson W.G., Pardoll D.M. CD4+ T cell tolerance to parenchymal self-antigens requires presentation by bone marrow–derived antigen-presenting cells. J. Exp. Med. 1998;187:1555–1564. doi: 10.1084/jem.187.10.1555. [DOI] [PMC free article] [PubMed] [Google Scholar]
- Cauley L., Cauley K.A., Shub F., Huston G., Swain S.L. Transferable anergysuperantigen treatment induces CD4+ T cell tolerance that is reversible and requires CD4−CD8− cells and interferon γ. J. Exp. Med. 1997;186:71–81. doi: 10.1084/jem.186.1.71. [DOI] [PMC free article] [PubMed] [Google Scholar]
- Taga K., Tosato G. IL-10 inhibits human T cell proliferation and IL-2 production. J. Immunol. 1992;148:1143–1148. [PubMed] [Google Scholar]
- Ding L., Shevach E.M. IL-10 inhibits mitogen-induced T cell proliferation by selectively inhibiting macrophage costimulatory function. J. Immunol. 1992;148:3133–3139. [PubMed] [Google Scholar]
- de Waal Malefyt R., Abrams J., Bennett B., Figdor C.G., deVries J.E. Interleukin 10 (IL-10) and viral IL-10 strongly reduce antigen-specific human T cell proliferation by diminishing the antigen-presenting cell capacity of monocytes via down-regulation of class II major histocompatibility complex expression. J. Exp. Med. 1991;174:915–924. doi: 10.1084/jem.174.4.915. [DOI] [PMC free article] [PubMed] [Google Scholar]
- Fiorentino D.F., Zlotnik A., Viera P., Mosmann T.R., Howard M., Moore K.W., O'Garra A. IL-10 acts on the antigen-presenting cell to inhibit cytokine production by Th1 cells. J. Immunol. 1991;146:3444–3451. [PubMed] [Google Scholar]
- Powrie F., Carlino J., Leach M.W., Mauze S., Coffman R.L. A critical role for transforming growth factor β but not interleukin 4 in the suppression of T helper type 1–mediated colitis by CD45RBlow CD4+ T cells. J. Exp. Med. 1996;183:2669–2674. doi: 10.1084/jem.183.6.2669. [DOI] [PMC free article] [PubMed] [Google Scholar]
- Miller A., Lider O., Roberts A.B., Sporn M.B., Weiner H.L. Suppressor T cells generated by oral tolerization to myelin basic protein suppress both in vitro and in vivo immune responses by the release of transforming growth factor β after antigen-specific triggering. Proc. Natl. Acad. Sci. USA. 1992;89:421–425. doi: 10.1073/pnas.89.1.421. [DOI] [PMC free article] [PubMed] [Google Scholar]
- Streilein J.W. Immune regulation and the eyea dangerous compromise. FASEB J. 1987;1:199–208. [PubMed] [Google Scholar]
- Hocevar B.A., Howe P.H. Mechanisms of TGF-β-induced cell cycle arrest. Miner. Electrolyte Metab. 1998;24:131–135. doi: 10.1159/000057360. [DOI] [PubMed] [Google Scholar]
- Brabletz T., Pfeuffer I., Schorr E., Sieblitz F., Wirth T., Serfling E. Transforming growth factor β and cyclosporin A inhibit the inducible activity of the interleukin-2 gene in T cells through a noncanonical octamer-binding site. Mol. Cell. Biol. 1993;13:1155–1162. doi: 10.1128/mcb.13.2.1155. [DOI] [PMC free article] [PubMed] [Google Scholar]
- Groux H., O'Garra A., Bigler M., Rouleau M., Antonenko S., deVries J.E., Roncarolo M.G. A CD4+ T cell subset inhibits antigen-specific T cell responses and prevents colitis. Nature. 1997;389:737–742. doi: 10.1038/39614. [DOI] [PubMed] [Google Scholar]
- Groux H., Bigler M., deVries J.E., Roncarolo M.G. Interleukin 10 induces a long-term antigen-specific anergic state in human CD4+ T cells. J. Exp. Med. 1996;184:19–29. doi: 10.1084/jem.184.1.19. [DOI] [PMC free article] [PubMed] [Google Scholar]
- Bhandoola A., Choi E.A., Yui K., Saragovi H.U., Greene M.I., Quill H. Reduced CD3-mediated protein tyrosine phosphorylation in anergic CD4+ and CD8+ T cells. J. Immunol. 1993;151:2355–2367. [PubMed] [Google Scholar]
- Li W., Whaley C.D., Mondino A., Mueller D.L. Blocked signal transduction to the ERK and JNK protein kinases in anergic CD4+ T cells. Science. 1996;271:1272–1276. doi: 10.1126/science.271.5253.1272. [DOI] [PubMed] [Google Scholar]
- Fields P.E., Gajewski T.F., Fitch F.W. Blocked ras activation in anergic CD4+ T cells. Science. 1996;271:1276–1278. doi: 10.1126/science.271.5253.1276. [DOI] [PubMed] [Google Scholar]
- Chen Y., Kuchroo V.K., Inobe J., Hafler D.A., Weiner H.L. Regulatory T cells induced by oral tolerancesuppression of autoimmune encephalomyelitis. Science. 1994;265:1237–1240. doi: 10.1126/science.7520605. [DOI] [PubMed] [Google Scholar]
- Wilbanks G.A., Streilein J.W. Fluids from immune privileged sites endow macrophages with the capacity to induce antigen-specific immune deviation via a mechanism involving transforming growth factor-beta. Eur. J. Immunol. 1992;22:1031–1036. doi: 10.1002/eji.1830220423. [DOI] [PubMed] [Google Scholar]
- Shull M.M., Ornsby I., Kier A.B., Pawlowski S., Diebold R.J., Yin M., Allen R., Sidman C., Proetzel G., Calvin D. Targeted disruption of the mouse transforming growth factor-beta 1 gene results in multifocal inflammatory disease. Nature. 1992;359:693–699. doi: 10.1038/359693a0. [DOI] [PMC free article] [PubMed] [Google Scholar]
- Kulkarni A.B., Huh C.G., Becker D., Geiser A., Lyght M., Flanders K.C., Roberts A.B., Sporn M.B., Ward J.M., Karlsson S. Transforming growth factor beta 1 null mutation in mice causes excessive inflammatory response and early death. Proc. Natl. Acad. Sci. USA. 1993;90:770–774. doi: 10.1073/pnas.90.2.770. [DOI] [PMC free article] [PubMed] [Google Scholar]
- Sundstedt A., Sigvardsson M., Leanderson T., Hedlund G., Kalland T., Dohlsten M. In vivo anergized CD4+ T cells express perturbed AP-1 and NF-κB transcription factors. Proc. Natl. Acad. Sci. USA. 1996;93:979–984. doi: 10.1073/pnas.93.3.979. [DOI] [PMC free article] [PubMed] [Google Scholar]
- Kang S.M., Beverly B., Tran A.C., Brorson K., Schwartz R.H., Lenardo M.J. Transactivation by AP-1 is a molecular target of T cell clonal anergy. Science. 1992;257:1134–1138. doi: 10.1126/science.257.5073.1134. [DOI] [PubMed] [Google Scholar]
- Seder R.A., Paul W.E., Davis M.M., Fazekas de St. Groth B. The presence of interleukin 4 during in vitro priming determines the lymphokine-producing potential of CD4+ T cells from T cell receptor transgenic mice. J. Exp. Med. 1992;176:1091–1098. doi: 10.1084/jem.176.4.1091. [DOI] [PMC free article] [PubMed] [Google Scholar]
- Jenkins M.K., Chen C., Jung G., Mueller D.L., Schwartz R.H. Inhibition of antigen-specific proliferation of type 1 murine T cell clones after stimulation with immobilized anti-CD3 monoclonal antibody. J. Immunol. 1990;144:16–22. [PubMed] [Google Scholar]
- Steinman R.M., Adams J.C., Cohn Z.A. Identification of a novel cell type in peripheral lymphoid organs of mice. IV. Identification and distribution in the spleen. J. Exp. Med. 1975;141:804–820. [PMC free article] [PubMed] [Google Scholar]
- Ridge J.P., Fuchs E., Matzinger P. Neonatal tolerance revisitedturning on newborn T cells with activated dendritic cells. Science. 1996;271:1723–1726. doi: 10.1126/science.271.5256.1723. [DOI] [PubMed] [Google Scholar]
- Umlauf S.W., Beverly B., Lantz O., Schwartz R.H. Regulation of interleukin 2 gene expression by CD28 costimulation in mouse T-cell clonesboth nuclear and cytoplasmic RNAs are regulated with complex kinetics. Mol. Cell. Biol. 1995;15:3197–3205. doi: 10.1128/mcb.15.6.3197. [DOI] [PMC free article] [PubMed] [Google Scholar]
- Leo O., Sachs D.H., Samelson L.E., Foo M., Quinones R., Gress R., Bluestone J.A. Identification of monoclonal antibodies specific for the T cell receptor complex by Fc receptor-mediated CTL lysis. J. Immunol. 1986;137:3874–3880. [PubMed] [Google Scholar]
- Gross J.A., Callas E., Allison J.P. Identification and distribution of the costimulatory receptor CD28 in the mouse. J. Immunol. 1992;149:380–388. [PubMed] [Google Scholar]
- Gibson U. A novel method for real time quantitative RT-PCR. Genome Res. 1996;6:995–1001. doi: 10.1101/gr.6.10.995. [DOI] [PubMed] [Google Scholar]
- Kubo R.T., Born W., Kappler J.W., Marrack P., Pigeon M. Characterization of a monoclonal antibody which detects all murine alpha beta T cell receptors. J. Immunol. 1989;142:2736–2742. [PubMed] [Google Scholar]