

Abstract
To identify novel genes that are involved in positive selection of thymocytes, we performed polymerase chain reaction (PCR)-based subtractive hybridization between selecting and nonselecting thymi. OT-1 T cell receptor (TCR) transgenic thymocytes on a recombination activating gene (RAG) null background are efficiently selected into the CD8 lineage in H-2b mice (RAG-2−/−OT-1, selecting thymi), but are not selected on a transporter associated with antigen processing (TAP) null background (RAG-2−/−TAP-1−/−OT-1, nonselecting thymi). We report here our studies of one gene, ITM2A, whose expression is dramatically higher in T cells in the selecting thymus. The expression pattern of ITM2A in thymocyte subsets correlates with upregulation during positive selection. In addition, ITM2A expression is higher in the thymus than in either the spleen or lymph nodes, but can be upregulated in peripheral T cells upon activation. ITM2A expression was also induced in RAG-2−/− thymocytes in vivo upon CD3 cross-linking. We demonstrate that ITM2A is a type II membrane glycoprotein that exists as two species with apparent Mr of 45 and 43 kD and appears to localize primarily to large cytoplasmic vesicles and the Golgi apparatus, but is also expressed on the cell surface. Expression on the surface of EL4 cells increases with activation by phorbol myristate acetate (PMA) and ionomycin. Finally, overexpression of ITM2A under control of the lck proximal promoter in mice results in partial downregulation of CD8 in CD4+CD8+ double positive (DP) thymocytes, and a corresponding increase in the number of CD4+CD8lo thymocytes. Possible roles for this novel activation marker in thymocyte development are discussed.
Keywords: ITM2A, positive selection, thymocyte, T cell development, T cell activation
The development of mature CD4 and CD8 T cells depends upon a small percentage of immature CD4+CD8+ double positive (DP)1 thymocytes surviving the process of selection in the thymus. To be positively selected into the CD4 or CD8 lineage, the DP cells must express a TCR with intermediate affinity for self-MHC/peptide ligands. DP cells expressing TCR with too low or too high an affinity for the ligand undergo programmed cell death by “neglect” or negative selection, respectively 1 2. Positive selection is a process that is currently characterized and monitored by changes in a limited number of cell surface and intracellular proteins. Hallmark changes during the first stage of selection include an upregulation of CD69 3 4 and CD5 5 6 and a downregulation of intracellular recombination activating gene (RAG)-1 and RAG-2 4 7 8 9. A downregulation of cell surface CD4 and CD8 from high to low levels then occurs, accompanied by an upregulation of TCR/CD3 from low to intermediate levels 10 11 12. The subsequent upregulation of cell surface CD4 and TCR/CD3 results in production of the CD4+CD8loTCRint/hi intermediate cells which are precursors for both lineages 13 14 15. A selective downregulation of one coreceptor accompanied by a further upregulation of the other coreceptor, TCR/CD3, and intracellular bcl-2 characterizes cells that have survived selection and committed to a lineage 12 16 17. Completion of maturation is characterized by the downregulation of CD69 3 and heat-stable antigen (HSA 18) on TCRhi single positive (SP) cells 12.
How do all of these changes occur? Significant progress has been made in identifying the signaling pathways and transcription factors involved in transmitting a signal initiated at the cell surface through binding of the TCR to its ligand into changes in the transcriptional program and surface phenotype of the developing thymocytes. However, not all of the molecules involved in positive selection have been identified. We have used a PCR-based method of subtractive hybridization to find novel genes that are upregulated or downregulated during the differentiative stages between immature DP and mature SP thymocytes, namely, during positive selection. To do this, we used mice expressing a transgenic MHC class I–restricted TCR (OT-1) bred onto a selecting (H-2b) recombination-deficient (RAG-2−/−) background 19 20 or a nonselecting RAG-2−/− transporter associated with antigen processing (TAP)-1−/− background. Without TAP-1, peptides required for the selection of cells expressing MHC class I–restricted TCRs are not transported into the endoplasmic reticulum (ER) and cannot be presented 21. The RAG-2−/−OT-1 mice have a hyperselecting thymus in which primarily CD8 T cells develop. The RAG-2−/−TAP-1−/−OT-1 mice have a nonselecting thymus in which thymocytes are arrested at the DP stage of development. ITM2A was identified as a novel gene in the immune system whose expression was dramatically upregulated in T cells in a selecting thymus.
ITM2A was first cloned by Merregaert and colleagues as a gene whose expression was upregulated in vitro during chondro/osteogenesis of perichondrial precursor cells from explanted prenatal condyles 22. The authors identified a human homologue of ITM2A and two additional family members in both mice and humans by homology searches of the expressed sequence tag (EST) database. The three isoforms were predicted to be type II transmembrane proteins and share 38–49% identity at the amino acid (aa) level, with most of the similarity in the COOH-terminal domain.
Based on the developmentally regulated expression of ITM2A in two different systems, we decided to study this gene in greater detail in the immune system. We characterized expression of ITM2A in thymocytes and peripheral T cells and found that (a) expression in thymocyte subsets correlates with upregulation during positive selection, (b) expression is lower in both spleen and lymph nodes compared with thymus, but is upregulated upon activation of T cells, and (c) expression can be induced in CD4−CD8− double negative (DN) thymocytes by signaling through CD3. Furthermore, we have identified the ITM2A protein and showed that it is a type II transmembrane glycoprotein expressed in vesicles and on the cell surface. Finally, we found that overexpression of an ITM2A transgene in murine thymocytes resulted in a partial downregulation of CD8 in the DP population of thymocytes, providing the first functional information for this gene. ITM2A does not have significant homology to any other gene known to be expressed in the immune system and therefore provides an opportunity to explore the role of a novel protein in T cell development.
Materials and Methods
Mice.
C57BL/6 mice were purchased from The Jackson Laboratory and Taconic Farms. TAP-1−/−OT-1 mice 23 were bred to RAG-2−/− mice 19 20, and the F1 progeny were interbred to obtain RAG-2−/−TAP-1−/−OT-1 mice and RAG-2−/− OT-1 mice. P14 mice express a transgenic TCR specific for p33 in the context of H-2Db 24. lck-ITM2A transgenic mice were generated as follows. The NotI-SalI 1.6-kb fragment of pSPORT1-ITM2A 22, containing the full-length ITM2A cDNA, was cloned into the BamHI site of p1017 25. The 7-kb NotI fragment from p1017-ITM2A was microinjected into fertilized (C57BL/6 × DBA2)F2 embryos to generate founders. Transgenic founders were identified by PCR of genomic DNA using primers for ITM2A (5′-TCATGCCCAAGAGCACCA-3′ and 5′-AGTTCTGTGGATTTCACAATACAGATATCA-3′) and for human growth hormone (hGH; 5′-TAGGAAGAAGCCTATATCCCAAAGG-3′ and 5′-ACAGTCTCTCAAAGTCAGTGGGG-3′). Founders were bred to C57BL/6 mice to establish lines. F1 from three founders (AM573, AM712, and AM713) were used for the analyses here.
Commercial Abs and Flow Cytometric Analysis.
The following conjugates of mAbs were purchased from PharMingen: PE–anti-CD4, FITC–anti-CD8α, biotin–anti-CD45R (B220), biotin–anti-CD11b (Mac-1), biotin-anti–I-Ab (MHC II), biotin–anti-CD3∈, biotin–anti-CD69, biotin–anti-HSA, FITC–goat anti–mouse IgG, and FITC–goat anti–rabbit IgG. Tricolor-streptavidin and PE–anti-hCD2 were purchased from Caltag Laboratories. Antiactin, anti–human c-myc, and horseradish peroxidase–conjugated goat anti–mouse IgG and goat anti–rabbit IgG were purchased from Santa Cruz Biotechnology, Inc. Cells were stained and analyzed by flow cytometry using standard procedures. Flow cytometry was performed on a FACScan™ or FACSCalibur™ (Becton Dickinson) and analyzed using ReproMac software (TrueFacts Software) or CellQuest software (Becton Dickinson).
Isolation of ITM2A by PCR-based Subtractive Hybridization.
Thymi from 4–6-wk-old RAG-2−/−TAP-1−/−OT-1 or RAG-2−/−OT-1 mice were pooled, and total RNA was isolated using RNA STAT-60 (Tel-Test, Inc.). mRNA was isolated using oligo(dT) cellulose spin columns (Amersham Pharmacia Biotech). Double-stranded cDNA primed by oligo(dT) was synthesized with Superscript reverse transcriptase (GIBCO BRL) and used for suppression subtractive hybridization using the Clontech PCR Select kit. In brief, the double-stranded cDNA was digested with RsaI, ligated to adaptors, and subjected to two steps of subtractive hybridization. PCR to amplify the difference products was performed for 27 cycles, and nested PCR was performed for 12 cycles. The subtractive hybridization was performed separately in two directions: “selecting minus nonselecting” and “nonselecting minus selecting.” PCR products were cloned into pCR2.1 (Invitrogen) and screened further by differential hybridization. By comparing signals from hybridization to probes generated from the two different products of subtractive hybridization (“selecting minus nonselecting” and “nonselecting minus selecting”), several differentially expressed clones were identified. The inserts of these clones were sequenced by PCR using the T7 primer and dye Rhodamine reaction mix (Applied Biosystems, Inc.) and the ABI377 (Applied Biosystems, Inc.) automated sequencer. Nonredundant and EST databases were searched using BLAST 2.0 26 for genes homologous to the resulting sequences.
Preparation of RNA Samples and Northern Blot Analysis.
Northern blot analysis was performed essentially as recommended in Current Protocols in Molecular Biology 27. Total RNA was prepared using RNA STAT-60, and mRNA was isolated from total RNA by using a FastTrack kit (Invitrogen). For each Northern blot, 10 μg of total RNA was loaded per lane except for the multitissue analysis (2 μg mRNA) and the analysis of RAG-2−/− thymocytes (8 μg total RNA). The probes used were fragments of or complete cDNAs of mouse ITM2A, mouse RAG-1, mouse TAP-1, mouse CD69, chicken glyceraldehyde 3-phosphate dehydrogenase (GAPDH), mouse EF1α, mouse CD4, and I-Ab (MHC II). They were radiolabeled using a random primer labeling kit (Boehringer Mannheim) and [α-32P]dATP (Dupont). For the multitissue Northern blot, RNA was prepared from whole tissues from C57BL/6 mice. For analysis of thymocytes versus thymus stromal cells, thymocytes were dissociated from stroma by pressing through a Nytex filter. Undissociated stromal material was collected from inside the filter. Total RNA was isolated from the enriched fractions. For analysis of expression in activated T cells, C57BL/6 splenocytes were cultured at 3.0 × 10⁶/ml in DMEM plus 10% FCS medium alone or supplemented with either 5 μg/ml ConA (Calbiochem) or 1.2 ng/ml PMA (Sigma Chemical Co.) and 250 ng/ml ionomycin (Calbiochem). P14 splenocytes were cultured at 2.3 × 10⁶/ml in RP10 alone (−p33) or together with 2.8 × 10⁵/ml irradiated EL4 cells loaded with p33 peptide (+p33) as described 28. Total RNA was isolated from cells harvested at various times during activation. The RAG-2−/− mice were injected intraperitoneally with 150 μg anti-CD3∈ (2C11) Ab or PBS, and thymi were harvested 16 h after injection. Analysis of transgene expression was performed using total RNA from thymus and spleen of transgenic mice and littermate controls.
Reverse Transcription PCR of Sorted Thymocytes, CD4 T Cells, and CD8 T Cells.
CD4 SP, CD8 SP, DN, and DP thymocyte subsets were sorted electronically on the basis of coreceptor expression, and reverse transcription (RT)-PCR was performed in a manner similar to that described previously 29. Threefold serial dilutions of template were used in PCR with primers for ITM2A (described above) or hypoxanthine phosphoribosyltransferase (HPRT) to normalize for template amount. The reaction conditions yielding product in the linear range were 30 cycles of 94°C for 1 min, 55°C for 1 min, and 72°C for 1 min. Mature CD4+CD8− HSAlo and intermediate CD4+CD8loHSAhi thymocytes were isolated by three-color electronic sorting and analyzed by RT-PCR as described above. CD4 and CD8 mature T cells were isolated by immunomagnetic bead purification from C57BL/6 lymph nodes. Lymphocytes were incubated with biotinylated mAbs against CD45R, CD11b, I-Ab, and either CD8 or CD4, then with magnetic streptavidin-coated beads (Dynal). Cells bound to Abs and beads were removed by magnetic force. The remaining CD4+ and CD8+ populations were each >85% pure and >99% free of contaminating CD8+ or CD4+ cells, respectively, as determined by flow cytometry (data not shown). Total RNA isolated from each sorted population was used in RT-PCR as described above.
Generation of Anti-ITM2A Antiserum and Immunoblot Analysis of Cell Lysates.
A glutathione S-transferase (GST)-ITM2A fusion protein containing the first 52 aa of ITM2A was used to immunize New Zealand White rabbits (R and R Rabbitry). A portion of the ITM2A cDNA was cloned into pGEX-2T, and expression and purification of the fusion protein were performed according to the manufacturer's instructions (Amersham Pharmacia Biotech). The antiserum was affinity purified using a Sepharose column to which the GST-ITM2A fusion protein was coupled. To remove anti-GST Abs, the eluate was then immunoabsorbed with GST-coupled Sepharose, and the flow-through was used for immunoblot analysis and immunofluorescent microscopy.
Cell lysates were prepared as described 30 and quantitated by Bradford assay 27. Deglycosylation of cell lysates with EndoH (New England Biolabs) or N-glycosidase F (Boehringer Mannheim) was performed according to the manufacturer's instructions. Mock reactions were similar to the real reactions except the enzymes were omitted. Equal amounts of protein in 1× Laemmli sample buffer (LSB) were loaded per lane for SDS-PAGE and immunoblot analysis 27. Each step of the immunoblot analysis was performed at room temperature for 1 h. Detection of secondary Abs was performed with ECL (Amersham Pharmacia Biotech) followed by autoradiography (Eastman Kodak Co.). Affinity-purified anti–human c-myc and affinity-purified anti-ITM2A antisera were used at 1:100. Antiactin was used at 1:500. Horseradish peroxidase–conjugated secondary Abs, goat anti–mouse IgG, and goat anti–rabbit IgG were used at 1:1,000.
Retrovirus-mediated Expression of an Epitope-tagged ITM2A.
A 10-aa sequence (EQKLISEEDL) from human c-myc was added to the NH2 terminus of ITM2A by using the following primers: 5′-AAAAAAAAAAGCGGCCGCATGGAACAAAAACTGAT-CTCAGAAGAGGACCTGGTGAAGATCGCCTTCAACAC-3′ and 5′-AAAAAAAAAGTCGACTCACTCCTGACAGATCTTGGTTTCA-3′ in PCR with pSPORT1-ITM2A. The PCR product was cloned into the NotI and SalI sites in the retroviral vector PMI 30 31. Generation of the retrovirus, infection of cell lines (EL4 and AKR1010), and enrichment of infected cells were performed as described 30 31. Cell populations enriched to >98% were used for both immunofluorescent microscopy and cell lysates.
Immunofluorescent Confocal Microscopy.
Immunofluorescent microscopy was performed essentially as described 32. In brief, cells were spun onto poly-l-lysine–coated coverslips, fixed in 10% formalin-buffered saline, permeabilized in PBS with 0.2% Triton X-100, and stained with Ab diluted in PBS plus 20% normal goat serum. Primary Ab was anti-ITM2A or anti–human c-myc at 1:100. Secondary Ab was FITC-conjugated goat anti–rabbit IgG or goat anti–mouse IgG at 1:500. The cells were mounted and viewed by confocal microscopy using a 100× oil lens with an MRC-1024 system (Bio-Rad Laboratories) equipped with LaserSharp software and mounted on an Axiovert TV microscope (Carl Zeiss, Inc.).
Biotinylation of EL4 Cell Surface Protein.
EL4 cells were biotinylated at 4°C for 30 min using sulfo-NHS-LC-biotin (Pierce Chemical Co.) 27. After washing the cells twice, lysates were prepared and precleared twice by addition of 0.1 ml 50% Sepharose 2B (Amersham Pharmacia Biotech) and incubation at 4°C for 1 h followed by centrifugation. Precipitation of the biotinylated protein was performed by addition of 0.05 ml 50% streptavidin agarose (Pierce Chemical Co.) to the supernatant and incubation at 4°C for 1 h followed by centrifugation. The supernatant is the unbound fraction. The precipitate (bound fraction) was washed three times then resuspended in 0.05 ml 2× LSB. Nonbiotinylated EL4 cells were treated in a similar manner except for the initial incubation in which biotin was not included. Approximately 50% of the bound fraction and 2% of the unbound fraction were used for SDS-PAGE and immunoblot analysis.
Results
Phenotype of Selecting and Nonselecting Thymi.
To identify genes whose expression was regulated during the development of immature DP thymocytes to mature SP thymocytes, we engineered mice which had a transgenic TCR on either a selecting background or a nonselecting background. RAG-2−/−OT-1 mice express a single MHC class I–restricted TCR on a selecting H-2b background. Flow cytometry analysis of thymocytes showed that the DP cells in these mice are efficiently selected predominantly into the CD8 lineage (Fig. 1 A). Compared with a C57BL/6 thymus, the percentage of DP cells in a RAG-2−/−OT-1 thymus is dramatically decreased and the percentage of intermediate CD4loCD8lo and CD4+CD8lo cells is increased. In addition, a higher percentage of thymocytes in RAG-2−/− OT-1 mice compared with C57BL/6 mice are CD3int/hi and CD69+ (data not shown), suggesting that more cells in a RAG-2−/− OT-1 thymus are undergoing positive selection. Taken together, these data indicate that the thymus of a RAG-2−/− OT-1 mouse is “hyperselecting.” In contrast, RAG-2−/− TAP-1−/−OT-1 mice have a nonselecting thymus. TAP-1 is required for selecting peptides to be transported into the ER by the TAP-1/TAP-2 complex and presented by MHC class I 21. RAG-2 is required for the productive rearrangement and expression of endogenous TCR 19 20. Due to the expression of only the OT-1 transgenic TCR and the absence of selecting MHC–peptide complexes, there were almost no detectable mature CD4 SP or CD8 SP cells in the RAG-2−/−TAP-1−/−OT-1 thymus (Fig. 1 A). Development was blocked at the CD4+CD8+TCRlo stage, with immature DP cells constituting >97% of the thymocytes (Fig. 1 A, and data not shown). The striking absence in RAG-2−/−TAP-1−/−OT-1 mice of both intermediate (CD4+CD8lo and CD4loCD8lo) and mature SP thymocytes compared with the hyperselecting thymus of RAG-2−/− OT-1 mice suggested that subtractive hybridization between these two thymi could reveal genes whose expression is regulated during positive selection.
Figure 1.

Identification of ITM2A as a developmentally regulated gene in the thymus. (A) Flow cytometric analysis of thymocytes from C57BL/6, RAG-2−/−OT-1, and RAG-2−/−TAP-1−/−OT-1 mice. The numbers in each quadrant are the percentage of total thymocytes. Northern blot analysis of (B) RAG-1 and TAP-1 expression in a RAG-2−/−TAP-1−/−OT-1 (nonselecting, NS) or RAG-2−/−OT-1 (selecting, S) thymus and (C) ITM2A in a C57BL/6 (B6), nonselecting (NS), or selecting (S) thymus. The blot in C was probed for ITM2A, stripped, and reprobed for EF1α.
ITM2A Is Upregulated in Thymocytes during T Cell Development.
We performed subtractive hybridization between the RAG-2−/−TAP-1−/−OT-1 and RAG-2−/−OT-1 thymi to identify genes which are differentially expressed. Using this protocol, we cloned RAG-1 and TAP-1, each from the appropriate direction of subtraction, indicating that the subtractive hybridization and subsequent screening were successful. Downregulation of RAG-1 and RAG-2 is one of the earliest signs of positive selection 4 7 8 9. RAG-1 was highly expressed in the nonselecting thymus, consistent with a negligible level of positive selection in this thymus (Fig. 1 B). Conversely, there was only a very low level of RAG-1 transcript in the thymus of RAG-2−/− OT-1 mice. TAP-1 was expressed only in the RAG-2−/− OT-1 mice, as expected. Of 127 cloned products from the subtraction in the “selecting minus nonselecting” direction, 3 corresponded to a fragment of the ITM2A cDNA. Northern blot analysis confirmed that ITM2A is expressed at a much higher level in the RAG-2−/−OT-1 selecting thymus compared with both the nonselecting thymus and the C57BL/6 thymus (Fig. 1 C). Because whole thymi were used as the source material for subtractive hybridization, it was important to determine whether ITM2A was expressed in thymocytes, stromal cells, or both. To address this question, we separated thymocytes from stromal cells of a C57BL/6 thymus. As shown in Fig. 2 A, the relative intensity of the signal detected from thymocytes versus stromal cells with the ITM2A probe was similar to that seen with the CD4 probe (thymocyte specific), but dissimilar to that seen with the MHC II probe (stromal cell specific). Therefore, within the thymus, ITM2A appears to be expressed predominantly in thymocytes.
Figure 2.

ITM2A expression in thymocyte subsets and peripheral T cells. (A) Northern blot analysis of ITM2A in thymic stromal cells (S) and thymocytes (T). The same blot was stripped and rehybridized with probes for CD4 (thymocyte specific) and MHC class II (I-Ab) (stromal cell specific). (B and C) RT-PCR of sorted thymocyte subsets. Threefold serial dilutions of cDNA representing total thymocytes (total) or one of several subsets were used in PCR with primers for ITM2A. PCR amplification of HPRT was performed to normalize for template amount. The subsets analyzed in B were DN, DP, CD4 SP, and CD8 SP and in C were CD4+CD8−HSAlo (4+8−HSAlo) and CD4+CD8loHSAhi (4+8loHSAhi) thymocytes. The same DP sample used in B was included in C as a relative standard for comparison. (D) RT-PCR of peripheral CD4 and CD8 T cells. RT-PCR was performed as in B and C on threefold serial dilutions of cDNA from the purified T cells (CD4 and CD8). For the experiments in B, C, and D, purity of the sorted cells was assessed by flow cytometry (data not shown), and PCR was performed on material from two different sorts with similar results.
To determine the timing of ITM2A expression during normal thymocyte development, we performed RT-PCR analysis of FACS®-sorted thymocyte populations: DN, DP, CD4 SP, and CD8 SP (Fig. 2 B). ITM2A cDNA was barely detected in the DN population, and a low level was detected in the DP and CD8 SP populations. ITM2A appeared to be expressed most highly in the CD4 SP subset. Given that the ITM2A clones came from subtractive hybridization using a selecting thymus in which T cells develop primarily into the CD8 lineage, the higher expression level in the CD4 SP subset compared with the CD8 SP subset was surprising. This could be due to inclusion in the CD4 SP sorted population of some intermediate CD4+ cells which had not fully downregulated CD8, or alternatively there may be differential expression of ITM2A in mature CD4 and CD8 thymocytes. To distinguish between these two possibilities, we isolated mature CD4+CD8−HSAlo and intermediate CD4+ CD8loHSAhi thymocytes and analyzed expression of ITM2A by RT-PCR (Fig. 2 C). Interestingly, of all the subsets examined, CD4+CD8loHSAhi thymocytes had the highest level of ITM2A expression, significantly higher than CD4+ CD8−HSAlo thymocytes. However, the expression level in mature CD4+CD8−HSAlo thymocytes was still higher than that detected in either DP or CD8 SP sorted thymocytes. Thus, mature CD4+ thymocytes express more ITM2A than do mature CD8+ thymocytes.
To determine whether ITM2A was expressed differentially in mature peripheral CD4 and CD8 T cells, we purified CD4 and CD8 T cells from C57BL/6 lymph nodes and performed RT-PCR analysis (Fig. 2 D). The purity of each population was assessed by flow cytometry and RT-PCR using primers for CD4 and CD8 (data not shown). Unlike in sorted thymocytes, ITM2A appeared to be expressed equally in peripheral T cells of both lineages.
ITM2A Is Expressed at a Higher Level in Thymus Compared with Spleen or Lymph Node, but Is Upregulated in Peripheral T Cells by Signaling through the TCR.
We examined expression of ITM2A in several tissues of the adult mouse by Northern blot analysis (Fig. 3). Expression of ITM2A was highest in thymus and skeletal muscle and lower in lymph node and spleen. ITM2A expression was fairly widespread, as low levels were also detected in brain, heart, lung, stomach, and uterus. However, ITM2A was not detected in small intestine, kidney, liver, or testes, even after a long exposure.
Figure 3.

Analysis of ITM2A expression in several tissues. 2 μg of mRNA was loaded per lane. The blot was successively hybridized, stripped, and rehybridized with probes for ITM2A and two housekeeping genes, GAPDH and EF1α.
To determine if ITM2A expression was upregulated in peripheral T cells upon activation, we examined expression in splenocytes harvested at various time points after activation. C57BL/6 splenocytes were cultured in the presence of the T cell mitogen, ConA (Fig. 4 A). Splenocytes from P14 mice, which express an MHC class I–restricted transgenic TCR, were activated by antigen presentation of the cognate peptide (Fig. 4 B). The blots were probed for ITM2A, CD69, a T cell activation marker 33 34 35 36, and EF1α, a housekeeping gene. In both experiments, the amount of ITM2A transcript started to increase within 30 min of activation and peaked at 6 h, reaching a level similar to that in an untreated C57BL/6 thymus. Expression was greatly reduced by 24 h. The kinetics of ITM2A induction in splenocytes were similar to those of CD69 (Fig. 4 A, and data not shown), but ITM2A and CD69 transcripts were present at quite different steady state levels in the thymus. Although these experiments do not exclude the possibility that some amount of the ITM2A transcript was contributed by non-T cells, expression of ITM2A, like CD69, was upregulated as a direct result of signals transmitted through the TCR upon binding of ConA or the more physiological MHC-peptide ligand.
Figure 4.

Northern blot analysis of activated splenocytes. (A) C57BL/6 splenocytes were cultured in medium alone (medium) or supplemented with 5 μg/ml ConA (+ConA). (B) P14 splenocytes were cultured alone (−p33) or in the presence of irradiated EL4 cells coated with p33 peptide (+p33). Total RNA was extracted from cells harvested at various times during activation and from an untreated C57BL/6 thymus (Thy). The blots in A and B were hybridized with probes for ITM2A, EF1α, and CD69 (shown for A only).
ITM2A expression detected by RT-PCR was higher in DP thymocytes compared with DN thymocytes. To see if ITM2A could be induced in DN cells by signaling through CD3, we examined expression in thymocytes from RAG-2−/− mice which had been treated in vivo with anti-CD3∈ Ab (2C11) or PBS (Fig. 5). RAG-2−/− thymocytes consist solely of DN cells which are unable to rearrange their TCR genes, preventing expression of the pre-TCR 19 20. However, they do express low levels of CD3, and cross-linking with anti-CD3∈ Ab activates the DN cells and induces their differentiation into DP cells 37. Northern blot analysis revealed that ITM2A expression was almost undetectable in the control RAG-2−/− thymocytes, but was significantly increased in thymocytes from mice injected with anti-CD3∈ Ab at 16 h after stimulation, before the appearance of any DP cells.
Figure 5.

Northern blot analysis for ITM2A expression in thymocytes from RAG-2−/− mice which were injected with PBS (R), or anti-CD3∈ Ab and harvested 16 h later (R+2C11), and from control C57BL/6 mice (B6). The blot was successively hybridized, stripped, and rehybridized with probes for ITM2A and EF1α.
ITM2A Is a Glycoprotein That Exists as Two Species with Apparent Mr of 45 and 43 kD.
To identify the ITM2A protein, we raised Abs against a GST-ITM2A fusion protein containing the first 52 aa of ITM2A. The polyclonal antiserum was affinity purified and used for immunoblot analysis of cell lysates prepared from EL4 (a thymoma cell line which expresses endogenous ITM2A) and from EL4 transfected with an NH2-terminal myc-tagged version of ITM2A (NmycITM2A; Fig. 6 A, left panel). A specific band corresponding to an apparent Mr of 43 kD was detected with the anti-ITM2A antiserum in both EL4 and EL4+NmycITM2A lysates, but not in the purified GST control sample. A band of this size was not detected using preimmune serum from the same rabbit (data not shown). In identical blots probed with anti–human c-myc Ab (anti-myc), a protein of the same size was detected only in EL4+NmycITM2A (Fig. 6 A, right panel). On close inspection, there appeared to be an additional minor second band. Lysates from EL4, EL4+NmycITM2A, and AKR1010, a CD4+ CD8+ thymoma cell line which does not express ITM2A, were analyzed using gel conditions with greater resolution (Fig. 6 B). Two species were detected with anti-ITM2A antiserum in both EL4 and EL4+NmycITM2A, but not in AKR1010. The two species of ITM2A had apparent relative Mr of 45 and 43 kD, the smaller of which was predominant. Upon stripping and reprobing the blot with anti-myc Ab, two species of identical size were detected in the EL4+NmycITM2A sample, but not in either EL4 or AKR1010 (data not shown).
Figure 6.

Identification of ITM2A protein. (A) Immunoblot analysis of purified GST and lysates from EL4 cells or EL4 transfected with NmycITM2A. Samples of purified GST (20 ng), EL4 lysate (100 μg), and EL4+ NmycITM2A lysate (100 μg) were run on denaturing 10% polyacrylamide 6-cm gels, transferred to membrane, and used for immunoblot analysis with affinity-purified anti-ITM2A antiserum (left panel) or anti–human c-myc Ab (9E10; right panel). (B) Immunoblot analysis of lysates from EL4, EL4+NmycITM2A (Nmyc), or AKR1010 (1010). 100 μg of each lysate was run on a denaturing 10% polyacrylamide 20-cm gel, transferred to membrane, and used for immunoblot analysis with affinity-purified anti-ITM2A antiserum. (C) Deglycosylation of EL4 lysates. Lysates from EL4 cells were denatured and then treated with EndoH (EndoH +) or N-glycosidase F (N Gly +), incubated in mock reactions (EndoH − and N Gly −, respectively), or left untreated (U).
ITM2A had been predicted to be a 263-aa type II integral membrane protein with a 52-aa NH2-terminal domain, a 23-aa transmembrane domain, and a 188-aa COOH-terminal domain 22. The observed sizes of the two species detected with anti-ITM2A antiserum (45 and 43 kD) were significantly larger than the predicted size for ITM2A (30 kD), possibly due to posttranslational modification. A single putative N-linked glycosylation site had been predicted at aa position 166 (within the COOH-terminal extracellular domain [22]). To determine if ITM2A had N-linked glycosylation, we treated the EL4 cell lysate with either EndoH or N-glycosidase F and analyzed the digested proteins by SDS-PAGE and immunoblot analysis (Fig. 6 C). Treatment with EndoH resulted in increased mobility of a fraction of the ITM2A protein. The smaller species had an apparent Mr of 39 kD. It was not possible to discern from which of the two larger species it was derived. The amount of the 39-kD species formed by EndoH digestion is likely to reflect the amount of ITM2A protein in the ER. Digestion with N-glycosidase F resulted in a complete conversion of the two larger species of ITM2A to the smaller 39-kD species. Since there is only one potential N-linked glycosylation site in the predicted protein, and complete removal of N-linked glycosylation reduces both ITM2A species to a single band, the difference in size between the 45 and the 43 kD species must be due to differential N-linked glycosylation. Since the single predicted N-linked glycosylation site is within the COOH-terminal domain, our data demonstrating its use support the prediction that ITM2A is a type II transmembrane protein.
Immunofluorescent Microscopy of EL4 Cells Reveals Heterogeneous Expression and Subcellular Distribution of ITM2A.
To determine the subcellular localization of ITM2A protein, we performed immunofluorescent microscopy of two thymoma cell lines, EL4 and AKR1010, using the affinity-purified anti-ITM2A antiserum. A positive signal was detected in EL4 cells (Fig. 7A and Fig. D), which express endogenous ITM2A, but not in AKR1010 cells (Fig. 7 B), which do not express ITM2A. No signal was seen in EL4 when anti-ITM2A antiserum was replaced by preimmune serum or normal rabbit IgG (Fig. 7 C). The expression of ITM2A in EL4 was heterogeneous, both in amount and subcellular localization. ITM2A staining in EL4 ranged from undetectable to very bright. In the majority of cells in which protein was detected, ITM2A appeared to localize primarily to large cytoplasmic vesicles, possibly endosomes, and a large perinuclear structure, presumably the Golgi apparatus. In some cells, ITM2A seemed to localize to the plasma membrane, as indicated by a characteristic ring pattern (Fig. 7 A, arrows). ITM2A was not detected in the nucleus. Immunofluorescent microscopy of EL4+NmycITM2A using the anti-myc Ab gave a pattern identical to that seen in EL4 cells with anti-ITM2A antiserum (data not shown). In these cells, the myc-tagged version of ITM2A was expressed from a heterologous promoter (the retroviral LTR) which should be active in all of the retrovirally transduced cells. This suggests that the heterogeneous expression of ITM2A protein among individual cells may be regulated at the translational or posttranslational level, rather than at the transcriptional level. Therefore, ITM2A expression may be regulated at several points.
Figure 7.

Subcellular localization of ITM2A. Immunofluorescent microscopy of EL4 cells (A, C, and D) or AKR1010 cells (B) with affinity-purified anti-ITM2A antiserum (A, B, and D) or normal rabbit IgG (C). Cells in D were activated by culturing for 24 h in medium supplemented with 1.2 ng/ml PMA and 250 ng/ml ionomycin. The top panel in each portion of the figure is the fluorescent image, and the bottom panel is the phase image of the same cells.
Experiments described above indicated that ITM2A was induced by activation. Although the endogenous level of ITM2A transcript in EL4 cells was comparable to that in a C57BL/6 thymus (data not shown), given the heterogeneity of expression observed at the protein level it was of interest to determine what would happen to the amount and subcellular localization of ITM2A protein upon activation. EL4 cells were cultured in medium supplemented with PMA and ionomycin for 24 h, then analyzed by immunofluorescent microscopy (Fig. 7 D). After activation, virtually every cell had detectable levels of ITM2A (although there was still a wide range of expression) and, surprisingly, ITM2A appeared to localize to the plasma membrane in almost all of the cells. This apparent change in localization could be due to increased trafficking of existing intracellular stores of ITM2A to the cell surface, increased expression, or both. Based on the overall intensity of the ITM2A signal observed in immunofluorescent microscopy (Fig. 7 D) and in immunoblot analysis of cell lysates (data not shown), there was a significant increase in the amount of ITM2A protein produced in EL4 cells after activation which correlated with the increase in transcription (Fig. 4). However, we observed many cells after activation that had the characteristic ring pattern but only low ITM2A protein levels, suggesting that an increase in the amount of protein alone was not sufficient to explain the apparent increase in plasma membrane–associated protein.
We also examined the subcellular localization of ITM2A in thymocytes and lymph node cells from C57BL/6 and RAG-2−/−OT-1 mice (data not shown). The proportion of cells expressing ITM2A protein in these samples correlated with the relative level of transcription (Fig. 1 C and Fig. 3), with a higher percentage of expressing cells in RAG-2−/−OT-1 thymocytes (∼18%) compared with C57BL/6 thymocytes (∼6%), and a higher percentage of expressing thymocytes compared with lymph node cells of either strain. The pattern of subcellular localization in thymocytes was similar to that in EL4 cells, with most cells exhibiting vesicular and perinuclear staining. Cells with bright characteristic ring patterns were observed only rarely, even in RAG-2−/−OT-1 thymocytes, suggesting that the number of thymocytes with plasma membrane expression of ITM2A at any one time was quite low.
ITM2A Is Expressed on the Cell Surface.
Although the ring patterns observed by immunofluorescent microscopy of EL4 cells, particularly after activation, suggested that at least a portion of ITM2A was expressed on the cell surface, the small size of the cytoplasm in these cells and the resolution of confocal microscopy made it impossible to tell if this was the case. To determine if ITM2A was expressed on the cell surface, we biotinylated EL4 cells at 4°C (to prevent endocytosis), then lysed the cells and precipitated the biotinylated proteins with streptavidin-agarose. Both the bound material and the unbound material were analyzed by SDS-PAGE and immunoblot analysis with anti-ITM2A antiserum and antiactin Ab (Fig. 8). Lysates of nonbiotinylated EL4 cells were precipitated and analyzed in the same manner. ITM2A was detected in both the bound and unbound fractions from surface biotinylated EL4 cells, but only in the unbound fraction from control cells. To control for intracellular protein in the bound fraction, the blots were stripped and reprobed with antiactin Ab. Actin was readily detected in the unbound fractions, but not in the precipitate, from both biotinylated and nonbiotinylated cells. Addition of increasing amounts of streptavidin-agarose to biotinylated EL4 cell lysates failed to precipitate more ITM2A (data not shown). Assuming the biotinylation reaction was complete, we estimate the fraction of cell surface ITM2A protein to be ∼4% of the total ITM2A protein in a population of cells. Given the heterogeneous expression and subcellular localization pattern of ITM2A, described above, this fraction could be much higher in some cells. Our demonstration of surface expression further supports the prediction that ITM2A is a type II transmembrane protein.
Figure 8.

ITM2A is expressed on the cell surface. EL4 cells were surface biotinylated (+biotin) or not (−biotin), then lysed. The biotinylated proteins in the cell lysate were precipitated with streptavidin-agarose, and both bound (B) and unbound (UB) fractions were analyzed by immunoblot analysis. Blots were successively probed, stripped, and reprobed with affinity-purified anti-ITM2A antiserum (top panel) and antiactin Ab (bottom panel).
Overexpression of ITM2A under Control of the lck Proximal Promoter in Mice Causes Downregulation of CD8 in DP Thymocytes.
ITM2A transcription in the thymus appears to be tightly regulated, occurring at significant levels at only certain developmental stages. To determine if overexpression of ITM2A would perturb thymocyte development, we generated transgenic mice which expressed ITM2A under control of the lck proximal promoter. Three founders (AM573, AM712, and AM713) were bred to C57BL/6 mice. The transgene transcript was distinguishable by size from the endogenous message (Fig. 9 A). The transgenic progeny of all three founders exhibited high levels of transgene expression in both the thymus (Fig. 9 A) and spleen (data not shown) relative to endogenous ITM2A. Immunoblot analysis of thymocytes showed that the ITM2A protein was also expressed significantly higher in transgenic mice compared with the littermate controls (data not shown).
Figure 9.
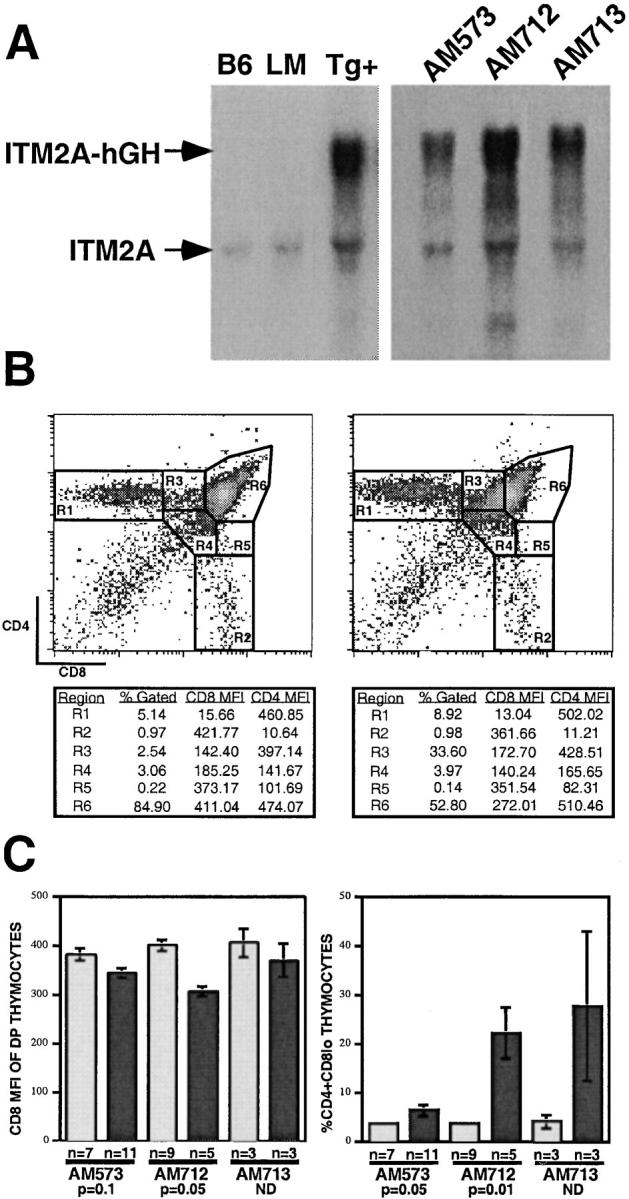
Expression of ITM2A in transgenic mice under control of the lck proximal promoter. (A) Northern blot analysis of transgene expression. In the left panel, the samples were thymus RNA from C57BL/6 (B6) mice, or transgenic (Tg+) or littermate control (LM) mice from the AM573 founder line. In the right panel, the samples were thymus RNA from progeny of three founder lines: AM573, AM712, and AM713. (B) Flow cytometry analysis of thymocytes from a littermate control (left) and a transgenic mouse (right) of the AM712 founder line. The percentage of total thymocytes (% Gated), CD8 mean fluorescence intensity (MFI), and CD4 MFI for each gated region are shown below each plot. (C) Mean values and SEM are shown for the CD8 MFI of DP thymocytes (R6) (left panel) and the percentage of CD4+CD8lo cells (R3) of total thymocytes (right panel) from littermate control (light gray bars) and transgenic (dark gray bars) mice. The number of mice analyzed (n) is shown below the bar for each group. The significance of the difference between littermate control and transgenic mice is shown for the AM573 and AM712 founder lines (based on the Mann-Whitney U test, reference 42). (The n value for each group in the AM713 founder line was too low to apply this test.)
Thymocytes from both transgenic and littermate control mice were analyzed by three-color flow cytometry for expression of CD4, CD8, CD3, CD69, and HSA. The FACS® plots shown in Fig. 9 B represent littermate control (left) and transgenic mice (right) from the AM712 founder line. Expression of ITM2A under the lck proximal promoter had no significant effect on thymus cellularity (data not shown). However, expression of the transgene correlated significantly with a decrease in the mean surface levels of CD8 on DP thymocytes (R6) and with a corresponding increase in the percentage of CD4+CD8lo cells (R3; Fig. 9B and Fig. C). The AM573 founder line exhibited the mildest phenotype, with only a 1.6-fold increase in the mean percentage of CD4+CD8lo thymocytes in transgenic mice, even though expression of the transgene was much higher than endogenous ITM2A. The AM712 and AM713 founder lines, which had higher levels of transgene expression, exhibited a 5.9- and 6.6-fold increase, respectively, in the mean percentage of CD4+CD8lo cells relative to littermate controls.
In T cell development, CD4+CD8lo thymocytes are transitional intermediates between immature DP cells and mature SP cells and are capable of differentiating into either the CD4 or CD8 lineage 13 14 15. They are characterized by high cell surface expression of CD69 and CD5, intermediate to high surface levels of TCR, and high intracellular levels of bcl-2 12 16 17. However, flow cytometry analysis of the CD4+CD8lo cells (R3) from the transgenic mice revealed that they had low levels of CD69 and CD3, a surface phenotype similar to the majority of DP thymocytes in a normal thymus (data not shown). Therefore, the CD4+CD8lo thymocytes of the transgenic mice did not appear to be typical transitional cells and more closely resembled DP cells which had simply downregulated their surface level of CD8. It was possible that this population was derived from DN thymocytes that exhibited delayed expression of CD8 during differentiation into DP thymocytes, rather than from DP cells which had downregulated CD8. To address this, we performed kinetic analysis of thymocyte differentiation in both transgenic and littermate control mice by labeling with 5-bromo-2′-deoxyuridine (BrdU; data not shown). At 5 h after injection, ∼6% of thymocytes were labeled and these consisted mainly of DP cells. Importantly, there was no enrichment of CD4+CD8lo cells in the transgenic BrdU+ cells relative to the littermate control. These data strongly suggest that the CD4+CD8lo population in the transgenic mice was derived from DP cells upon CD8 downregulation.
Interestingly, this degree of CD8 downregulation was not observed in either the CD8 SP thymocytes or the peripheral CD8 T cells of the transgenic mice, despite the fact that the transgene was expressed at a much higher level than endogenous ITM2A in splenocytes (data not shown). Furthermore, transfection of AKR1010 cells with ITM2A did not cause downregulation of their low level of CD8, and expression of ITM2A was readily detected by RT-PCR in other thymoma cell lines which have high surface expression of CD8 (AKR.1 38 and 1200M 39; data not shown). Therefore, the influence of ITM2A expression on CD8 surface expression appeared to be specific to a particular stage in thymocyte development.
Discussion
Several molecules have been identified which are upregulated or downregulated during positive selection, but the mechanism governing this process is still unclear. Using subtractive hybridization between a thymus which has a high degree of positive selection and a thymus which is blocked at the immature DP stage, we have identified ITM2A as a novel marker for T cell development. Like other markers of T cell selection, e.g., CD69 and CD5, ITM2A appears to be transcriptionally upregulated during the transition from DP to SP thymocytes. This was observed in two ways: (a) higher levels of ITM2A transcript were seen in a selecting C57BL/6 or hyperselecting RAG-2−/−OT-1 thymus compared with a nonselecting RAG-2−/−TAP-1−/−OT-1 thymus which is blocked at the DP stage of T cell development; and (b) RT-PCR analysis of sorted thymocyte subsets showed dramatically higher expression in the intermediate CD4+CD8loHSAhi cells compared with the DP subset.
ITM2A was cloned from a thymus in which immature DP cells developed predominantly into the CD8 lineage, yet its expression appeared to be higher in the sorted CD4 SP subset compared with the CD8 SP subset. By analyzing ITM2A expression in sorted mature CD4+CD8−HSAlo and intermediate CD4+CD8loHSAhi thymocytes, it was determined that expression is significantly higher in the CD4+CD8loHSAhi population. The majority of thymocytes in RAG-2−/−OT-1 mice appear to be cells that are intermediate between DP and mature SP. In these mice, too, ITM2A message was found to be enriched in the CD4+CD8loHSAhi thymocytes (data not shown). Inclusion of a portion of the CD4+CD8loHSAhi intermediate cells in the CD4 SP sorted subset cannot fully account for the higher ITM2A expression compared with the CD8 SP subset, since mature CD4+CD8−HSAlo cells also had more message than CD8 SP cells. In contrast, RT-PCR analysis of peripheral CD4 and CD8 T cells showed that ITM2A was expressed at similar levels in these two populations, arguing against a lineage-specific expression pattern. Higher expression of ITM2A in mature CD4+ thymocytes may reflect a unique requirement for ITM2A in these cells during development, perhaps in regulating CD8 coreceptor expression. Alternatively, there may simply be a difference in the rate of ITM2A downregulation as CD4+CD8loHSAhi intermediate thymocytes are selected into each lineage. Given the lower level of message in the peripheral organs compared with the thymus, ITM2A expression appears to be downregulated not only during the differentiation of CD4+CD8loHSAhi intermediate cells into mature CD4+ and CD8+ thymocytes, but also during the final stages of thymocyte maturation or emigration to the periphery.
The pattern of ITM2A expression in the sorted thymocyte subsets correlated with upregulation during positive selection, but the higher expression in DP cells compared with DN cells suggested that ITM2A expression could be induced to a lesser extent earlier in thymocyte development. The increased expression in RAG-2−/− thymocytes upon cross-linking of CD3 confirmed this hypothesis, demonstrating that ITM2A could be upregulated in DN thymocytes. This increase was not due to expression from DP cells, since the thymuses were harvested at 16 h after stimulation, before differentiation into DP thymocytes 40. Upregulation may occur in the DN cells of a normal thymus upon signaling through the pre-TCR. ITM2A was recently cloned by another group in a screen for genes which are expressed in CD34+ hematopoietic stem/progenitor cells 41. Therefore, ITM2A may be involved at several steps in T cell development.
Although ITM2A was detected at a much lower level in peripheral organs compared with the thymus, its expression in splenocytes was significantly increased by activation, either by signaling through the TCR (with ConA or an MHC-peptide ligand) or by directly activating protein kinase C and increasing intracellular calcium (with PMA and ionomycin, data not shown). Activation with either a nonphysiological (ConA or PMA and ionomycin) or a physiological (MHC-peptide ligand) signal resulted in steady state levels of ITM2A transcription comparable to that in the thymus. These data, together with the increased expression in RAG-2−/− thymocytes upon CD3 cross-linking and in CD4 SP cells compared with DP cells, demonstrate that ITM2A transcription is induced or upregulated by signals transmitted through the TCR/CD3, either in thymocytes or mature T cells. Thus, we propose that ITM2A is a novel activation marker, both in thymocyte development and peripheral T cell activation.
We present strong evidence that ITM2A is a type II transmembrane glycoprotein expressed on the cell surface. First, using affinity-purified anti-ITM2A antiserum directed against the first 52 aa of the protein, we showed that ITM2A exists as two species, 45 and 43 kD, which appear to be differentially glycosylated since removal of N-linked glycosylation results in a single species of ∼39 kD. The demonstration of N-linked glycosylation is consistent with the COOH-terminal domain (in which the glycosylation site resides) being extracellular. Second, immunofluorescent microscopy analysis of EL4 cells suggested that at least a fraction of ITM2A protein is expressed on the cell surface, and detection of ITM2A in the fraction of proteins precipitated with streptavidin-agarose after cell surface biotinylation confirmed this. The amount of surface-expressed ITM2A increased after activation with PMA and ionomycin. Our experiments did not address whether this was due to a change in trafficking or simply to an increase in the total amount of ITM2A protein, but the expression of ITM2A clearly increased with activation, at both the transcriptional level and the protein level. Third, using the anti-ITM2A antiserum we were unable to detect ITM2A by flow cytometry, even with cells that gave surface staining in immunofluorescent microscopy (data not shown). The likely explanation for this result is that the NH2-terminal domain of ITM2A was inaccessible due to being intracellular, consistent with a type II transmembrane topology. CD69 is an activation-induced type II transmembrane glycoprotein which exists as a disulfide-linked homodimer of two differentially glycosylated proteins both in mice and humans (in which it has only one potential N-linked glycosylation site [33–36]). It will be of interest to determine whether ITM2A, too, forms a homodimer.
Transgenic mice which expressed the full-length wild-type ITM2A cDNA under control of the lck promoter had a much higher level of ITM2A compared with the littermate controls in both the thymus (Fig. 9 A) and the spleen (data not shown), at both the transcriptional level (Fig. 9 A) and the protein level (data not shown). We found that overexpression of ITM2A caused a partial downregulation of the mean surface level of CD8 in DP thymocytes and a corresponding increase in the mean percentage of CD4+CD8lo cells (Fig. 9B and Fig. C). However, the CD4+CD8lo cells did not express higher levels of either CD69 or TCR/CD3 compared with DP cells of a normal thymus and, thus, did not appear to be normal transitional intermediates. Based on kinetic studies using BrdU labeling, these transgenic CD4+CD8lo cells appear to be derived from DP cells upon downregulation of surface CD8 rather than from DN cells exhibiting delayed CD8 expression during differentiation into DP cells (data not shown). One of the first steps in positive selection of DP thymocytes to SP thymocytes is the downregulation of both CD4 and CD8 coreceptors, and CD8 downregulation starts before CD4 10. Although the effect of ITM2A overexpression could be aberrant, it is tempting to speculate that ITM2A has a role in this early step of positive selection. The same level of downregulation in CD8 surface levels was not observed in either mature CD8 SP thymocytes or peripheral CD8 T cells. This could be due to the lower level of transgene expression in splenocytes compared with thymocytes, although it was significantly higher than the endogenous ITM2A expression. Alternatively, the effect of the transgene expression could be context dependent, occurring only at a particular stage of T cell development.
In addition, we noted a slight increase in the ratio of CD4 to CD8 cells in the transgenic mice, in both the mature thymocyte subsets (R1/R2) and the peripheral T cells (data not shown). The lower surface level of CD8 in the DP thymocytes of the transgenic mice could affect the CD4/CD8 ratio by decreasing the overall affinity of the interaction of TCR with selecting MHC class I–peptide ligands. Positive selection of MHC class I–restricted T cells in the absence of CD8 coreceptor was increased by addition of an MHC–peptide complex for which the TCR has a greater affinity 29. Perhaps the decreased surface level of CD8 in the transgenic DP thymocytes causes a sufficient decrease in the affinity of MHC class I–restricted TCR–ligand interactions such that a fraction of DP cells which would have been selected instead die by neglect.
Given that ITM2A appears to be developmentally regulated in two different systems, chondro/osteogenesis and T cell development, it is worth speculating what common role it might play. If the role of ITM2A in thymocyte development is to alter the surface level of coreceptor, perhaps it also has a role in regulating expression of molecules which contribute to the affinity of interactions between developing chondrocytes or osteocytes with their stromal elements, and the resulting intracellular signaling. Further experiments that directly address the role of ITM2A in a normal thymus and in developing chondro/osteocytes will need to be done.
Acknowledgments
We thank Dr. Anne Norment for providing the Northern blot used for analysis of RAG-2−/− mice which were treated with anti-CD3 Ab, Katherine Forbush for help with generating the transgenic mice, Deb Wilson for care of the mice, and Drs. Naomi Morrissette and David Underhill for help with the confocal microscopy. We thank Ananda Goldrath and Drs. Anne Norment and You-Wen He for a critical reading of the manuscript.
This work was supported by National Institutes of Health grant AI29802, and by the Howard Hughes Medical Institute.
Footnotes
1used in this paper: aa, amino acid(s); BrdU, 5-bromo-2′-deoxyuridine; DN, CD4−CD8− double negative; DP, CD4+CD8+ double positive; ER, endoplasmic reticulum; GAPDH, glyceraldehyde 3-phosphate dehydrogenase; GST, glutathione S-transferase; HPRT, hypoxanthine phosphoribosyltransferase; HSA, heat-stable antigen; RAG, recombination activating gene; RT, reverse transcription; SP, single positive; TAP, transporter associated with antigen processing
References
- Kisielow P., von Boehmer H. Development and selection of T cellsfacts and puzzles. Adv. Immunol. 1995;58:87–209. doi: 10.1016/s0065-2776(08)60620-3. [DOI] [PubMed] [Google Scholar]
- Jameson S.C., Bevan M.J. T-cell selection. Curr. Opin. Immunol. 1998;10:214–219. doi: 10.1016/s0952-7915(98)80251-3. [DOI] [PubMed] [Google Scholar]
- Bendelac A., Matzinger P., Seder R.A., Paul W.E., Schwartz R.H. Activation events during thymic selection. J. Exp. Med. 1992;175:731–742. doi: 10.1084/jem.175.3.731. [DOI] [PMC free article] [PubMed] [Google Scholar]
- Brandle D., Muller S., Muller C., Hengartner H., Pircher H. Regulation of RAG-1 and CD69 expression in the thymus during positive and negative selection. Eur. J. Immunol. 1994;24:145–151. doi: 10.1002/eji.1830240122. [DOI] [PubMed] [Google Scholar]
- Punt J.A., Osborne B.A., Takahama Y., Sharrow S.O., Singer A. Negative selection of CD4+CD8+ thymocytes by T cell receptor–induced apoptosis requires a costimulatory signal that can be provided by CD28. J. Exp. Med. 1994;179:709–713. doi: 10.1084/jem.179.2.709. [DOI] [PMC free article] [PubMed] [Google Scholar]
- Dutz J.P., Ong C.J., Marth J., Teh H.S. Distinct differentiative stages of CD4+CD8+ thymocyte development defined by the lack of coreceptor binding in positive selection. J. Immunol. 1995;154:2588–2599. [PubMed] [Google Scholar]
- Borgulya P., Kishi H., Uematsu Y., von Boehmer H. Exclusion and inclusion of alpha and beta T cell receptor alleles. Cell. 1992;69:529–537. doi: 10.1016/0092-8674(92)90453-j. [DOI] [PubMed] [Google Scholar]
- Brandle D., Muller C., Rulicke T., Hengartner H., Pircher H. Engagement of the T-cell receptor during positive selection in the thymus down-regulates RAG-1 expression. Proc. Natl. Acad. Sci. USA. 1992;89:9529–9533. doi: 10.1073/pnas.89.20.9529. [DOI] [PMC free article] [PubMed] [Google Scholar]
- Kouskoff V., Vonesch J.L., Benoist C., Mathis D. The influence of positive selection on RAG expression in thymocytes. Eur. J. Immunol. 1995;25:54–58. doi: 10.1002/eji.1830250111. [DOI] [PubMed] [Google Scholar]
- Lucas B., Vasseur F., Penit C. Normal sequence of phenotypic transitions in one cohort of 5-bromo-2′-deoxyuridine-pulse-labeled thymocytes. Correlation with T cell receptor expression. J. Immunol. 1993;151:4574–4582. [PubMed] [Google Scholar]
- Lucas B., Vasseur F., Penit C. Production, selection, and maturation of thymocytes with high surface density of TCR. J. Immunol. 1994;153:53–62. [PubMed] [Google Scholar]
- Lucas B., Germain R.N. Unexpectedly complex regulation of CD4/CD8 coreceptor expression supports a revised model for CD4+CD8+ thymocyte differentiation. Immunity. 1996;5:461–477. doi: 10.1016/s1074-7613(00)80502-6. [DOI] [PubMed] [Google Scholar]
- Kydd R., Lundberg K., Vremec D., Harris A.W., Shortman K. Intermediate steps in thymic positive selection Generation of CD 4−8+T cells in culture from CD4+8+, CD4int8+, and CD4+8int thymocytes with up-regulated levels of TCR-CD3. J. Immunol. 1551995. 3806 3814 [PubMed] [Google Scholar]
- Lundberg K., Heath W., Kontgen F., Carbone F.R., Shortman K. Intermediate steps in positive selectiondifferentiation of CD4+8intTCRint thymocytes into CD4−8+TCRhi thymocytes. J. Exp. Med. 1995;181:1643–1651. doi: 10.1084/jem.181.5.1643. [DOI] [PMC free article] [PubMed] [Google Scholar]
- Suzuki H., Punt J.A., Granger L.G., Singer A. Asymmetric signaling requirements for thymocyte commitment to the CD4+ versus CD8+ T cell lineagesa new perspective on thymic commitment and selection. Immunity. 1995;2:413–425. doi: 10.1016/1074-7613(95)90149-3. [DOI] [PubMed] [Google Scholar]
- Linette G.P., Grusby M.J., Hedrick S.M., Hansen T.H., Glimcher L.H., Korsmeyer S.J. Bcl-2 is upregulated at the CD4+ CD8+ stage during positive selection and promotes thymocyte differentiation at several control points. Immunity. 1994;1:197–205. doi: 10.1016/1074-7613(94)90098-1. [DOI] [PubMed] [Google Scholar]
- Punt J.A., Suzuki H., Granger L.G., Sharrow S.O., Singer A. Lineage commitment in the thymusonly the most differentiated (TCRhibcl-2hi) subset of CD4+CD8+ thymocytes has selectively terminated CD4 or CD8 synthesis. J. Exp. Med. 1996;184:2091–2099. doi: 10.1084/jem.184.6.2091. [DOI] [PMC free article] [PubMed] [Google Scholar]
- Crispe I.N., Bevan M.J. Expression and functional significance of the J11d marker on mouse thymocytes. J. Immunol. 1987;138:2013–2018. [PubMed] [Google Scholar]
- Mombaerts P., Iacomini J., Johnson R.S., Herrup K., Tonegawa S., Papaioannou V.E. RAG-1-deficient mice have no mature B and T lymphocytes. Cell. 1992;68:869–877. doi: 10.1016/0092-8674(92)90030-g. [DOI] [PubMed] [Google Scholar]
- Shinkai Y., Rathbun G., Lam K.P., Oltz E.M., Stewart V., Mendelsohn M., Charron J., Datta M., Young F., Stall A.M. RAG-2-deficient mice lack mature lymphocytes owing to inability to initiate V(D)J rearrangement. Cell. 1992;68:855–867. doi: 10.1016/0092-8674(92)90029-c. [DOI] [PubMed] [Google Scholar]
- Van Kaer L., Ashton R.P.G., Ploegh H.L., Tonegawa S. TAP1 mutant mice are deficient in antigen presentation, surface class I molecules, and CD4−8+ T cells. Cell. 1992;71:1205–1214. doi: 10.1016/s0092-8674(05)80068-6. [DOI] [PubMed] [Google Scholar]
- Deleersnijder W., Hong G., Cortvrindt R., Poirier C., Tylzanowski P., Pittois K., Van M.E., Merregaert J. Isolation of markers for chondro-osteogenic differentiation using cDNA library subtraction. Molecular cloning and characterization of a gene belonging to a novel multigene family of integral membrane proteins. J. Biol. Chem. 1996;271:19475–19482. doi: 10.1074/jbc.271.32.19475. [DOI] [PubMed] [Google Scholar]
- Martin S., Bevan M.J. Antigen-specific and nonspecific deletion of immature cortical thymocytes caused by antigen injection. Eur. J. Immunol. 1997;27:2726–2736. doi: 10.1002/eji.1830271037. [DOI] [PubMed] [Google Scholar]
- Pircher H., Burki K., Lang R., Hengartner H., Zinkernagel R.M. Tolerance induction in double specific T-cell receptor transgenic mice varies with antigen. Nature. 1989;342:559–561. doi: 10.1038/342559a0. [DOI] [PubMed] [Google Scholar]
- Chaffin K.E., Perlmutter R.M. A pertussis toxin-sensitive process controls thymocyte emigration. Eur. J. Immunol. 1991;21:2565–2573. doi: 10.1002/eji.1830211038. [DOI] [PubMed] [Google Scholar]
- Altschul S.F., Madden T.L., Schaffer A.A., Zhang J., Zhang Z., Miller W., Lipman D.J. Gapped BLAST and PSI-BLASTa new generation of protein database search programs. Nucleic Acids Res. 1997;25:3389–3402. doi: 10.1093/nar/25.17.3389. [DOI] [PMC free article] [PubMed] [Google Scholar]
- Ausubel, F.M. 1994–1997. Current Protocols in Molecular Biology. 3 vols. V.B. Chanda, series editor. John Wiley & Sons, Inc., New York. 4.1–4.10, 10.1–10.8.
- Martin S., Bevan M.J. Transient alteration of T cell fine specificity by a strong primary stimulus correlates with T cell receptor down-regulation. Eur. J. Immunol. 1998;28:2991–3002. doi: 10.1002/(SICI)1521-4141(199810)28:10<2991::AID-IMMU2991>3.0.CO;2-B. [DOI] [PMC free article] [PubMed] [Google Scholar]
- Goldrath A.W., Hogquist K.A., Bevan M.J. CD8 lineage commitment in the absence of CD8. Immunity. 1997;6:633–642. doi: 10.1016/s1074-7613(00)80351-9. [DOI] [PMC free article] [PubMed] [Google Scholar]
- Deftos M.D., He Y.-W., Ojala E.W., Bevan M.J. Correlating notch signaling with thymocyte maturation. Immunity. 1998;9:777–786. doi: 10.1016/s1074-7613(00)80643-3. [DOI] [PMC free article] [PubMed] [Google Scholar]
- He Y.-W., Deftos M.L., Ojala E.W., Bevan M.J. RORgammat, a novel isoform of an orphan receptor, negatively regulates Fas ligand expression and IL-2 production in T cells. Immunity. 1998;9:797–806. doi: 10.1016/s1074-7613(00)80645-7. [DOI] [PMC free article] [PubMed] [Google Scholar]
- Morrissette N.S., Bedian V., Webster P., Roos D.S. Characterization of extreme apical antigens from Toxoplasma gondii . Exp. Parasitol. 1994;79:445–459. doi: 10.1006/expr.1994.1106. [DOI] [PubMed] [Google Scholar]
- Hara T., Jung L.K., Bjorndahl J.M., Fu S.M. Human T cell activation. III. Rapid induction of a phosphorylated 28 kD/32 kD disulfide-linked early activation antigen (EA 1) by 12-o-tetradecanoyl phorbol-13-acetate, mitogens, and antigens. J. Exp. Med. 1986;164:1988–2005. doi: 10.1084/jem.164.6.1988. [DOI] [PMC free article] [PubMed] [Google Scholar]
- Bjorndahl J.M., Nakamura S., Hara T., Jung L.K., Fu S.M. The 28-kDa/32-kDa activation antigen EA 1. Further characterization and signal requirements for its expression. J. Immunol. 1988;141:4094–4100. [PubMed] [Google Scholar]
- Yokoyama W.M., Koning F., Kehn P.J., Pereira G.M., Stingl G., Coligan J.E., Shevach E.M. Characterization of a cell surface-expressed disulfide-linked dimer involved in murine T cell activation. J. Immunol. 1988;141:369–376. [PubMed] [Google Scholar]
- Ziegler S.F., Levin S.D., Johnson L., Copeland N.G., Gilbert D.J., Jenkins N.A., Baker E., Sutherland G.R., Feldhaus A.L., Ramsdell F. The mouse CD69 gene. Structure, expression, and mapping to the NK gene complex. J. Immunol. 1994;152:1228–1236. [PubMed] [Google Scholar]
- Levelt C.N., Mombaerts P., Iglesias A., Tonegawa S., Eichmann K. Restoration of early thymocyte differentiation in T-cell receptor beta-chain-deficient mutant mice by transmembrane signaling through CD3 epsilon. Proc. Natl. Acad. Sci. USA. 1993;90:11401–11405. doi: 10.1073/pnas.90.23.11401. [DOI] [PMC free article] [PubMed] [Google Scholar]
- Stettner S.L., Rummel S.A., Conti C.J., Richie E.R. N-methyl-N-nitrosourea alters thymocyte subset distribution and targets immature CD4−8+ cells for lymphoma development. Cancer Res. 1991;51:737–740. [PubMed] [Google Scholar]
- Richie E.R., McEntire B.B., Coghlan L., Poenie M. Murine T-lymphomas corresponding to the immature CD4−8+ thymocyte subset. Dev. Immunol. 1991;1:255–263. doi: 10.1155/1991/98963. [DOI] [PMC free article] [PubMed] [Google Scholar]
- Levelt C.N., Wang B., Ehrfeld A., Terhorst C., Eichmann K. Regulation of T cell receptor (TCR)-beta locus allelic exclusion and initiation of TCR-alpha locus rearrangement in immature thymocytes by signaling through the CD3 complex. Eur. J. Immunol. 1995;25:1257–1261. doi: 10.1002/eji.1830250519. [DOI] [PubMed] [Google Scholar]
- Mao M., Fu G., Wu J.S., Zhang Q.H., Zhou J., Kan L.X., Huang Q.H., He K.L., Gu B.W., Han Z.G. Identification of genes expressed in human CD34(+) hematopoietic stem/progenitor cells by expressed sequence tags and efficient full-length cDNA cloning. Proc. Natl. Acad. Sci. USA. 1998;95:8175–8180. doi: 10.1073/pnas.95.14.8175. [DOI] [PMC free article] [PubMed] [Google Scholar]
- Rees D.G. Essential Statistics 2nd ed 1989. Chapman & Hall; London: pp. 116–129 [Google Scholar]