

Abstract
The understanding of human thymic function and evaluation of its contribution to T cell homeostasis are matters of great importance. Here we report the development of a novel assay to quantitate the frequency and diversity of recent thymic emigrants (RTEs) in the peripheral blood of humans. Such cells were defined by the presence of T cell receptor (TCR) rearrangement deletion circles (DCs), episomal byproducts of TCR-β V(D)J rearrangement. DCs were detected in T cells in the thymus, cord blood, and adult peripheral blood. In the peripheral blood of adults aged 22 to 76 years, their frequency was highest in the CD4+CD45RA+ CD62L+ subpopulation of naive T cells. TCR DCs were also observed in other subpopulations of peripheral blood T cells, including those with the CD4+CD45RO−CD62L+ and CD4+CD45RO+CD62L+ phenotypes. RTEs were observed to have more than one Vβ rearrangement, suggesting that replenishment of the repertoire in the adult is at least oligoclonal. These results demonstrate that the normal adult thymus continues to contribute, even in older individuals, a diverse set of new T cells to the peripheral circulation.
Keywords: thymus, T cell receptor, deletion circles, naive T cells, immune reconstitution
It has been assumed that a diverse TCR repertoire is formed during early life, when the thymus is most active, and that T cell homeostasis is maintained without significant thymic input in adults 1 2. Given the profound effects of stress on thymopoiesis, intrathymic T cell production in the intact animal is best studied with a minimally invasive assay for recent thymic emigrants (RTEs)1 in the peripheral blood. In the chicken, for example, RTEs can be identified by their unique expression of the cell surface marker chT1 3. Murine RTEs may be followed kinetically in the peripheral circulation after direct intrathymic labeling, e.g., with FITC 4. Assays of this type are, however, unavailable for the assessment of human thymic function. Such assessment has relied instead upon autopsy series 5, radiographic observations 6, and/or phenotypic demarcation of circulating human T cells into distinct populations of “naive” or “memory/effector” cells. In aggregate, these studies 7 demonstrate that: (a) there is a correlation between the abundance of circulating CD4+CD45RA+ CD62L+ human T cells and the presence of thymic tissue 7 8 9, suggesting that RTEs are included within this T cell subpopulation; (b) the circulating CD8+CD45RA+ T cell subpopulation is less clearly associated with human thymic tissue 8; and (c) circulating memory/effector CD4+ and CD8+ T cell subpopulations bear the phenotypic marker CD45RO instead of CD45RA 10.
Phenotypic measures are imprecise, however, in their ability to distinguish lymphocytes that have recently been made in the thymus or peripheral tissues and those that have reverted from memory status 11 12. Thus, although it is clear that the human thymus involutes dramatically after puberty 5, the fraction of circulating CD45RA+ T cells remains relatively constant for long periods of time thereafter 13. These findings suggest that the CD45RA+ CD62L+ T cell subpopulation may contain a higher proportion of RTEs earlier rather than later in life and that it harbors heterogeneous cell populations (including revertants of memory/effector cells) throughout life.
Recently, Douek et al. 14 have exploited an intrinsic feature of the TCR rearrangement process to directly demonstrate the presence of continuous thymic output in human adults. This assay relies on the detection of TCR-α excision circles (αTRECs) generated during TCR-α gene rearrangement in the thymus. Similar observations have also been made in the avian system, whereby de novo TCR rearrangement, as measured by excision circle assays, correlated with the expression of chT1 antigen 15. Moreover, circle-bearing T cells were found in the avian lymph node, spleen, and skin 16, suggesting that the thymus may constantly supply new T cells to these peripheral compartments.
In this report, we describe an assay for the detection of RTEs within various subpopulations of circulating human T cells. We observe that such cells are most abundant in the CD45RA+CD62L+ subpopulation, that they are at least oligoclonal in their expression of TCR Vβ regions, and that they are detectable in adults.
Materials and Methods
Isolation of Thymocytes.
Methods for maintenance of SCID-hu mice and harvest of thymocytes from SCID-hu Thy/Liv organs were identical to those previously published 17. In some cases, SCID-hu Thy/Liv organs were harvested and placed in RPMI 1640 media (Life Technologies) supplemented with 10% FCS (Summit Biotechnology) and transported overnight at 4°C before harvest of thymocytes. After isolation, thymocytes were resuspended in PBS supplemented with 2% FCS and kept on ice before staining with mAbs for flow cytometric analysis or cell sorting. All procedures and practices were approved by the University of California, San Francisco Committee on Human Research (CHR) or Committee on Animal Research.
Isolation of PBMCs.
Whole blood samples from human subjects were collected by phlebotomy into EDTA collection tubes (Becton Dickinson). PBMCs were isolated from whole blood by density–gradient centrifugation (Life Technologies). PBMCs were washed twice with PBS before resuspension in PBS supplemented with 2% FCS before staining with mAbs for flow cytometry or cell sorting.
Stimulation of Cord Blood Cells In Vitro.
Human umbilical cord blood cells were obtained (with CHR approval) from healthy delivery specimens and placed in heparinized collection tubes (Becton Dickinson) under sterile conditions. Cord blood mononuclear cells (CBMCs) were isolated as described above for whole blood specimens and resuspended at a concentration of 2 × 10⁶ cells/ml in RPMI 1640 supplemented with 10% human AB serum (Ultraserum; Gemini Bio-Products). CBMCs were then cultured (at 37°C in 5% CO2) for 48, 72, or 96 h or 9 d (time points encompassed in two different experiments) and stimulated with 5 μg/ml of PHA (Sigma Chemical Co.) and 10 U/ml purified IL-2 (Boehringer Mannheim). The supplemented medium was changed every 3 d. Cell culture controls did not receive PHA or IL-2 stimulation but were cultured for 72 h in the same medium. Aliquots of the cell cultures at different time points were analyzed by flow cytometry for the expression of the cell surface markers CD45RA and CD62L.
Immunophenotypic Analysis and Cell Sorting by Flow Cytometry.
PBMCs, thymocytes from SCID-hu mice, or CBMCs were stained with fluorescent-conjugated mABs specific for cell surface markers at a concentration of 107 cells/ml at 4°C for 30 min. After staining, cells were washed with PBS supplemented with 2% FCS and sorted on either a FACStar™ or FACS Vantage™ cell sorter (both from Becton Dickinson). The cells were stained with one of the following antibody combinations: (a) anti-CD8–FITC and anti-CD4–PE (Becton Dickinson); (b) anti-CD45RA–FITC or anti-CD45RO–FITC (Immunotech), anti-CD62L–PE (Becton Dickinson), and anti-CD4–ECD (Coulter Immunology); (c) anti-CD62L–FITC, anti-CD45RA–PE (PharMingen), and anti-CD4–tricolor or anti-CD4–allophycocyanin (Caltag Labs., Inc.). Sort purities were checked after each sort and were ≥97%. For analysis of cord blood CD45RA and CD62L expression, CBMCs were stained with anti-CD45RA–FITC (Immunotech) and anti-62L–PE (Becton Dickinson) and analyzed using a FACScan™ cytometer and CELLQuest™ software (both from Becton Dickinson).
Detection of TCR-β Rearrangement Deletion Circles.
Total DNA from distinct cell populations was extracted and purified via a standard protocol 18 before spectrophotometric quantitation at 260 and 280 nm. The freshly isolated DNA was stored at 4°C for further processing. Thermal cycling was performed for 30 cycles (1 min at 94°C, 1.5 min at 65°C, and 1.5 min at 72°C) for each round of a seminested PCR protocol designed to detect VβDβ-specific deletion circles (DCs) generated by TCR-β recombination. All first and second round primers were generated to fully hybridize with noncoding regions of the TCR-β locus 19 located next to the recombination signal sequences (RSS; available from EMBL/GenBank/DDBJ under accession numbers U66059, U66060, and U66061; see Table ). Four PCR replicates were performed on each total DNA serial dilution to ensure a precise readout for each experiment. Concentrations of total DNA were adjusted so that a constant volume of 3 μl was added to each 50-μl PCR reaction (200 μM dNTPs, 1× PCR buffer [Boehringer Mannheim], 100 ng of each primer, and 2 U of Taq polymerase [Boehringer Mannheim]). From the first PCR amplification, 3 μl of the first PCR product was used as template for the second (seminested) PCR reaction (under the same conditions) using the “Circle” primer and the DC-Dβ1 primer.
Table 1.
Primary Sequence of Primers Required for βDC Detection/Amplification
| Primer name | Nucleotide sequence |
|---|---|
| DC-Vβ2 | 5′-gcacacacactcccagatgtctcagtcaggaaagc-3′ |
| DC-Vβ5.1 | 5′-ttttccccagccctgagttgcagaaagcccc-3′ |
| DC-Vβ17 | 5′-cgtttcctgccatcatagagtgcagaggagccctgt-3′ |
| DC-Dβ1 | 5′-gtcatagcttaaaaccctccgagtgacgcacagcc-3′ |
| Circle-Vβ2 | 5′-ggagggcagctgcaggggttcttgc-3′ |
| Circle-Vβ5.1 | 5′-ccacattgggccagggaggtttgtgc-3′ |
| Circle-Vβ17 | 5′-gtcggggaagcaggactgggcacatttatgc-3′ |
Quantitative Analysis of Endpoint Dilutions.
Second round PCR products were visualized with ethidium bromide on 1.25% agarose gels and digitally photographed. Individual amplifications were scored as positive or negative by two observers. The highest dilution returning a positive amplification was taken as the endpoint for each dilution series. Dilution series with more than two “skipped” wells (i.e, a failed amplification followed by a successful amplification at higher dilution) were omitted from the analysis. The abundance of DCs was estimated by the Reed-Muench method 20 21. This method uses information from replicate dilution series to estimate an endpoint (measured in terms of nanograms of input DNA) in which 50% of samples were positive for DCs (the 50% DC endpoint). The DC frequency (DCF) was arbitrarily defined as the reciprocal of the 50% DC endpoint × 100. Alternatively, the seminested PCR data were analyzed by a maximum likelihood estimated method of dilution endpoint with a parametric method 22. Unlike the Reed-Muench method, this method returns an estimate of goodness of fit of the data to the estimated endpoint. Endpoints estimated by the two methods were highly correlated (r 2 = 0.929), and the choice of method did not alter the conclusions drawn from the data. The degree of inter- and intraassay variation was assessed by performing two independent experiments on two different samples from the same individuals (n = 3) and ranged on the order of two- to threefold (data not shown).
Results and Discussion
A Novel Assay to Identify RTEs.
To determine whether the CD4+CD45RA+CD62L+ subpopulation of circulating human T cells contains RTEs, we devised an assay to detect physical evidence of recent TCR gene rearrangement. We chose to focus on rearrangements at the β locus because the complete sequence of this locus has been obtained 19, permitting the construction of a panel of Vβ-specific primers to assess the diversity of rearranged TCRs. Moreover, allelic exclusion is more complete at the TCR β locus than at the TCR-α locus 23 24. Rearrangements at this locus are a salient feature of intrathymic T cell production and require expression of the recombination activating genes ([RAG]-1 and RAG-2) and recognition of conserved heptamer and nonamer RSS flanking each V, D, and J gene segment (25 26 27 28 29; Fig. 1 A). As the coding segments are brought together, excision–ligation of the heptamer–heptamer signal joint creates an episomal TCR rearrangement DC 25 30 bearing two identifiers: first, each Vβ-Dβ DC has a precise molecular mass determined by the length of intervening, noncoding DNA; second, a unique DNA sequence bridges the signal joint. Using the known nucleotide sequences of the noncoding DNA regions adjacent to Vβ2, Vβ17, Vβ5.1, and Dβ1 19, primers were designed such that a PCR product would only be amplified if the primers were facing each other within a closed DC (Table ). As shown in Fig. 1 B, the product amplified for a Vβ2/Dβ1 rearrangement would have a predicted size of 439 bp, with characteristic restriction enzyme sites. In the case of DCs specific for Vβ17/Dβ1 and Vβ5.1/Dβ1 rearrangements, the corresponding molecular masses would be 445 and 442 bp, respectively.
Figure 1.


Formation and detection of TCR-β rearrangement DCs. (A) Top: genomic organization of the region including the Vβ2 and Dβ1 coding segments, flanked by heptamer and nonamer RSS and 170 kbp of intervening noncoding DNA. Bottom: generation of a rearranged Vβ2/Dβ1 coding TCR and a 170-kbp Vβ2/Dβ1 DC after excision–ligation mediated by RAG-1 and RAG-2. The relative location and orientation of the primers used for amplification of the unique signal joint are shown. Note that DCs will have various sizes (from 65 to 588 kbp) depending on the Vβ-Dβ usage. (B) Top: map of the amplified 439-bp Vβ2/Dβ1 PCR product. Bottom: representative example of Vβ2/Dβ1 DC products amplified from CD4+CD8+ human thymocytes or from Jurkat cells. The left gel shows the specificity of the amplification; note the absence of products in both the Jurkat and “no DNA” lanes. The PCR product is partially cleavable by ApaLI, likely due to heterogeneity of nucleotide sequence at the circle junction. An ApaLI digestion-positive control was performed at the same time on an empty pBS vector, resulting in complete digestion. The right gel shows restriction analysis of the purified 439-bp Vβ2/Dβ1 DC product, with characteristic cuts by SacI, PvuII, and ApaLI. White arrow, 55-bp fragment released by ApaLI digestion.
The specificity and reliability of this strategy was first assessed in developing human thymocytes, expected to have a high frequency of DCs 31. DNA was extracted from two different samples of human CD4+CD8+ thymocytes (harvested from Thy/Liv organs of SCID-hu mice) 17. After amplification using the primers specific for Vβ2/Dβ1 DCs, all were found to generate the expected 439-bp PCR product. As shown in a representative case (Fig. 1 B), this product carried predicted restriction enzyme recognition sites for Sac1, PvuII, and ApaL1 and was not observed with PCR performed on DNA from Jurkat cells (a Vβ8.1 T cell line that should not carry Vβ2/Dβ1 DCs). Nucleotide sequence analysis of the PCR product confirmed its identity to the predicted sequence spanning the signal joint of the Vβ2/Dβ1 DC (not shown).
Quantitative Assessment of Cells Having Recently Undergone β Chain TCR Rearrangement.
Within a population of cells, the fraction bearing DCs should be proportional to that which has recently undergone TCR rearrangement. To directly compare this fraction among different cell populations, a semiquantitative assay was developed to measure a dilution endpoint of DC DNA within a given amount of total cell DNA. DNA was diluted in four replicate series, and PCR was carried out to determine whether a given well was positive or negative for the DC PCR product. The 50% DC endpoint, measured in terms of nanograms of input DNA, was calculated using either the Reed-Muench method 20 21 or a maximum likelihood estimate 22 (see Materials and Methods). The 50% DC endpoint represents the median minimal amount of DNA from which a DC may be amplified by nested PCR; the DCF was arbitrarily defined as the reciprocal of the 50% DC endpoint × 100 and is proportional to the number of DCs that can be amplified from 100 ng of input DNA. A representative experiment using the assay to quantitate DCs is shown in Fig. 2 A. Four replicate dilution series of DNA from CD3+ CD8+ single positive (SP) thymocytes were amplified with primers specific for Vβ2/Dβ1 DCs, and these yielded a positive PCR signal for DCs at final (highest) dilutions of 16, 16, 16, and 3.2 ng input DNA. This corresponds to a 50% DC endpoint of 5.47 ng (as determined by the Reed-Muench method) and a DCF of 18.3 (100/5.47). Assuming typical recovery of DNA and amplification sensitivity, this would return a minimum estimate of 1 DC in 547 SP8 thymocytes, or, as 2–5% of the total express a Vβ2/Dβ1 TCR, 11–22 Vβ2/Dβ1 SP8 thymocytes. Similar frequencies of DCs were noted in sorted populations of CD3+CD4+ and CD4+CD8+ thymocytes, yielding DCFs of 8.4 and 11.7, respectively (Fig. 2 B).
Figure 2.


Quantitation of TCR rearrangement DCs. (A) Representative example of endpoint dilution analysis of DCs within CD3+CD8+ human thymocytes. Starting at 2,000 ng of input DNA per well, quadruplicate fivefold serial dilutions were subjected to the nested PCR approach shown in Fig. 1. DNA from Jurkat cells (150 ng) and from total thymocytes (150 ng) served as negative and positive controls, respectively. (B) Relative frequencies of Vβ2/Dβ1 DCs in sort-purified populations of CD4+CD8+, CD3+CD4+CD8−, and CD3+CD4−CD8+ human thymocytes.
TCR Vβ DCs in Circulating Peripheral Blood T Cells.
As prior studies indicated that DCs were detectable within chT1+ RTEs in chickens 3 and in human children and adults 14 32, the Vβ DC assay was used to determine whether Vβ DCs were present in various populations of human peripheral blood T cells. Reasoning that the frequency of RTEs in the peripheral blood would be highest early in life, T cells in cord blood were examined first. Flow cytometric analysis revealed that >95% of CD4+ T cells in unstimulated cord blood carried the “naive” CD45RA+ CD62L+ phenotype (Fig. 3 A, panel 1), and all of these cells were “bright” for CD45RA staining. The frequency of DCs within unstimulated cord blood was higher than that observed for SP thymocytes (with DCFs approximating 43.1 and 41.8 in the two cord blood specimens compared with values of 18.3 and 8.4 for SP8 and SP4 thymocytes, respectively) (Fig. 3 B). After 9 d of stimulation in vitro with PHA and IL-2, the percentage of CD4+ cord blood T cells with the naive (CD45RAbrightCD62L+) phenotype dropped to negligible levels, and most cells were instead negative for CD62L and/or dimly positive for CD45RA (Fig. 3 A, panels 2–4). Within this same time frame, the frequency of DCs dropped from an average of 42.5 to 0.85 DCF, a 50-fold decrease over a 9-d period (Fig. 3 B). These results indicated that DCs could be detected in circulating T cells and that their detection was correlated with the presence of cells bearing the naive CD45RA+CD62L+ phenotype.
Figure 3.
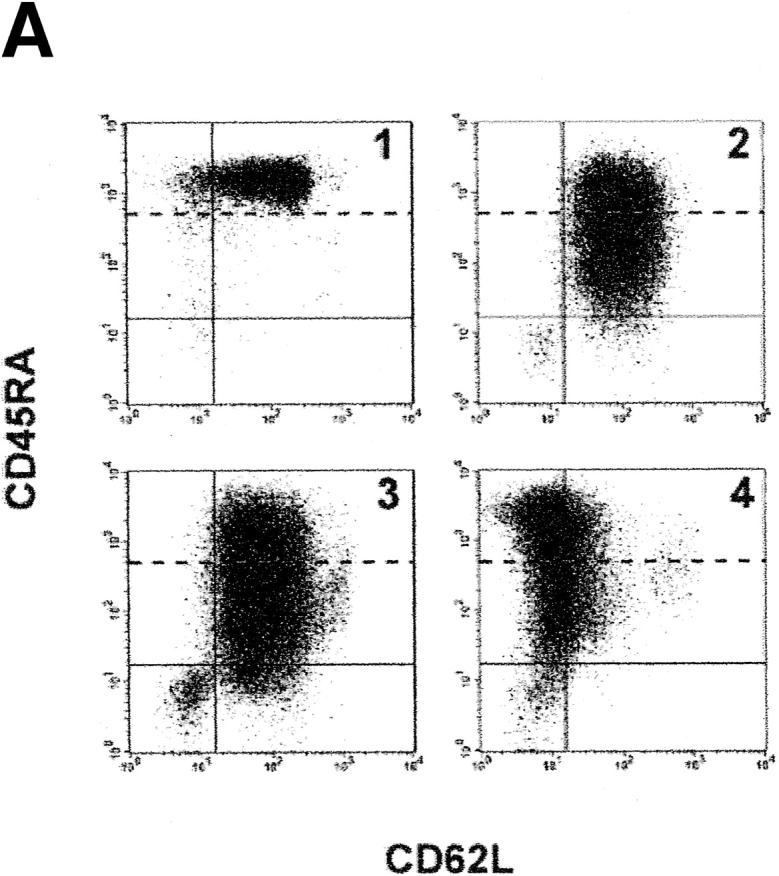


Detection of TCR rearrangement DCs in human peripheral blood T cells. (A) Representative flow cytograms of CD4+ human cord blood T cells that were unstimulated (panel 1) or stimulated for varying time intervals (panel 2, 72 h; panel 3, 96 h; panel 4, 9 d) with IL-2 (10 U/ml) and PHA (5 μg/ml). CD4+ T cells at each time point were gated and subdivided by staining for CD45RA and CD62L. Based on the staining of cells for CD45RA before stimulation (panel 1), cells were designated as CD45RAbright or CD45RAdim (with fluorescence intensities above and below the dotted lines, respectively). (B) Relative frequency of Vβ2/Dβ1 DCs in cord blood T cells that were unstimulated (control) or stimulated for varying time intervals with PHA and IL-2. Black bars, results from one experiment with endpoints at 48 and 72 h; white bars, results from a second experiment (different cord blood donor) with endpoints at 72 h and 9 d. (C) Correlation between increasing age and decreasing frequency of Vβ2/Dβ1 DCs in the circulating CD4+CD45RA+CD62L+ T cell subpopulation (P = 0.0045). Sort-purified CD4+CD45RA+CD62L+ human peripheral blood T cells were isolated from individuals of the indicated ages and analyzed for Vβ2/Dβ1 DCs. Such DCs were absent from the CD4+CD45RO+CD62L− subpopulations of each individual (not shown). The point at 55 yr old was scored as “undetectable” in the assay (i.e., with a DCF value ≤0.1). (D) Percentages of circulating naive (CD45RA+CD62L+) CD4+ T cells in the peripheral blood as a function of age. No correlation exists between age and the frequency of such naive CD4+ T cells (P = 0.5123).
Inverse Correlation between Frequencies of DCs and Age.
DCs were then quantitated in the peripheral blood of 17 adult individuals, ranging in age from 22 to 76 yr. In each, naive CD4+CD45RA+CD62L+ and memory/effector CD4+ CD45RO+CD62L− cells were quantitated by flow cytometry and sort-purified for determination of DC frequency. Results are shown in Fig. 3 C. Within the population of circulating CD4+CD45RA+CD62L+ T cells, DCs were observed with a frequency that was higher than that found in the CD4+CD45RO+CD62L− population (which had nondetectable levels of DCs in these 17 individuals; data not shown). As a function of age, there was a consistent decrease in the frequency of DCs within the CD4+CD45RA+ CD62L+ subpopulation (Fig. 3 C; r 2 = 0.5026, P = 0.0045), even though individuals across this age range had equivalent percentages of CD45RA+CD62L+ within their CD4+ T cells (Fig. 3 D; r 2 = 0.0233, P = 0.5123). These data suggest that RTEs exist within the circulating population of CD4+CD45RA+CD62L+ T cells of adults, that their proportion decreases with age, and that the DC assay appears to provide a much more reliable estimate of de novo–generated T cells than that provided by phenotypic cell surface markers such as CD45RA and CD62L.
Detection of DCs in Other T Cell Populations.
To determine whether other subpopulations of circulating CD4+ T cells might harbor TCR-β rearrangement DCs, cells were sort-purified into subpopulations that were CD4+CD45RA+ CD62L+, CD4+CD45RO+CD62L−, CD4+CD45RO+ CD62L+, and CD4+CD45RO−CD62L+. In eight individuals ranging in age from 22 to 76 yr, the highest frequency of DCs was found in the CD45RA+CD62L+ subpopulations and the lowest in the CD45RO+CD62L− subpopulation (Table ). DCs were also found in the CD45RO+CD62L+ subpopulation in four out of eight individuals tested, albeit at a lower frequency. Finally, DCs were detected in T cells with the phenotype CD45RO− CD62L+ (data not shown) and CD45RO+CD62L−, although only one out of nine individuals showed detectable levels of DCs in the latter compartment. These cells may possibly represent direct progeny of RTEs in the CD45RA+CD62L+ subpopulation; alternatively, DCs may be present within them as a consequence of extrathymic TCR rearrangements 1 33.
Table 2.
The TCR Repertoire of RTEs Is at Least Oligoclonal
| Age | 22 | 23 | 25 | 28 | 31 | 32 | 39 | 76a | 76b |
|---|---|---|---|---|---|---|---|---|---|
| Frequency (%) | |||||||||
| CD4+CD45RA+CD62L+ | 32 | 30 | 25 | 36 | 52 | 59 | 35 | 44 | 62 |
| CD4+CD45RO+CD62L+ | 18 | 25 | 28 | 42 | 38 | 25 | 18 | 43 | 33 |
| CD4+CD45RO+CD62L− | 39 | 19 | 32 | 13 | 9 | 10 | 23 | 6 | 4 |
| TCR Vβ2 (%) | ND | ND | 8 | ND | 6 | ND | ND | 9 | 9 |
| DCF (Vβ2/Dβ1 DC) | |||||||||
| CD4+CD45RA+CD62L+ | 1.67 | 10.12 | 1.46 | 3.63 | 0.50 | 1.37 | 0.17 | 0.50 | 0.33 |
| CD4+CD45RO+CD62L+ | 0.50 | ND | 0.73 | ND | 0.75 | <0.1 | ND | <0.1 | 0.1 |
| CD4+CD45RO+CD62L− | 0.22 | <0.07 | <0.1 | <0.1 | <0.1 | <0.1 | <0.1 | <0.1 | ND |
| DCF (Vβ5.1/Dβ1 DC) | |||||||||
| CD4+CD45RA+CD62L+ | ND | ND | ND | ND | 0.29 | 7.97 | ND | ND | 0.71 |
| DCF (Vβ17/Dβ1 DC) | |||||||||
| CD4+CD45RA+CD62L+ | ND | 1.72 | ND | 0.85 | 1.12 | ND | 0.37 | ND | ND |
Summary of DCF values for multiple TCR Vβ-Dβ rearrangements in FACS™-sorted subpopulations of CD4+ T cell subpopulations.
The TCR Repertoire in RTEs Is at Least Oligoclonal.
Previous studies have demonstrated the presence but not the degree of TCR diversity of RTEs in adult humans 14 32. To address this parameter of diversity, we generated primers that could amplify DCs issued from three different TCR Vβ-Dβ rearrangements (Vβ2/Dβ1, Vβ5.1/Dβ1, and Vβ17/Dβ1). Flow cytometric analyses (not shown) revealed different percentages of circulating T cells bearing these three Vβs (Vβ2: 8–10%; Vβ5.1: 3–4%; and Vβ17: 3–4%). Results illustrated in Table clearly show that DCs detectable in circulating human T cells encompass several (at least two) Vβs and were present not only in the CD45RA+CD62L+ but also in the CD45RO+CD62L+ subpopulations of CD4+ T cells. Interestingly, the relative frequency of DCs from different Vβ regions, as measured by flow cytometry, did not correlate with the proportion of PBLs expressing these TCR Vβ products. For instance, Vβ2+ T cells were always at least twofold more abundant in PBLs from normal individuals compared with Vβ5.1+ or Vβ17+ T cells (data not shown). Yet analysis of DCF values (shown in Table ) indicated that, in the two individuals tested (aged 31 and 32 yr), Vβ5.1/Dβ1 or Vβ17/Dβ1 DCs were two- to fivefold more abundant than Vβ2/Dβ1 DCs. These differences in the relative abundance of Vβ DCs compared with the expected frequencies of their parental cell populations could reflect a relative dilutional effect on some Vβ DCs due to varying degrees of peripheral expansion in Vβ-specific subsets, as well as a relative overestimate of some subpopulations due to the detection of DCs from nonproductive rearrangements that might be more prevalent in certain Vβ subsets.
In sum, these experiments demonstrate that TCR-β DCs can be detected within thymocytes and circulating human CD4+ T cells with a naive (CD45RA+CD62L+) phenotype. Detection of such circles is specific, reliable, and quantitative; our method also indicates that they are generated upon rearrangement of multiple Vβ coding segments. Finally, DCs in CD4+CD45RA+CD62L+ T cells are observed in a pattern that is consistent with known parameters of intrathymic maturation: their frequency decreases as cord blood T cells are stimulated to divide in vitro and in older individuals who have less active thymi, as measured in autopsy series or by noninvasive radiography. As such, quantitation of DCs within human peripheral blood CD4+CD45RA+CD62L+ T cells appears to represent a measure of RTEs and, hence, thymic function.
These results serve to directly confirm previous inferences about thymic function. First, the finding of DCs within the CD4+CD45RA+CD62L+ population of adult individuals aged 23–76 yr underscores the premise that the thymus, though less functional, is nonetheless operative into adulthood 2 5 9 14 32. Secondly, the fact that the frequency of DCs decreases in the CD4+CD45RA+ CD62L+ population as a function of age demonstrates that this population is heterogeneous 11 12 and that its composition is age dependent. It may not be useful, in other words, to assume that the presence (or reappearance) of such cells is synonymous with “immune reconstitution” 34 35 36 37. Finally, the finding of DCs within other populations of circulating T cells raises the possibility that extrathymic sources (e.g., gut or liver) may contribute to formation of the circulating TCR repertoire 1 33.
Although further work is required to optimize the quantitative precision of the DC assay and enhance its applicability for comprehensive studies of human thymic function, it is now applicable to important contemporary questions about thymic function and immune reconstitution in humans. Most immediately, it will be of interest to determine the extent of thymic dysfunction at different stages of HIV infection and after bone marrow reconstitution postmyeloablation. It will also be interesting to determine the extent of de novo rearrangement in lymph nodes, which might be induced by chronic viral replication, as recently suggested in a murine model of persistent antigen exposure 38. This measure of thymic function may also facilitate the design of studies aimed at augmenting intrathymic T cell production.
Acknowledgments
This work was carried out as a partial fulfillment of J.F. Poulin's PhD thesis at McGill University. The authors would like to thank Drs. Paul MacPherson, François Denis, and François Erard for critical reading of the manuscript and helpful discussions, Mrs. Nathalie Tessier and Ms. Lisa Gibson for expertise in flow cytometry, and Jason Barbour (University of California at San Francisco) and Dr. Don Brambilla (New England Research Institute) for advice and assistance with statistical analysis.
This work was supported by grants to R.P. Sékaly from the National Institutes of Health (NIH; RO1 AI235), the Medical Research Council (MRC; MT-14411), and the Réseau FRSQ-SIDA/MI (96007) and to J.M. McCune from the NIH (R01-AI40312 and R01-AI43864) and the Elizabeth Glaser Pediatric AIDS Foundation. J.F. Poulin holds an MRC student award, and R.P. Sékaly is an MRC scientist. Morgan Jenkins is the recipient of a KO8 (AI 01425) from the NIH, M.N. Viswanathan is a Howard Hughes Medical Institute Medical Student Research Fellow, K.V. Komanduri is a University of California Universitywide AIDS Research Program Postdoctoral Fellow, and J.M. McCune is an Elizabeth Glaser Scientist.
Footnotes
1used in this paper: CBMCs, cord blood mononuclear cells; DCs, deletion circles; DCF, deletion circle frequency; RAG, recombination activating gene; RSS, recombination signal sequences; RTEs, recent thymic emigrants; SP, single positive
References
- Mackall C.L., Hakim F.T., Gress R.E. T-cell regenerationall repertoires are not created equal. Immunol. Today. 1997;18:245–251. doi: 10.1016/s0167-5699(97)81664-7. [DOI] [PubMed] [Google Scholar]
- McCune J.M. Thymic function in HIV-1 disease. Semin. Immunol. 1997;9:397–404. doi: 10.1006/smim.1997.0098. [DOI] [PubMed] [Google Scholar]
- Kong F., Chen C.H., Cooper M.D. Thymic function can be accurately monitored by the level of recent T cell emigrants in the circulation. Immunity. 1998;8:97–104. doi: 10.1016/s1074-7613(00)80462-8. [DOI] [PubMed] [Google Scholar]
- Scollay R.G., Butcher E.C., Weissman I.L. Thymus cell migration. Quantitative aspects of cellular traffic from the thymus to the periphery in mice. Eur. J. Immunol. 1980;10:210–218. doi: 10.1002/eji.1830100310. [DOI] [PubMed] [Google Scholar]
- Steinmann G.G. Changes in the human thymus during aging. In: Muller-Hermelink H.K., editor. The Human Thymus—Histopathology and Pathology. Springer-Verlag New York, Inc.; New York, New York: 1986. pp. 43–48. [Google Scholar]
- Francis I.R., Glazer G.M., Bookstein F.L., Gross B.H. The thymusreexamination of age-related changes in size and shape. Am. J. Radiol. 1985;145:249–254. doi: 10.2214/ajr.145.2.249. [DOI] [PubMed] [Google Scholar]
- Picker L.J., Treer J.F., Ferguson D.B., Collins P.A., Buck D., Terstappen L.W. Control of lymphocyte recirculation in man. I. Differential regulation of the peripheral lymph node homing receptor l-selectin on T cells during the virgin to memory cell transition. J. Immunol. 1993;150:1105–1121. [PubMed] [Google Scholar]
- Heitger A., Neu N., Kern H., Panzer-Grumayer E.R., Greinix H., Nachbaur D., Niederwieser D., Fink F.M. Essential role of the thymus to reconstitute naive (CD45RA+) T-helper cells after human allogeneic bone marrow transplantation. Blood. 1997;90:850–857. [PubMed] [Google Scholar]
- McCune J.M., Loftus R., Schmidt D.K., Carroll P., Webster D., Swor-Yim L.B., Francis I.R., Gross B.H., Grant R.M. High prevalence of thymic tissue in adults with human immunodeficiency virus-1 infection. J. Clin. Invest. 1998;101:2301–2308. doi: 10.1172/JCI2834. [DOI] [PMC free article] [PubMed] [Google Scholar]
- Sanders M.E., Makgoba M.W., Shaw S. Human naive and memory T cells. Immunol. Today. 1988;9:195–199. doi: 10.1016/0167-5699(88)91212-1. [DOI] [PubMed] [Google Scholar]
- Tough D.F., Sprent J. Life span of naive and memory T cells. Stem Cells. 1995;13:242–249. doi: 10.1002/stem.5530130305. [DOI] [PubMed] [Google Scholar]
- Bell E.B., Sparshott S.M. Interconversion of CD45R subsets of CD4 T cells in vivo. Nature. 1990;348:163–166. doi: 10.1038/348163a0. [DOI] [PubMed] [Google Scholar]
- Erkeller-Yuksel F.M., Deneys V., Yuksel B., Hannet I., Hulstaert F., Hamilton C., Mackinnon H., Stokes L.T., Munhyeshuli V., Vanlangendonck F.I. Age-related changes in human blood lymphocyte subpopulations. J. Pediatr. 1992;120:216–222. doi: 10.1016/s0022-3476(05)80430-5. [DOI] [PubMed] [Google Scholar]
- Douek D.C., McFarland R.D., Keiser P.H., Gage E.A., Massey J.M., Haynes B.F., Polis M.A., Haase A.T., Feinberg M.B., Sullivan J.L. Changes in thymic function with age and during the treatment of HIV infection. Nature. 1998;396:690–695. doi: 10.1038/25374. [DOI] [PubMed] [Google Scholar]
- Kong F., Chen C.H., Cooper M.D. Thymic function can be accurately monitored by the level of recent T cell emigrants in the circulation. Immunity. 1998;1:97–104. doi: 10.1016/s1074-7613(00)80462-8. [DOI] [PubMed] [Google Scholar]
- Kong F.K., Chen C.L., Six A., Hockett R.D., Cooper M.D. T cell receptor gene deletion circles identify recent thymic emigrants in the peripheral T cell pool. Proc. Natl. Acad. Sci. USA. 1999;96:1536–1540. doi: 10.1073/pnas.96.4.1536. [DOI] [PMC free article] [PubMed] [Google Scholar]
- Rabin L., Hincenbergs M., Moreno M.B., Warren S., Linquist V., Datema R., Charpiot B., Seifert J., Kaneshima H., McCune J.M. Use of standardized SCID-hu Thy/Liv mouse model for preclinical efficacy testing of anti-human immunodeficiency virus type 1 compounds. Antimicrob. Agents Chemother. 1996;40:755–762. doi: 10.1128/aac.40.3.755. [DOI] [PMC free article] [PubMed] [Google Scholar]
- Strauss W.M. Preparation of genomic DNA from mammalian tissue Ausubel F.M., Brent R., Kingston R.E., Moore D.D., Smith J.A., Seidman J.G., Struhl K. Current Protocols in Molecular Biology 1987. Wiley Interscience; New York, New York: 2.2.1–2.2.3 [Google Scholar]
- Rowen L., Koop B.F., Hood L. The complete 685-kilobase DNA sequence of the human β T cell receptor locus. Science. 1996;272:1755–1762. doi: 10.1126/science.272.5269.1755. [DOI] [PubMed] [Google Scholar]
- Reed L.J., Muench H. A simple method of estimating fifty per cent endpoints. Am. J. Hyg. 1938;27:493–497. [Google Scholar]
- Lenette E.H. General principles underlying laboratory diagnosis of virus and rickettsial infections. In: Lennette E.H., Schmidt N.J., editors. Diagnostic Procedures of Virus and Rickettsial Disease. American Public Health Association; New York, New York: 1964. p. 45. [Google Scholar]
- Myers L.M., McQuay L.J., Hollinger F.B. Dilution assay statistics. J. Clin. Microbiol. 1994;32:732–739. doi: 10.1128/jcm.32.3.732-739.1994. [DOI] [PMC free article] [PubMed] [Google Scholar]
- Petrie H.T., Livak F., Schatz D.G., Strasser A., Crispe I.N., Shortman K. Multiple rearrangements in T cell receptor α chain genes maximize the production of useful thymocytes. J. Exp. Med. 1993;178:615–622. doi: 10.1084/jem.178.2.615. [DOI] [PMC free article] [PubMed] [Google Scholar]
- Mason D. Allelic exclusion of alpha chains in TCRs. Int. Immunol. 1994;6:881–885. doi: 10.1093/intimm/6.6.881. [DOI] [PubMed] [Google Scholar]
- Okazaki K., Davis D.D., Sakano H. T cell receptor β gene sequences in the circular DNA of thymocyte nucleidirect evidence for intramolecular DNA deletion in V-D-J joining. Cell. 1987;49:477–485. doi: 10.1016/0092-8674(87)90450-8. [DOI] [PubMed] [Google Scholar]
- Chien Y., Gascoigne N.R.J., Kavaler J., Lee N.E., Davis M.M. Somatic recombination in a murine T-cell receptor gene. Nature. 1984;309:322–326. doi: 10.1038/309322a0. [DOI] [PubMed] [Google Scholar]
- Malissen M., Minard K., Mjolsness S., Kronenberg M., Goverman J., Hunkapiller T., Prystowsky M.B., Yoshikai Y., Fitch F., Mak T.W. Mouse T cell antigen receptorstructure and organization of constant and joining gene segments encoding the β polypeptide. Cell. 1984;37:1101–1110. doi: 10.1016/0092-8674(84)90444-6. [DOI] [PubMed] [Google Scholar]
- Lewis S.M. The mechanism of V(D)J joininglessons from molecular, immunological, and comparative analyses. Adv. Immunol. 1994;56:27–150. doi: 10.1016/s0065-2776(08)60450-2. [DOI] [PubMed] [Google Scholar]
- Schatz D.G., Oettinger M.A., Baltimore D. The V(D)J recombination activating gene, RAG-1. Cell. 1989;59:1035–1048. doi: 10.1016/0092-8674(89)90760-5. [DOI] [PubMed] [Google Scholar]
- Roth D.B., Menetski J.P., Nakajima P.B., Bosma M.J., Gellert M. V(D)J recombinationbroken DNA molecules with covalently sealed (hairpin) coding ends in SCID mouse thymocytes. Cell. 1992;70:983–991. doi: 10.1016/0092-8674(92)90248-b. [DOI] [PubMed] [Google Scholar]
- Shortman K. Cellular aspects of early T cell development. Curr. Opin. Immunol. 1992;4:140–146. doi: 10.1016/0952-7915(92)90003-w. [DOI] [PubMed] [Google Scholar]
- Jamieson B.D., Douek D.C., Killian S., Hultin L.E., Scripture-Adams D.D., Giorgi J.V., Marelli D., Koup R.A., Zack J.A. Generation of functional thymocytes in the human adult. Immunity. 1999;10:569–575. doi: 10.1016/s1074-7613(00)80056-4. [DOI] [PubMed] [Google Scholar]
- Garcia-Ojeda M.E., Dejbakhsh-Jones S., Weissman I.L., Strober S. An alternate pathway for T cell development supported by the bone marrow microenvironmentrecapitulation of thymic maturation. J. Exp. Med. 1998;187:1813–1823. doi: 10.1084/jem.187.11.1813. [DOI] [PMC free article] [PubMed] [Google Scholar]
- Autran B., Carcelain G., Li T.S., Blanc C., Mathez D., Tubiana R., Katlama C., Debre P., Leibowitch J. Positive effects of combined antiretroviral therapy on CD4+ T cell homeostasis and function in advanced HIV disease. Science. 1997;277:112–116. doi: 10.1126/science.277.5322.112. [DOI] [PubMed] [Google Scholar]
- Fleury S., de Boer R.J., Rizzardi G.P., Wolthers K.C., Otto S.A., Welbon C.C., Graziosi C., Knabenhans C., Soudeyns H., Bart P.A. Limited CD4+ T-cell renewal in early HIV-1 infectioneffect of highly active antiretroviral therapy. Nat. Med. 1998;4:794–801. doi: 10.1038/nm0798-794. [DOI] [PubMed] [Google Scholar]
- Pakker N.G., Notermans D.W., de Boer R.J., Roos M.T., de Wolf F., Hill A., Leonard J.M., Danner S.A., Miedema F., Schellekens P.T. Biphasic kinetics of peripheral blood T cells after triple combination therapy in HIV-1 infectiona composite of redistribution and proliferation. Nat. Med. 1998;4:208–214. doi: 10.1038/nm0298-208. [DOI] [PubMed] [Google Scholar]
- Komanduri K.V., Viswanathan M.N., Wieder E.D., Schmidt D.K., Bredt B.M., Jacobson M.A., McCune J.M. Restoration of cytomegalovirus-specific CD4+ T-lymphocyte responses after ganciclovir and highly active antiretroviral therapy in individuals infected with HIV-1. Nat. Med. 1998;4:953–956. doi: 10.1038/nm0898-953. [DOI] [PubMed] [Google Scholar]
- McMahan C.J., Fink P.J. RAG reexpression and DNA recombination at T cell receptor loci in peripheral CD4+ T cells. Immunity. 1998;9:637–647. doi: 10.1016/s1074-7613(00)80661-5. [DOI] [PubMed] [Google Scholar]