

Abstract
We have identified a novel gene, Tortoise (TorA), that is required for the efficient chemotaxis of Dictyostelium discoideum cells. Cells lacking TorA sense chemoattractant gradients as indicated by the presence of periodic waves of cell shape changes and the localized translocation of cytosolic PH domains to the membrane. However, they are unable to migrate directionally up spatial gradients of cAMP. Cells lacking Mek1 display a similar phenotype. Overexpression of Mek1 in torA − partially restores chemotaxis, whereas overexpression of TorA in mek1 − does not rescue the chemotactic phenotype. Regardless of the genetic background, TorA overexpressing cells stop growing when separated from a substrate. Surprisingly, TorA–green fluorescent protein (GFP) is clustered near one end of mitochondria. Deletion analysis of the TorA protein reveals distinct regions for chemotactic function, mitochondrial localization, and the formation of clusters. TorA is associated with a round structure within the mitochondrion that shows enhanced staining with the mitochondrial dye Mitotracker. Cells overexpressing TorA contain many more of these structures than do wild-type cells. These TorA-containing structures resist extraction with Triton X-100, which dissolves the mitochondria. The characterization of TorA demonstrates an unexpected link between mitochondrial function, the chemotactic response, and the capacity to grow in suspension.
Keywords: TorA, Mek1, chemotaxis, mitochondria, Dictyostelium
Introduction
Chemotaxis is a fundamental property of living cells that enables them to move appropriately during inflammation, angiogenesis, metastasis, and embryonic and neuronal development. The well-characterized chemotactic responses of Dictyostelium discoideum amoebae provide a powerful system for genetic analysis of this fascinating process. The chemotactic behavior and underlying biochemical responses of these amoebae are remarkably similar to those of leukocytes (for review see van Es and Devreotes 1999). In both systems, seven transmembrane G protein–coupled receptors sense the chemoattractants and regulate pseudopod extension at the cell's leading edge. The signal transduction events involved in gradient detection as well as the processes involved in remodeling of the cytoskeleton are subjects of intense investigation. New approaches are needed to also discover the links between chemoattractant sensing and movement during directional migration.
A series of genetic and cell biological analyses has identified many of the components involved in directional sensing and movement. For example, all of the responses to chemoattractants are absent in cells lacking surface receptors or G protein subunits (Insall et al. 1994; Wu et al. 1995). Other mutants with impaired sensing or motility include those defective in metabolism of guanosine 3′, 5′ cyclic monophosphate (cGMP), myosin II regulation, protein kinase B, p21-activated protein kinase, several PI3 kinases, coronin, myosin I, the intracellular phosphodiesterase RegA, and a variety of actin binding proteins (Andre et al. 1989; de Hostos et al. 1993; Kuwayama et al. 1993; Kreitmeier et al. 1995; Abu-Elneel et al. 1996; Jung et al. 1996; Buczynski et al. 1997; Dembinsky et al. 1997; Chung and Firtel 1999; Meili et al. 1999; Wessels et al. 2000). Cells lacking mitogen-activated protein kinase kinase (mek1 −) present an intriguing phenotype. These cells periodically produce the chemoattractant cAMP and differentiate normally but respond to chemoattractant gradients with very attenuated movements. Thus, the defect in mek1 mutants appears to be specific for the connection between directional sensing and movement (Ma et al. 1997).
To further elucidate mechanisms of directional movement, we have isolated a series of chemotaxis mutants. Our screen relied on scoring the phenotypes of plaques on bacterial lawns, derived from clonally seeded cells. Wild-type cells aggregate and differentiate with characteristic morphology, and cells with defects in the chemoattractant-mediated events that control these developmental processes can be readily visualized. We selected clones that resembled those of cells lacking the G protein β subunit (Wu et al. 1995). In addition to displaying aberrant morphology, these plaques expand slowly due to defects in chemotaxis or phagocytosis, or both (Peracino et al. 1998). We reasoned that other chemotaxis mutants would display a small plaque phenotype similar to that of Gβ nulls. Previous screens may have overlooked these “small plaques” and thereby omitted potentially interesting candidates.
A screen for small plaque mutants resulted in isolation of Tortoise (TorA), which is required for efficient chemotaxis and the demonstration that TorA and Mek1 are in a related pathway. These mutants are able to sense chemoattractant gradients but cannot move towards the higher concentration efficiently. Remarkably, TorA is clustered in a novel round structure near one end of many mitochondria. Our results point to an unanticipated role for mitochondria in the chemotactic response.
Materials and Methods
cAMP, 2′deoxy-cAMP, DAPI, and G418 were from Sigma-Aldrich. Mitotracker red CMXRos was from Molecular Probes. Blasticidin S was from Calbiochem. Monoclonal anti–green fluorescent protein (GFP) antibody was from Babco Covance. Multiwell chemotax chambers were from Neuroprobe.
Dictyostelium Growth, Development, Clonal Selection, and Plaque Analysis on Bacterial Lawns
Dictyostelium cells were grown in axenic medium (Ashworth and Watts 1970) at 22°C. 5 μg/ml blasticidin S was added to torA null mutants. 20 μg/ml G418 was added to cell lines carrying TorA, TorA–GFP, and DdMek1 expression constructs. Cells were developed on development buffer–agar plates (10 mM Na/K PO4, 2 mM MgSO4, 0.2 mM CaCl2, 1.5% agar) at 1.5 × 10⁶ cells/cm2. Mutant clones were selected by plating 50–100 cells with 200 μl of an overnight culture of Klebsiella aerogenes on SM nutrient broth–agar plates (Sussman 1987). After 6 d at 22°C, plaques were analyzed for mutant phenotypes and photographed.
Motility in Buffer
The behavior of single cells in buffer was performed as described (Wessels et al. 2000) In short, cells were washed free of nutrients in BSS (20 mM KCl, 2.5 mM MgCl2, 20 mM KH2PO4, pH 6.4) and dispersed onto filters pads at a density of 5 × 10⁶ cells/cm2; aggregation-competent cells were washed from filters, disaggregated by vortexing, and 1 ml of a dilute suspension was inoculated into a Sykes-Moore perfusion chamber (Bellco Glass, Inc.) as described previously (Varnum et al. 1985). The chamber was inverted and placed on the stage of a Leitz upright microscope with a long working distance condenser. The cells were perfused with BSS at a flow rate of 4 ml/min. Fields of cells were monitored for 10 min. Images were captured with a DAGE video camera (DAGE-MTI) and processed with the camera controls so that the cells appeared dark against a lighter background, thus allowing automatic edge detection with the threshold method in two-dimensional dynamic image analyzing system (DIAS; Soll 1995; Soll and Voss 1998). The video output was captured directly through a framegrabber board (Data Translation, Inc.) at a rate of 15 frames/min.
Motility in a Spatial Gradient
Aggregation-competent cells were washed from filters and deposited on the bridge of a gradient chamber (Zigmond 1977). The apparatus consisted of a 2-mm plexiglas bridge bordered on either side by parallel troughs 2 mm wide and 1 mm deep. A 4-μl droplet of test amoebae in BSS was placed on a hemacytometer coverslip, which was then inverted and placed over the bridge and troughs. Amoebae then attached to the bridge at a final density of 10–20 cells/mm2. One trough was filled with buffer alone and the other with buffer containing 10−6 M cAMP. As described above, fields of cells were imaged through a DAGE camera, processed to allow automatic edge detection with two-dimensional DIAS, and captured at a rate of 15 frames/min.
Motility in Natural cAMP Waves
For analyzing motility in natural aggregation territories, exponentially growing cells were washed free of nutrients and suspended in BSS at a density of 2.4 × 10⁶ cells/ml according to methods described previously (Wessels et al. 2000). In brief, 2 ml of the cell suspension was added to the uncoated surface of a 35-mm petri tissue culture dish. After 30 min, cells had settled and attached to the surface. 1 ml of BSS was withdrawn carefully, and the dish was placed on the stage of an ICM405 inverted microscope (ZEISS) connected to a Hamamatsu C-2400 Newvicon camera (Hamamatsu Photonics). Images were captured for 6 h through a 10× objective and brightfield optics, digitized at a rate of three frames/min.
Two-dimensional Computer-assisted Analysis of Cell Motility
Digitized images of cells in buffer and in spatial gradients of cAMP were automatically outlined using the gray scale threshold option of DIAS (Soll and Voss 1998). Movies of cells responding to natural cAMP waves were magnified in DIAS, and single cells were manually outlined. In all cases, perimeters were converted to β-spline replacement images that were used to compute the position of the centroid. Motility parameters were computed from centroid positions, and dynamic morphology parameters were computed from the perimeter contours of the replacement images according to formulas described previously (Soll and Voss 1998). In brief, instantaneous velocity of a cell in frame n was computed by drawing a line from the centroid in frame n − 1 to the centroid in frame n + 1, and then dividing the length of the line by twice the time interval between analyzed frames. Directional change was computed as the direction in the interval (n − 1, n) minus the direction in the interval (n, n + 1). If the directional change was greater than 180°, it was subtracted from 360°, resulting in a positive value between 0° and 180°. Maximum length was computed as the longest chord between any two points along the perimeter; and, maximum width, the longest chord perpendicular to maximum length. Area was defined as the area of the final shape minus the area of any holes, rarely characteristic of translocating cells. Roundness was computed by the formula 100 × 4π (area/perimeter2). The chemotactic index was computed as the net distance moved to the source of chemoattractant divided by the total distance moved in the time period. Percent positive chemotaxis was computed as the proportion of the cell population exhibiting a positive chemotactic index.
Restriction Enzyme–mediated Integration (REMI) Mutagenesis and Plasmid Rescue
Restriction enzyme–mediated integration (REMI) mutagenesis was performed according to Adachi et al. 1994, using plasmid pBSR3, carrying the blasticidin resistance cassette (gift of W.F. Loomis, University of California at San Diego, La Jolla, CA), linearized with BamH1, and DpnII was added during electroporation. The plasmid, along with 4-kb flanking genomic sequence, was rescued from the torA mutant as an 8-kb HindIII fragment that was then ligated and transformed to Escherichia coli (XL1Blue). Colonies carrying the rescued plasmid were selected on ampicillin plates. The genomic sequences flanking the pBSR3 construct were 1 and 3 kb. Southern blot and PCR analysis revealed a 500-bp deletion at the site of the REMI insertion, which deleted the 3′ end (186 bp) of the gene.
Cloning of Full-Length TorA Gene and Construction of torA Null Cell Lines and TorA Expression Constructs
A partial cDNA was cloned from a λgt11 cDNA library containing the 3′ end of the TorA gene. A 0.9-kb fragment of this cDNA was fused at the TthIII site to a genomic fragment containing the 5′ end plus 1 kb noncoding sequence upstream of the TorA gene. This generated a 2.4-kb ORF containing the full-length gene. TorA null cell lines were constructed using the 8-kb rescued plasmid, linearized by HindIII. Another knock-out construct was made by inserting the Bsr cassette as an XbaI fragment into the SpeI site of the TorA gene. Both constructs were used to disrupt the TorA gene in wild-type AX3 cells by transforming the DNA by electroporation and selecting for transformants at 5 μg/ml blasticidin. A TorA expression construct was made by adding a BglII site and ribosome binding site to the 5′ end of the coding sequence using PCR and the use of a BamHI site at the 3′ end of the gene, which allowed cloning of the gene under an actin15 promoter in the BglII site of B18 (Johnson et al. 1991). A TorA–GFP expression construct was made by adding an EcoRI site to the 3′ end of the TorA gene, and subsequent fusion of the GFP gene as an EcoRI-BamHI fragment. The fusion construct was cloned in an integrating expression vector B18. Full-length TorA–GFP and TorA–GFP constructs were made using PCR primers with BamHI (5′) and KpnI (3′) restriction sites. The PCR products were ligated to the 5′ end of the GFP sequence of the pEGFP plasmid (CLONTECH Laboratories, Inc.) and then subcloned as a BamHI-NotI restriction fragment into the extrachromosomal vector pMC34 (Caterina et al. 1994).
Northern Analysis
Total RNA of 107 cells was isolated (Nellen et al. 1987), 20 μg RNA was size fractionated on 1.5% agarose gels containing 2.2 M formaldehyde, transferred to Hybond-N+ membranes (Amersham Pharmacia Biotech), and hybridized to α-32P–labeled dATP DNA fragments.
Preparation of Triton- and Triton/Sodium Carbonate–insoluble Fractions, Immunoblot Analysis, and Silver Staining
Triton-insoluble actin cytoskeletons were prepared from 107 cells according to Spudich 1987. To obtain Triton/sodium carbonate–insoluble fractions, cells were lysed in DB plus 1 mM EDTA, 0.5 mM PMSF at 2 × 10⁷ cells/ml, 100 μl of cells was centrifuged for 2 min at 10,000 g at 4°C. The pellet was resuspended in 1 ml 0.5% Triton X-100, 200 mM sodium carbonate, pH 11.4, and centrifuged at 10,000 g for 10 min at 4°C. For both extraction methods, pellets were resuspended in 100 μl sample buffer and boiled at 100°C, and the equivalent of 5 × 10⁶ cells was loaded on 7.5% SDS polyacrylamide gels. Immunoblot analysis was performed using an enhanced chemoluminescence kit (Amersham Pharmacia Biotech). Silver staining was performed using Bio-Rad Laboratories silver stain.
Mitochondria Staining with DAPI and Mitotracker
For DAPI staining, cells were fixed for 5 min with 2% formaldehyde in HL5, and then for 20 min with 1% formaldehyde in methanol at −20°C. Cells were washed with PBS and stained for 15 min with 5 μM DAPI and washed with PBS. For Mitotracker red staining, cells were incubated 15 min with 500 nM Mitotracker red and washed with 10 mM Na/K phosphate buffer.
cAMP, cGMP, F-actin, and Chemotaxis Measurements
For each assay, cells were developed for 5 h in DB while pulsing with 100 nM cAMP at 6-min intervals and were treated with 3 mM caffeine for 20 min. After two washes in cold DB, 5 × 10⁶ cells were stimulated with 5 × 10⁻⁶ 2′ deoxy-cAMP (cAMP accumulation) and 10−6 M cAMP (cGMP accumulation). For F-actin, 2 × 10⁶ cells were stimulated with 10−7 M cAMP. cAMP amounts were detected using a [3H]cAMP detection kit (Amersham Pharmacia Biotech). cGMP levels were measured using a radioimmuno assay, [3H]cGMP detection kit (Amersham Pharmacia Biotech). F-actin measurements were performed as described (Peracino et al. 1998). For chemotaxis trans-filter assays, 1,000 cells were placed on top of a 5-μm Chemotax filter (Neuroprobe), and 10−6 M cAMP was placed in bottom well underneath the filter. After 3 h, cells in the bottom well were counted.
Fluorescence and Electron Microscopy on TorA–GFP-expressing Cells
Fluorescence microscopy on live cells was performed on a ZEISS microscope (Axiovert 135 TV) as described previously (Parent et al. 1998). Time-lapse movies were made using IP-lab software. Fluorescence microscopy on fixed and DAPI-stained cells was performed on a DeltaVision deconvolution microscope (Applied Precision). Images were taken and deconvoluted using Silicon Graphics software. For transmission electron microscopy, cells were attached to petri dishes, fixed with 2% glutaraldehyde in 0.1 M cacodylate buffer, and postfixed with 1% KFeCN-reduced OsO4. After rinsing with H2O, cells were gradually dehydrated in EtOH (50, 70, 90, and 100%). Samples were embedded in epon and stained with uranyl acetate and lead citrate. Images were taken using a Philips CM120 transmission electron microscope.
Online Supplemental Material
Video 1 shows a time-lapse movie of aggregating control cells on agar after 5 h of development. Frames were taken every 8 s. Video 2 shows a time-lapse movie of aggregating torA − cells on agar after 5 h of development. Frames were taken every 8 s. Video 3 shows a time-lapse movie of aggregating Mek1/torA − cells on agar after 5 h of development. Frames were taken every 8 s. Video 4 shows TorA–GFP-expressing cells. Frames were taken every 3 s. Video 5 shows deconvoluted images for GFP (green) and DAPI (blue) in TorA–GFP-expressing cells. Time-lapse movies are available at http://www.jcb.org/cgi/content/full/152/3/621/DC1.
Results
Isolation of Tortoise and Cloning of the Corresponding Gene
To isolate novel mutants with defects in chemotaxis, we used REMI to generate 30,000 transformants with random insertions in the genome. These were clonally seeded on bacterial lawns, and plaques that expanded slowly under these conditions were selected. 18 small plaque mutants were isolated, and Tortoise (torA −) was chosen for further study. The plaque size and additional phenotypes of torA −, described in detail below, closely resembled those of mek1 − (Fig. 1A and Fig. B).
Figure 1.

Plaque sizes and developmental phenotypes of torA − and mek1 mutants. (A) Cells were mixed with K. aerogenes and clonally seeded on agar plates. Photographs were taken after 6 d at 22°C. Typical examples of each phenotype are shown (B). Cells were allowed to develop on DB-agar at 1.5 × 10⁶ cells/cm2 and were photographed at the indicated time points. (C) Northern Blot analysis of Mek1 expression during development of wild-type and torA − cells. Cells were developed as in B, and, at the indicated times, cells were washed off the plate, and total RNA was extracted. Bars: (A) 10 mm; (B) 1 mm.
Time-lapse videos more clearly revealed the mutant phenotype. The coordinated motions of the cells indicated that torA − generated cAMP waves with frequency and speed nearly identical to those of wild-type cells. However, the mutant aggregated slowly because the distances covered by the chemotactic movement steps were significantly less than those of wild-type cells (see Videos 1 and 2, available at http://www.jcb.org/cgi/content/full/152/3/621/DC1). Typically, wild-type cells aggregated into mounds after the passage of 20 waves. In contrast, torA − had not completed aggregation after 30 or 40 waves (data not shown). Eventually, the incompletely aggregated cells reorganized into much smaller territories and formed tiny mounds and fruiting bodies. A similar phenotype has been described for mek1 − (Ma et al. 1997).
Expression of Mek1 almost completely suppressed the phenotype of torA − (Fig. 1A and Fig. B). The sizes of all the torA − plaques on bacterial lawns were increased nearly to those of wild type. Within the plaques, there was a decrease in the number and a corresponding increase in the size of the multicellular structures formed for Mek1/torA −. In a time-lapse video, Mek1/torA − also displayed a pattern of aggregation that closely resembled wild-type cells (see Video 3, available at http://www.jcb.org/cgi/content/full/152/3/621/DC1). As shown in Fig. 1 C, the levels of Mek1 were not lower in Tortoise than in wild type, suggesting that the observed phenotypic suppression is due to overexpression of Mek1 in torA −.
Next, we isolated and identified the gene mutated in torA − (Fig. 2). We cloned the regions flanking the insertions and determined the sequence as described in Materials and Methods. To verify whether the observed phenotypes were caused by the REMI insertions, we linearized the recovered plasmids, transformed them into wild-type Ax3 cells, and recreated the genotype through homologous recombination. Fig. 1 A shows that disruption of TorA in fresh wild-type cells regenerates the small plaque and tiny structure phenotype on bacterial lawns. This mutant was used for all further analyses.
Figure 2.

Structure of the TorA gene. (A) TorA. Solid lines and open bars represent genomic sequences and coding regions (2,427 bp), respectively. The gray box represents the coiled coil domain. Insertion 1 (Ins1) was in the Bcl1 site in the original REMI mutant. Insertion 2 (Ins2) was made in the Spe1 site. (B) Amino acid sequence of TorA. The sequence of TorA is available from Genbank/EMBL/DDBJ under accession number AF303221.
The genomic sequence of TorA contained an ORF of 808 amino acids, which was disrupted at amino acid 746 and caused a 500-bp deletion. To prove that disruption of this ORF is responsible for the phenotype, we created insertions at amino acids 501 and 746 by homologous recombination in wild-type cells. The new mutants displayed the small plaque phenotype. The ORF of TorA predicts a largely α-helical protein with a predicted coiled coil domain from residues 689–736. It bears weak homology to other proteins with coiled coil domains such as myosin. To understand this intriguing phenotype represented by these mutants, we turned to a thorough analysis of the torA − mutant.
The Phenotypes of Tortoise and Their Suppression by Mek1 Can Be Traced to Alterations in Chemotaxis
The defects in motility and/or chemotaxis suggested from time-lapse movies were further analyzed by computer-assisted methods (Table and Fig. 3) (Soll 1995; Soll and Voss 1998; Wessels et al. 2000). In spatial gradients of cAMP, the morphology parameters (length, area, and roundness) of control, torA − and Mek1/torA −, were similar. Velocity was reduced 30%, and the rate of turning was higher in torA − cells relative to control cells (Table ). The defect in velocity was not reversed in Mek1/torA − cells, whereas that in directional change was. The control and Mek1/torA − cells carried out chemotaxis up the spatial gradient in a highly efficient manner, exhibiting mean chemotactic indices of +0.60 and +0.52, respectively. The torA − cells exhibited a mean chemotactic index of only +0.12, close to that of randomly moving cells.
Table 1.
Motility, Dynamic Morphology, and Chemotaxis Parameters of Control, torA−, and Mek1/torA− Cells Translocating in Buffer and a Spatial Gradient of cAMP
| Condition | Cell type | Cell number | Instantaneous velocity | Directional change | Maximum length | Area | Roundness | Chemotactic index |
|---|---|---|---|---|---|---|---|---|
| μm/min | °/min | μm | μm2 | % | ||||
| Buffer | Control | 35 | 15.2 ± 4.2 | 29.7 ± 10.6 | 24.0 ± 4.3 | 108 ± 28 | 52.6 ± 11.9 | — |
| Buffer | torA − | 28 | 5.2 ± 2.0 | 50.7 ± 12.7 | 19.0 ± 3.5 | 105 ± 24 | 50.8 ± 9.1 | — |
| Buffer | Mek1/torA− | 24 | 8.0 ± 2.6 | 38.9 ± 10.2 | 22.6 ± 4.2 | 110 ± 21 | 53.8 ± 6.7 | — |
| Spatial gradient | Control | 53 | 11.1 ± 3.9 | 23.8 ± 15.4 | 21.2 ± 5.0 | 115 ± 29 | 31.4 ± 6.4 | +0.60 ± 0.33 |
| Spatial gradient | torA− | 40 | 7.8 ± 2.0 | 35.7 ± 10.4 | 20.2 ± 2.6 | 125 ± 34 | 41.3 ± 11.2 | +0.12 ± 0.39 |
| Spatial gradient | Mek1/torA− | 32 | 7.5 ± 3.2 | 25.3 ± 11.6 | 20.0 ± 2.3 | 119 ± 19 | 39.2 ± 6.7 | +0.52 ± 0.34 |
Figure 3.

Chemotaxis and motility analysis of torA − and Mek1/torA − cells. (A) Perimeter tracks of control, torA −, and Mek1/torA − cells moving in a spatial gradient of cAMP generated across the bridge of a gradient chamber in which buffer alone was placed in one trough and buffer plus 10−6 M cAMP in the other trough (SOURCE) bordering the bridge. The motion analysis of individual cells was initiated after 5 min, the time necessary to establish a steep gradient of cAMP. (B) Transfilter assay for chemotaxis of torA − and control cells. 1,000 cells were applied to multiwell chemotaxis chambers with 5-μm pores. 10−6 M cAMP or DB was added to the well underneath the filter, and after 3 h cells that had reached the bottom of the well were counted. (C) The behavior of individual control and torA − cells in natural aggregation territories in submerged cultures. Three representative cells of each cell type in close proximity but not touching were videorecorded for 50–70 min, and motion analyzed. In each case, instantaneous velocity was plotted as a function of time. Periodicity, in minutes, was computed from velocity peaks. To the right of each velocity plot is the centroid track of a portion of the analysis. Troughs, which represent the deduced peak (P) and back (B) of each wave are numbered in the velocity plot and respective centroid track for comparison. In the case of control cells, a common aggregation center (agg center) was identifiable. Arrows reflect the general direction of translocation. No common aggregation center was identifiable in the torA − territories.
In Fig. 3 A, perimeter tracks are presented of control, torA −, and Mek1/torA − cells responding to spatial gradients of cAMP. Although control and Mek1/torA − cells moved in a smooth directional fashion towards the source of chemoattractant, torA − cells moved in a zig-zag fashion in random directions (Fig. 3 A). The rough tracks reflect high frequencies of lateral pseudopod formation. The frequency of lateral pseudopod formation, which was low in control and Mek1/torA − cells, has previously been demonstrated to be inversely proportional to the chemotactic index (Varnum-Finney et al. 1987; Wessels et al. 1996, Wessels et al. 2000). In transfilter assays, three times as many control cells moved towards the cAMP source, supporting the conclusion that torA − cells are defective in chemotaxis (Fig. 3 B).
Finally, single-cell behavior was analyzed in submerged cultures during natural aggregation. Control cells moved in a cyclic fashion, reflected by peaks and troughs at constant intervals in velocity plots (Fig. 3 C). These movement steps are in response to the periodic cAMP waves. Plots of the positions of three representative control cells in Fig. 3 C reflect the movement steps. The points are well-separated in the front and clustered at the peak and in the back of each deduced wave. In contrast, peak velocity behavior was sporadic for three representative torA − cells in close proximity (Fig. 3 C). Interestingly, the velocity between peaks that reflect the nonchemotactic motility between two cAMP waves was only slightly reduced. This suggests that torA − cells are defective in increasing their speed in response to the approaching cAMP gradient. These results demonstrate that in natural aggregation territories, torA − cells move in all directions (i.e., in a nonchemotactic fashion), exhibit a less constant period, and move with depressed peak velocities.
Also, we studied motility of the three cell types in the absence of a cAMP gradient on a glass surface. The morphology parameters (length, area, and roundness) were similar in all three cell types. Under these conditions, the velocity of torA − cells was lower and the rate of turning was higher than that of control cells (Table ). These basic motility defects were only partially reversed in Mek1/torA − cells (Table ).
The following results further show that torA − is specifically defective in chemotaxis. First, the appearance of coordinated cell movements caused by the propagation of cAMP waves after 3–4 h of development indicates that torA − differentiates properly and expresses a cAMP signaling system. Consistent with this, wild-type and torA − cells accumulate equal amounts of cAMP in response to cAMP stimulation, indicating that torA − cells have normal chemoattractant-induced activation of adenylyl cyclase (Fig. 4 A). Previous studies suggest that appropriate activation of adenylyl cyclase requires wild-type levels of surface receptors, G protein subunits, adenylyl cyclase, and several cytosolic regulators. Second, since it has previously been reported that mek1 − cells fail to accumulate cGMP in response to chemoattractant stimulation, we tested whether torA − cells had a defect in cGMP metabolism. Under our conditions, both the torA − and the mek1 − cells displayed a wild-type cGMP response. Third, chemoattractant-induced polymerization of actin was normal in both mutants (data shown for torA − only). Since the chemotaxis defect was caused by failure to detect the gradient or a failure to respond properly, we assessed whether the cells can sense the direction of a gradient. We transformed torA − and wild-type cells with a GFP fusion of the PH domain of cytosolic regulator of adenylyl cyclase (Crac). When wild-type cells are placed in a cAMP gradient this fusion protein translocates to the side of the highest concentration (Parent et al. 1998). As shown in Fig. 4 B, this translocation also occurred in torA − cells, showing that these cells are able to detect external gradients. These results suggest that torA − cells are unable to respond to a detected gradient with proper pseudopod extension.
Figure 4.

Biochemical responses towards cAMP in torA −. Cells were developed for 5 h in a shaken suspension with the addition of 100-nM pulses of cAMP every 6 min or on DB-agar plates (in the case of cGMP accumulation) (A) Signal transduction responses: 5 × 10⁻⁵ M 2′deoxy-cAMP (cAMP accumulation), 10−7 M cAMP (F-actin), 10-6 M cAMP (cGMP accumulation). •, torA −; ▪, Ax3; ▴, mek1 −. (B) Translocation of Crac PH-domains to the leading edge of torA − and wild-type cells in a cAMP gradient. The white dot indicates the position of the micropipette filled with 10−6 M cAMP. Bar, 10 μm.
Based on the results described above, the slow rate of plaque expansion in torA mutants may be caused by defects in motility or chemotaxis towards bacteria. This phenotype was not caused by a phagocytosis defect, since the rates of uptake of heat-killed yeast particles were identical in torA − and wild-type cells (data not shown). To assess whether the torA − cells were able to move towards bacterially produced chemoattractants, we filmed the edges of expanding plaques. We found that wild-type cells often made forays into the surrounding bacterial lawn, whereas torA − cells did not (data not shown).
Ectopic Expression of TorA Leads to Surface-dependent Growth
In performing control experiments to confirm that the Tortoise phenotype was caused by a deletion in the isolated gene, we discovered a fascinating new phenotype caused by overexpression of the TorA gene. Cells with high levels of expression lost their ability to grow in shaken suspension and were entirely dependent on the surface of a petri dish for growth. We expressed the full-length gene under a constitutive Actin 15 promoter in torA − cells. The resulting TorA/torA − cell line formed larger plaques and fruiting bodies; however, the fruiting bodies were slightly smaller than those of wild type (Fig. 5 A). On growth plates, detached TorA-overexpressing cells did not proliferate but became smaller and rounder, whereas the attached cells continued to grow. Typically, wild-type cells grow at a similar rate whether attached or in suspension. We next designed an experiment to directly show that the mutant grows normally when attached to the surface of a petri dish but cannot grow in suspension. Wild-type cells and cells overexpressing TorA were grown to confluency in petri dishes, harvested, and shaken in flasks. Under these conditions, cells overexpressing TorA stopped growing, whereas wild-type cells displayed normal growth rates. Thus, TorA overexpression leads to surface-dependent growth (Fig. 5 B).
Figure 5.
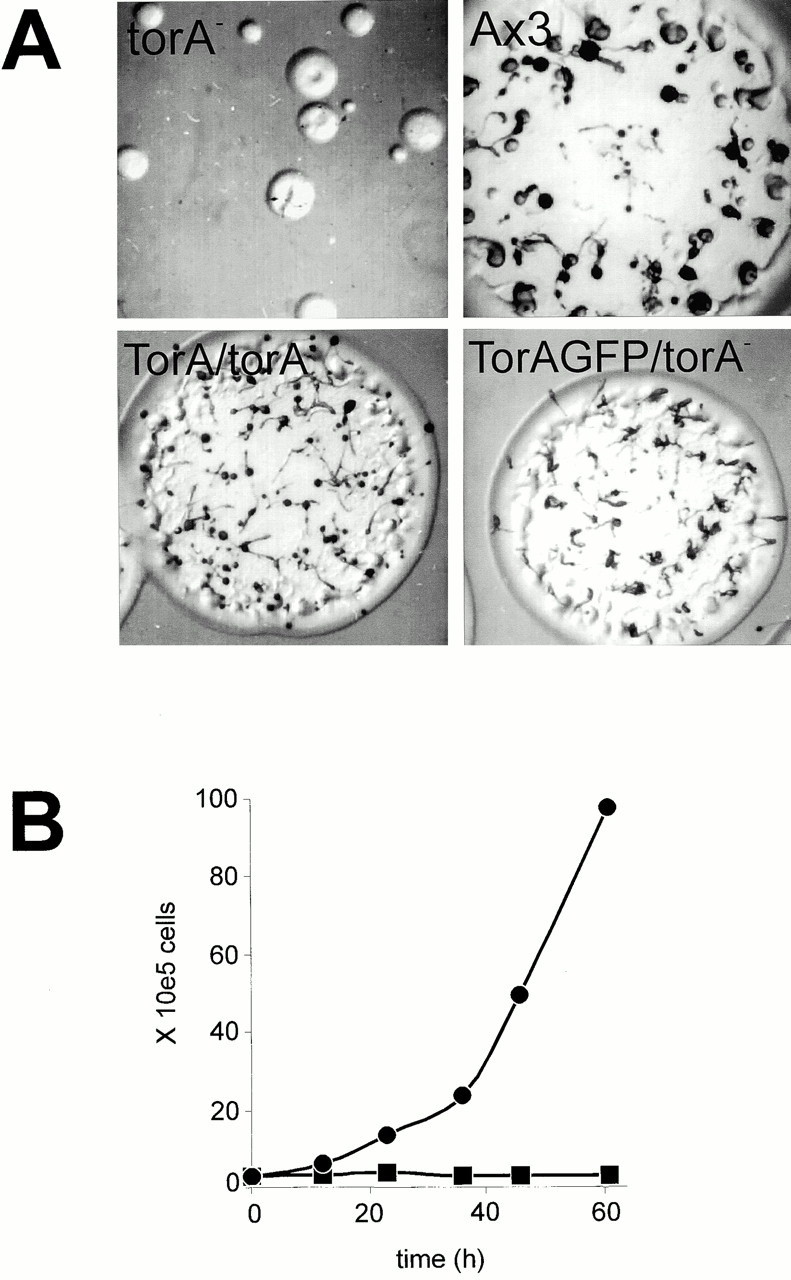
Effects of constitutive expression of TorA and TorA–GFP on plaque size of torA − and growth in suspension. (A) Plaques of torA − and cells expressing TorA or TorA–GFP, grown for 6 d on K. aerogenes lawns. (B) Growth curves of Ax3 cells and Ax3 cells expressing TorA. Cells were grown to confluency in petri dishes and then shaken in flasks at 3 × 10⁵ cells/ml and counted at the indicated time points. •, Ax3; ▪, Ax3 cells overexpressing TorA.
TorA Is Clustered to One End of Mitochondria and Is Associated with the Cytoskeleton
To localize TorA in living cells, we fused GFP to its COOH terminus and expressed the construct under the Actin 15 promoter. The phenotype of the TorA–GFP/torA − cell line was identical to that of TorA/torA − (Fig. 5 A), including the acquisition of surface-dependent growth, indicating that the GFP fusion did not significantly affect TorA function (data not shown). The observed TorA–GFP fluorescence was localized to punctate regions throughout the cell (Fig. 6 A; see Video 4, available at http://www.jcb.org/cgi/content/full/152/3/621/DC1).
Figure 6.

Localization of TorA–GFP. (A) TorA–GFP localization in living cells. (B) Deconvoluted images for GFP (green) and DAPI (blue) in TorA–GFP-expressing cells that were fixed and stained with 5 μM DAPI. Bars, 10 μM.
Staining with Mitotracker of TorA–GFP-expressing cells showed identical staining patterns, suggesting that TorA–GFP localizes to mitochondria (data not shown). Costaining with DAPI of fixed cells showed that TorA–GFP was localized to one end of mitochondria (Fig. 6 B; see Video 5, available at http://www.jcb.org/cgi/content/full/152/3/621/DC1).
Deletion Analysis of TorA Reveals Domains Required for Function and Localization
To identify domains required for TorA function and localization, we made a series of COOH terminally truncated proteins, which were fused to GFP. To study whether these mutant proteins were functional, we tested whether expression of these constructs could suppress the torA − phenotype. As shown in Fig. 7, truncation of the 63 COOH-terminal amino acids results in the inability to restore the torA − phenotype, indicating that the protein is not functional. Interestingly, this protein and shorter NH2-terminal fragments that lack the coiled coil domain localize to mitochondrial clusters. As more of the COOH-terminal sequence was deleted, staining of the clusters decreases, and staining of the entire mitochondrion increases. The NH2-terminal 156 amino acids are necessary and sufficient to target GFP to the mitochondrion. When this region is deleted, the protein targets to the cytosol and does not complement the torA − mutant. Interestingly, the NH2 terminally truncated protein does not form clusters in the cytosol, suggesting that the formation of these structures requires the association with certain mitochondrial proteins.
Figure 7.

Localization and function of truncated TorA–GFP proteins. Truncated TorA–GFP proteins were expressed in Ax3 to study localization of the fluorescent signal. The same constructs were expressed in torA − to study their ability to rescue this mutant.
Expression of TorA Leads to the Formation of Clusters That Stain with Mitotracker
The clusters appeared to be an intriguing novel mitochondrial structure that stained with the mitochondrial dye Mitotracker (Fig. 8). Expression of wild-type TorA or TorA–GFP resulted in the formation of several structures in the mitochondria that showed intense staining with this dye (Fig. 8 B). The Mitotracker and GFP signals display identical patterns, indicating that the structures observed after Mitotracker staining indeed contain TorA–GFP (Fig. 8C and Fig. D). Importantly, wild-type cells also contained these structures. About 20–30% of wild-type cells showed punctate staining with Mitotracker, but in only a few mitochondria per cell (Fig. 8 A). Thus, the number or size of these structures is enhanced by overexpression of TorA. Mitotracker staining depends on the mitochondrial membrane potential to be specifically imported in mitochondria, suggesting that the novel structure may be a region with high electron potential. Mitotracker does not accumulate at any site outside the mitochondrion and at only one site in each mitochondrion, so the staining of this structure is specific. We also detected some of these structures in torA − mitochondria (data not shown), indicating that the clusters contain other proteins besides TorA. We could not determine whether the null had fewer structures. Using electron microscopy, we visualized the clusters as a round electron-dense mass in the mitochondrion (Fig. 8, E–G). The Mitotracker results suggest that these structures also exist in wild-type cells, but they may be harder to find in electron microscopy.
Figure 8.

Localization of TorA to specific mitochondrial structures. (A–D) Mitotracker staining of wild-type and TorA–GFP-expressing cells. Living wild-type cells (A) and TorA–GFP-expressing cells (B) were stained with Mitotracker red. After staining, some cells were fixed in formaldehyde (C and D). Images show GFP (C) and Mitotracker red (D) fluorescence of one cell. (E–G) Transmission electron microscopy images of TorA–GFP-expressing cells. Examples of three mitochondria from two different TorA–GFP-expressing cells are shown. Arrows indicate submitochondrial bodies apparent in TorA overexpressing cells.
TorA Localizes to a Triton X-100/Sodium Carbonate–Insoluble Fraction
Investigation of the subcellular localization of TorA–GFP and its colocalization with mitochondria revealed that TorA displayed some unusual properties for an integral component of mitochondria. Using immunoblots (Fig. 9 A), we showed that nearly all TorA–GFP was localized to the particulate fraction. After extraction of the particulate fraction with Triton X-100, TorA–GFP localized to the Triton X-100–insoluble fraction. Under these conditions, ∼70% of the mitochondrial marker TopA (Komori et al. 1997) was solubilized (data not shown). As shown by fluorescence microscopy, Triton X-100 extraction does not disrupt the TorA–GFP clusters (Fig. 9 B). Surprisingly, TorA–GFP remained insoluble, even after treatment of the particulate fraction with Triton X-100 in 200 mM sodium carbonate (Fig. 9A and Fig. C). These fractions do not contain mitochondria or cytoskeleton, suggesting that TorA–GFP may be part of a novel structure. TorA–GFP was the predominant protein in the final fraction, which contained only six or seven major protein bands (Fig. 9 C). The coiled coil region in TorA is not required for these properties, since a truncated version, TorA (1–676), lacking the coiled coil region, still targeted GFP to the Triton/sodium carbonate–insoluble fraction (Fig. 9 C).
Figure 9.
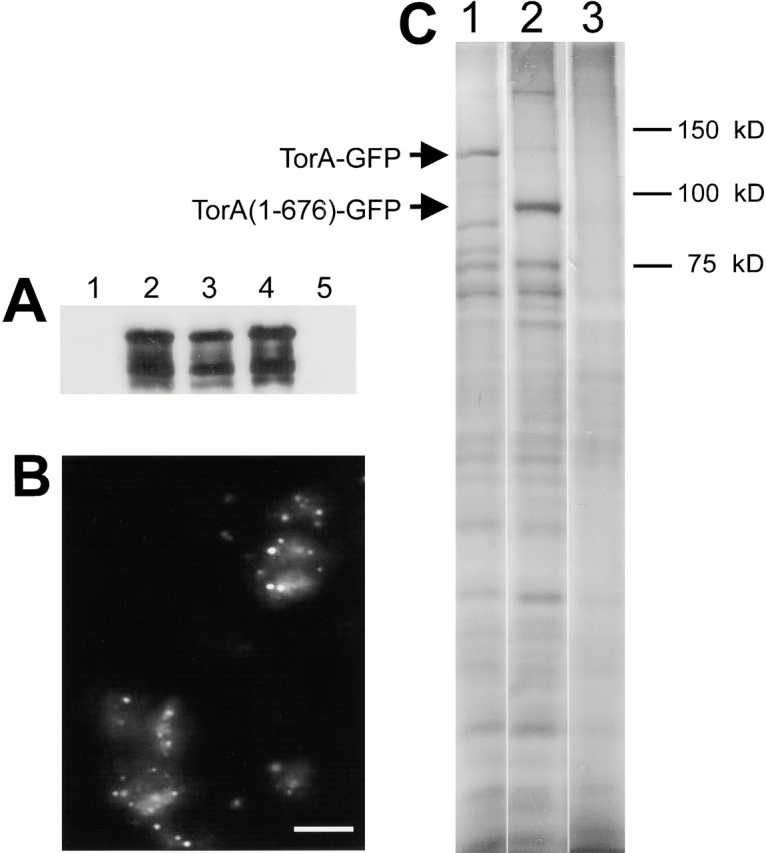
TorA is Triton X-100/sodium carbonate insoluble. (A) Anti-GFP immunoblots of TorA–GFP-expressing cells (lanes 1–4) and Ax3 (lane 5). Cells were lysed through 5 μM nucleopore filters (Corning) and separated in low speed supernatants (lane 1), and pellets (lanes 2 and 5). Insoluble fraction after extraction of whole cells with 0.5% Triton X-100 according to Spudich 1987 (lane 3). Insoluble fraction after extraction of pellets with a mixture of 0.5% Triton X-100, 0.2 M sodium carbonate (lane 4). (B) GFP fluorescence of insoluble fractions after extraction of whole cells with 0.5% Triton X-100. (C) Silver-stained gel of insoluble 0.5% Triton X-100/sodium carbonate–insoluble fractions. Lane 1, TorA–GFP; lane 2, TorA (1–676)–GFP; lane 3, Ax3. Bar, 10 μm.
Discussion
In our search for novel proteins that link the chemotactic signal to the actin cytoskeleton during chemotaxis, we discovered a novel mitochondrial protein, TorA, whose function is essential for chemotaxis. This unexpected finding indicates that mitochondria may have a role in directional movement. Importantly, these mutants have no obvious defects in signal transduction or movement, indicating that the chemotaxis defect is very specific. TorA was associated with a novel round structure in the mitochondrion. Overexpression of TorA induces the number of these structures and simultaneously causes cell growth to become surface dependent.
Interestingly, the torA − phenotype strongly resembles that of the previously identified mek1 − (Ma et al. 1997) and of a recently isolated mutant tsunami (P. Devreotes, unpublished results). These mutants all display very similar defects in chemotaxis to cAMP. The chemotactic response to each cAMP wave is attenuated. Therefore, more waves are required for aggregation, and the structures are smaller. In addition to these morphological defects, these mutants share the small plaque phenotype, suggesting that they may represent a novel class of chemotaxis mutants. We have thoroughly investigated the chemotaxis defect in torA −.
The torA − mutant does not display obvious defects in cAMP signaling. The cells produce wild-type amounts of cAMP in response to exogenous cAMP, and the frequency of the cAMP waves is similar to that of wild-type cells. In addition, other signaling responses that have been implicated in chemotaxis, such as cGMP accumulation and actin polymerization, are not altered in torA −. Several data indicate that torA − cells are not impaired in sensing cAMP gradients. First, they express wild-type levels of cAMP receptor. Second, the sensitivity of the actin polymerization response is not altered in torA − cells. Third, the mutant is capable of directional sensing of the cAMP gradient, since it recruits PH domains to the side of the highest concentration.
However, torA − cells are incapable of responding to a spatial gradient with directed movement. This aberrant behavior was also manifested in natural aggregation territories in submerged cultures. Control cells suppress lateral pseudopod formation when chemotaxing up a spatial gradient (Varnum-Finney et al. 1987). torA − cells formed lateral pseudopods at high rates even when randomly moving in the presence of a concentration gradient. This may be the reason why the efficiency of chemotaxis is drastically reduced and may account for the lower average velocity of torA − cells manifested both under chemotactic conditions and in buffer. Several regulatory and cytoskeletal molecules have been indicated recently in the regulation of lateral pseudopod formation including myosin I (Titus et al. 1992; Wessels et al. 1991, Wessels et al. 1996), myosin II (Wessels et al. 1988; Shelden and Knecht 1996), phosphorylation of the myosin regulatory light chain (Zhang, H., D. Wessels, K. Daniels, R. Chisholm, R., and D.R. Soll., submitted for publication), and the internal phosphodiesterase RegA (Wessels et al. 2000). It is noteworthy that overexpression of Mek1 restores chemotactic efficiency but does not restore velocity to control cell levels, suggesting that TorA serves two roles, one related to basal velocity that is unrelated to Mek1, and a second related to chemotaxis that is upstream of Mek1.
The unexpected localization of TorA to a single punctate region of the mitochondrion raises several interesting questions about the role of TorA in chemotaxis and surface-dependent growth. This is the first description of a protein that localizes near the end of a mitochondrion. This suggests that mitochondria are not symmetric. Interestingly, TorA colocalizes with a structure in the mitochondrion that shows enhanced staining with the mitochondrial dye Mitotracker. These staining patterns are also observed in cells that do not overexpress TorA, but the number of mitochondria that display this structure is much lower. Similarly, many mitochondria from TorA–GFP-overexpressing cells displayed an electron dense spot in electron micrographs. These data suggest that TorA overexpression enhances the formation or enlargement of these structures. In addition, TorA is completely resistant to both Triton X-100 and sodium carbonate extraction, which completely dissolves the mitochondrion. Only very few proteins have these properties (Fig. 9 C) and it remains to be investigated whether they are part of the structure that contains TorA.
Deletion analysis shows that the ability to form clusters resides in the NH2-terminal half of the TorA protein. A shorter construct, containing only the NH2-terminal 156 residues fused to GFP, still targets the protein to mitochondria but forms only very few clusters resulting in diffuse mitochondrial staining. The sequence contains many positively charged residues, which may represent a mitochondrial import signal. Expression of a mutant protein that lacks 63 COOH-terminal residues is able to form clusters but does not rescue the torA − phenotype, indicating that cluster formation is not sufficient for TorA function.
Overexpression of TorA causes the inability to grow in suspension, and nonadherent cells die. This growth defect correlates with increased staining of the submitochondrial structures with Mitotracker and may be the result of impaired mitochondrial function due to a general increase in number or size of these structures. The growth defect is not a cytokinesis defect as has been described for a variety of Dictyostelium mutants (De Lozanne and Spudich 1987; de Hostos et al. 1993; Chung and Firtel 1999), since the cells remain small and mononucleated (data not shown). Apparently, TorA-overexpressing cells need to sense contact signals in order to undergo cell division, whereas wild-type cells do not need to sense these signals.
We can only speculate on the mechanism by which disruption of TorA affects chemotaxis. One possibility is that TorA is necessary for normal mitochondrial function. However, the specificity of the chemotaxis defect suggests mitochondria of torA − are still producing wild-type levels of ATP. Evidently, we cannot rule out that mitochondria in torA − cells are impaired in other functions that may affect chemotaxis. Chemotaxis may demand a sudden increase in mitochondrial function or a repositioning of mitochondria, which requires TorA. TorA disruption or overexpression may affect the shape of mitochondria. Living Ax3-, torA −-, and TorA-overexpressing cells display similar numbers and shapes of mitochondria. However, in fixed cells, mitochondria from torA − appeared larger and rounder when stained with DAPI or Mitotracker (van Es, S., unpublished observations). This suggests that there may be a subtle defect in mitochondrial structure that is not readily visualized in living cells.
Mek1 and TorA mutants display similar impairments in chemotaxis and the capacity of Mek1 to suppress the chemotactic defects in TorA is intriguing. Mek1 mutants may have a similar mitochondrial defect as TorA mutants. Alternatively, TorA may somehow affect the Mek1 activity or localization. We are currently studying the localization of Mek1 in wild-type cells and TorA mutants to investigate this possibility.
The unexpected finding that a protein with specific roles in chemotaxis and substrate sensing is localized to mitochondria is fascinating and suggests that processes like chemotaxis also require mitochondrial proteins in other species. Thus far, no strong homologues of TorA have been found in other species, but it remains possible that functional homologues in other species exist that share a similar structure but have little obvious sequence homology. For example, recent data in Drosophila and mammalian cells suggest that functional homologues exist between species that do not share any sequence homology (Du et al. 2000; Verhagen et al. 2000). The unique localization of TorA to a novel mitochondrial structure allows us to search for identical structures in mitochondria from other organisms. This may lead to the identification of proteins with similar function as TorA.
Supplemental Material
Acknowledgments
The authors wish to thank Dr. Rick Firtel (University of California at San Diego, La Jolla, CA) for the Mek1 expression plasmid, Dr. Carole Parent (National Institutes of Health, Bethesda, MD) for the PH(Crac)-GFP plasmid, and Dr. Margaret Clarke (Oklahoma Medical Research Foundation, Oklahoma City, OK) for the TopA-GFP expression plasmid.
Part of this work was performed by D. Wessels and D.R. Soll who used the WM Keck Dynamic Image Analysis Facility at the University of Iowa, which is funded by the WM Keck Foundation. This work was supported by the Netherlands Organization for Scientific Research (NWO) grant to S. van Es, and National Institutes of Health grants GM28007 to P.N. Devreotes and HD18577 to D.R. Soll.
Footnotes
The online version of this article contains supplemental material.
Abbreviations used in this paper: cGMP, guanosine 3′, 5′ cyclic monophosphate; Crac, cytosolic regulator of adenylyl cyclase; DIAS, dynamic image analyzing system; GFP, green fluorescent protein; REMI, restriction enzyme–mediated integration; TorA, Tortoise.
References
- Abu-Elneel K., Karchi M., Ravid S. Dictyostelium myosin II is regulated during chemotaxis by a novel protein kinase C. J. Biol. Chem. 1996;271:977–984. doi: 10.1074/jbc.271.2.977. [DOI] [PubMed] [Google Scholar]
- Adachi H., Hasebe T., Yoshinaga K., Ohta T., Sutoh K. Isolation of Dictyostelium discoideum cytokinesis mutants by restriction enzyme-mediated integration of the blasticidin S resistance marker. Biochem. Biophys. Res. Commun. 1994;205:1808–1814. doi: 10.1006/bbrc.1994.2880. [DOI] [PubMed] [Google Scholar]
- Andre E., Brink M., Gerisch G., Isenberg G., Noegel A., Schleicher M., Segall J.E., Wallraff E. A Dictyostelium mutant deficient in severin, an F-actin fragmenting protein, shows normal motility and chemotaxis. J. Cell Biol. 1989;108:985–995. doi: 10.1083/jcb.108.3.985. [DOI] [PMC free article] [PubMed] [Google Scholar]
- Ashworth J.M., Watts D.J. Metabolism of the cellular slime mold Dictyostelium discoideum grown in axenic culture. Biochem. J. 1970;119:175–182. doi: 10.1042/bj1190175. [DOI] [PMC free article] [PubMed] [Google Scholar]
- Buczynski G., Grove B., Nomura A., Kleve M., Bush J., Firtel R.A., Cardelli J. Inactivation of two Dictyostelium discoideum genes, DdPIK1 and DdPIK2, encoding proteins related to mammalian phosphatidylinositide 3–kinases, results in defects in endocytosis, lysosome to postlysosome transport, and actin cytoskeleton organization. J. Cell Biol. 1997;136:1271–1286. doi: 10.1083/jcb.136.6.1271. [DOI] [PMC free article] [PubMed] [Google Scholar]
- Caterina M.J., Milne J.L., Devreotes P.N. Mutation of the third intracellular loop of the cAMP receptor, cAR1, of Dictyostelium yields mutants impaired in multiple signaling pathways. J. Biol. Chem. 1994;269:1523–1532. [PubMed] [Google Scholar]
- Chung C.Y., Firtel R.A. PAKa, a putative PAK family member, is required for cytokinesis and the regulation of the cytoskeleton in Dictyostelium discoideum cells during chemotaxis. J. Cell Biol. 1999;147:559–576. doi: 10.1083/jcb.147.3.559. [DOI] [PMC free article] [PubMed] [Google Scholar]
- de Hostos E.L., Rehfuess C., Bradtke B., Waddell D.R., Albrecht R., Murphy J., Gerisch G. Dictyostelium mutants lacking the cytoskeletal protein coronin are defective in cytokinesis and cell motility. J. Cell Biol. 1993;120:163–173. doi: 10.1083/jcb.120.1.163. [DOI] [PMC free article] [PubMed] [Google Scholar]
- De Lozanne A., Spudich J.A. Disruption of the Dictyostelium myosin heavy chain gene by homologous recombination. Science. 1987;236:1086–1091. doi: 10.1126/science.3576222. [DOI] [PubMed] [Google Scholar]
- Dembinsky A., Rubin H., Ravid S. Autophosphorylation of Dictyostelium myosin II heavy chain-specific protein kinase C is required for its activation and membrane dissociation. J. Biol. Chem. 1997;272:828–834. doi: 10.1074/jbc.272.2.828. [DOI] [PubMed] [Google Scholar]
- Du C., Fang M., Li Y., Li L., Wang X. Smac, a mitochondrial protein that promotes Cytochrome c–dependent caspase activation by eliminating IAP inhibition. Cell. 2000;102:33–42. doi: 10.1016/s0092-8674(00)00008-8. [DOI] [PubMed] [Google Scholar]
- Insall R.H., Soede R.D., Schaap P., Devreotes P.N. Two cAMP receptors activate common signaling pathways in Dictyostelium . Mol. Biol. Cell. 1994;5:703–711. doi: 10.1091/mbc.5.6.703. [DOI] [PMC free article] [PubMed] [Google Scholar]
- Johnson R.L., Vaughan R.A., Caterina M.J., van Haastert P.J., Devreotes P.N. Overexpression of the cAMP receptor 1 in growing Dictyostelium cells. Biochemistry. 1991;30:6982–6986. doi: 10.1021/bi00242a025. [DOI] [PubMed] [Google Scholar]
- Jung G, Wu X., Hammer J.A. Dictyostelium mutants lacking multiple classic myosin I isoforms reveal combinations of shared and distinct functions. J. Cell Biol. 1996;133:305–313. doi: 10.1083/jcb.133.2.305. [DOI] [PMC free article] [PubMed] [Google Scholar]
- Komori K., Kuroe K., Yanagisawa K., Tanaka Y. Cloning and characterization of the gene encoding a mitochondrially localized DNA topoisomerase II in Dictyostelium discoideum. Western blot analysis. Biochim. Biophys. Acta. 1997;1352:63–72. doi: 10.1016/s0167-4781(96)00229-1. [DOI] [PubMed] [Google Scholar]
- Kreitmeier M., Gerisch G., Heizer C., Muller-Taubenberger A. A talin homologue of Dictyostelium rapidly assembles at the leading edge of cells in response to chemoattractant. J. Cell Biol. 1995;129:179–188. doi: 10.1083/jcb.129.1.179. [DOI] [PMC free article] [PubMed] [Google Scholar]
- Kuwayama H., Ishida S., Van Haastert P.J. Non-chemotactic Dictyostelium discoideum mutants with altered cGMP signal transduction. J. Cell Biol. 1993;123:1453–1462. doi: 10.1083/jcb.123.6.1453. [DOI] [PMC free article] [PubMed] [Google Scholar]
- Ma H., Gamper M., Parent C., Firtel R.A. The Dictyostelium MAP kinase kinase DdMEK1 regulates chemotaxis and is essential for chemoattractant-mediated activation of guanylyl cyclase. EMBO (Eur. Mol. Biol. Organ.) J. 1997;16:4317–4332. doi: 10.1093/emboj/16.14.4317. [DOI] [PMC free article] [PubMed] [Google Scholar]
- Meili R., Ellsworth C., Lee S., Reddy T.B., Ma H., Firtel R.A. Chemoattractant-mediated transient activation and membrane localization of Akt/PKB is required for efficient chemotaxis to cAMP in Dictyostelium . EMBO (Eur. Mol. Biol. Organ.) J. 1999;18:2092–2105. doi: 10.1093/emboj/18.8.2092. [DOI] [PMC free article] [PubMed] [Google Scholar]
- Nellen, W., S. Datta, C. Reymond, A. Sivertsen, S. Mann, T. Crowley, and R.A. Firtel. 1987. Molecular biology in Dictyostelium: tools and applications. In Methods in Cell Biology. Vol. 28. Academic Press Inc., Orlando, FL. 67–100. [DOI] [PubMed]
- Parent C.A., Blacklock B.B., Froehlich W.F., Murphy D.B., Devreotes P.N. G protein signaling events are activated at the leading edge of chemotactic cells. Cell. 1998;95:81–91. doi: 10.1016/s0092-8674(00)81784-5. [DOI] [PubMed] [Google Scholar]
- Peracino B., Borleis J., Jin T., Westphal M., Schwartz J.M., Wu L., Bracco E., Gerisch G., Devreotes P., Bozzaro S. G protein β subunit–null mutants are impaired in phagocytosis and chemotaxis due to inappropriate regulation of the actin cytoskeleton. J. Cell Biol. 1998;141:1529–1537. doi: 10.1083/jcb.141.7.1529. [DOI] [PMC free article] [PubMed] [Google Scholar]
- Shelden E., Knecht D.A. Dictyostelium cell shape generation requires myosin II. Cell Motil. Cytoskeleton. 1996;35:59–67. doi: 10.1002/(SICI)1097-0169(1996)35:1<59::AID-CM5>3.0.CO;2-D. [DOI] [PubMed] [Google Scholar]
- Soll D.R. The use of computers in understanding how animal cells crawl. Int. Rev. Cytol. 1995;163:43–104. [PubMed] [Google Scholar]
- Soll D.R., Voss E. Two and three dimensional computer systems for analyzing how cells crawl. In: Soll D.R., Wessels D., editors. Motion Analysis of Living Cells. John Wiley & Sons Inc; New York: 1998. pp. 25–52. [Google Scholar]
- Spudich A. Molecular biology in Dictyosteliumtools and applications. In: Academic Press Inc, editor. Methods in Cell Biology. Vol. 28. Orlando, FL; 2: 1987. pp. 09–214. [DOI] [PubMed] [Google Scholar]
- Sussman, M. 1987. Molecular biology in Dictyostelium: tools and applications. In Methods in Cell Biology. Vol. 28. Academic Press Inc., Orlando, FL. 209–214. [DOI] [PubMed]
- Titus M., Wessels D., Spudich J., Soll D.R. The unconventional myosin encoded by the myo A gene plays a role in Dictyostelium motility. Mol. Biol. Cell. 1992;4:233–246. doi: 10.1091/mbc.4.2.233. [DOI] [PMC free article] [PubMed] [Google Scholar]
- van Es S., Devreotes P.N. Molecular basis of localized responses during chemotaxis in amoebae and leukocytes. Cell. Mol. Life Sci. 1999;55:1341–1351. doi: 10.1007/s000180050374. [DOI] [PMC free article] [PubMed] [Google Scholar]
- Varnum B., Edwards K., Soll D.R. Dictyostelium amoebae alter motility differently in response to increasing versus decreasing temporal gradients of cAMP. J. Cell Biol. 1985;101:1–5. doi: 10.1083/jcb.101.1.1. [DOI] [PMC free article] [PubMed] [Google Scholar]
- Varnum-Finney B., Voss E., Soll D.R. Frequency and orientation of pseudopod formation of Dictyostelium discoideum amoebae chemotaxing in a spatial gradientfurther evidence for a temporal mechanism. Cell Motil. Cytoskeleton. 1987;8:18–26. doi: 10.1002/cm.970080104. [DOI] [PubMed] [Google Scholar]
- Verhagen A.M., Ekert P.G., Pakusch M., Silke J., Connolly L.M., Reid G.E., Moritz R.L., Simpson R.J., Vaux D.L. Identification of DIABLO, a mammalian protein that promotes apoptosis by binding to and antagonizing IAP proteins. Cell. 2000;102:43–53. doi: 10.1016/s0092-8674(00)00009-x. [DOI] [PubMed] [Google Scholar]
- Wessels D., Soll D.R., Knecht D., Loomis W.F., DeLozanne A., Spudich J. Cell motility and chemotaxis in Dictyostelium amoebae lacking myosin heavy chain. Dev. Biol. 1988;128:164–177. doi: 10.1016/0012-1606(88)90279-5. [DOI] [PubMed] [Google Scholar]
- Wessels D., Murray J., Jung G., Hammer J., Soll D.R. Myosin IB null mutant of Dictyostelium exhibits abnormalities in motility. Cell Motil. Cytoskel. 1991;20:301–315. doi: 10.1002/cm.970200406. [DOI] [PubMed] [Google Scholar]
- Wessels D., Titus M., Soll D.R. A Dictyostelium myosin I plays a crucial role in regulating the frequency of pseudopods formed on the substratum. Cell Motil. Cytoskeleton. 1996;33:64–79. doi: 10.1002/(SICI)1097-0169(1996)33:1<64::AID-CM7>3.0.CO;2-I. [DOI] [PubMed] [Google Scholar]
- Wessels D., Zhang H., Reynolds J., Daniels K., Heid P., Liu S., Kuspa A., Shaulsky G., Loomis W.F., Soll D.R. The internal phosphodiesterase RegA is essential for the suppression of lateral pseudopod formation during Dictyostelium chemotaxis. Mol. Biol. Cell. 2000;11:2803–2820. doi: 10.1091/mbc.11.8.2803. [DOI] [PMC free article] [PubMed] [Google Scholar]
- Wu L., Valkema R., Van Haastert P.J., Devreotes P.N. The G protein beta subunit is essential for multiple responses to chemoattractants in Dictyostelium . J. Cell Biol. 1995;129:1667–1675. doi: 10.1083/jcb.129.6.1667. [DOI] [PMC free article] [PubMed] [Google Scholar]
- Zigmond S. The ability of polymorphonuclear leukocytes to orient in gradients of chemotactic factors. J. Cell Biol. 1977;89:606–616. doi: 10.1083/jcb.75.2.606. [DOI] [PMC free article] [PubMed] [Google Scholar]
Associated Data
This section collects any data citations, data availability statements, or supplementary materials included in this article.