Abstract
Indoleamine 2,3-dioxygenase (IDO), an enzyme involved in the catabolism of tryptophan, is expressed in certain cells and tissues, particularly in antigen-presenting cells of lymphoid organs and in the placenta. It was shown that IDO prevents rejection of the fetus during pregnancy, probably by inhibiting alloreactive T cells, and it was suggested that IDO-expression in antigen-presenting cells may control autoreactive immune responses. Degradation of tryptophan, an essential amino acid required for cell proliferation, was reported to be the mechanism of IDO-induced T cell suppression. Because we wanted to study the action of IDO-expressing dendritic cells (DCs) on allogeneic T cells, the human IDO gene was inserted into an adenoviral vector and expressed in DCs. Transgenic DCs decreased the concentration of tryptophan, increased the concentration of kynurenine, the main tryptophan metabolite, and suppressed allogeneic T cell proliferation in vitro. Kynurenine, 3-hydroxykynurenine, and 3-hydroxyanthranilic acid, but no other IDO-induced tryptophan metabolites, suppressed the T cell response, the suppressive effects being additive. T cells, once stopped in their proliferation, could not be restimulated. Inhibition of proliferation was likely due to T cell death because suppressive tryptophan catabolites exerted a cytotoxic action on CD3+ cells. This action preferentially affected activated T cells and increased gradually with exposure time. In addition to T cells, B and natural killer (NK) cells were also killed, whereas DCs were not affected. Our findings shed light on suppressive mechanisms mediated by DCs and provide an explanation for important biological processes in which IDO activity apparently is increased, such as protection of the fetus from rejection during pregnancy and possibly T cell death in HIV-infected patients.
Keywords: immunosuppression, immunoregulation, immunological tolerance, tryptophan, kynurenine
Introduction
Indoleamine 2,3-dioxygenase (IDO)*is the rate-limiting enzyme in the catabolism of tryptophan, expressed in a series of human and animal tissues, particularly in lymphoid organs and placenta (1–3). Apart from low level expression in healthy individuals, enzyme production markedly increases during infection or inflammation and can be induced by LPS, cytokines, or other agents (4–7). Low tryptophan concentrations, which may be induced by IDO, are associated with inhibited proliferation of viruses (8), protozoan parasites (9, 10), and other pathogens (11) in eukaryotic cells and also with decreased proliferation of tumor cells (12, 13). Based on these observations it has been postulated that the role of IDO in vivo is to inhibit the propagation of eukaryotic intracellular pathogens by depriving them of tryptophan.
Recent studies support the idea that, in addition to defense against pathogens, IDO participates in the regulation of T cell responses (14). It was speculated that expression of IDO in antigen presenting cells of the immune system may control autoreactive T cells (14). Munn et al. demonstrated that IDO expression in the placenta is critically involved in preventing rejection of allogeneic fetuses (15). It is well known that, from an immunological viewpoint, pregnancy constitutes a paradoxical situation in which a foreign tissue is tolerated by the host. Munn et al. implanted time-release capsules containing the IDO-inhibitor 1-methyl-tryptophan under the skin of pregnant mice and observed that the fetus was rejected. Hints at a participation of T cells in fetal rejection came from the same study, in which immunodeficient pregnant mice were reconstituted with T cells specific for paternal MHC antigens inherited by the fetus and thereafter treated with IDO inhibitor. Apparently, inhibition of IDO production in the placenta abrogated T cell control and the pregnant mice lost their concepti. Based on these observations, the authors proposed the following scenario: once the embryo implants and begins establishing connections with the mother's blood supply, fetal-derived cells located in the placenta start producing IDO, a process supported by experimental findings (16). The enzyme inhibits maternal T cells that otherwise would make their way through the placenta and attack the fetus. While it is clear that IDO suppresses the maternal T cell response, the exact mechanism by which the enzyme protects the allogeneic conceptus from maternal T cell attack has not been elucidated. It is known that IDO catabolizes tryptophan (2) and that tryptophan is an essential amino acid (the rarest of the 20 amino acids in proteins) indispensable for the biosynthesis of proteins. The in vitro studies of Mellor et al. reveal that T cells are specifically sensitive to tryptophan deprivation (3, 14). At low tryptophan concentrations, cell cycle progression was halted at a mid-G1 arrest point (14). Restoration of tryptophan to arrested cells, along with a second round of T cell receptor signaling, abrogated the state of areactivity and induced further cell cycle progression. These and other observations lead to the hypothesis that the main mechanism by which IDO inhibits cell proliferation is the depletion of tryptophan.
In the current series of experiments, we constructed recombinant replication-defective adenoviruses harboring the human IDO gene, expressed the gene in human DCs and showed that such cells are capable of preventing proliferation of allogeneic T cells in vitro. Thereafter, we analyzed the mechanism of inhibition and, in contrast to previous studies, obtained conclusive evidence for a mediation of suppression by IDO-induced tryptophan metabolites.
Materials and Methods
Construction of Replication-defective Recombinant IDO-Adenoviruses.
Replication-defective adenoviruses were generated by encoding cDNA for human IDO according to a method described previously (17). The human IDO gene was inserted into a shuttle plasmid (pAdTrack-CMV, harboring the green fluorescence protein gene, or pShuttle-CMV, without the GFP gene) (Q-Biogene). The resultant plasmid was linearized by digestion with restriction endonuclease PmeI and subsequently cotransformed with an adeno-5 virus backbone (pAdEasy-1) into Escherichia coli cells BJ5183. Recombinants were selected for kanamycin resistance, and recombination confirmed by restriction digest with PacI. The relevant clones yielded a large fragment (near 30 kb), plus a smaller fragment (3.0 or 4.5 kb). Finally, the linearized recombinant IDO plasmid was transfected by Effectene Transfection Reagent kit (QIAGEN) into adenovirus packaging cells (911 cells = E1-transformed human embryonic retinoblast cell line) at 50% confluency. In case of pAdTrack-based vectors, transfection and viral production can be monitored by GFP expression. When a cytopathogenic effect becomes evident (usually 7–10 d after transfection), the cells are scraped off, repeatedly dounced, and centrifuged. Part of the supernatant is used for further multiplication of viruses. The viruses were purified via ultracentrifugation on CsCl-gradient, rebuffered in conservation buffer, titrated, and kept at –80°C until use. Titration was performed by limiting dilution of viral suspension on 911 cells. The last “infective concentration” was determined by checking the GFP expression, in case of pAdTrack-CMV constructs, or by PCR with adenoviral-specific primers, in case of pShuttle-CMV constructs. Two recombinant vectors were generated, IDO-adeno-GFP (with the GFP gene) and IDO-adeno (without GFP). The nucleotide IDO sequence of recombinant adenoviruses was determined using the dideoxy termination method of Sanger. Sequence analysis was performed in an ABI-3077 sequencer (Applied Biosystems) and identity with the sequence of the gene bank was ascertained. Transcription of the IDO gene in transfected eukaryotic cells was verified by RT-PCR. In brief, mRNA was extracted from IDO-adeno-infected 911 cells (QuickPrep Micro mRNA Purification kit; Amersham Biosciences Europe), transcribed with Moloney virus leukemia reverse transcriptase into cDNA (Ready-to-go-Primed First-Strand kit; Amersham Biosciences Europe), and amplified by PCR with IDO-specific primers. PCR products were analyzed by agarose gel electrophoresis with ethidium bromide staining.
Generation of Human Dendritic Cells.
Dendritic cells (DCs) were generated from CD14-positive blood monocytes as described previously (18). In brief, peripheral blood mononuclear cells of an HLA-typed healthy donor were separated by density gradient centrifugation and CD14-positive monocytes were isolated by adherence to culture dishes. Nonadherent cells were discarded. After culture of monocytes in the presence of human rGM-CSF (666 U/ml) and rIL-4 (1,000 U/ml) for 7 d, rTNF-α (10 ng/ml) was added for an additional 2 d to induce maturation of DCs. Characterization of DC phenotype was performed by flow cytometry using the following mouse mAbs: anti–CD14-FITC; anti–HLA-DR-FITC; anti–CD1a-PE; anti–CD86-PE; and anti–CD83-PE (BD Biosciences). DCs were kept in liquid nitrogen until use.
Separation of Lymphocyte Subpopulations.
Cells were separated by negative selection via magnetic beads. Lymphocytes (PBMCs) were obtained from blood of healthy donors by density gradient centrifugation, washed, and incubated at +4°C for 10 min with monoclonal mouse antibody mixes directed against lymphocyte subpopulations (107 cells plus 20 μM antibody mix). Thereafter, the cells were washed and incubated at +4°C, for 10 min with 50 μl magnetic beads coated with Fc-specific antibodies (Dynabeads; Dynal). Antibody-labeled cells were removed with a magnet. To increase the purity of the remaining lymphocyte subpopulation, the procedure was repeated with another portion of magnetic beads. The purity of negatively selected cells was for 85–90% T cells, 70–80% NK cells, and 90% B cells.
Cell Cultures.
(a) Allogeneic T cell proliferation. DCs were infected with recombinant IDO-adeno-GFP (DC-IDO-GFP), IDO-adeno (DC-IDO), or with control adenoviruses (DC-adeno) at a multiplicity of infection (MOI) up to 500 for 2 d. Lymphocytes (PBMCs) were separated from peripheral blood of healthy donors by density gradient centrifugation and typed for HLA antigens. Only HLA-DR-different responder lymphocytes were used for DC-induced stimulation. Native DCs only, lymphocytes only, native DCs plus allogeneic lymphocytes, DC-IDO-GFP plus allogeneic lymphoytes, DC-IDO plus allogeneic lymphoytes, DC-adeno plus allogeneic lymphocytes (each time 105 DC plus 105 lymphocytes in 0.2 ml medium) were cultured in RPMI 1640 medium (GIBCO BRL Life Technologies GmbH) with 10% FCS (final tryptophan concentration 5.25 mg/l = 25.69 μM) and Penicillin G/Streptomycin. After 5 d, 3[H]thymidine was added for 12 h and the number of counts (counts per minute = cpm) determined in a β-counter (Inotech Biosystems).
To verify whether IDO expression or adenovirus infection harm the DCs, 105 cells were infected with IDO-adeno-GFP, IDO-adenovirus, or adenovirus only at a stepwise decreasing MOI (500, 250, 125 … 3.9) and cell viability was measured in FACS® after double staining with 7 amino actinomycin D (7-AAD) and anti-CD83 antibody-PE. The percentage of dead cells never exceeded 30% for any MOI after IDO-adeno-GFP- or IDO-adeno-infection and 40% after adenovirus (control)-infection. Moreover, these values were not higher than native DCs cultured for the same period of time. The experiment was repeated using ethidium bromide or Trypan's blue staining with virtually the same result. These findings show that neither IDO-expression nor adenovirus infection harm DCs under the described conditions.
(b) CD3 stimulation of T cells. Peripheral blood lymphocytes were cultured (105 cells per well) in RPMI 1640 (10% FCS) with anti-CD3 mAb (Ortho Diagnostic Systems, Inc.) (final dilution 1:200). After 2 d, cell proliferation was assessed by measuring 3[H]thymidine incorporation (cpm) as described previously.
(c) Tryptophan metabolite titration curves. Kynurenine, 3-hydroxykynurenine, anthranilic acid, 3-hydroxyanthranilic acid, and quinolinic acid (Sigma-Aldrich) (for all substances purity > 98%) were dissolved in RPMI 1640 and added to cell cultures at various concentrations. In an other experiment, to determine whether the metabolites have an additive effect, equal concentrations of the compounds were mixed and added to the cultures. After 2 d, 3[H]thymidine was added and the number of counts recorded. Positive controls consisted of CD3-stimulated cells without metabolites and negative controls of unstimulated cells.
(d) Restimulation of suppressed T cells. Lymphocytes (105 cells per well) were cultured in RPMI 1640 (10% FCS) with anti-CD3 mAb (final dilution 1:200) and kynurenine (dilution series). After 2 d the cells were washed, the cell culture medium (RPMI 1640 plus 10% FCS) was replaced, and the cells were stimulated with Concanavalin A (6.25 μg per well). After another 2 d, 3[H]thymidine was added and cpm determined. Controls consisted of cells prestimulated with anti-CD3 but not pretreated with kynurenine.
In an other restimulation experiment lymphocytes were stimulated with allogeneic DCs as described previously, in the presence (47–1,500 μM) or absence of kynurenine. Control cultures contained DCs or lymphocytes only. After 5 d the cells were extensively washed, and restimulated with an identical number of DCs derived from the same donor or from third party donors. 3[H]thymidine was added to all cultures and the number of counts (cpm) determined.
(e) Tryptophan titration curve. To define the concentration of tryptophan which reduces lymphocyte proliferation in our test system, 105 lymphocytes were incubated in tryptophan-free RPMI 1640 medium (GIBCO BRL Life Technologies) with or without 10% FCS, stimulated with anti-CD3 mAb, and various amounts (0–38 μM) of tryptophan were added. Unimpaired proliferation was observed down to 0.30 μM (medium with FCS) and 1.20 μM (without FCS). Complete inhibition was not obtained at any concentration (positive control 100% proliferation; maximal suppression in medium with FCS: ∼66% and without FCS: ∼33%). All cell cultures were done in triplicate.
Determination of Tryptophan and Kynurenine Concentration in Cell Cultures.
Native DCs (control), DC-IDO-GFP, DC-IDO, or DC-adeno (control) were cultured under conditions described above and tryptophan and kynurenine were measured at the end of culture. 20 μl supernatant was collected and the tryptophan concentration was defined using reversed-phase high pressure liquid chromatography (RP18 Hypersil ODS column) (Supelco, Inc.) and photometric detection (fluorescence at 278/363 nm). In another test the cells were lysed, centrifuged, and the kynurenine concentration was measured in the supernatant spectrophotometrically (19). In brief, 75 μl supernatant was incubated with 125 μl methylene blue reaction buffer for 1 h at 37°C, and the reaction was stopped with 30% trichloroacetic acid. After centrifugation, 125 μl supernatant was incubated with 125 μl Ehrlich reagent for 10 min at room temperature in a microtiter plate. Optical density was measured at 480 nm. The values were referred to a standard curve with defined kynurenine (0–120 μM) concentrations.
Detection of Cell Death.
Lymphocytes were stimulated in culture with anti-CD3 mAbs (described above) in the presence or absence (control) of 1,501 μM kynurenine, 510 μM 3-hydroxyanthranilic acid, 348 μM 3-hydroxykynurenine, or metabolite mixture (64 μM kynurenine plus 64 μM 3-hydroxykynurenine plus 64 μM anthranilic acid plus 64 μM 3-hydroxyanthranilic acid plus 64 μM quinolinic acid). After 3 d the cells were washed and resuspended in PBS (106 cells/ml). Thereafter, the cells (100 μl suspension) were labeled with anti-CD3-FITC antibody (3 μl), stained with 5 μl 7-AAD for 15 min, and the percentage of 7-AAD-positive (dead) T cells was determined in a FACScan™. In an other experiment T cells, B cells, NK cells, or DCs were separated from PBMCs by magnetic beads or generated as described and cultured (5 × 10⁵ cells/ml) with a mixture of kynurenine metabolites (kynurenine plus 3-hydroxykynurenine plus anthranilic acid plus 3-hydroxyanthranilic acid plus quinolinic acid) (8, 16, or 32 μM, respectively for each compound). In one setting T cells were activated with anti-CD3 antibody. Cell death was measured daily for 5 d by 7-AAD staining and expressed in percentage of dead cells.
Statistics.
All tests were performed in triplicate and results are given as mean ± SD. For calculating half-inhibitory (I50) concentrations of substances, the mean proliferation (cpm) of stimulated and completely suppressed cells was determined. Thereafter, the concentration of substance giving 50% proliferation was calculated by regression.
Results
IDO-Gene Expression in Human DCs.
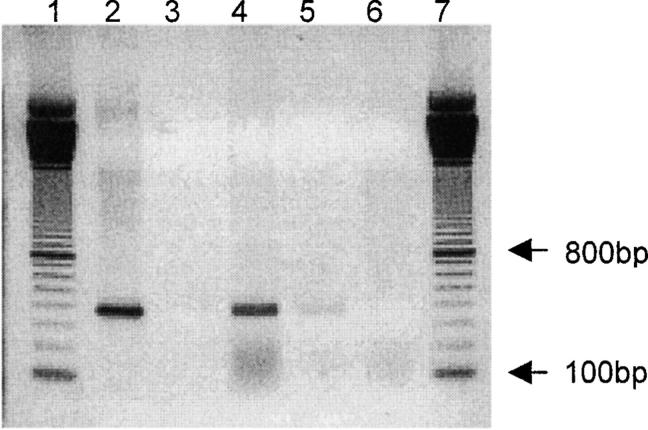
Human IDO cDNA was inserted into a shuttle vector and recombined with an adeno-5 backbone vector in bacteria as described previously (17, 20). The replication-defective recombinant IDO adenoviruses were multiplied in 911 cells. Sequence analyses confirmed the correct sequence of human IDO (unpublished data) and RT-PCR with IDO-specific primers proved the transcription of IDO transgene in eukaryotic cells infected with recombinant adenoviruses (Fig. 1) .
Figure 1.
Transcription of IDO-gene in eukaryotic cells infected with recombinant IDO-adenoviruses. mRNA was extracted from human embryonic retinoblast cells infected with IDO-adeno-GFP, IDO-adeno, or with replication-defective adenoviruses (neg. ctr.-a) and reverse transcribed into cDNA. PCR with IDO-specific primers was performed and the products analyzed by agarose gel electrophoresis. Positive control consisted of material extracted from recombinant IDO-adenoviruses and neg. ctr.-b of water instead of template. Lane 1: DNA molecular weight marker; lane 2: pos. ctr., 3, neg. ctr.-b; lane: 4, IDO-adeno-GFP; lane 5: IDO-adeno; lane 6: neg. ctr.-a; lane 7: DNA molecular weight marker. Lanes 4 and 5 show the relevant IDO-specific bands.
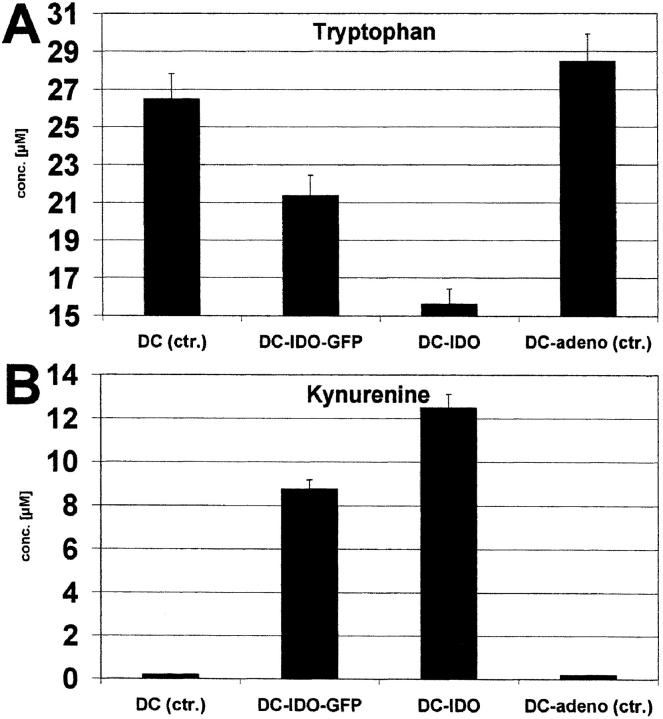
DCs were generated from blood monocytes in the presence of GM-CSF and IL-4, maturation was induced by TNF-α, and the phenotype was verified by FACS® analysis (18). These cells were infected with the recombinant IDO-adenoviruses. The efficiency of infection was monitored by expression of the green fluorescence marker protein harbored by the virus. Vital staining using FACS® analysis showed that DCs remained viable after adenoviral infection. It is known that IDO catalyzes the oxidation of tryptophan, resulting in kynurenine and other metabolites (21–23). To verify whether transgenic IDO exerted its catabolic effect, tryptophan as well as kynurenine were measured in cultures of DCs infected with IDO-adeno (Fig. 2, A and B) . As expected, the tryptophan concentration significantly decreased while kynurenine increased.
Figure 2.
Tryptophan and kynurenine concentration in cultures of IDO-expressing DCs. Native DCs (control), DCs infected with IDO-adeno-GFP, IDO-adeno, or native replication-defective adenoviruses (control) were cultured in RPMI 1640 plus 10% FCS. Tryptophan (A) and kynurenine (B) concentrations were determined and the values (μM/105 cells) are shown on the ordinate.
IDO-expressing DCs Reduce Allogeneic T Cell Proliferation.
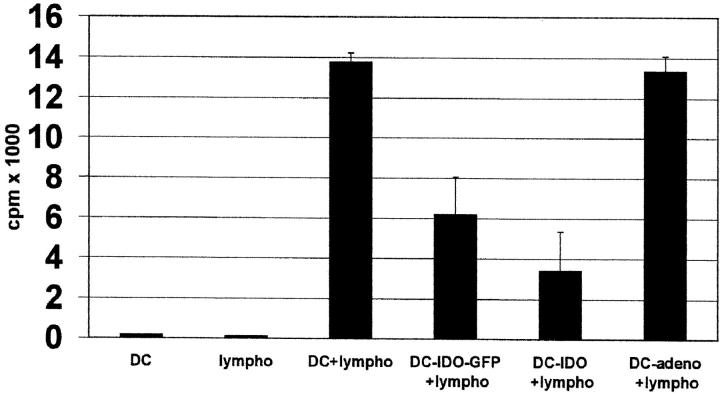
The next experiment addressed the question whether IDO-expressing DCs inhibit the proliferation of HLA-incompatible T cells. Native DCs or IDO-expressing DCs were coincubated with allogeneic T cells and proliferation was determined by 3[H]thymidine incorporation. A significant reduction of proliferation was noted by coincubating T cells with IDO-DCs (Fig. 3) , demonstrating the inhibitory effect of IDO on allogeneic T cells.
Figure 3.
Reduction of allogeneic T cell stimulation by IDO-expressing DCs. Native DCs (pos. ctr.), DCs infected with IDO-adeno-GFP, IDO-adeno, or replication-defective adenoviruses (control) were coincubated with allogeneic peripheral blood lymphocytes for 6 d and cell proliferation measured by 3[H]thymidine incorporation (cpm) (ordinate). Negative controls consisted of DCs or lymphocytes only.
Kynurenine Inhibits T Cell Proliferation.
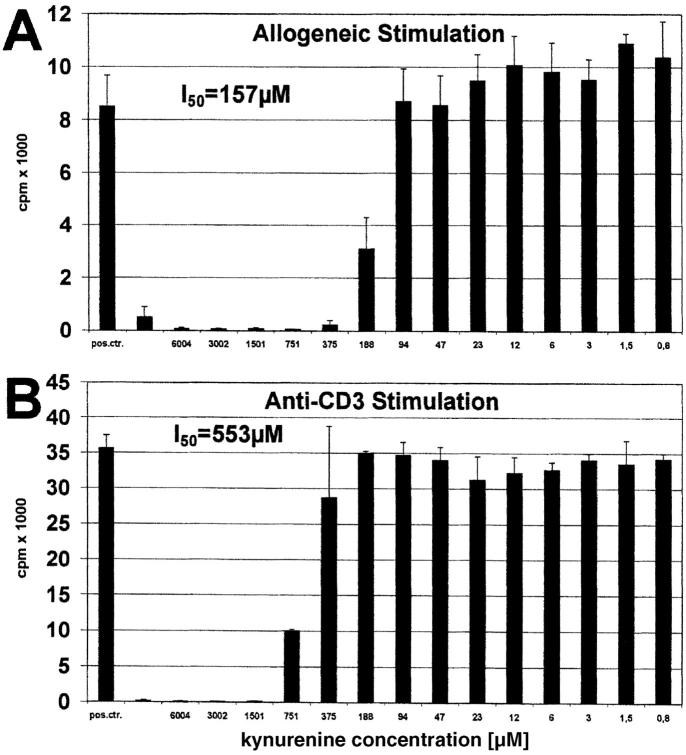
Previous studies came to the conclusion that tryptophan depletion is the mechanism by which IDO inhibits T cell activation (3, 14). An alternative mechanism would be that metabolites resulting from tryptophan breakdown influence T cell responsiveness. IDO-induced tryptophan degradation results in kynurenine, 3-hydroxykynurenine, anthranilic acid, 3-hydroxyanthranilic acid, and quinolinic acid (21–23), whereby kynurenine is the main product. Therefore, we first tested the influence of kynurenine on the allogeneic T cell response. As shown in Fig. 4 A, l-kynurenine was able to completely inhibit the proliferation of T cells stimulated by allogeneic DCs (50% inhibition = I50: 157 μM). Moreover, l-kynurenine also suppressed proliferation of CD3-stimulated T cells (I50: 553 μM) (Fig. 4 B). The same effect was noted with D-kynurenine (unpublished data).
Figure 4.
Effect of kynurenine on T cell proliferation induced by allogeneic DCs or anti-CD3 antibody. Peripheral lymphocytes were stimulated with (A) allogeneic DCs or (B) anti-CD3 mAb for 6 and 3 d, respectively. Various amounts of kynurenine (abscissa) were added to the cultures. Positive control was performed without kynurenine. T cell proliferation was determined by 3[H]thymidine incorporation (cpm) (ordinate).
Kynurenine-suppressed T Cells Cannot Be Restimulated.
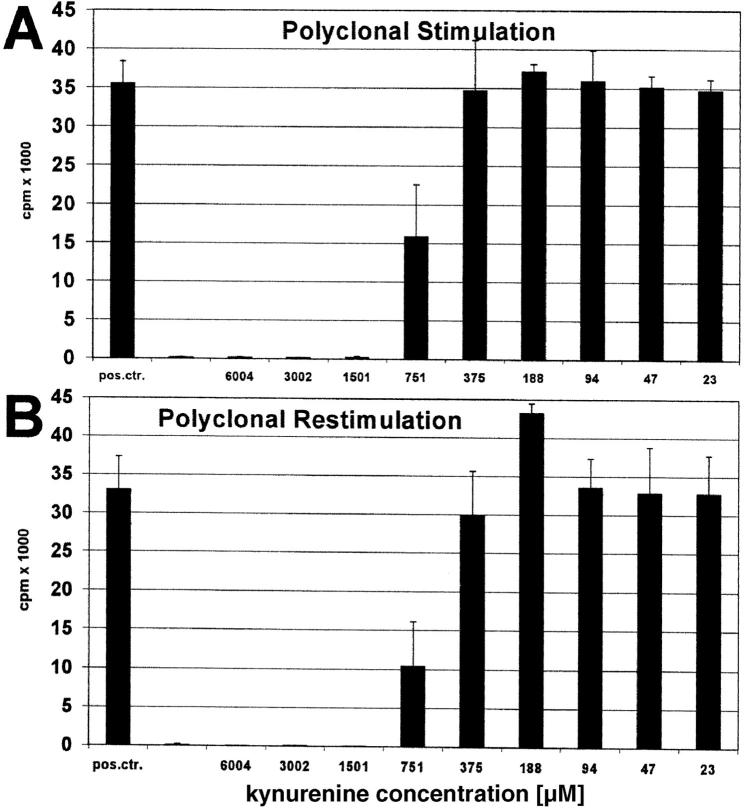
In the experiment depicted in Fig. 5, A and B, T cells were stimulated with anti-CD3 antibody in the presence of various amounts of kynurenine, extensively washed, and restimulated with Con-A in the absence of kynurenine. The results show that kynurenine-suppressed T cells cannot be restimulated.
Figure 5.
Polyclonal restimulation of kynurenine-suppressed T cells. Peripheral lymphocytes were stimulated with (A) anti-CD3 mAb in the presence of various amounts of kynurenine (abscissa). Positive control consisted of T cell stimulation in the absence of kynurenine. After 2 d the cells were washed and (B) restimulated with Con-A for another 3 d. T cell proliferation was determined by 3[H]thymidine incorporation (cpm) (ordinate).
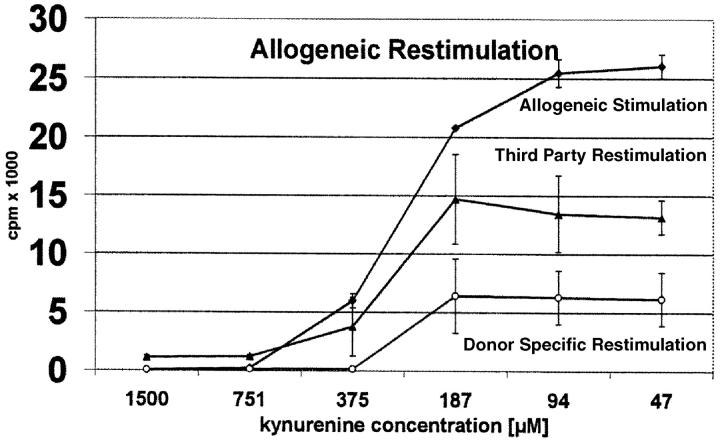
In a second experiment we addressed the question whether T cells stimulated with allogeneic DCs in the presence of kynurenine can be restimulated with donor-specific or third party DCs (Fig. 6) . As expected, T cells directed against a certain donor, once suppressed cannot be restimulated with DCs from the same donor (Fig. 6, top and bottom curve at 1,500, 751, and 375 μM). Third-party DCs, however, are able to restimulate the T cells (medium curve). The degree of restimulation by third-party donors depends on the dose of kynurenine to which the cells were exposed. At extremely high doses (1,500 or 750 μM) only minimal reactions was noted, whereas at medium or low doses (375–47 μM) significant restimulation takes place. Most importantly, at any kynurenine concentration, third-party restimulation (medium curve) was significantly higher than donor-specific restimulation (bottom curve). This finding suggests that kynurenine preferentially compromises activated T cells. As we will see later (Fig. 10, A and B) , this was confirmed by further analyses.
Figure 6.
Allogeneic restimulation of T cells activated with allogeneic DCs. Peripheral blood lymphocytes were stimulated with allogeneic DCs in the presence of decreasing amounts of kynurenine (abscissa). After 5 d the cells were extensively washed and restimulated with DCs from the same or unrelated donors. T cell proliferation was measured by 3[H]thymidine incorporation (cpm) (ordinate) after primary and secondary stimulation. The curves show the degree of proliferation after the first stimulation (top curve) and upon restimulation with third-party (intermediate) or donor-specific DCs (bottom curve).
Figure 10.
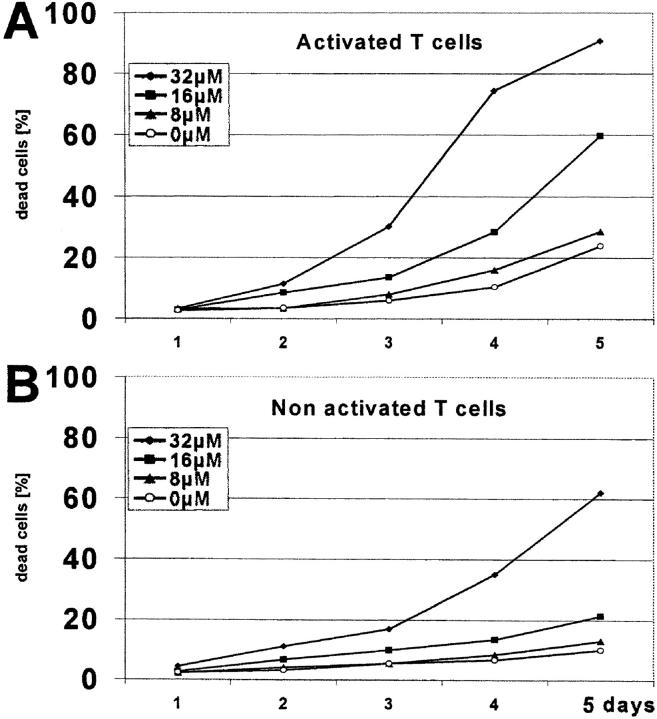
Time dependency of cytotoxicity and preferential killing of activated T cells. T cells were separated from PBMCs using magnetic beads and kept in culture (A) with anti-CD3 antibody or (B) without anti-CD3 antibody, in the presence of a mixture of tryptophan metabolites (kynurenine plus 3-hydroxykynurenine plus anthranilic acid plus 3-hydroxyanthranilic acid plus quinolinic acid) (concentrations: 0, 8, 16, 32 μM for each compound). The percentage of dead cells (ordinate) was measured every day (abscissa) by 7-AAD staining.
Other Tryptophan Metabolites Also Suppress the T Cell Response.
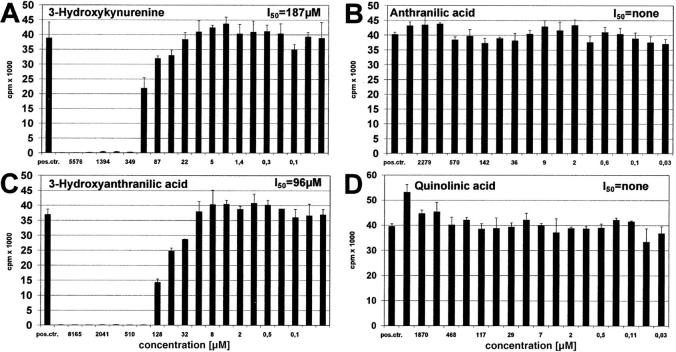
The question arose whether, in addition to kynurenine, other tryptophan metabolites also inhibit T cell proliferation. As shown in Fig. 7, A–D, 3 -hydroxykynurenine and 3-hydroxyanthranilic acid both suppress T cells, whereas anthranilic and quinolinic acid were not suppressive within the tested range of concentrations. In order of their effectiveness, the T cell active components of tryptophan catabolism were: 3-hydroxyanthranilic acid (I50: 96 μM), 3-hydroxykynurenine (I50 = 187 μM), and kynurenine (I50 = 553 μM).
Tryptophan Metabolites Have an Additive Effect on T Cells.
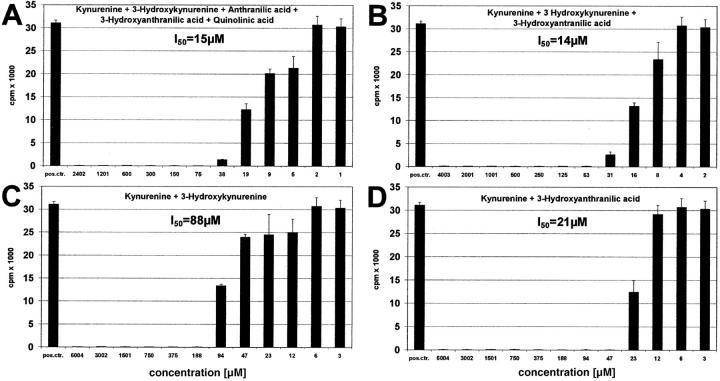
In vivo as well as in cell cultures, none of the tryptophan metabolites acts as a single component but in the presence of other metabolites. This prompted us to analyze the effect of metabolite mixtures. Fig. 8 A shows the action of kynurenine in combination with all other metabolites. It is evident that much smaller concentrations of kynurenine are required when combined with equal amounts of the other compounds (in combination: I50 = 15 μM, as single substance: I50 = 553 μM; Fig. 4 B). Even the combination of three or two active components enhances the effect of single substances (Fig. 8, B–D). For instance, whereas kynurenine is effective at 553 μM (Fig. 4 B) and 3-hydroxyanthranilic acid at 96 μM (Fig. 7 C) as single components, when combined (Fig. 8 D), 21 μM of each substance is sufficient to induce the same effect. Other combinations showed similar results, indicating that the metabolites add or even potentiate their respective effects.
Figure 8.
Additive effect of tryptophan metabolites. Peripheral lymphocytes were stimulated with anti-CD3 antibody for 3 d and decreasing amounts of (A) kynurenine plus 3-hydroxykynurenine plus anthranilic acid plus 3-hydroxyanthranilic acid plus quinolinic acid, (B) kynurenine plus 3-hydroxykynurenine plus 3-hydroxyanthranilic acid, (C) kynurenine plus 3-hydroxykynurenine, (D) kynurenine plus 3-hydroxyanthranilic acid were added. All components of a mixture were added in equal amounts. The concentration of single substances is shown (abscissa).
Figure 7.
Effect of IDO-induced tryptophan metabolites on T cell proliferation. Peripheral lymphocytes were stimulated with anti-CD3 antibody for 3 d in the presence of various amounts (abscissa) of (A) 3-hydroxykynurenine, (B) anthranilic acid, (C) 3-hydroxyanthranilic acid, or (D) quinolinic acid. Positive control consisted of T cell stimulation in the absence of metabolites. T cell proliferation was determined by 3[H]thymidine incorporation (cpm) (ordinate).
Kynurenine, 3-Hydroxykynurenine, 3-Hydroxyanthranilic Acid, and the Metabolite Mixture Induce T Cell Death.
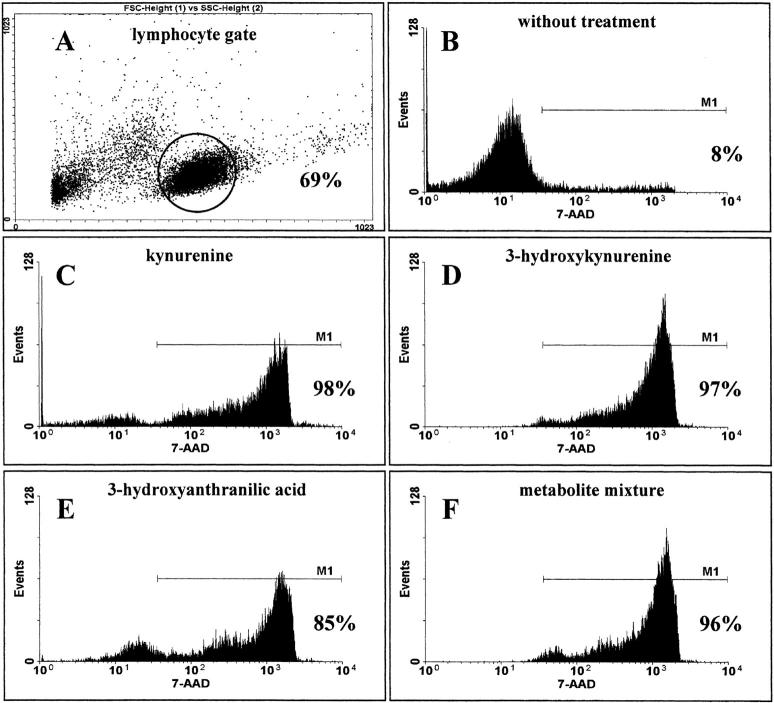
The lack of restimulation of kynurenine-suppressed T cells might be attributable to either T cell areactivity or cell death. To analyze the underlying mechanism, the cells were stimulated as described in the presence of suppressive amounts of kynurenine, 3-hydroxykynurenine, 3-hydroxyanthranilic acid, or a mixture of all metabolites for 3 d, and cell viability was determined in FACS® by vital staining with 7-AAD. As shown in Fig. 9 , virtually all cells died at suppressive concentrations of single components or the metabolite mixture.
Figure 9.
Induction of cell death by tryptophan metabolites. Lymphocytes were stimulated with anti-CD3 in the presence or absence (control) of active metabolites (1,501 μM kynurenine, 349 μM 3-hydroxykynurenine, 510 μM 3-hydroxyanthranilic acid) or a metabolite mixture (kynurenine plus 3-hydroxykynurenine plus anthranilic acid plus 3-hydroxyanthranilic acid plus quinolinic acid)(64 μM of each compound). After 3 d the cells were washed, stained with anti-CD3-FITC antibody and 7-AAD. The percentages of dead (7-AAD-positive) T cells was determined in FACScan™. A shows the lymphocyte gate. B–F show the percentage of dead cells in the negative control and after treatment with kynurenine, 3-hydroxyanthranilic acid, 3-hydroxykynurenine, or metabolite mixture.
Tryptophan Metabolites Have a Time-dependent Cytotoxic Effect.
In contrast to cell cultures, the exposure of lymphocytes to kynurenine derivatives “in vivo” is long-lasting. If the cytotoxic effect increases with time, even small amounts of metabolites may be effective. To test whether cytotoxicity is time dependent, purified T cells were incubated for 5 d with various amounts of tryptophan metabolites and the percentage of dead cells was determined daily (Fig. 10). The findings clearly show that the cytotoxic effect is time dependent and that even small amounts of substances become cytotoxic after an exposure time of several days. As shown in Fig. 11, B and C , this is also the case for B and NK cells.
Figure 11.
Sensitivity of T, B, NK cells and DCs to tryptophan metabolites. T, B, and NK cells were separated from PBMCs and DCs were generated as described previously. The cells were incubated with a metabolite mixture (kynurenine plus 3-hydroxykynurenine plus anthranilic acid plus 3-hydroxyanthranilic acid plus quinolinic acid) (concentrations: 0, 8, 16, 32 μM for each metabolite). The percentage of dead cells (ordinate) was measured by 7-AAD-staining every day (abscissa).
Tryptophan Metabolites Preferentially Kill Activated T Cells.
An important question is whether activated T cells are more susceptible to cell death than resting ones. Fig. 10, A and B, shows the metabolites' action on activated versus nonactivated T cells. Evidently, activated cells are more sensitive. For instance, whereas 16 μM metabolite mixture killed 60% activated T cells, it affected only 21% nonactivated cells after 5 d of culture.
Tryptophan Metabolites Act on Several Lymphocyte Subpopulations.
In the experiment depicted in Fig. 11, A–D, the effect of tryptophan metabolites on lymphocyte subpopulations was analyzed. T, B, and NK cells were separated by magnetic beads from PBMCs and incubated for 5 d with various amounts of metabolite mixture. The results show that all three subpopulations are sensitive to these compounds. Interestingly, DCs, the cells which produce the IDO and thus generate kynurenine, are resistant to cell death. This is in line with our observations showing that IDO-adenovirus-transfected DCs are not harmed more than mock-transfected or untreated cells (Materials and Methods).
Discussion
In their study, Moffett et al. attempted to detect IDO activity at the single-cell level based on immunohistological staining of quinolinic acid, which is the terminal metabolite of the enzymatic pathway initiated by IDO (24). Their findings indicated that IDO-producing cells are distributed in lymphoid tissues and sporadically in other tissues, and have a macrophage- or DC-like appearance (3, 24). Recent evidence for expression of IDO in DCs came from the work of Hwu et al. who induced IDO production in human DCs by stimulation with IFN-γ and CD40 ligand (25). Although it is generally known that DCs are potent activators of T cells, they may also play a pivotal role in the induction of peripheral tolerance (26). Because IDO is known to reduce T cell proliferation, it is tempting to speculate that IDO-expressing DCs have suppressive properties. In their studies, Hwu et al. (25) inhibited the proliferation of OKT3-stimulated autologous T cells with IDO-producing DCs. In another study, stimulation of CD8α+ DCs with IFN-γ, which is known to promote IDO production, enhanced their tolerogenic activity toward CD4 T cells (27). These as well as similar findings obtained with macrophages (14) fostered the hypothesis that expression of IDO in antigen-presenting cells confers the ability to suppress “unwanted” T cells, particularly autoreactive ones (14, 25), and thereby contributes to peripheral tolerance against self-antigens. Indirect proof for the role of IDO in suppression of alloreactive T cells was obtained by Munn et al. (15) who showed that inhibition of IDO resulted in rejection of the fetus in pregnant mice. In the current series of experiments, we present a model for studying the effect of IDO on allogeneic T cells by transgenetically expressing the IDO gene in human DCs and coincubating these cells with allogeneic T cells. IDO-expressing DCs reduced tryptophan, increased kynurenine, and (as expected) suppressed the proliferation of allogeneic T cells.
Munn et al. (3, 14) found that IDO-expressing macrophages catabolize virtually the entire amount of tryptophan in a cell culture system comparable to ours. Although in the experiment presented herein IDO-expressing DCs decreased the tryptophan concentration from a mean of 25.73 μM to a mean of 15.64 μM, it should be mentioned that variations down to unmeasurable tryptophan concentrations were noted in other cell cultures, a phenomenon obviously due to different activities of the IDO gene. Such very low tryptophan concentrations can impair T cell proliferation. However, we also noted T cell suppression at measurable tryptophan concentrations, provided that IDO was expressed in DCs. According to the tryptophan titration curve, such “measurable” concentrations are not low enough to impair T cell proliferation. This latter observation argues against tryptophan deficiency being the only factor responsible for suppressed T cell proliferation in our cell cultures. For tryptophan deficiency as a mechanism responsible for IDO-induced T cell suppression in vivo, it must be postulated that concentrations <0.5–1 μM (14) are generated and maintained for a longer time in certain microenvironments. Since plasma levels are in the range of 50–100 μM and never reach such low concentrations, and since the diffusion of tryptophan into tissues evidently is faster than the local degradation rate, this proposed mechanism appears questionable (14, 22, 28).
Surprisingly, in contrast to previous speculations (3), we found that kynurenine suppresses the T cell response. Inhibitory concentrations in the kynurenine titration experiments were 157–553 μM, which was strikingly higher than the 12.5 μM average concentration found in our cultures of IDO-expressing DCs. Therefore, at the first glance, kynurenine did not provide a plausible explanation for T cell suppression by IDO-expressing DCs. However, it is well known that besides kynurenine, IDO-induced degradation of tryptophan results in additional catabolites. Consequently, kynurenine does not act alone but in the presence of other metabolites. As shown by our experiments, 3-hydroxykynurenine and 3-hydroxyanthranilic acid are also T cell suppressive and have an additive effect when mixed with kynurenine. When 15 μM kynurenine, a concentration which does not result in any T cell suppression by itself, acts in concert with the same amounts of all other metabolites (or 3-hydroxykynurenine and 3-hydroxyanthranilic acid only), the combined activity suppresses the T cell response. It should also be mentioned that Grohmann et al. (29) found considerably higher kynurenine concentrations in their IFN-γ–stimulated CD8α+ DC cultures than those noted by us.
Of course, it is difficult to extrapolate from observations in cell cultures to conditions in vivo. The question must be posed, however, whether the inhibitory kynurenine concentrations found in our study are comparable to those present in vivo. Normal serum kynurenine concentrations in humans range from 1 to 3 μM (22). This is far below the inhibitory levels observed in our experiments, a finding which is not surprising because under normal conditions blood lymphocytes are not suppressed. Low blood levels, however, do not exclude the existence of high levels of kynurenine and its derivatives at defined sites in the body. It is known that IDO production in tissues is limited to certain cells (3). During pregnancy, for instance, IDO is expressed in the placenta and creates a site of local immunosuppression toward fetal tissue (15), although pregnant women are not generally immunosuppressed and their serum shows no change in kynurenine concentrations (28). In one study, quinolinic acid, the terminal kynurenine metabolite, was measured in the brain and blood of HIV-infected patients. In brain, this metabolite was elevated >300-fold. There were no significant correlations, however, between serum quinolinic acid levels and those in cerebrospinal fluid or brain parenchyma (30). Evidently, the serum does not necessarily reflect the concentrations at the site of production. On the other hand, under certain circumstances, kynurenine metabolites may dramatically increase even in serum or urine. Cancer patients, for instance, treated with IFN type I or type II, a cytokine which induces IDO, have decreased serum tryptophan levels and 5–500-fold increased urinary kynurenine metabolite concentrations (31). Serum of AIDS patients showed 37-fold higher quinolinic acid levels than serum of healthy controls (30). In experiments in sheep, a species known to have kynurenine concentrations comparable to those of humans, tryptophan loading resulted in increased plasma concentration of 118 ± 79.7 μM kynurenine in pregnant as well as in nonpregnant animals, whereas the concentration reached an even higher peak (247.9 ± 86.7 μM) in fetal plasma (32). These levels are in the range found to be suppressive in our cell cultures and suggest that, under certain circumstances, T cell inhibitory kynurenine concentrations can be achieved in vivo. Two important points must be considered when comparing in vitro kynurenine data with conditions in vivo. First, our findings show that not only kynurenine but other metabolites too, namely 3-hydroxykynurenine and 3-hydroxyanthranilic acid, suppress the T cell response. Interestingly, in studies concerning the neurotoxic effect of tryptophan metabolites it was shown that these compounds have an additive effect (33, 34). Our data show that the T cell suppressive effect of several tryptophan metabolites is additive in vitro. If this phenomenon also applies to conditions in vivo, relatively low kynurenine concentrations may be sufficient for suppression of the T cell response. Second, in the same series of experiments dealing with the toxic effect of tryptophan metabolites on nerve cells, it was shown that the neurotoxic threshold of 3-hydroxykynurenine significantly decreased by prolonging the exposure time (33). This finding fits with our observation that the tryptophan metabolite mixture significantly increases its cytotoxic effect on lymphocytes with every additional day of incubation. Under in vivo conditions, such as AIDS, pregnancy, etc., the exposure time is obviously longer than the duration of cell cultures used in the present study and lower kynurenine concentrations might therefore be effective.
Our experiments indicate that the mechanism of T cell suppression by kynurenine and some of its derivatives is cell death. This explains the lack of restimulation of kynurenine-suppressed T cells. Interestingly, it was shown (35) that macrophages, cells belonging to the IDO-expressing subpopulation (14, 24, 25), can promote apoptosis of peripheral blood T cells. Moreover, treatment of DCs with IFN-γ increases their IDO activity and confers tolerogenic properties apparently by initiating apoptosis of antigen-specific CD4 cells (27, 29, 36, 37). Our findings suggest that the latter phenomenon is induced by kynurenine and its derivatives, which means that these metabolites are possible mediators of inhibitory DCs. As shown in our experiments activated T cells are more susceptible to the cytotoxic action of kynurenine metabolites than resting cells. At high concentrations and longer exposure times, however, both activated and nonactivated T cells die. Translated to allogeneic T cell stimulation, that means that donor-specific (activated) clones die, whereas other (resting) clones are not (or less) harmed when exposed to kynurenine derivatives. Our restimulation experiments support this conclusion. The observation concerning induction of T cell death by kynurenine is in line with previous findings on the cytotoxic action of tryptophan metabolites on nerve cells. These compounds are known to be increased in the central nervous system in certain neurological diseases (33, 38, 39). In a recent publication, Chiarugi et al. (33) describe the induction of cell death in cortical neurons by 3-hydroxykynurenine and quinolinic acid, whereby the former apparently induces apoptosis and the latter necrosis. Quinolinic acid has also been considered a possible mediator of neurological dysfunction in AIDS (40). Surprisingly, our experiments show that only 3-hydroxykynurenine but not quinolinic acid induces death of lymphocytes.
If functional in vivo, the mechanism delineated by our findings might have far reaching consequences for immunoregulation and for the pathogenesis of certain diseases. As already mentioned, IDO is involved in suppression of fetal rejection and possibly in control of autoreactive T cells (3, 14, 15, 25). According to our observations, this suppression might be mediated by tryptophan metabolites which result from increased IDO activity. Consequently, high levels of such metabolites in the fetal-maternal interface may constitute a “gateway to inferno” which sentences to death all T cells which pass through. Interestingly, our findings show that not only T cells but also B and NK cells are affected. In contrast, DCs, the cells which produce IDO, are resistant to tryptophan metabolite cytotoxicity.
IDO-mediated suppression of the immune response obtains special relevance in patients with HIV infection. Selected strains of HIV-1 are capable of inducing IDO synthesis with subsequent tryptophan metabolism in human macrophages, a process apparently triggered by transient production of IFN-γ (41). In line with these observations are clinical studies showing that the concentration of serum kynurenine increases and that of tryptophan decreases with immune stimulation in HIV-infected patients, resulting in a high kynurenine/tryptophan ratio. Most importantly, this ratio shows a reciprocal relationship to the CD4 count and the stage of the disease (42). In the light of our findings, it is tempting to speculate that tryptophan metabolites induce T cell death and thus contribute to the immunsosuppression observed in HIV-infected patients.
If the immune system “uses” IDO-producing DCs for suppression of “unwanted” immune reactions, the same strategy could be attempted for induction of tolerance in a transplant setting. It has already been shown that donor DC progenitors, when injected into the prospective transplant recipient, prolong graft survival, conceivably by inactivating donor-reactive T cells (43, 44). Our study points out a way for deliberately generating “suppressive” donor DCs which can be used for tolerance induction in transplant recipients. Conceivable alternatives would be the direct expression of the IDO-gene in the graft or the use of tryptophan metabolites as immunosuppressive agents. The latter therapeutic strategy is particularly interesting in the light of our observation that tryptophan metabolites preferentially kill activated T cells, the cells which mediate graft rejection.
In conclusion, our experiments show that DCs which transgenetically express IDO are able to lower the tryptophan concentration, increase the kynurenine concentration, and suppress the allogeneic T cell response. The tryptophan metabolites kynurenine, 3-hydroxykynurenine, and 3-hydroxyanthranilic acid inhibit T cell proliferation by a time-dependent cytotoxic action, an effect which concerns mainly activated T cells, but also B and NK cells.
Acknowledgments
Human IDO cDNA was provided by Dr. Osamu Takikawa, Department of Pharmacology, School of Medicine, Hokkaido University, Sapporo, Japan. The expert technical assistance of Christiane Christ is gratefully acknowledged. The 911 cell line was provided by IntroGene B.V., 2333 AL Leiden, The Netherlands.
This work was supported by the Roche Organ Transplantation Research Foundation.
P. Terness and T.M. Bauer contributed equally to this work.
L. Röse's present address is Max Planck Institute for Infection Biology, 10117 Berlin, Germany.
C. Dufter and A. Watzlik's present address is Becton Dickinson GmbH, 69126 Heidelberg, Germany.
Footnotes
Abbreviations used in this paper: 7-AAD, 7 amino actinomycin D; DC, dendritic cell; IDO, indoleamine 2,3-dioxygenase; MOI, multiplicity of infection.
References
- 1.Yoshida, R., T. Nukiwa, Y. Watanabe, M. Fujiwara, F. Hirata, and O. Hayashi. 1980. Regulation of indoleamine 2,3-dioxygenase activity in the small intestine and the epididymis of mice. Arch. Biochem. Biophys. 203:343–351. [DOI] [PubMed] [Google Scholar]
- 2.Taylor, M.W., and G. Feng. 1991. Relationship between interferon-γ, indoleamine 2,3-dioxygenase, and tryptophan catabolism. FASEB J. 5:2516–2522. [PubMed] [Google Scholar]
- 3.Mellor, A.L., and D.H. Munn. 1999. Tryptophan catabolism and T-cell tolerance: immunosuppression by starvation? Immunol. Today. 20:469–473. [DOI] [PubMed] [Google Scholar]
- 4.Yoshida, R., Y. Urade, M. Tokuda, and O. Hayashi. 1979. Induction of indoleamine 2,3 dioxygenase in mouse lung during virus infection. Proc. Natl. Acad. Sci. USA. 76:4084–4086. [DOI] [PMC free article] [PubMed] [Google Scholar]
- 5.Yoshida, R., and O. Hayashi. 1978. Induction of pulmonary indoleamine 2,3-dioxygenase by intraperitoneal injection of bacterial lipopolysaccharide. Proc. Natl. Acad. Sci. USA. 75:3998–4000. [DOI] [PMC free article] [PubMed] [Google Scholar]
- 6.Carlin, J.M., E.C. Borden, P.M. Sondel, and G.I. Byrne. 1987. Biological-response-modifier-induced indoleamine 2,3- dioxygenase activity in human peripheral blood mononuclear cell cultures. J. Immunol. 139:2414–2418. [PubMed] [Google Scholar]
- 7.Bianchi, M., R. Bertini, and P. Ghezzi. 1988. Induction of indoleamine dioxygenase by interferon in mice: a study with different recombinant interferons and various cytokines. Biochem. Biophys. Res. Commun. 152:237–242. [DOI] [PubMed] [Google Scholar]
- 8.Bodaghi, B., O. Goureau, D. Zipeto, L. Laurent, J.L. Virelizier, and S. Michelson. 1999. Role of IFN-γ-induced indoleamine 2,3 dioxygenase and inducible nitric oxide synthase in the replication of human cytomegalovirus in retinal pigment epithelial cells. J. Immunol. 162:957–964. [PubMed] [Google Scholar]
- 9.Pfefferkorn, E.R. 1984. Interferon-γ blocks the growth of Toxoplasma gondii in human fibroblasts by inducing the host cells to degrade tryptophan. Proc. Natl. Acad. Sci. USA. 81:908–912. [DOI] [PMC free article] [PubMed] [Google Scholar]
- 10.Nagineni, C.N., K. Pardhasaradhi, M.C. Martins, B. Detrick, and J.J. Hooks. 1996. Mechanisms of interferon-induced inhibition of Toxoplasma gondii replication in human retinal pigment epithelial cells. Infect. Immun. 64:4188–4196. [DOI] [PMC free article] [PubMed] [Google Scholar]
- 11.Byrne, G.I., L.K. Lehmann, and G.J. Landry. 1986. Induction of tryptophan catabolism is the mechanism for gamma-interferon-mediated inhibition of intracellular Chlamydia psittaci replication in T24 cells. Infect. Immunol. 53:347–351. [DOI] [PMC free article] [PubMed] [Google Scholar]
- 12.de la Maza, L.M., and E.M. Peterson. 1988. Dependence of the in vitro antiproliferative activity of recombinant human γ-interferon on the concentration of tryptophan in culture media. Cancer Res. 48:346–350. [PubMed] [Google Scholar]
- 13.Aune, T.M., and S.L. Pogue. 1989. Inhibition of tumor cell growth by interferon-γ is mediated by two distinct mechanisms dependent upon oxygen tension: induction of tryptophan degradation and depletion of intracellular nicotin-amide adenine dinucleotide. J. Clin. Invest. 84:863–875. [DOI] [PMC free article] [PubMed] [Google Scholar]
- 14.Munn, D.H., E. Shafizadeh, J.T. Attwood, I. Bondarev, A. Pashine, and A.L. Mellor. 1999. Inhibition of T cell proliferation by macrophage tryptophan catabolism. J. Exp. Med. 189:1363–1372. [DOI] [PMC free article] [PubMed] [Google Scholar]
- 15.Munn, D.H., M. Zhou, J.T. Attwood, I. Bondarev, S.J. Conway, B. Marshall, C. Brown, and A.L. Mellor. 1998. Prevention of allogeneic fetal rejection by tryptophan catabolism. Science. 281:1191–1193. [DOI] [PubMed] [Google Scholar]
- 16.Kamimura, S., K. Eguchi, M. Yonezawa, and K. Sekiba. 1991. Localization and developmental change of indoleamine 2,3-dioxygenase activity in the human placenta. Acta Med. Okayama. 45:135–139. [DOI] [PubMed] [Google Scholar]
- 17.He, T.C., S. Zhou, L.T. da Costa, J. Yu, K.W. Kinzler, and B. Vogelstein. 1998. A simplified system for generating recombinant adenoviruses. Proc. Natl. Acad. Sci. USA. 95:2509–2514. [DOI] [PMC free article] [PubMed] [Google Scholar]
- 18.Schuler, G., and N. Romani. 1997. Generation of mature dendritic cells from human blood. An improved method with special regard to clinical applicability. Adv. Exp. Med. Biol. 417:7–13. [PubMed] [Google Scholar]
- 19.Takikawa, O., T. Kuroiwa, F. Yamazaki, R. Kido. 1988. Mechanism of interferon-γ action: Characterization of indoleamine 2,3-dioxygenase in cultured human cells by interferon-γ and evaluation of the enzyme-mediated tryptophan degradation in its anticellular activity. J. Biol. Chem. 263:2041–2048. [PubMed] [Google Scholar]
- 20.Watzlik, A., C. Dufter, M. Jung, G. Opelz, and P. Terness. 2000. Fas ligand gene-carrying adeno-5 AdEasy viruses can be efficiently propagated in apoptosis-sensitive human embryonic retinoblast 911 cells. Gene Ther. 7:70–74. [DOI] [PubMed] [Google Scholar]
- 21.Werner, E.R., B. Bitterlich, D. Fuchs, A. Hausen, G. Reibnegger, G. Szabo, M.P. Dierich, and H. Wachter. 1987. Human macrophages degrade tryptophan upon induction by interferon-γ. Life Sci. 41:273–280. [DOI] [PubMed] [Google Scholar]
- 22.Widner, B., and D. Fuchs. 2000. Immune activation and degradation of tryptophan. Mod. Asp. Immunobiol. 1:105–108. [Google Scholar]
- 23.Yamamoto, S., and O. Hayashi. 1967. Tryptophan pyrrolase of rabbit intestine: D- and l-tryptophan-cleaving enzyme or enzymes. J. Biol. Chem. 242:5260–5266. [PubMed] [Google Scholar]
- 24.Moffett, J.R., M.G. Espey, and M.A. Namboodiri. 1994. Antibodies to quinolinic acid and the determination of its cellular distribution within the rat immune system. Cell Tissue Res. 278:461–469. [DOI] [PubMed] [Google Scholar]
- 25.Hwu, P., M.X. Du, R. Lapointe, M. Do, M.W. Taylor, and H.A. Young. 2000. Indoleamine 2,3-dioxygenase production by human dendritic cells results in inhibition of T cell proliferation. J. Immunol. 164:3596–3599. [DOI] [PubMed] [Google Scholar]
- 26.Banchereau, J., and R.M. Steinman. 1998. Dendritic cells and the control of immunity. Nature. 392:245–252. [DOI] [PubMed] [Google Scholar]
- 27.Grohmann, U., R. Bianchi, M.L. Belladonna, S. Silla, F. Fallarino, M.C. Fioretti, and P. Puccetti. 2000. IFN-γ inhibits presentation of a tumor/self peptide by CD8α− dendritic cells via potentiation of the CD8α+ subset. J. Immunol. 165:1357–1363. [DOI] [PubMed] [Google Scholar]
- 28.Schrocksnadel, H., G. Baier-Bitterlich, O. Dapunt, H. Wachter, and D. Fuchs. 1996. Decreased plasma tryptophan in pregnancy. Obstet. Gynecol. 88:47–50. [DOI] [PubMed] [Google Scholar]
- 29.Grohmann, U., F. Fallarino, R. Bianchi, M.L. Belladonna, C. Vacca, C. Orabona, C. Uyttenhove, M.C. Fioretti, and P. Puccetti. 2001. IL-6 inhibits the tolerogenic function of CD8α+ dendritic cells expressing indoleamine 2,3-dioxygenase. J. Immunol. 167:708–714. [DOI] [PubMed] [Google Scholar]
- 30.Heyes, M.P., K. Saito, A. Lackner, C.A. Wiley, C.L. Achim, and S.P. Markey. 1998. Sources of the neurotoxin quinolinic acid in the brain of HIV-1-infected patients and retrovirus-infected macaques. FASEB J. 12:881–896. [DOI] [PubMed] [Google Scholar]
- 31.Brown, R.R., Y. Ozaki, S.P. Datta, E.C. Borden, P.M. Sondel, and D.G. Malone. 1991. Implications of interferon-induced tryptophan catabolism in cancer, auto-immune diseases and AIDS. Adv. Exp. Med. Biol. 294:425–435. [DOI] [PubMed] [Google Scholar]
- 32.Nicholls, T., I. Nitsos, and D.W. Walker. 1999. Tryptophan metabolism in pregnant sheep: increased fetal kynurenine production in response to maternal tryptophan loading. Am. J. Obstet. Gynecol. 181:1452–1460. [DOI] [PubMed] [Google Scholar]
- 33.Chiarugi, A., E. Meli, and F. Moroni. 2001. Similarities and differences in the neuronal death processes activated by 3OH-kynurenine and quinolinic acid. J. Neurochem. 77:1310–1318. [DOI] [PubMed] [Google Scholar]
- 34.Guidetti, P., and R. Schwarcz. 1999. 3-hydroxykynurenine potentiates quinolinate but not NMDA toxicity in the rat striatum. Eur. J. Neurosci. 11:3857–3863. [DOI] [PubMed] [Google Scholar]
- 35.Munn, D.H., J. Pressey, A.C. Beall, R. Hudes, and M.R. Alderson. 1996. Selective activation-induced apoptosis of peripheral T cells imposed by macrophages. A potential mechanism of antigen-specific peripheral lymphocyte deletion. J. Immunol. 156:523–532. [PubMed] [Google Scholar]
- 36.Bianchi, R., U. Grohmann, C. Vacca, M.L. Belladonna, M.C. Fioretti, and P. Puccetti. 1999. Autocrine IL-12 is involved in dendritic cell modulation via CD40 ligation. J. Immunol. 163:2517–2521. [PubMed] [Google Scholar]
- 37.Grohmann, U., F. Fallarino, S. Silla, R. Bianchi, M.L. Belladonna, C. Vacca, A. Micheletti, M.C. Fioretti, and P. Puccetti. 2001. CD40 ligation ablates the tolerogenic potential of lymphoid dendritic cells. J. Immunol. 166:277–283. [DOI] [PubMed] [Google Scholar]
- 38.Wei, H., P. Leeds, R.W. Chen, W. Wei, Y. Leng, D.E. Bredesen, and D.M. Chuang. 2000. Neuronal apoptosis induced by pharmacological concentrations of 3-hydroxykynurenine: characterization and protection by dantrolene and Bcl-2 overexpression. J. Neurochem. 75:81–90. [DOI] [PubMed] [Google Scholar]
- 39.Okuda, S., N. Nishiyama, H. Saito, and H. Katsuki. 1998. 3-hydroxykynurenine, an endogenous oxidative stress generator, causes neuronal cell death with apoptotic features and region selectivity. J. Neurochem. 70:299–307. [DOI] [PubMed] [Google Scholar]
- 40.Heyes, M.P., B.J. Brew, A. Martin, R.W. Price, A.M. Salazar, J.J. Sidtis, J.A. Yergey, M.M. Mouradian, A.E. Sadler, J. Keilp, et al. 1991. Quinolinic acid in cerebrospinal fluid and serum in HIV-1 infection: relationship to clinical and neurological status. Ann. Neurol. 29:202–209. [DOI] [PubMed] [Google Scholar]
- 41.Grant, R.S., H. Naif, S.J. Thuruthyil, N. Nasr, T. Littlejohn, O. Takikawa, and V. Kapoor. 2000. Induction of indoleamine 2,3-dioxygenase in primary human macrophages by human immunodeficiency virus type 1 is strain dependent. J. Virol. 74:4110–4115. [DOI] [PMC free article] [PubMed] [Google Scholar]
- 42.Huengsberg, M., J.B. Winer, M. Gompels, R. Round, J. Ross, and M. Shahmanesh. 1998. Serum kynurenine-to-tryptophan ratio increases with progressive disease in HIV-infected patients. Clin. Chem. 44:858–862. [PubMed] [Google Scholar]
- 43.Fu, F., Y. Li, S. Qian, L. Lu, F.G. Chambers, T.E. Starzl, J.J. Fung, and A.W. Thomson. 1996. Costimulatory molecule-deficient dendritic cell progenitors (MHC class II+, B7-1dim, B7-2−) prolong cardiac allograft survival in non-immunosuppressed recipients. Transplantation. 62:659–665. [DOI] [PMC free article] [PubMed] [Google Scholar]
- 44.Rastellini, C., L. Lu, C. Ricordi, T.E. Starzl, A.S. Rao, and A.W. Thomson. 1995. GM-CSF stimulated hepatic dendritic cell progenitors prolong pancreatic islet allograft survival. Transplantation. 60:1366–1370. [PMC free article] [PubMed] [Google Scholar]


